Structural features of heteromeric channels composed of CALHM2 and CALHM4 paralogs
- Department of Biochemistry, University of Zurich, Switzerland
Figures
Figure 1 with 1 supplement
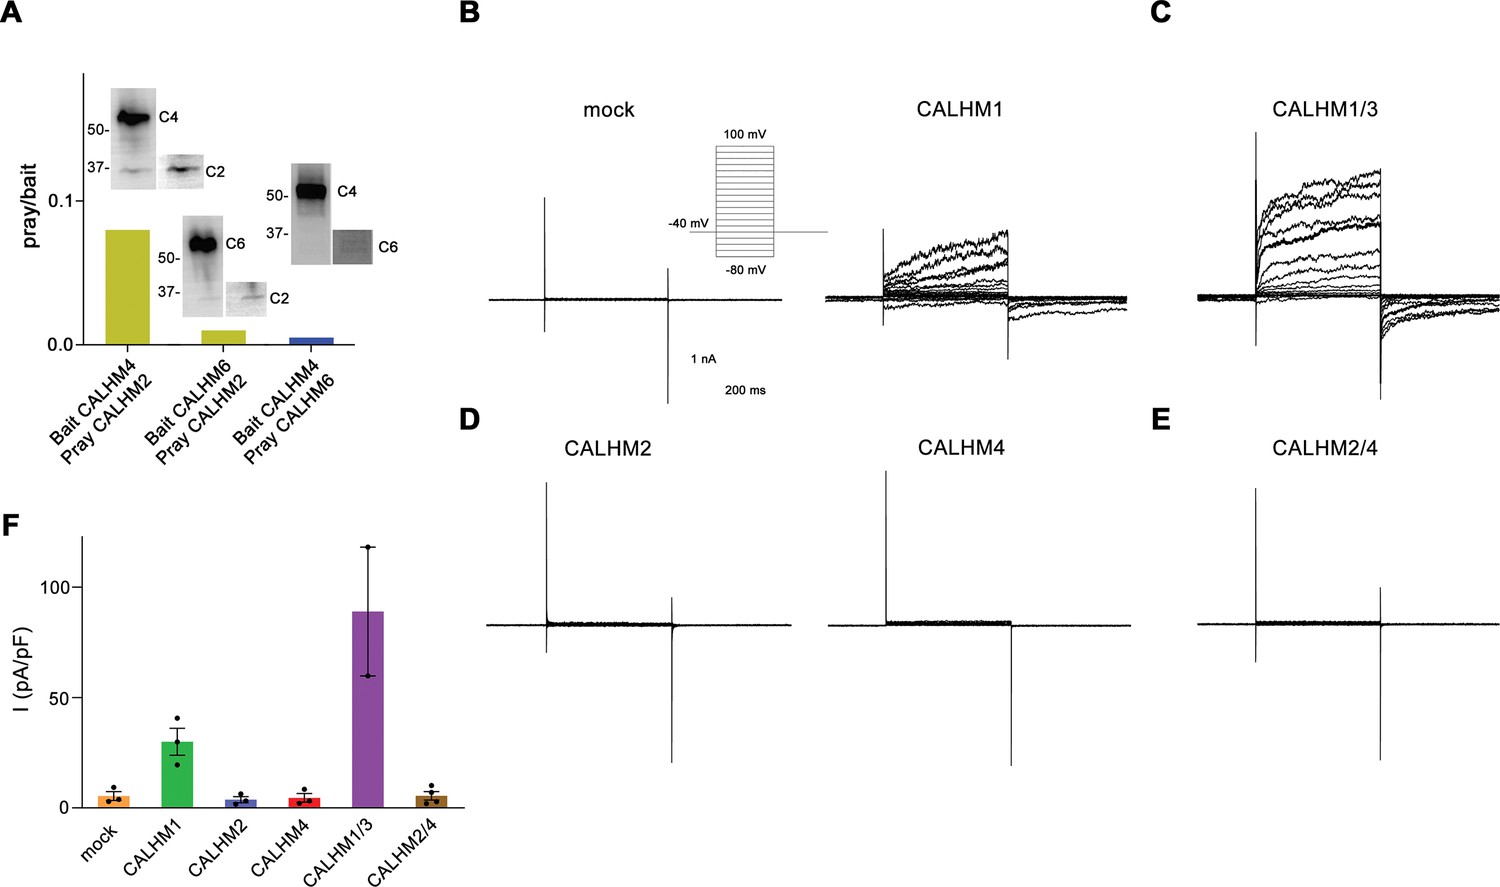
Heteromerization and functional properties of placental calcium homeostasis modulators (CALHM) paralogs.
(A) Western blot (detecting the myc-tag attached to the C-termini of respective constructs) of CALHM subunits expressed upon co-transfection of HEK293S GnTI− cells with pairs of CALHM subunits. CALHM channels were isolated by affinity purification of one subunit containing a fusion to Venus and an SBP-tag (bait, shown at higher molecular weight). The resulting samples contain a mix of homomers of the purified subunit and heteromers (with the second subunit not containing Venus and SBP tags, prey at lower molecular weight). The ratio of pray/bait is displayed based on the integration of the intensity of the displayed Western blots. The experiment has been carried out once. Molecular weights are indicated. (B–E) Representative patch-clamp electrophysiology recordings (whole-cell configuration) of indicated CALHM subunits expressed in HEK-293 cells measured in buffers containing 2 mM Ca2+ on the extracellular side. (B) Comparison of currents from mock-transfected cells (left) and cells expressing CALHM1 (right). The inset shows the voltage protocol. (C) Current response from cells co-transfected with DNA coding for CALHM1 and CALHM3 subunits. (D) Current response from cells transfected with CALHM2 (left) or CALHM4 (right) subunits. (E) Current response from cells co-transfected with CALHM2 and CALHM4 subunits. (F) Mean current density of recordings of different CALHM constructs (measured at 100 mV, 400 ms after the voltage step), errors are SEM for n>2 and differences from the mean in case of n=2, values from individual recordings are shown as circles.
-
Figure 1—source data 1
Uncropped images of immunoblots and raw data plotted in Figure 1A.
- https://cdn.elifesciences.org/articles/96138/elife-96138-fig1-data1-v1.xlsx
-
Figure 1—source data 2
Raw recordings displayed and plotted in Figure 1B–F.
- https://cdn.elifesciences.org/articles/96138/elife-96138-fig1-data2-v1.xlsx
Figure 1—figure supplement 1
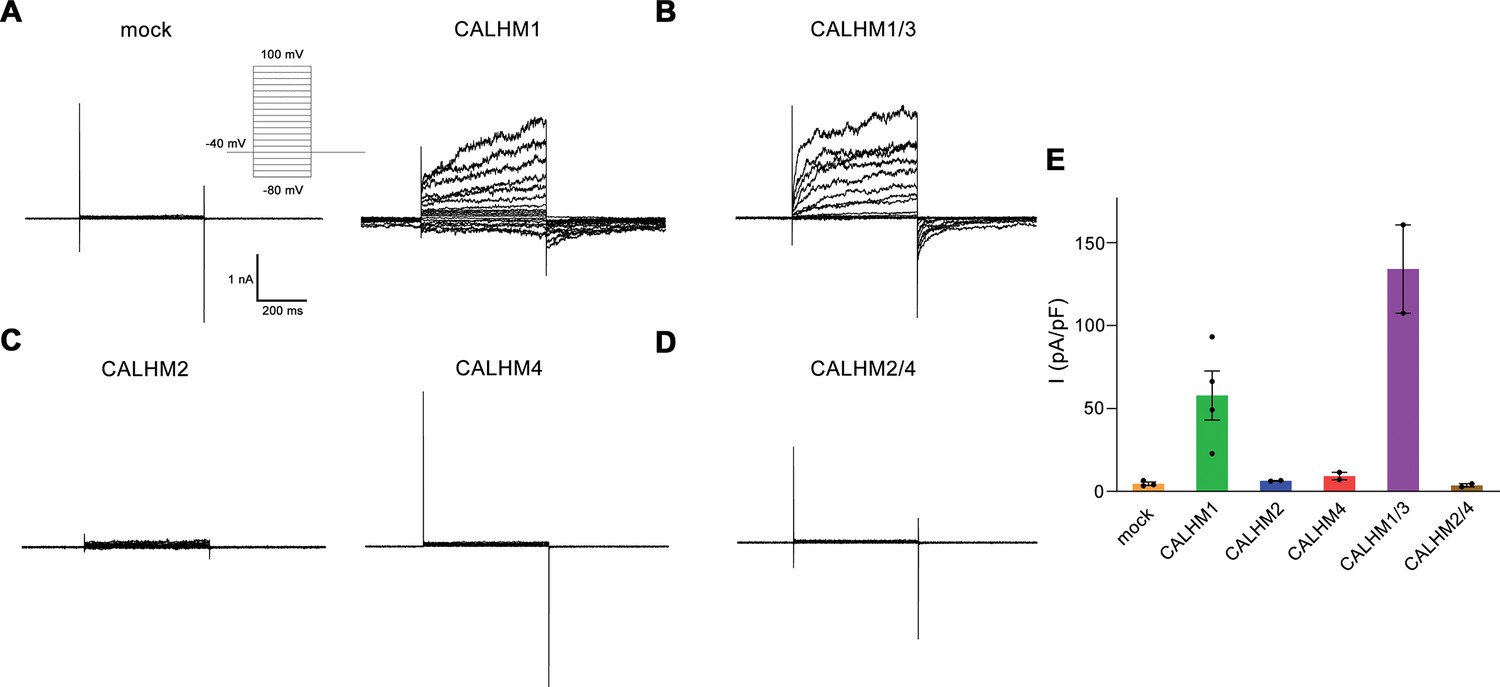
Electrophysiology data of calcium homeostasis modulators (CALHM) paralogs recorded at low extracellular Ca2+.
(A–D) Patch clamp electrophysiology recordings (whole-cell configuration) of representative traces of indicated CALHM subunits expressed in HEK-293 cells measured in buffers not containing Ca2+ on the extracellular side. (A) Comparison of currents from mock-transfected cells (left) and cells expressing CALHM1 (right). The inset shows the voltage protocol. (B) Current response from cells co-transfected with DNA coding for CALHM1 and CALHM3 subunits. (C) Current response from cells transfected with CALHM2 (left) or CALHM4 (right) subunits. (D) Current response from cells co-transfected with CALHM2 and CALHM4 subunits. (E) Mean current density of recordings of different CALHM constructs (measured at 100 mV, 400 ms after voltage step), errors are SEM for n>2, and differences from the mean in case of n=2, values from individual recordings are shown as circles.
-
Figure 1—figure supplement 1—source data 1
Raw recordings displayed and plotted in Figure 1—figure supplement 1.
- https://cdn.elifesciences.org/articles/96138/elife-96138-fig1-figsupp1-data1-v1.xlsx
Figure 2 with 2 supplements
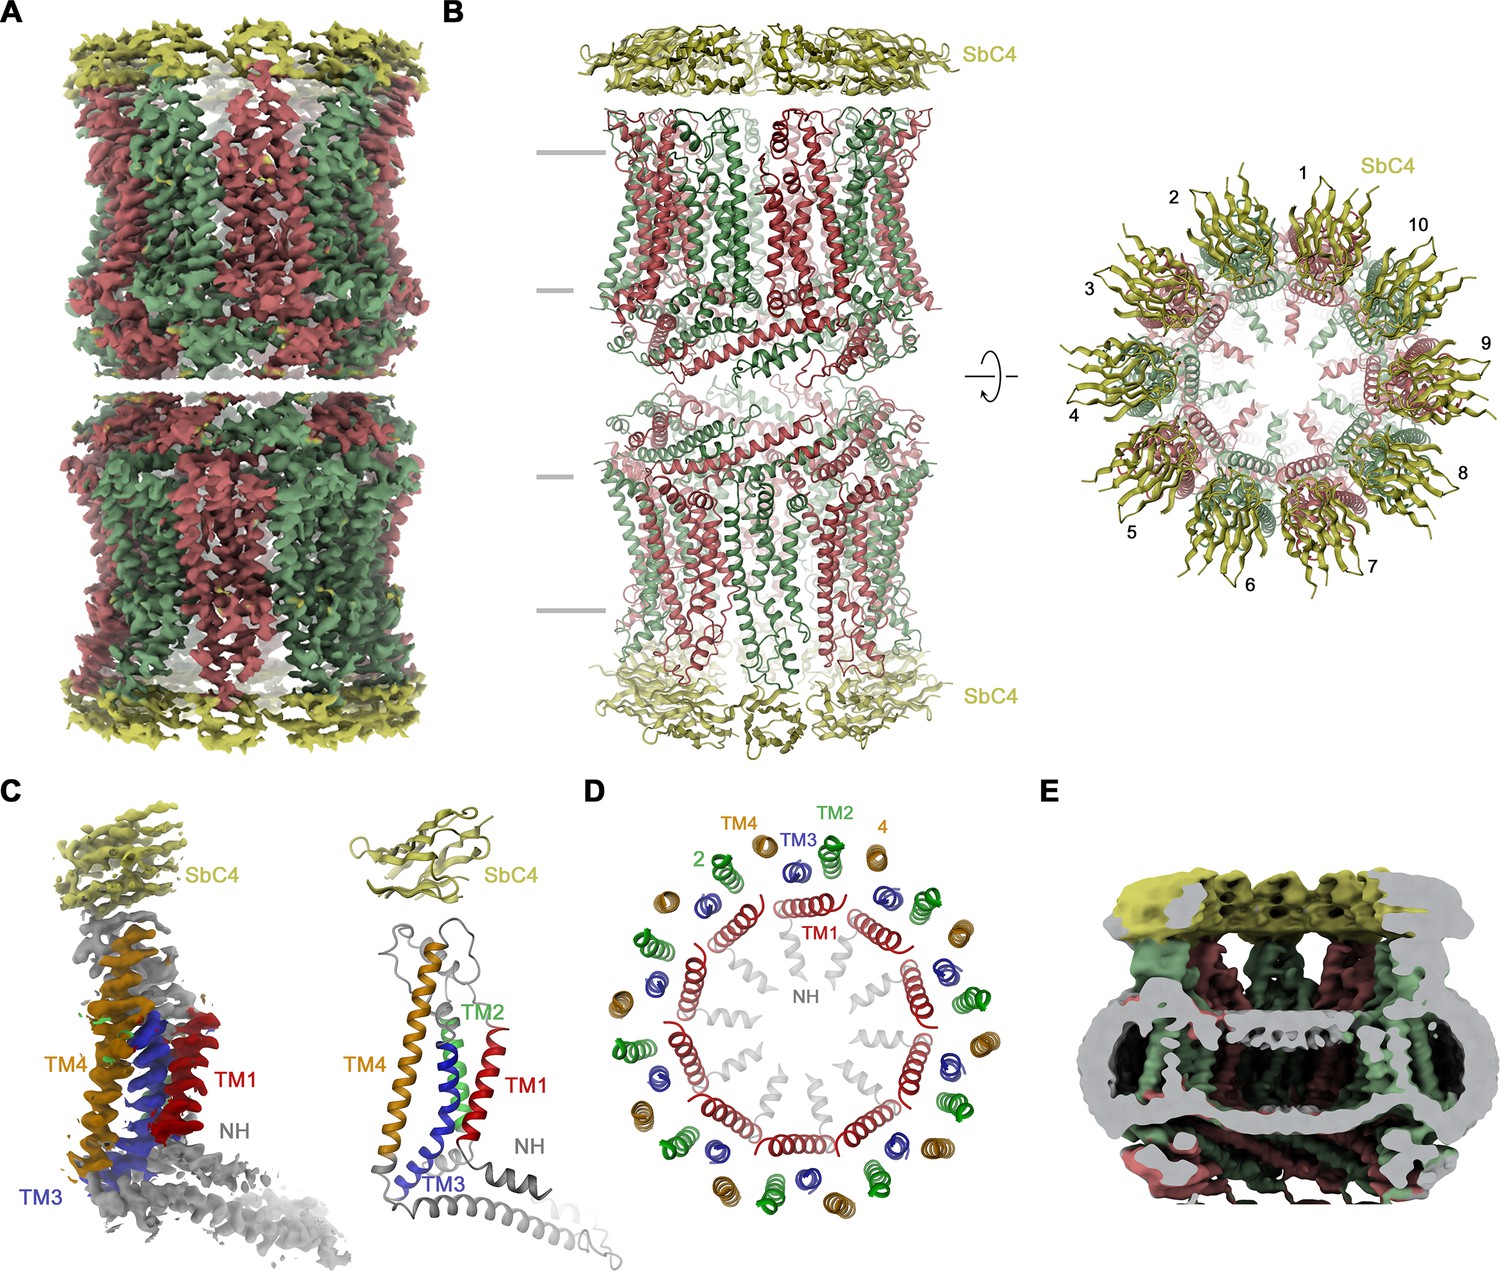
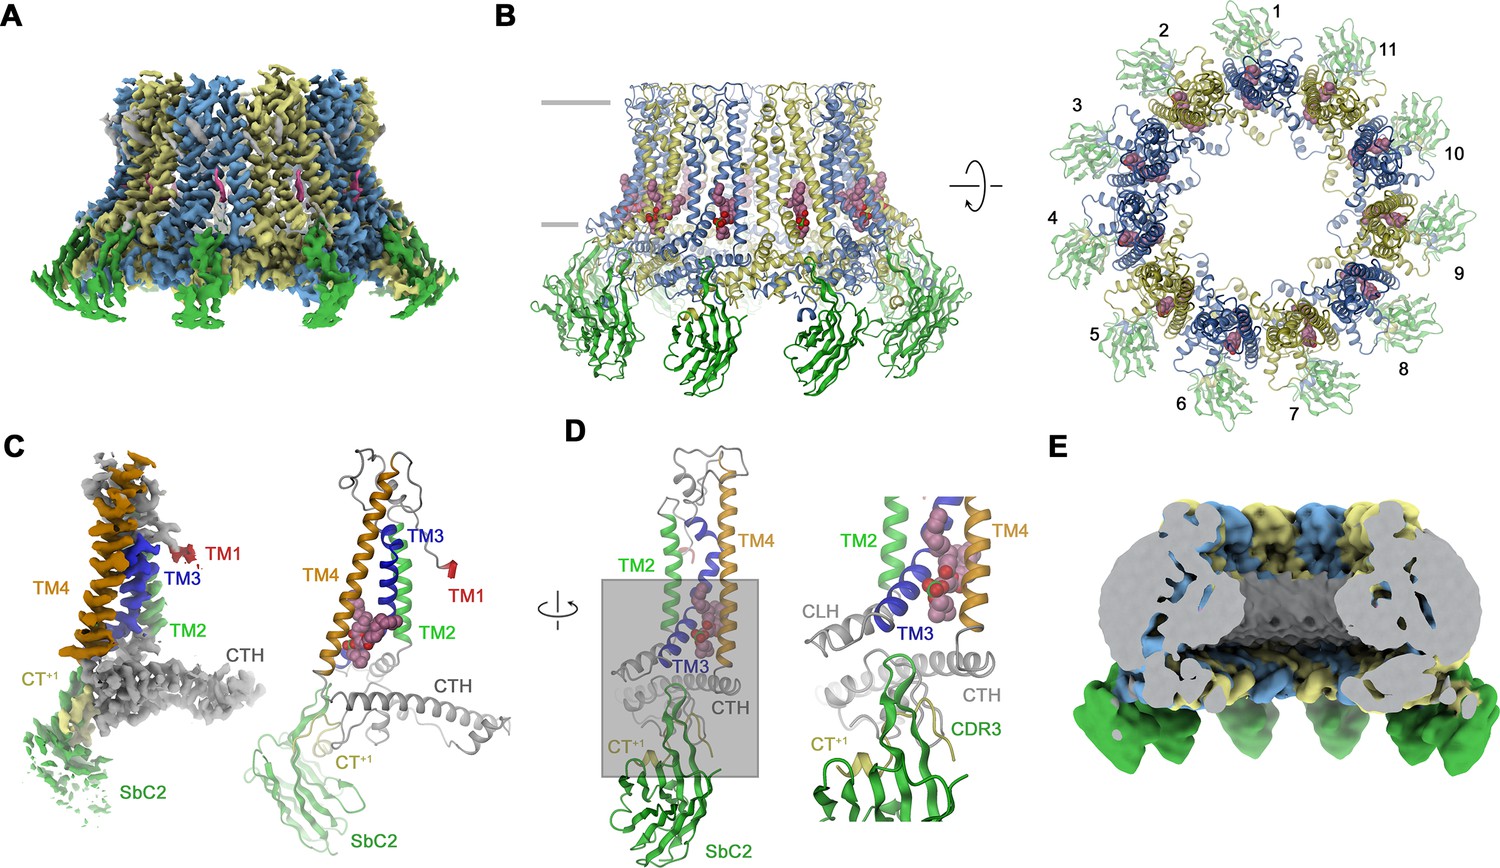
Structural characterization of the CALHM4/SbC4 complex.
(A) Cryo-electron microscopy (Cryo-EM) density at 3.7 Å (after application of D10 symmetry) of a pair of decameric CALHM4/SbC4 complexes interacting via their cytoplasmic regions. (B) Ribbon representation of the same complex viewed parallel (left) and perpendicular (right) to the membrane plane. Membrane boundaries are indicated (left). (A, B), CALHM4 subunits are colored in red and green, SbC4 in yellow. (C) Cryo-EM density (left) and ribbon representation (right) of a single subunit of the CALHM4/SbC4 complex. Transmembrane helices are labeled and shown in unique colors. (D) Organization of transmembrane (TM) helices in the decameric channel. The view is from the extracellular side, the coloring is as in C. (E) Slab through a low-pass filtered map of the CALHM4/SbC4 complex (viewed from within the membrane) shows bilayer-like density in the lumen of the wide pore.
Figure 2—figure supplement 1
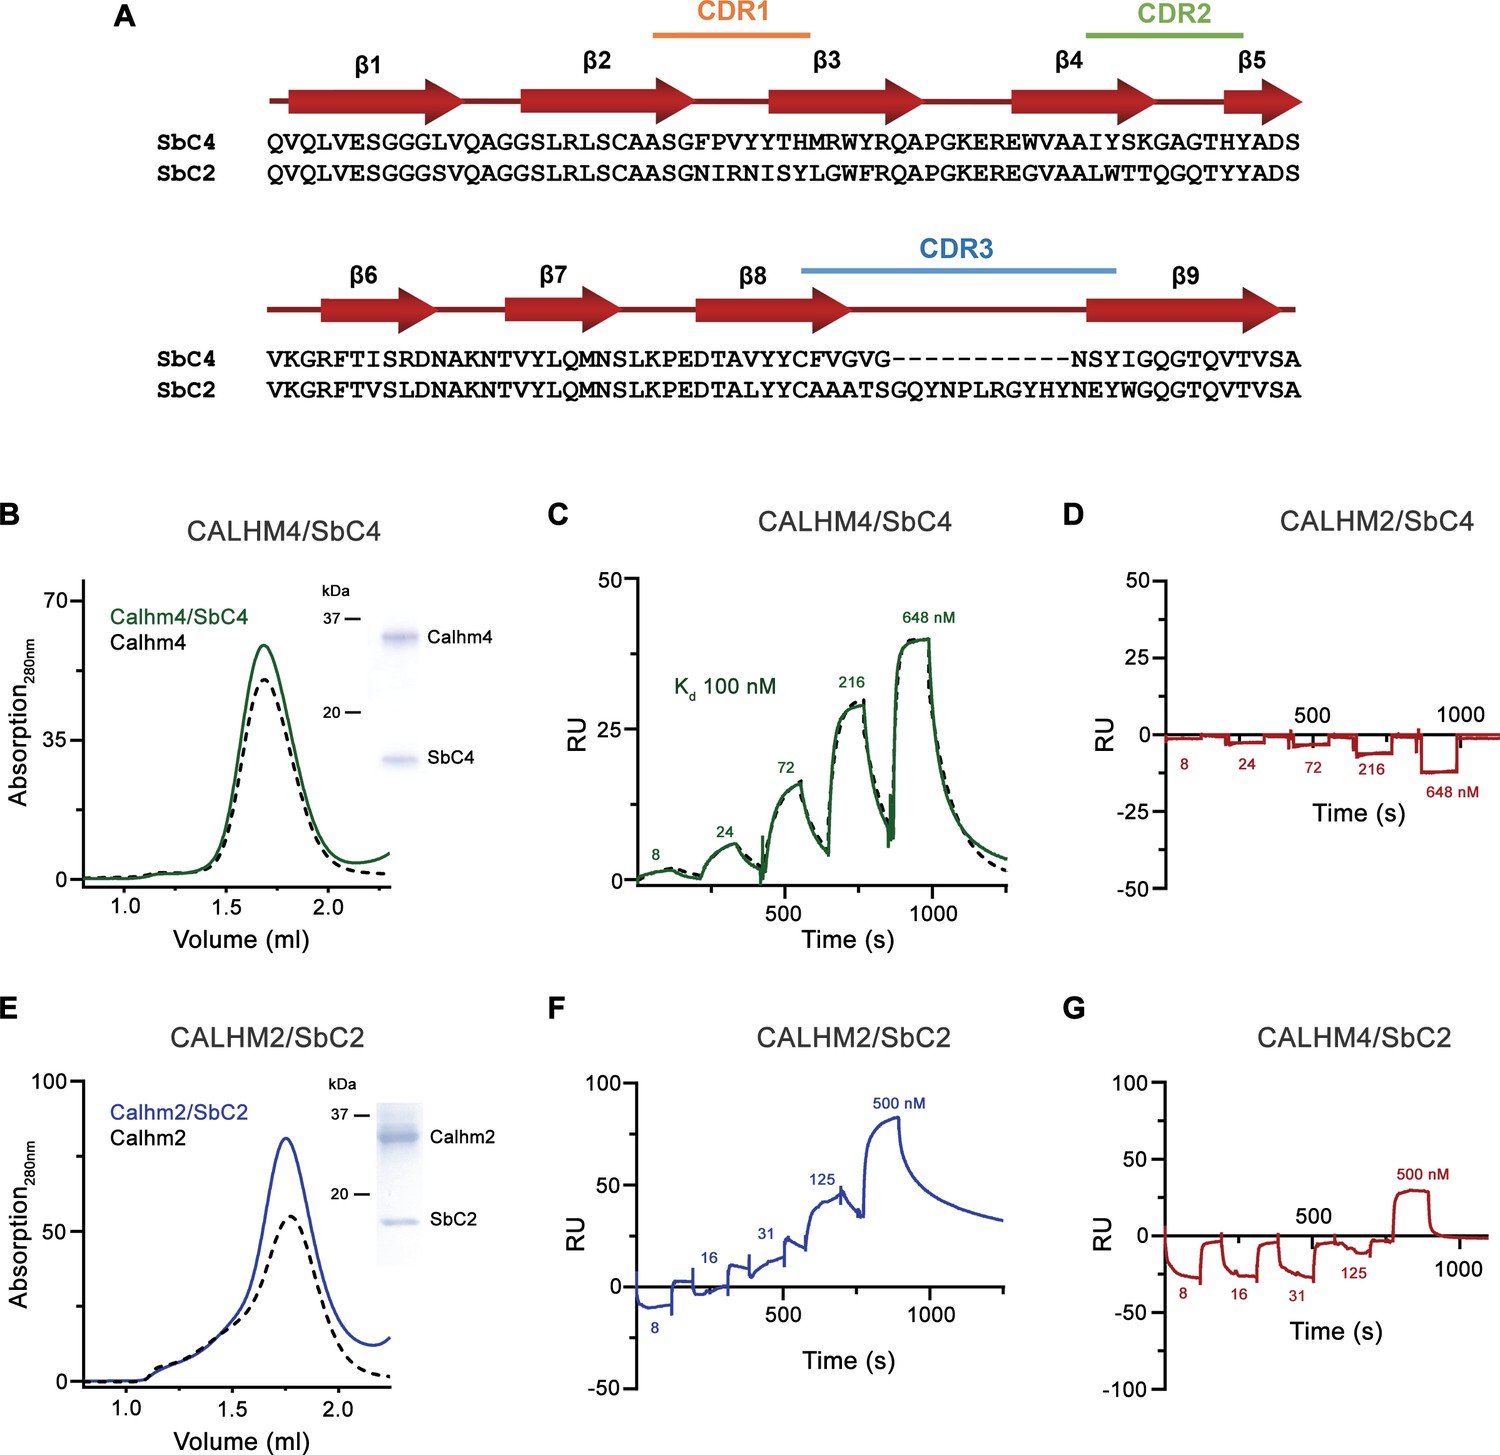
Sybody selection and characterization.
(A) Sequence alignment of the two sybodies SbC4 and SbC2 specifically targeting CALHM4 and CALHM2, respectively. (B) Size exclusion chromatography profile of the CALHM4/SbC4 complex. The elution peak of the equivalent amount of CALHM4 is displayed as a dashed line in comparison. The inset (right) shows SDS-PAGE gel of the peak fraction. SPR experiments of SbC4 binding to immobilized CALHM4 illustrating specific binding (C) and to CALHM2 not showing specific interactions (D). Dashed line in D corresponds to a fit to a 1:1 binding model yielding a Kd of 100 nM. (E) Size exclusion chromatography profile of the CALHM2/SbC2 complex. The elution peak of the equivalent amount of CALHM2 is displayed as the dashed line in comparison. The inset (right) shows SDS-PAGE gel of the peak fraction. Surface plasmon resonance (SPR) experiments of SbC2 binding to immobilized CALHM2 illustrating specific binding (F) and CALHM4 not showing specific interactions (G). B-G the experiments were carried out once.
-
Figure 2—figure supplement 1—source data 1
SDS-PAGE gel images and size-exclusion chromatography data plotted in Figure 2—figure supplement 1B, E.
- https://cdn.elifesciences.org/articles/96138/elife-96138-fig2-figsupp1-data1-v1.xlsx
-
Figure 2—figure supplement 1—source data 2
Surface plasmon resonance (SPR) binding data plotted in Figure 2—figure supplement 1C, D, F, G.
- https://cdn.elifesciences.org/articles/96138/elife-96138-fig2-figsupp1-data2-v1.xlsx
Figure 2—figure supplement 2
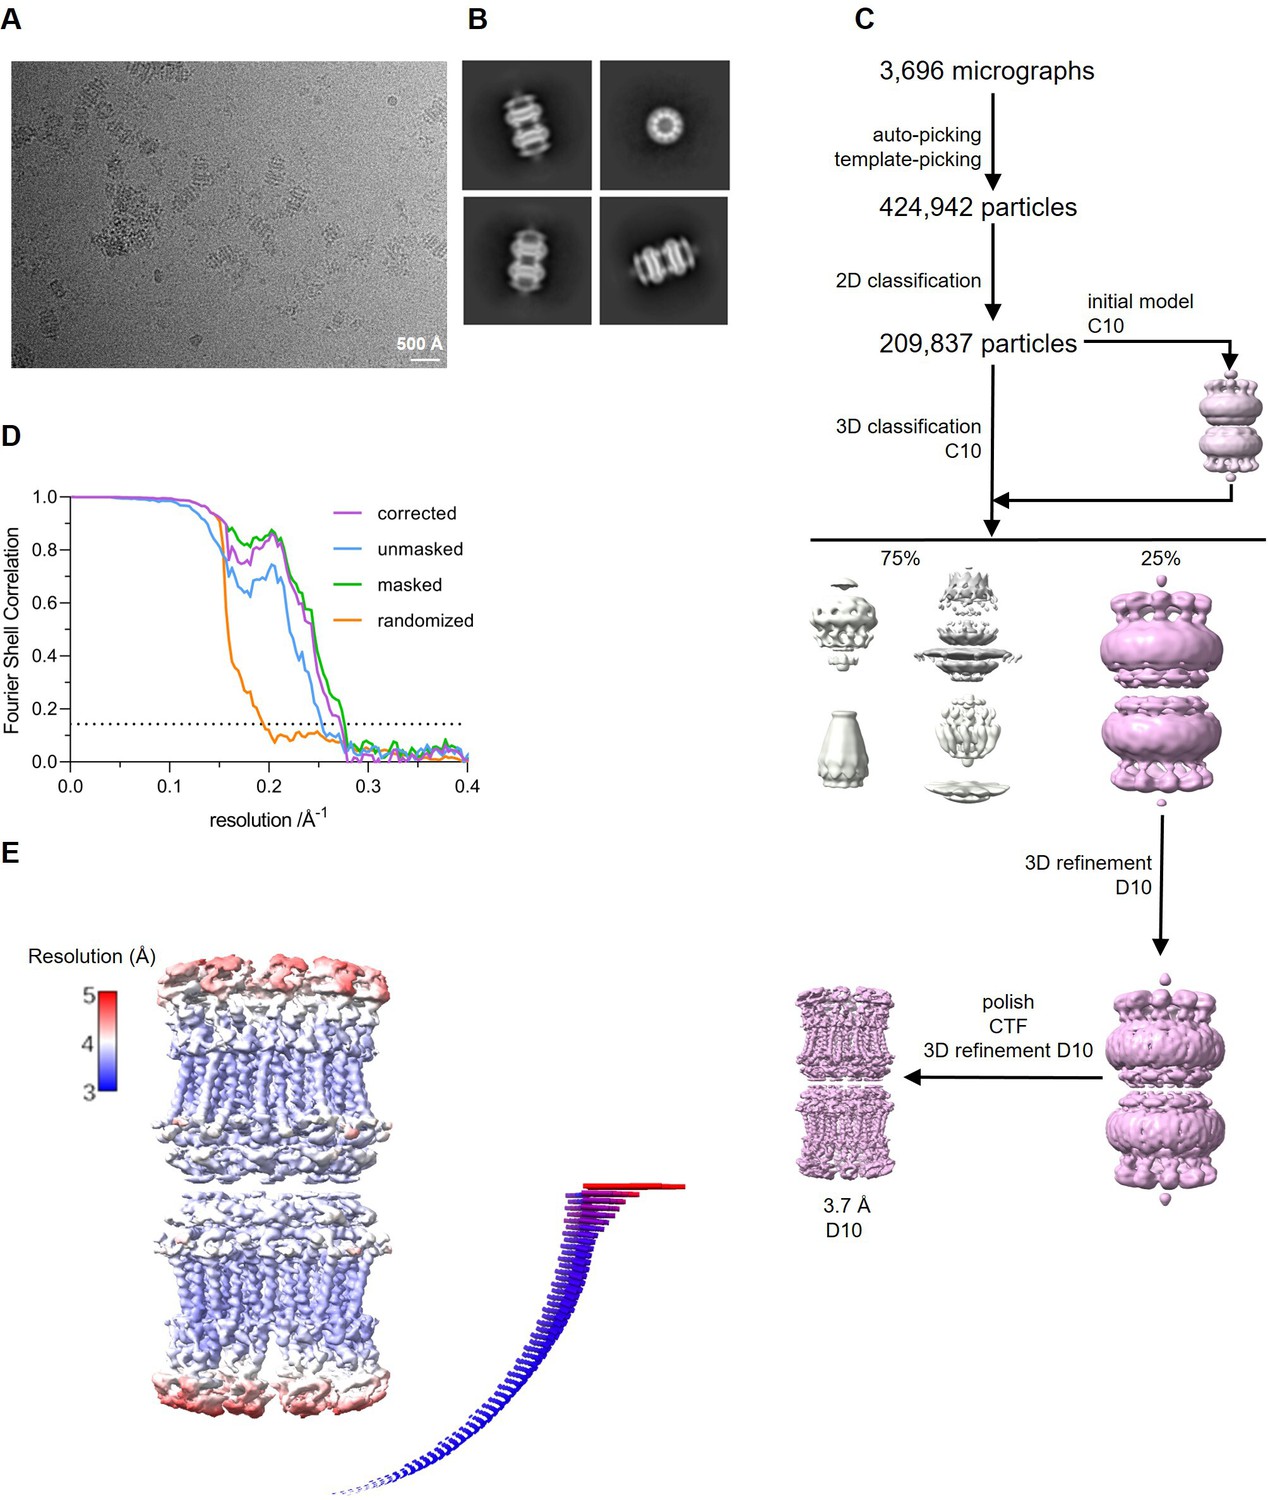
Cryo-electron microscopy (Cryo-EM) reconstruction of CALHM4 in complex with sybody SbC4.
(A) Representative cryo-EM micrograph acquired with a Titan Krios microscope equipped with a K3 camera. (B) Representative 2D class averages of the CALHM4/SbC4 complex. (C) Data processing workflow. Particles were picked and subjected to 2D classification. High-resolution 2D class averages were used as input for initial 3D model generation and subsequent 3D classification. The 3D classification allowed to isolate CALHM4/SbC4 particles, which were further refined with iterative polishing, and 3D and CTF refinements. The distribution of particles (%) of each class is indicated. (D) FSC plot of the final refined unmasked (blue), masked (green), randomized (orange), and corrected for mask convolution effects (purple) cryo-EM density map of the CALHM4/SbC4 complex. The resolution at which the fourier shell correlation (FSC) curve drops below the 0.143 threshold is indicated. (E) Final 3D reconstruction of CALHM4/SbC4 complex colored according to local resolution. The angular distribution of the particles included in the final reconstruction is indicated. Each cylinder represents one view and the height corresponds to the number of particles in that view.
Figure 3 with 1 supplement
Structural characterization of a CALHM2/SbC2 complex.
(A) Cryo-electron microscopy (Cryo-EM) density of the undecameric CALHM2/SbC2 complex at 3.1 Å (after application of C11 symmetry). (B) Ribbon representation of the same complex viewed parallel to the membrane plane (left) and from the extracellular side (right). Membrane boundaries are indicated (left). The space filling model shows a bound lipid. (A, B), CALHM2 subunits are colored in yellow and blue, SbC2 in green, and the bound lipid in magenta. (C) Cryo-EM density (left) and ribbon representation (right) of a single subunit of the CALHM2/SbC2 complex. Transmembrane helices are labeled and shown in unique colors. (D) Subunit (with orientation relative to C indicated) and blow-up of the sybody-interaction region. The C-terminus of the adjacent subunits contributing to the interaction epitope is colored in yellow and labeled (CT+1). (E) Slab through a low-pass filtered map of the CALHM2/SbC2 complex (viewed from within the membrane) does not show bilayer-like density in the lumen of the pore.
Figure 3—figure supplement 1
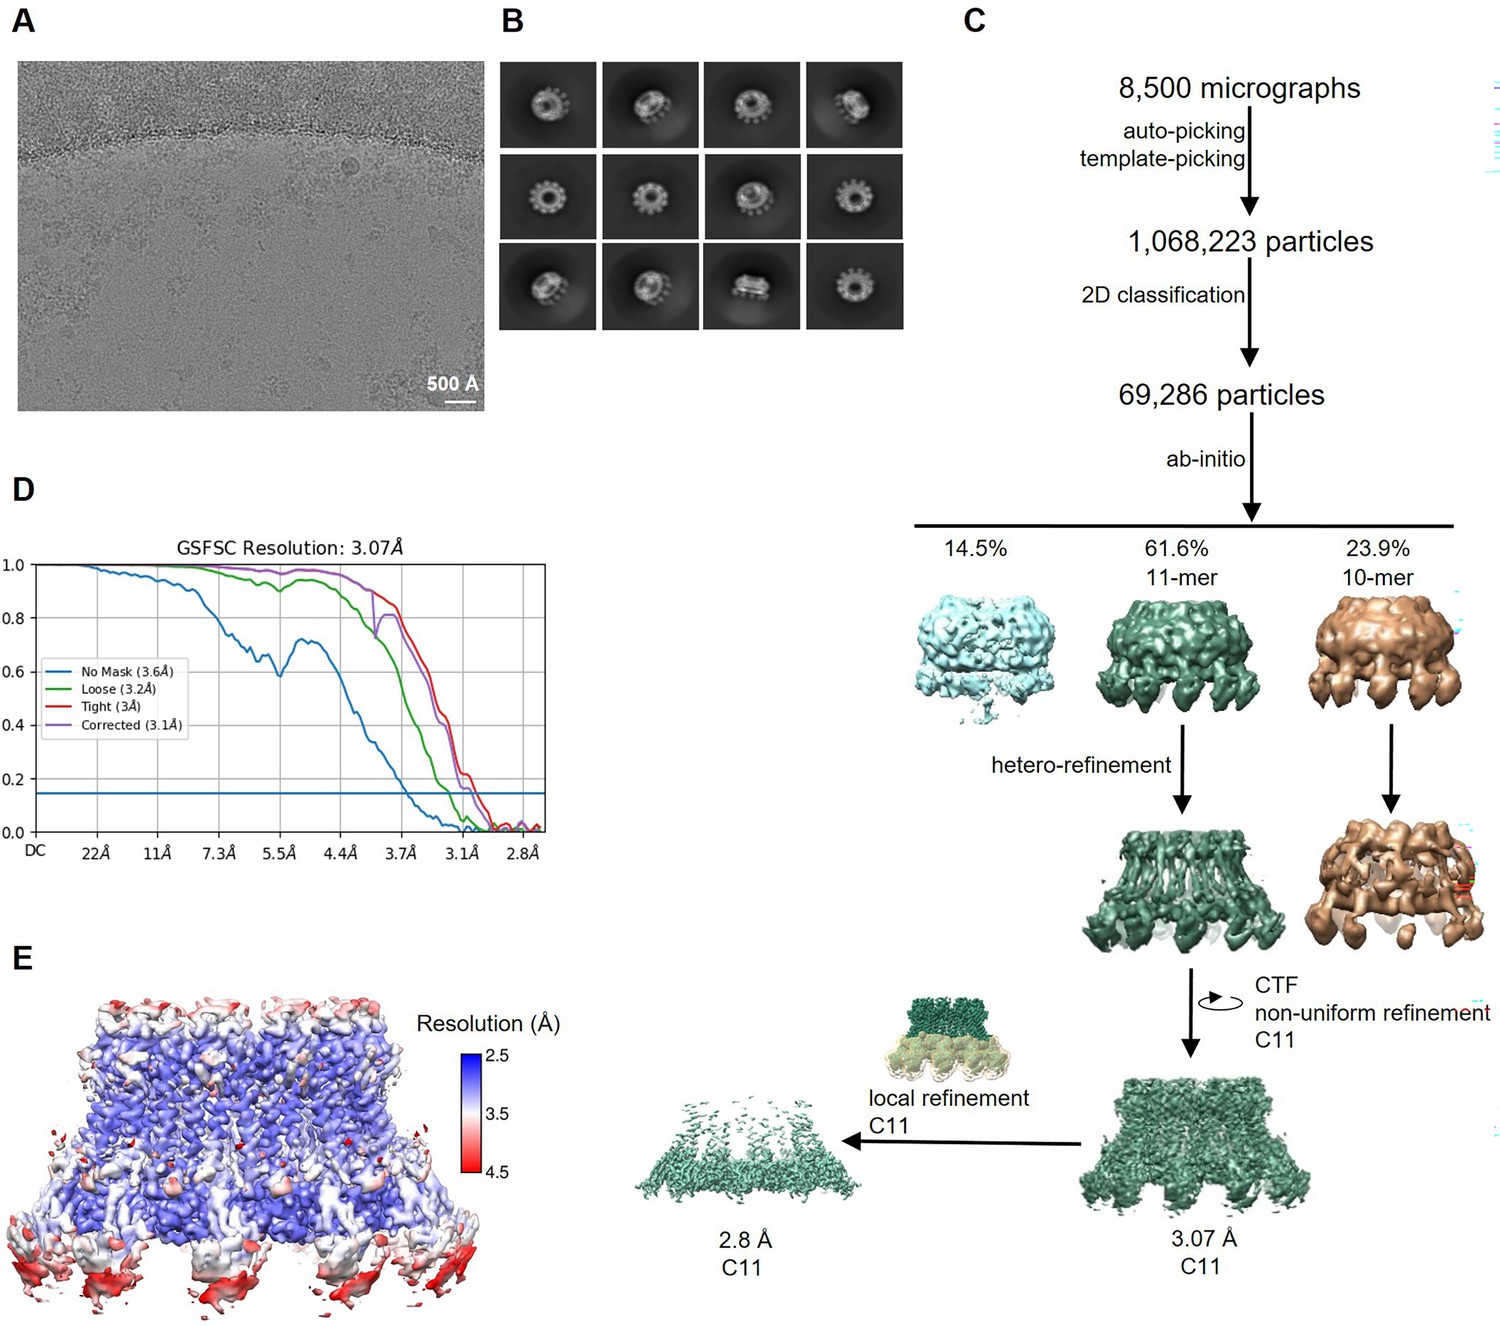
Cryo-electron microscopy (Cryo-EM) reconstruction of CALHM2 in complex with sybody SbC2.
(A) Representative cryo-EM micrograph acquired with a Titan Krios microscope equipped with a K3 camera. (B) 2D class averages of CALHM2/SbC2 complex. (C) Data processing workflow. Particles were picked and subjected to 2D classification. High-resolution 2D class averages were used as an input for ab initio reconstructions, which allowed to isolate two populations of particles (containing decameric and undecameric assemblies) from a decoy class. The distribution of particles (%) of each class is indicated. Particles were further sorted by heterogenous refinement and undecameric assemblies were improved in several rounds of iterative non-uniform and CTF refinement. To increase the resolution in the sybody binding site, a local refinement of the masked interaction region was performed. (D) Fourier shell correlation (FSC) plot of the final refined cryo-EM density map of undecameric channels (unmasked (blue), loose (green), and tight (red) mask, and corrected for mask convolution effects (purple)) of the CALHM2/SbC2 complex. The resolution at which the FSC curve drops below the 0.143 threshold is indicated. (E) Final 3D reconstruction of the CALHM2/sybody complex colored according to local resolution.
Figure 4 with 2 supplements
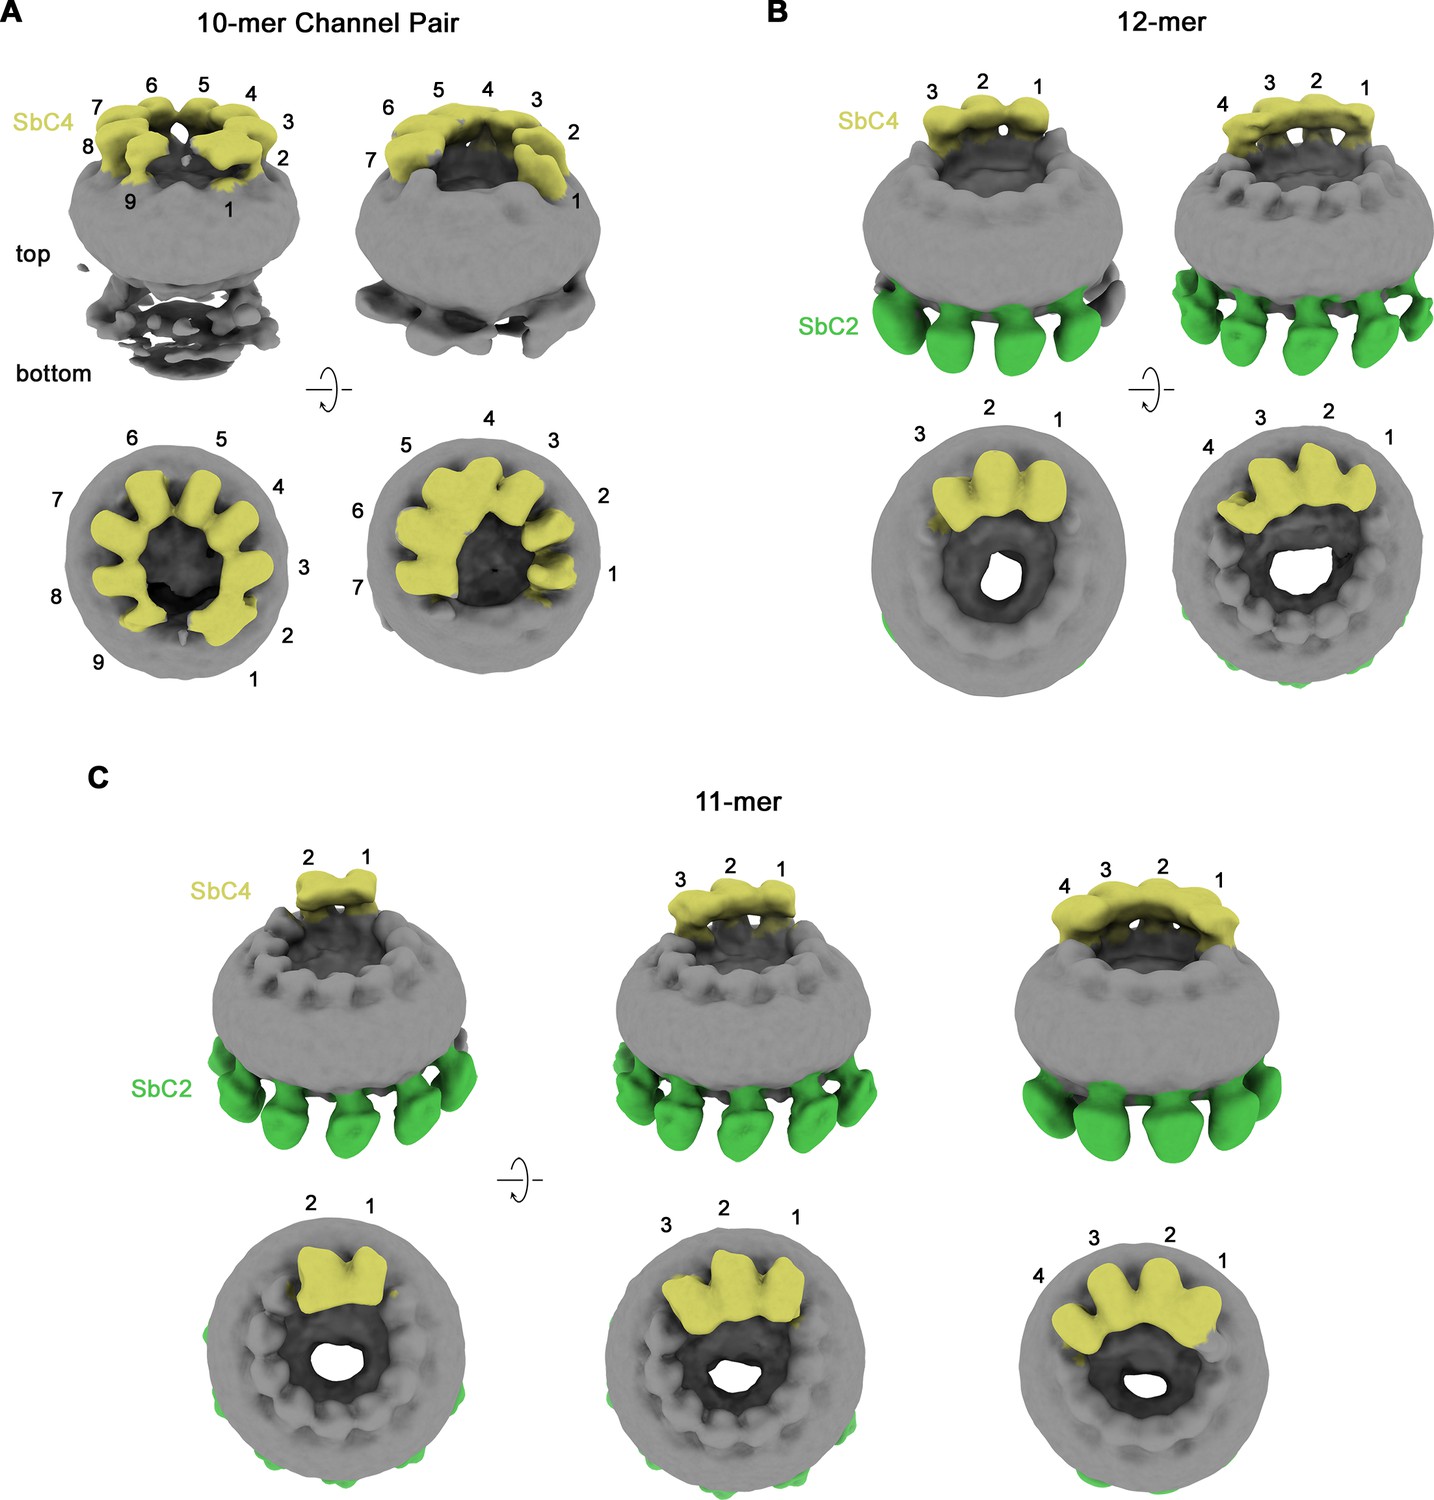
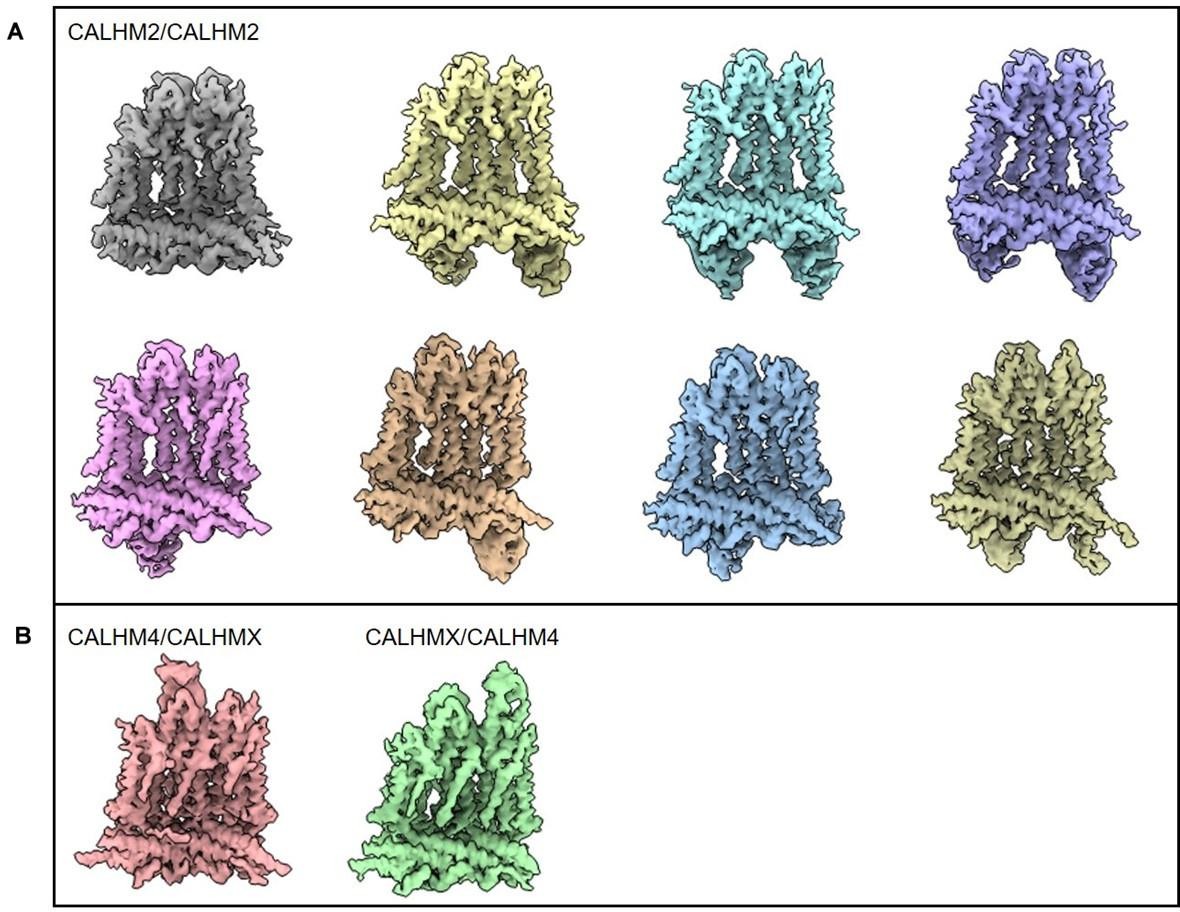
Classification of CALHM2/CALHM4 heteromers.
Classes correspond to distinct populations of oligomers in the CALHM2/4/SbC2/SbC4 complex. (A) Assemblies containing an excess of CALHM4 subunits. Shown is the well-resolved halve of interacting channel pairs (with weak density corresponding to the second channel). (B, C) Assemblies with an excess of CALHM2 subunits. (B) Dodecameric channels containing three and four CALHM4 subunits. (C) Undecameric channels contain two to four CALHM4 subunits. (A–C) Shown are low-resolution maps (processed in C1) with bound SbC2 and SbC4 colored in green and yellow, respectively. Numbering refers to CALHM4 subunits. The relationship between views is indicated. Top panels show an inclined view towards the membrane plane, bottom panels a view from the extracellular side.
Figure 4—figure supplement 1
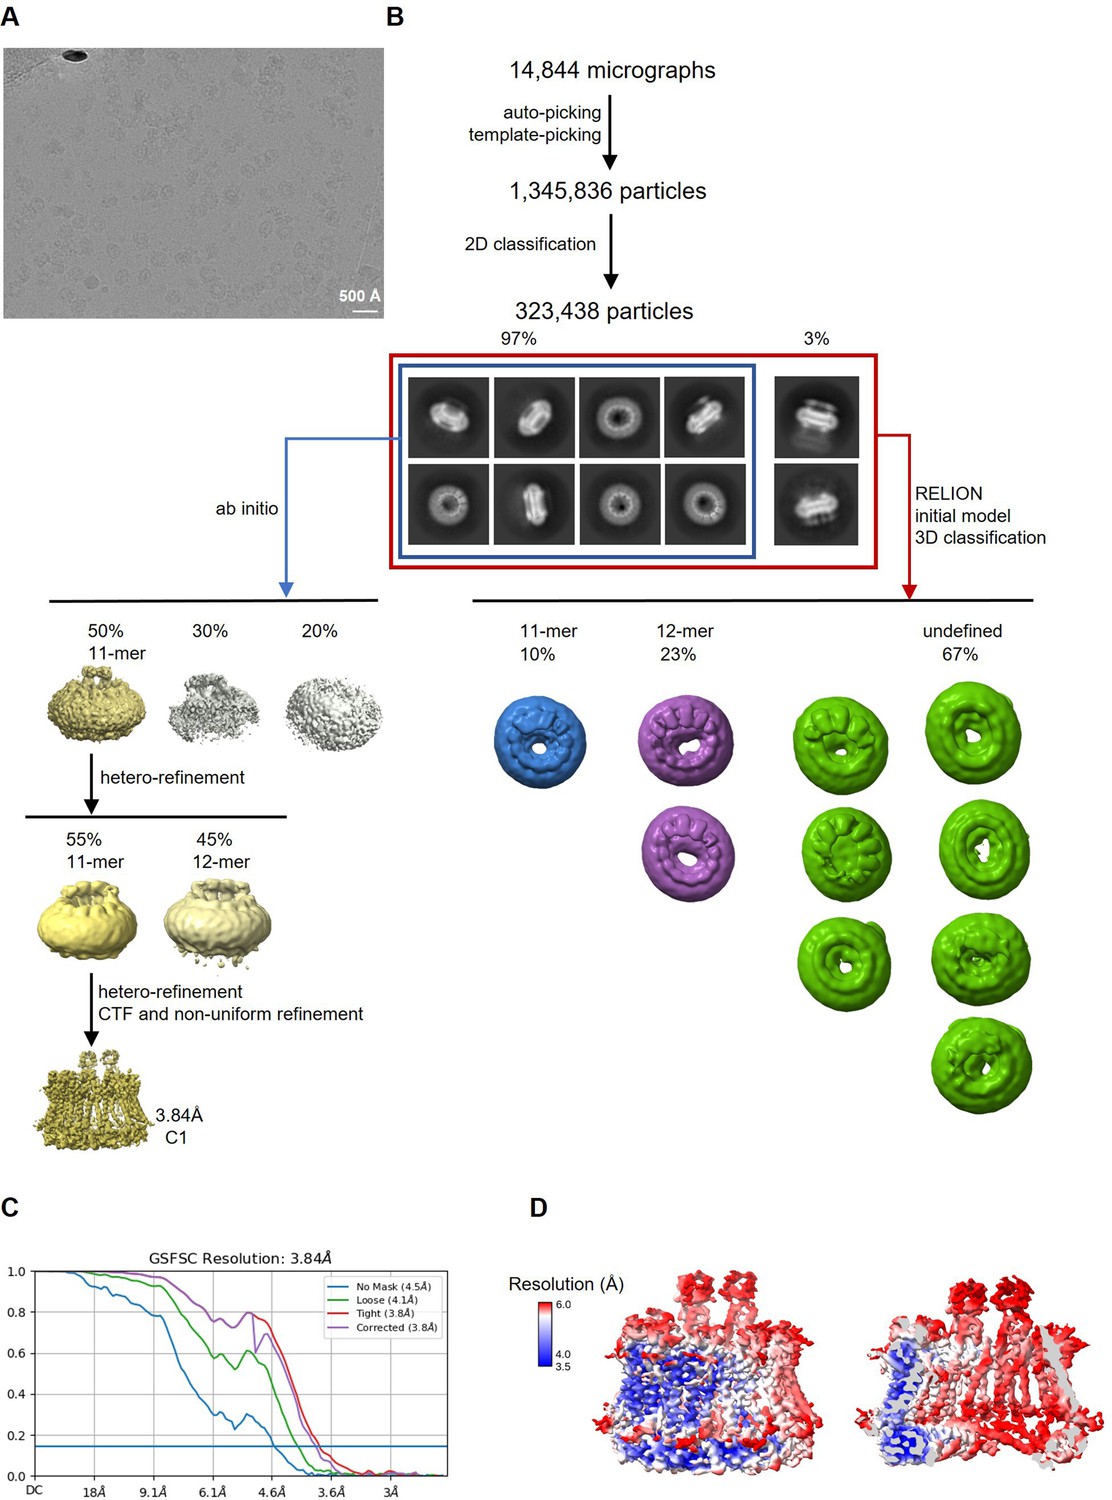
Cryo-electron microscopy (Cryo-EM) reconstruction of CALHM2/4 in complex with sybody SbC4.
(A) Representative cryo-EM micrograph acquired with a Titan Krios microscope equipped with a K3 camera. (B) Data processing workflow. Particles were picked and subjected to 2D classification. 2D class averages allowed for the initial separation of populations of single channels and their dimers. The distribution of particles (%) of each population is indicated. Further 3D classification has led to the separation of different assemblies. Ab initio reconstructions of particles featuring single channels resulted in low-resolution maps of undecameric assemblies. Further steps of heterogeneous refinement have separated undecamers and dodecamers. The smaller channels were refined to high-resolution via several cycles of heterorefinements and a non-uniform refinement. (C) Fourier shell correlation (FSC) plot of the final refined unmasked (blue), loose (green), and tight (red) mask, and corrected for mask convolution effects (purple) cryo-EM density maps of an undecameric CALHM2/4/SbC4 complex. (D) Final 3D reconstruction of a CALHM2/4/SbC4 complex colored according to local resolution. Shown is the map of the channel viewed from the side (left) and the slice through the channel (right).
Figure 4—figure supplement 2
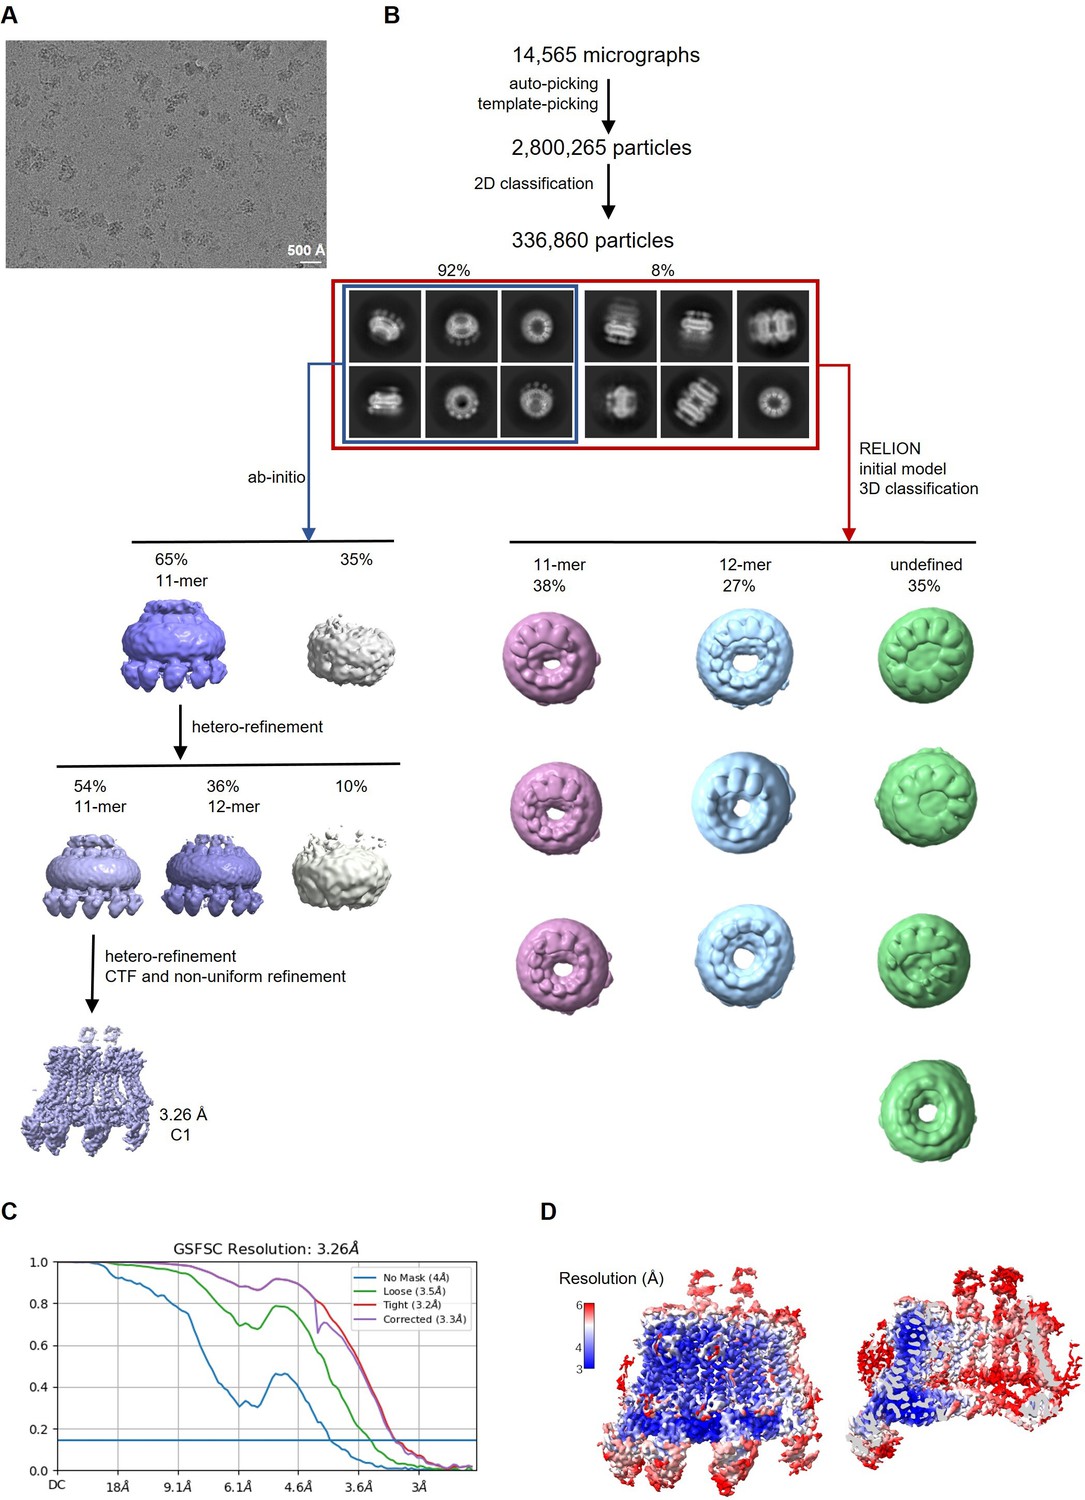
Cryo-electron microscopy (Cryo-EM) reconstruction of CALHM2/4 in complex with sybodies SbC2 and SbC4.
(A) Representative cryo-EM micrograph acquired with a Titan Krios microscope equipped with a K3 camera. (B) Data processing workflow. Particles were picked and subjected to 2D classification. High-resolution 2D class averages revealed populations of single channels and dimers of channels. The distribution of particles (%) of each population is indicated. Subsequent 3D classification of all the particles allowed for the separation of different assemblies. Ab initio reconstructions of particles featuring single channels yielded undecameric assemblies. The subsequent heterogeneous refinement separated undecameric and dodecameric channels. The undecameric assemblies were further improved to high-resolution by hetero, CTF, and non-uniform refinement. (C) Fourier shell correlation (FSC) curves of the final refined unmasked (blue), loose (green), and tight (red) mask, and corrected for mask convolution effects (purple) cryo-EM density maps of an undecameric CALHM2/4/SbC2/SbC4 complex. (D) Final 3D reconstruction of the CALHM2/4/SbC2/SbC4 complex colored according to local resolution. Shown is the map of the channel viewed from the side (left) and the slice through the channel (right).
Figure 5
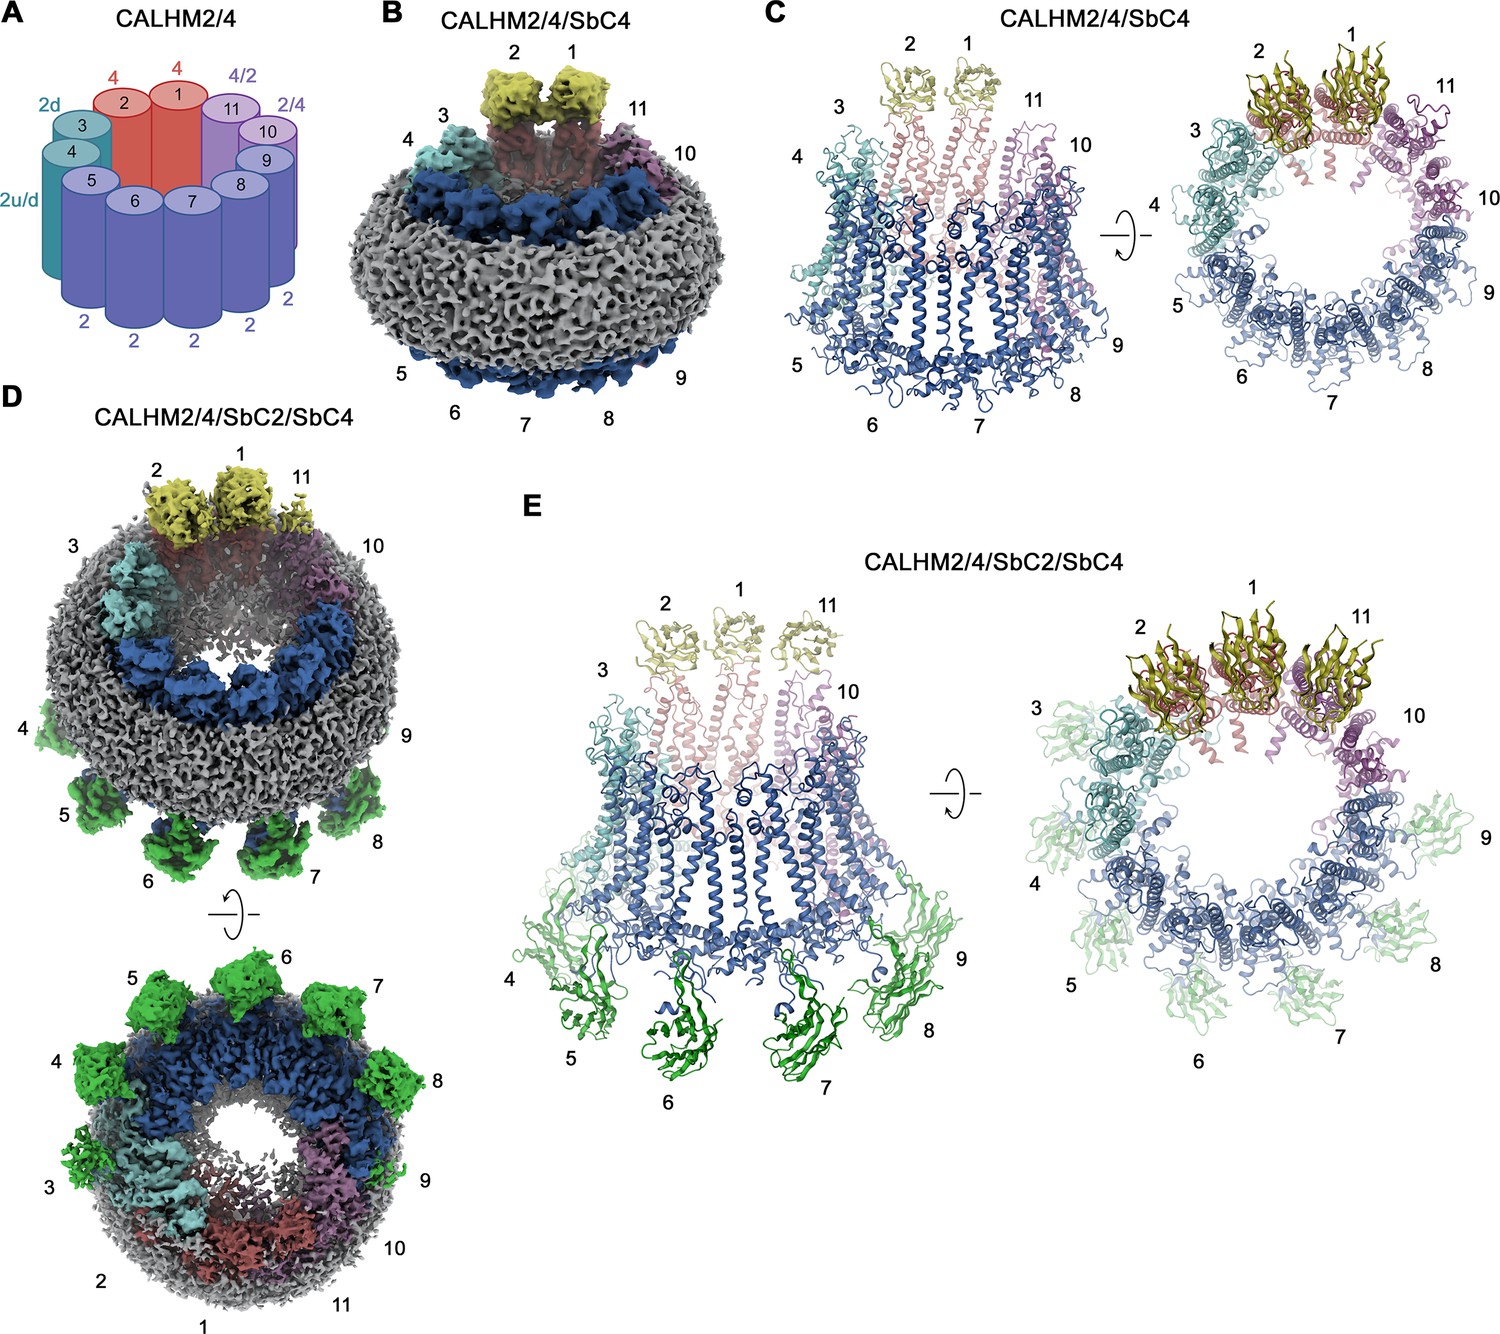
CALHM2/CALHM4 heteromer structure.
(A) Schematic depiction of the subunit distribution in CALHM2/4 heteromers. 4 refers to CALHM4, 2 to CALHM2 in ‘up’ conformation, 2d to CALHM2 in ‘down’ conformation, 2 u/d to a mixed population of both conformations of CALHM2 subunits, 4/2, and 2/4 to mixed populations of CALHM2 and 4 with the first number indicating the predominant subunit. (B) Cryo-electron microscopy (Cryo-EM) density of the CALHM2/4/SbC4 complex at 3.8 Å viewed with an inclination towards the membrane plane. (C) Ribbon representation of the CALHM2/4/SbC4 complex viewed from the same perspective as in B (left) and from the extracellular side (right). (D) Cryo-EM density of the CALHM2/4/SbC2/SbC4 complex at 3.3 Å viewed with an inclination towards the membrane plane (top) and from the intracellular side (bottom). (C) Ribbon representation of the CALHM2/4/SbC2/SbC4 complex viewed from the same perspective as in B (left) and from the extracellular side (right). (B–E), Colors, and numbers of channel subunits are as in (A). SbC2 and SbC4 are colored in green and yellow, respectively.
Figure 6
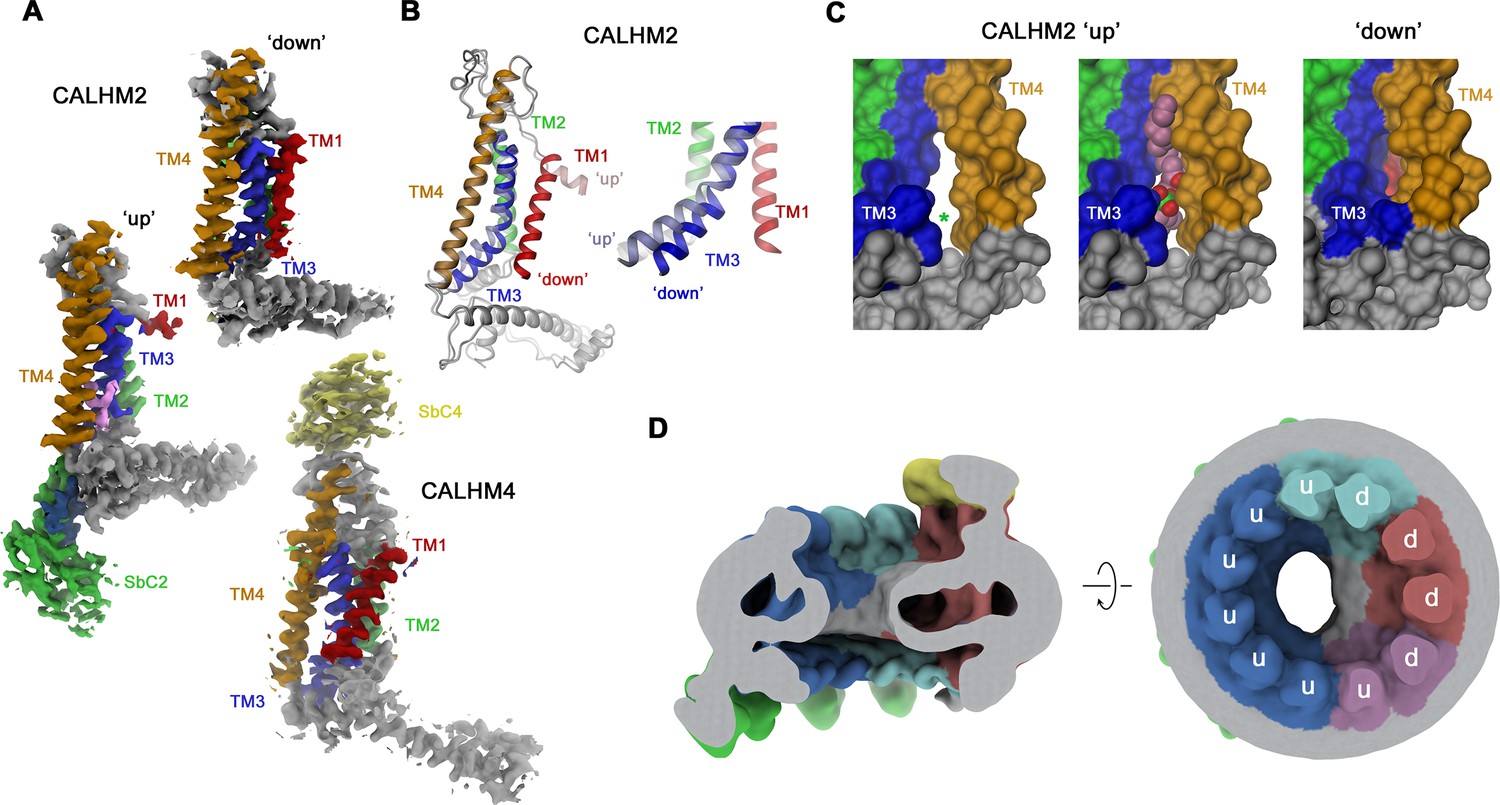
Conformational properties of calcium homeostasis modulators (CALHM) subunits in CALHM2/4 heteromers.
(A) Cryo-electron microscopy (Cryo-EM) density of CALHM2 subunits in ‘down’ (position 3, top) and ‘up’ (position 6, left) and of CALHM4 (in ‘down’ conformation, position 1, bottom). (B) Ribbon representation of a superposition of CALHM2 subunits in ‘up’ and ‘down’ conformations. The inset (right) shows a blowup of the intracellular region around TM1-3. (C) Molecular surface of the intracellular region relating TM3 and TM4 viewed from within the membrane plane. A gap between both helices (left, asterisk), which is occupied by a lipid (space-filling representation) in the ‘up’ conformation (center), is closed in the ‘down’ conformation (right). (A–C) Transmembrane helices and attached sybodies are shown in unique colors. (D) Low-pass filtered map of the CALHM2/4/SbC2/SbC4 complex depicting residual bilayer-like density in the pore lumen. Slice through the channel in a view parallel to the membrane (left), and from the extracellular side (right). Subunit conformations are indicated (d, ‘down’, u, ‘up’). CALHM4 subunits are shown in red and magenta, CALHM2 subunits in blue and cyan.
Figure 7
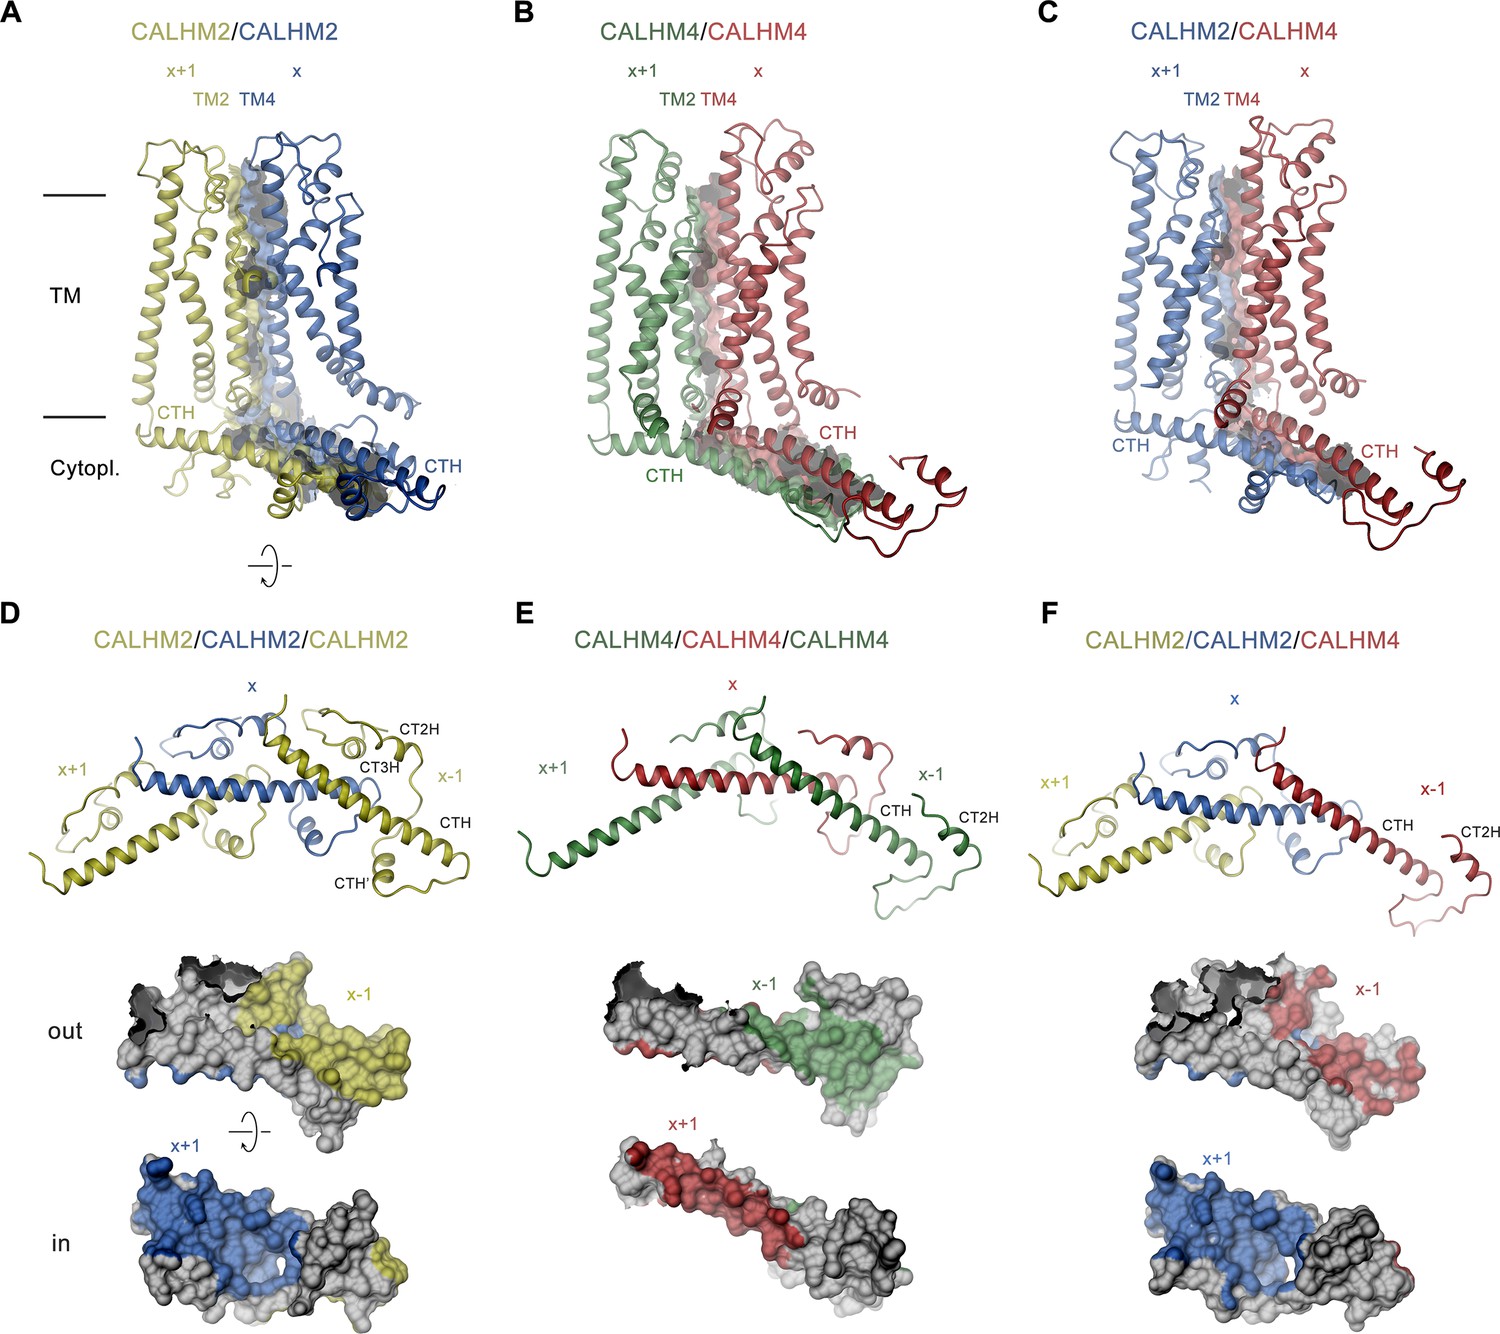
Structural features of subunit interfaces.
(A–C) Interaction interfaces between pairs of CALHM2 subunits (A), CALHM4 subunits (B), and a CALHM2 and a CALHM4 subunit (C). Shown are ribbon representations of neighboring subunits viewed from the inside of the channel parallel to the membrane and their molecular surfaces that are buried in the interaction interface. (D–F) Subunit interactions in the cytoplasmic domain of calcium homeostasis modulators (CALHM) channels. Shown is a central subunit (x) and its interaction partners in clockwise and counterclockwise position (top). The region of the intracellular domain that is contacted by neighboring subunits is mapped on the molecular surface of the central subunit. Center, view from the extracellular side (out), bottom from the cytoplasm (in). (A–F) The relative position of subunits within the assembly is indicated. Paralogs are represented in unique colors.
Figure 8
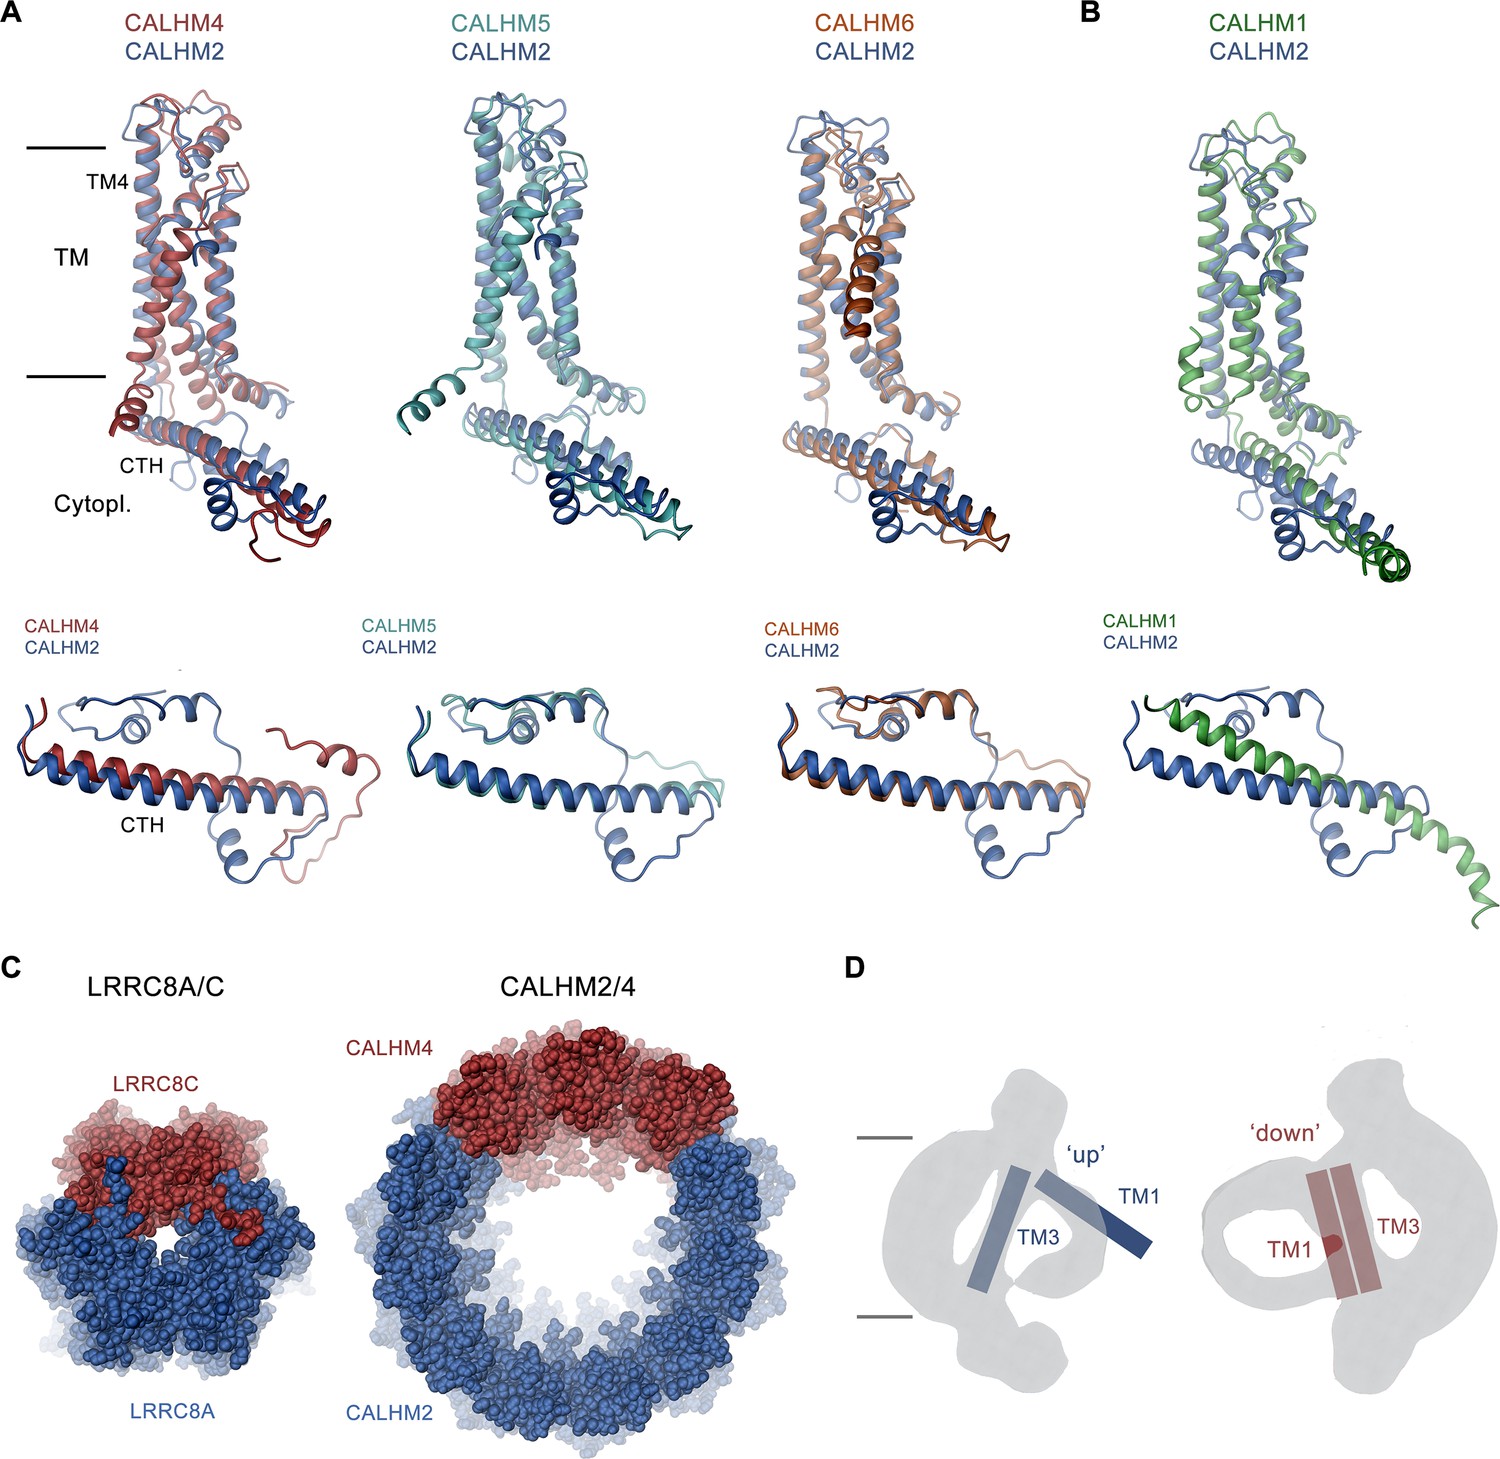
Discussion.
(A, B) Superposition of single subunits of different calcium homeostasis modulators (CALHM) paralogs on CALHM2 viewed from within the membrane (top) and of their cytosolic domain viewed from the outside (bottom). (A) Superposition with CALHM2-like subunits CALHM4-6 (CALHM5 PDB:7D60, CALHM6 PDB:6YTV). (B) Superposition with CALHM1 (PDB:8GMQ). The difference in the conformation of the intracellular domain is apparent. (C) Segregation of subunits in heteromeric channels of the LRRC8 (PDB:8B41) family (left) and of CALHM2/4 channels (right). Proteins are shown as space-filling models. The view is from the extracellular side. (D) Schematic depiction of how the conformation of CALHM subunits influences the properties of the bilayer-like density inside the channel. The conformation of helices is indicated.
Author response image 1
Classification of subunit pairs of undecameric CALHM2/4 channels bound to sybodies SbC2 and SbC4 after the processing combining symmetry expansion and partial signal subtraction.
(A) Classes showing CALHM2 subunit pairs. (B) Classes showing subunits at interfaces to CALHM4.
Tables
Table 1
Cryo-electron microscopy (Cryo-EM) Data collection, refinement, and validation statistics.
| CALHM4/SbC4 | CALHM2/SbC2 | CALHM2/CALHM4/SbC4 | CALHM2/CALHM4/SbC2/SbC4 | |
|---|---|---|---|---|
| EMD-19365PDB 8RMN | EMD-19362PDB 8RMK | EMD-19363PDB 8RML | EMD-19364PDB 8RMM | |
| Data collection and processing | ||||
| Microscope | FEI Titan Krios G3i | FEI Titan Krios G3i | FEI Titan Krios G3i | FEI Titan Krios G3i |
| Camera | Gatan K3 +GIF | Gatan K3 +GIF | Gatan K3 +GIF | Gatan K3 +GIF |
| Magnification | 130,000 | 130,000 | 130,000 | 130,000 |
| Voltage (kV) | 300 | 300 | 300 | 300 |
| Electron exposure (e–/Å2) | 70 | 72 | 60 | 60 |
| Defocus range (μm) | –1.0 to –2.4 | –1.0 to –2.4 | –1.0 to –2.4 | –1.0 to –2.4 |
| Pixel size* (Å) | 0.651 (0.3255) | 0.651 (0.3255) | 0.651 (0.3255) | 0.651 (0.3255) |
| Initial particle images (no.) | 424,942 | 1,068,223 | 1,345,836 | 2,800,265 |
| Final particle images (no.) | 52,248 | 37,894 | 131,652 | 93,191 |
| Symmetry imposed | D10 | C11 | C1 | C1 |
| Map resolution (Å) | ||||
| FSC threshold 0.143 | 3.7 | 3.07 | 3.84 | 3.26 |
| Map resolution range (Å) | 3.5–5 | 2.6–5 | 3.5–6 | 3–6 |
| Refinement | ||||
| Model resolution (Å) | ||||
| FSC threshold 0.5 | 3.9 | 3.2 | 4.1 | 3.7 |
| Map sharpening b-factor (Å2) | –152.97 | –101.8 | –113.8 | –67.2 |
| Model composition | ||||
| Non-hydrogen atoms | 55,460 | 36,113 | 24,456 | 32,891 |
| Protein residues | 7199 | 4521 | 3089 | 4163 |
| Ligand (PLC) | 11 | 0 | 6 | |
| B factors (Å2) | ||||
| Protein | 74.47 | 75.52 | 121.74 | 69.29 |
| Ligand | 59.93 | 80.08 | ||
| R.M.S. deviations | ||||
| Bond lengths (Å) | 0.004 | 0.003 | 0.004 | 0.003 |
| Bond angles (°) | 0.710 | 0.611 | 0.596 | 0.671 |
| Validation | ||||
| MolProbity score | 2.00 | 1.86 | 1.87 | 1.85 |
| Clashscore | 13.63 | 12.04 | 12.92 | 11.37 |
| Poor rotamers (%) | 1.16 | 0.45 | 0.46 | 0.79 |
| Ramachandran plot | ||||
| Favored (%) | 95.60 | 96.05 | 96.28 | 96 |
| Allowed (%) | 4.40 | 3.95 | 3.72 | 3.98 |
| Disallowed (%) | 0.00 | 0.00 | 0.00 | 0.02 |
-
*
Values in parentheses indicate the pixel size in super-resolution.
Appendix 1—key resources table
| Reagent type (species) or resource | Designation | Source or reference | Identifiers | Additional information |
|---|---|---|---|---|
| Strain, strain background (Escherichia coli) | MC1016 | Sigma | C66303 | |
| Cell line (Homo-sapiens) | HEK293S GnTI- | ATCC | CRL-3022 | |
| Cell line (Homo-sapiens) | HEK-293 | ATCC | CRL-1573 | |
| Antibody | Anti-c-Myc (Mouse monoclonal) | Sigma | M4439 | (1:5000) |
| Antibody | Peroxidase AffiniPure Goat Anti-Mouse IgG H+L (Goat polyclonal) | Jackson ImmunoResearch | 115-035-146 | (1:10000) |
| Recombinant DNA reagent | Modified mammalian pcDNA 3.1 (+) expression vector for FX cloning system, C-terminal 3 C cleavage site, myc tag and 6x HisTag | Dutzler group | N/A | |
| Recombinant DNA reagent | Modified mammalian pcDNA 3.1 (+)expression vector for FX cloning system, C-terminal 3 C cleavage site, Venus fluorescent tag, myc tag and SBP tag | Dutzler group | N/A | |
| Recombinant DNA reagent | pBXNPHM3 (plasmid) | Seeger group | Addgene #110099 | |
| Recombinant DNA reagent | pSbinit (plasmid) | Seeger group | Addgene #110100 | |
| Recombinant DNA reagent | Homo sapiens CALHM1 | GenScript | Accession NM_001001412.3 | |
| Recombinant DNA reagent | Homo sapiens CALHM2 | GenScript | Accession NM_015916.5 | |
| Recombinant DNA reagent | Homo sapiens CALHM3 | GenScript | Accession NM_001129742.2 | |
| Recombinant DNA reagent | Homo sapiens CALHM4 | GenScript | Accession NM_001366078.1 | |
| Recombinant DNA reagent | Homo sapiens CALHM6 | GenScript | Accession NM_001010919.3 | |
| Commercial assay or kit | Amersham ECL Prime Western Blotting Detection Kit | GE Healthcare | RPN2232 | |
| Commercial assay or kit | EZ-link NHS-PEG4-biotin | Sigma | A39259 | |
| Chemical compound, drug | Benzamidine | Sigma | B6506 | |
| Chemical compound, drug | Calcium chloride | Sigma | 223506 | |
| Chemical compound, drug | Chloramphenicol | Sigma | C1919 | |
| Chemical compound, drug | D-desthiobiotin | Sigma | D1411 | |
| Chemical compound, drug | DNase I | Sigma | EN0521 | |
| Chemical compound, drug | Dulbecco’s Modified Eagle’s Medium (DMEM) High glucose, pyruvate | Sigma | D6429 | |
| Chemical compound, drug | EGTA | Sigma | 03777 | |
| Chemical compound, drug | Fetal bovine serum | Sigma | F7524 | |
| Chemical compound, drug | Glucose | AppliChem | A1422.1000 | |
| Chemical compound, drug | Glycerol 99% | Sigma | G7757 | |
| Chemical compound, drug | Glycol-diosgenin (GDN) | Anatrace | GDN101 | |
| Chemical compound, drug | HCl | Millipore | 1.00319.1000 | |
| Chemical compound, drug | HEPES | Sigma | H3375 | |
| Chemical compound, drug | HyClone HyCell TransFx-H medium | Cytiva | SH30939.02 | |
| Chemical compound, drug | Imidazole | Roth | X998.4 | |
| Chemical compound, drug | Kolliphor P188 | Sigma | K4894 | |
| Chemical compound, drug | L-(+)-arabinose | Sigma | A3256 | |
| Chemical compound, drug | L-glutamine | Sigma | G7513 | |
| Chemical compound, drug | Lauryl Maltose Neopentyl Glycol (LMNG) | Anatrace | NG310 | |
| Chemical compound, drug | Leupeptin | AppliChem | A2183.0100 | |
| Chemical compound, drug | Lysozyme | AppliChem | A3711.0050 | |
| Chemical compound, drug | Magnesium chloride | Fluka | 63.065 | |
| Chemical compound, drug | Penicillin-streptomycin | Sigma | P0781 | |
| Chemical compound, drug | Pepstatin A | Axon lab | A2205.0100 | |
| Chemical compound, drug | Phenylmethylsulfonyl fluoride (PMSF) | Sigma | PMSF-RO | |
| Chemical compound, drug | Polyethylenimine HCl MAX, Linear, MW 40,000 (PEI MAX 40000) | Chemie Brunschwig AG | POL24765 | |
| Chemical compound, drug | Potassium chloride | Sigma | 746346 | |
| Chemical compound, drug | RNase | Sigma | R5125 | |
| Chemical compound, drug | Sodium chloride | Sigma | 71380 | |
| Chemical compound, drug | Sodium hydroxide | Sigma | S8045 | |
| Chemical compound, drug | Terrific broth | Sigma | T9179 | |
| Chemical compound, drug | Tris | AppliChem | A1379 | |
| Chemical compound, drug | Tween 20 | Sigma | 93773 | |
| Chemical compound, drug | Valproic acid sodium salt | Sigma | P4543 | |
| Software, algorithm | Axon Clampex 10.6 | Molecular Devices | N/A | |
| Software, algorithm | Axon Clampfit 11.0.3 | Molecular Devices | N/A | |
| Software, algorithm | Chimera 1.16 | Pettersen et al., 2004 | http://www.cgl.ucsf.edu/chimera/ | |
| Software, algorithm | ChimeraX 1.3 | Pettersen et al., 2021 | https://www.cgl.ucsf.edu/chimerax/ | |
| Software, algorithm | Coot 0.9.8.91 | Emsley and Cowtan, 2004 | https://www2.mrc-lmb.cam.ac.uk/personal/pemsley/coot/ | |
| Software, algorithm | cryoSPARC v3.2.0–4.0 | Structural Biotechnology Inc. | RRID:SCR_016501 | |
| Software, algorithm | CTFFIND4.1 | Rohou and Grigorieff, 2015 | http://grigoriefflab.janelia.org/ctf | |
| Software, algorithm | DINO 0.9.4 | http://www.dino3d.org | http://www.dino3d.org | |
| Software, algorithm | EPU 2.9 | Thermo Fisher Scientific | N/A | |
| Software, algorithm | PHENIX 1.14 | Afonine et al., 2018 | http://phenix-online.org/ | |
| Software, algorithm | RELION-4.0 | Scheres, 2012 | https://www2.mrc-lmb.cam.ac.uk/relion/ | |
| Software, algorithm | Prism 10 | GraphPad | https://www.graphpad.com/ | |
| Other | 200 mesh Au 1.2/1.3 cryo-EM grids | Quantifoil | N1-C14nAu20-01 | See Methods, Cryo-EM sample preparation, and data collection |
| Other | 0.22 µm Ultrafree-MCCentrifugal Filter | Millipore | UFC30GV | See Methods, CALHM protein purification |
| Other | Amicon 100 kDa MWCO centrifugal filter | Millipore | UFC810096 | See Methods, CALHM protein purification |
| Other | NiNTA agarose beads | ABT | 6BCL-NTANi-100 | See Methods, CALHM protein purification, Sybody expression, and purification |
| Other | PD-10 desalting column | Sigma | GE17-0851-01 | See Methods, Sybody selection |
| Other | SRT-10C SEC 100 | Sepax Technologies | 239100–10,030 | See Methods, Sybody expression and purification |
| Other | Strep-Tactin Superflow high capacity 50% suspension | Lucerna-Chem (IBA) | 2-1208-010 | See Methods, CALHM protein purification, Pulldown binding assays |
| Other | Superose 6 10/300 GL | GE Healthcare | 17-5172-01 | See Methods, CALHM protein purification |
Additional files
Download links
A two-part list of links to download the article, or parts of the article, in various formats.
Downloads (link to download the article as PDF)
Open citations (links to open the citations from this article in various online reference manager services)
Cite this article (links to download the citations from this article in formats compatible with various reference manager tools)
Structural features of heteromeric channels composed of CALHM2 and CALHM4 paralogs
eLife 13:RP96138.
https://doi.org/10.7554/eLife.96138.3


