Neurons enhance blood–brain barrier function via upregulating claudin-5 and VE-cadherin expression due to glial cell line-derived neurotrophic factor secretion
- Department of Pharmacology, School of Pharmacy, China Pharmaceutical University, China
Figures
Figure 1 with 1 supplement
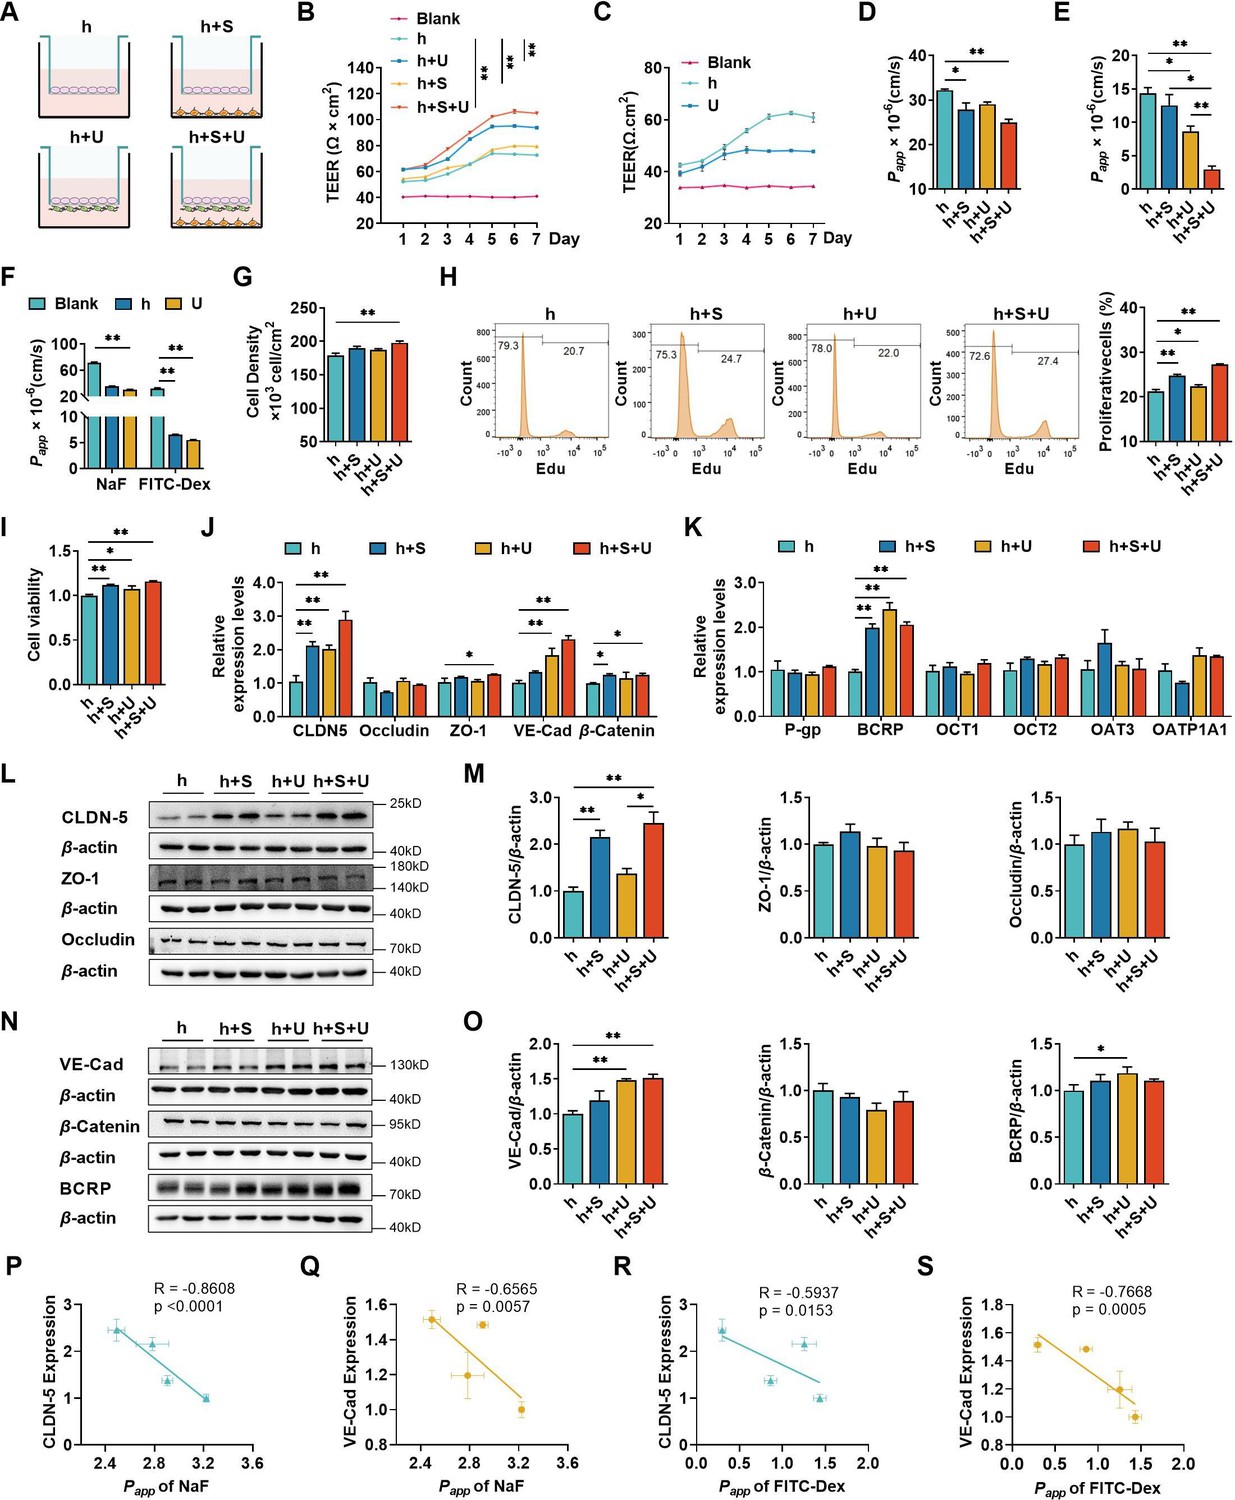
The effects of co-culture with U251 and/or SH-SY5Y cells on the integrity of hCMEC/D3 and blood–brain barrier (BBB) function.
(A) Four different types of BBB models were prepared from hCMEC/D3 cells (h), SH-SY5Y cells (S), and U251 cells (U). (B) The transendothelial electrical resistance (TEER) of four models, and the TEER values in day 6 were compared. Blank: no cells. Four biological replicates per group. (C) The TEER of hCMEC/D3 and U251 cells monolayer. Four biological replicates per group. (D, E) The apparent permeability coefficient (Papp, ×10−6 cm/s) of fluorescein (NaF) and FITC-Dextran 3–5 kDa (FITC-Dex) of four BBB models. Four biological replicates per group. (F) The Papp (×10−6 cm/s) of NaF and FITC-Dex across the blank inserts, and hCMEC/D3 or U251 mono-culture models. Four biological replicates per group. The cell density (G), EdU incorporation (H) of hCMEC/D3 cells after mono/co-culturing. Three biological replicates per group. (I) Cell viability of hCMEC/D3 cells after mono/co-culturing. Four biological replicates per group. (J, K) The mRNA levels of tight junction proteins, adherent junction proteins, and transporters. Four biological replicates per group. The protein expression levels of claudin-5 (CLDN-5), ZO-1, occluding (L, M), VE-cadherin (VE-Cad), β-catenin, and BCRP (N, O) in hCMEC/D3 cells. Four biological replicates per group. The correlations between the Papp (×10−5 cm/s) of NaF and claudin-5 expression (P), or VE-cadherin expression (Q). The correlation between Papp (×10−5 cm/s) of FITC-Dex and claudin-5 expression (R), or VE-cadherin expression (S). The above data are shown as the mean ± SEM. For J and K, two technical replicates per biological replicate. One technical replicate per biological replicate for the rest. *p < 0.05; **p < 0.01 by one-way ANOVA test followed by Fisher’s LSD test, Welch’s ANOVA test, or Kruskal–Wallis test. The simple linear regression analysis was used to examine the presence of a linear relationship between two variables.
-
Figure 1—source data 1
The western blot raw images in Figure 1.
- https://cdn.elifesciences.org/articles/96161/elife-96161-fig1-data1-v1.zip
-
Figure 1—source data 2
The labeled western blot images in Figure 1.
- https://cdn.elifesciences.org/articles/96161/elife-96161-fig1-data2-v1.zip
-
Figure 1—source data 3
Excel file containing summary data and data analysis of Figure 1.
- https://cdn.elifesciences.org/articles/96161/elife-96161-fig1-data3-v1.xlsx
Figure 1—figure supplement 1
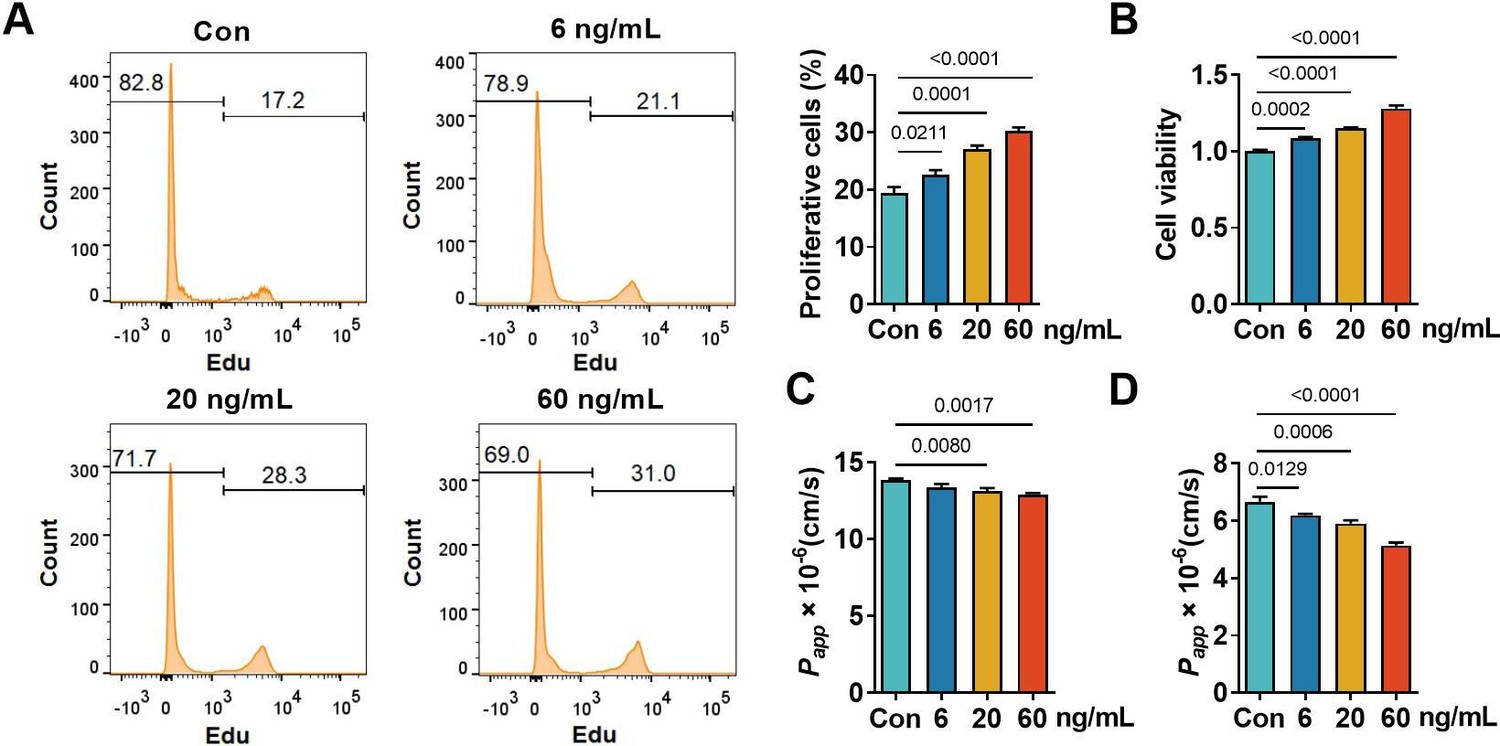
The induced proliferation of hCMEC/D3 cells by basic fibroblast growth factor (bFGF) slightly reduced the permeability of cell layers.
EdU incorporation (A), cell viability (B), and apparent permeability coefficient (Papp, ×10−6 cm/s) of fluorescein (C) or FITC-Dextran 3–5 kDa (D) of hCMEC/D3 cells treated with bFGF (6, 20, and 60 ng/ml) for 6 days. The above data are shown as the mean ± SEM. Four biological replicates per group. One technical replicate for each biological replicate. Statistical significance was determined using one-way ANOVA test followed by Fisher’s LSD test or Welch’s ANOVA test.
Figure 2
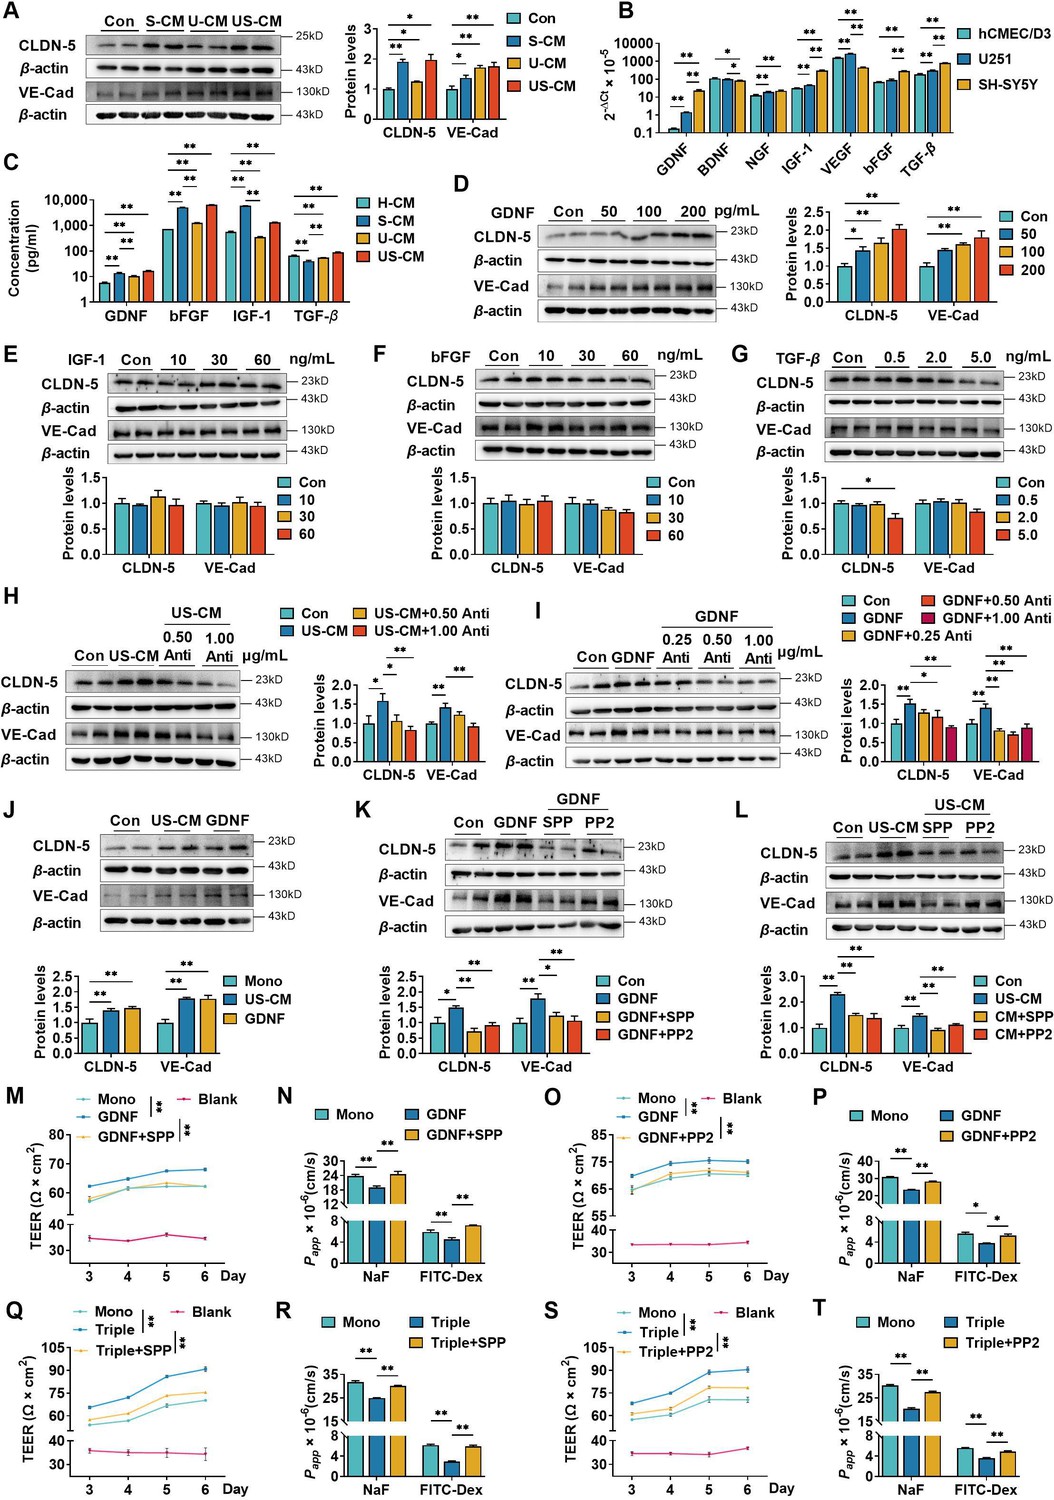
Neurons and astrocytes upregulated claudin-5 and VE-cadherin expression in hCMEC/D3 cells due to glial cell line-derived neurotrophic factor (GDNF) secretion.
(A) Effects of conditioned medium (CM) on claudin-5 and VE-cadherin expression. Con: the normal medium; S-CM: the CM from SH-SY5Y cells; U-CM: the CM from U251 cells; US-CM: the CM from SH-SY5Y cells co-culture with U251 cells. (B) The mRNA expression levels of neurotrophic factors in hCMEC/D3, U251, and SH-SY5Y cells. (C) Concentrations of GDNF, basic fibroblast growth factor (bFGF), insulin-like growth factor-1 (IGF-1), and transforming growth factor-β (TGF-β) in the CMs. H-CM: the CM from hCMEC/D3 cells. Effects of GDNF (D), IGF-1 (E), bFGF (F), and TGF-β (G) on the expression of claudin-5 and VE-cadherin. The dosages have been marked in the figure. Effects of anti-GDNF antibody on the upregulation of claudin-5 and VE-cadherin expression induced by US-CM (H) or 200 pg/ml GDNF (I). (J) Effects of 200 pg/ml GDNF and US-CM on claudin-5 and VE-cadherin expression in primary rat brain microvascular endothelial cells. Effects of 3 μM RET tyrosine kinase inhibitor SSP-86 (SPP), and 5 μM Src family kinases inhibitor PP2 on the upregulation of claudin-5 and VE-cadherin induced by 200 pg/mL GDNF (K) and US-CM (L). Effects of SPP on the transendothelial electrical resistance (TEER) on day 6 (M), the permeability of NaF, and FITC-Dex (N) of the hCMEC/D3 mono-culture blood–brain barrier (BBB) model treating 200 pg/ml GDNF. Effects of PP2 on the TEER on day 6 (O), the permeability of NaF, and FITC-Dex (P) of the hCMEC/D3 mono-culture BBB model treating 200 pg/ml GDNF. Effects of SPP on the TEER on day 6 (Q), the permeability of NaF, and FITC-Dex (R) of the triple co-culture BBB model. Effects of PP2 on the TEER on day 6 (S), the permeability of NaF, and FITC-Dex (T) of the triple co-culture BBB model. The above data are shown as the mean ± SEM. Four biological replicates per group. For B and C, two technical replicates per biological replicate. One technical replicate per biological replicate for the rest. *p < 0.05; **p < 0.01 by one-way ANOVA test followed by Fisher’s LSD test, Welch’s ANOVA test, or Kruskal–Wallis test.
-
Figure 2—source data 1
The western blot raw images in Figure 2.
- https://cdn.elifesciences.org/articles/96161/elife-96161-fig2-data1-v1.zip
-
Figure 2—source data 2
The labeled western blot images in Figure 2.
- https://cdn.elifesciences.org/articles/96161/elife-96161-fig2-data2-v1.zip
-
Figure 2—source data 3
Excel file containing summary data and data analysis of Figure 2.
- https://cdn.elifesciences.org/articles/96161/elife-96161-fig2-data3-v1.xlsx
Figure 3
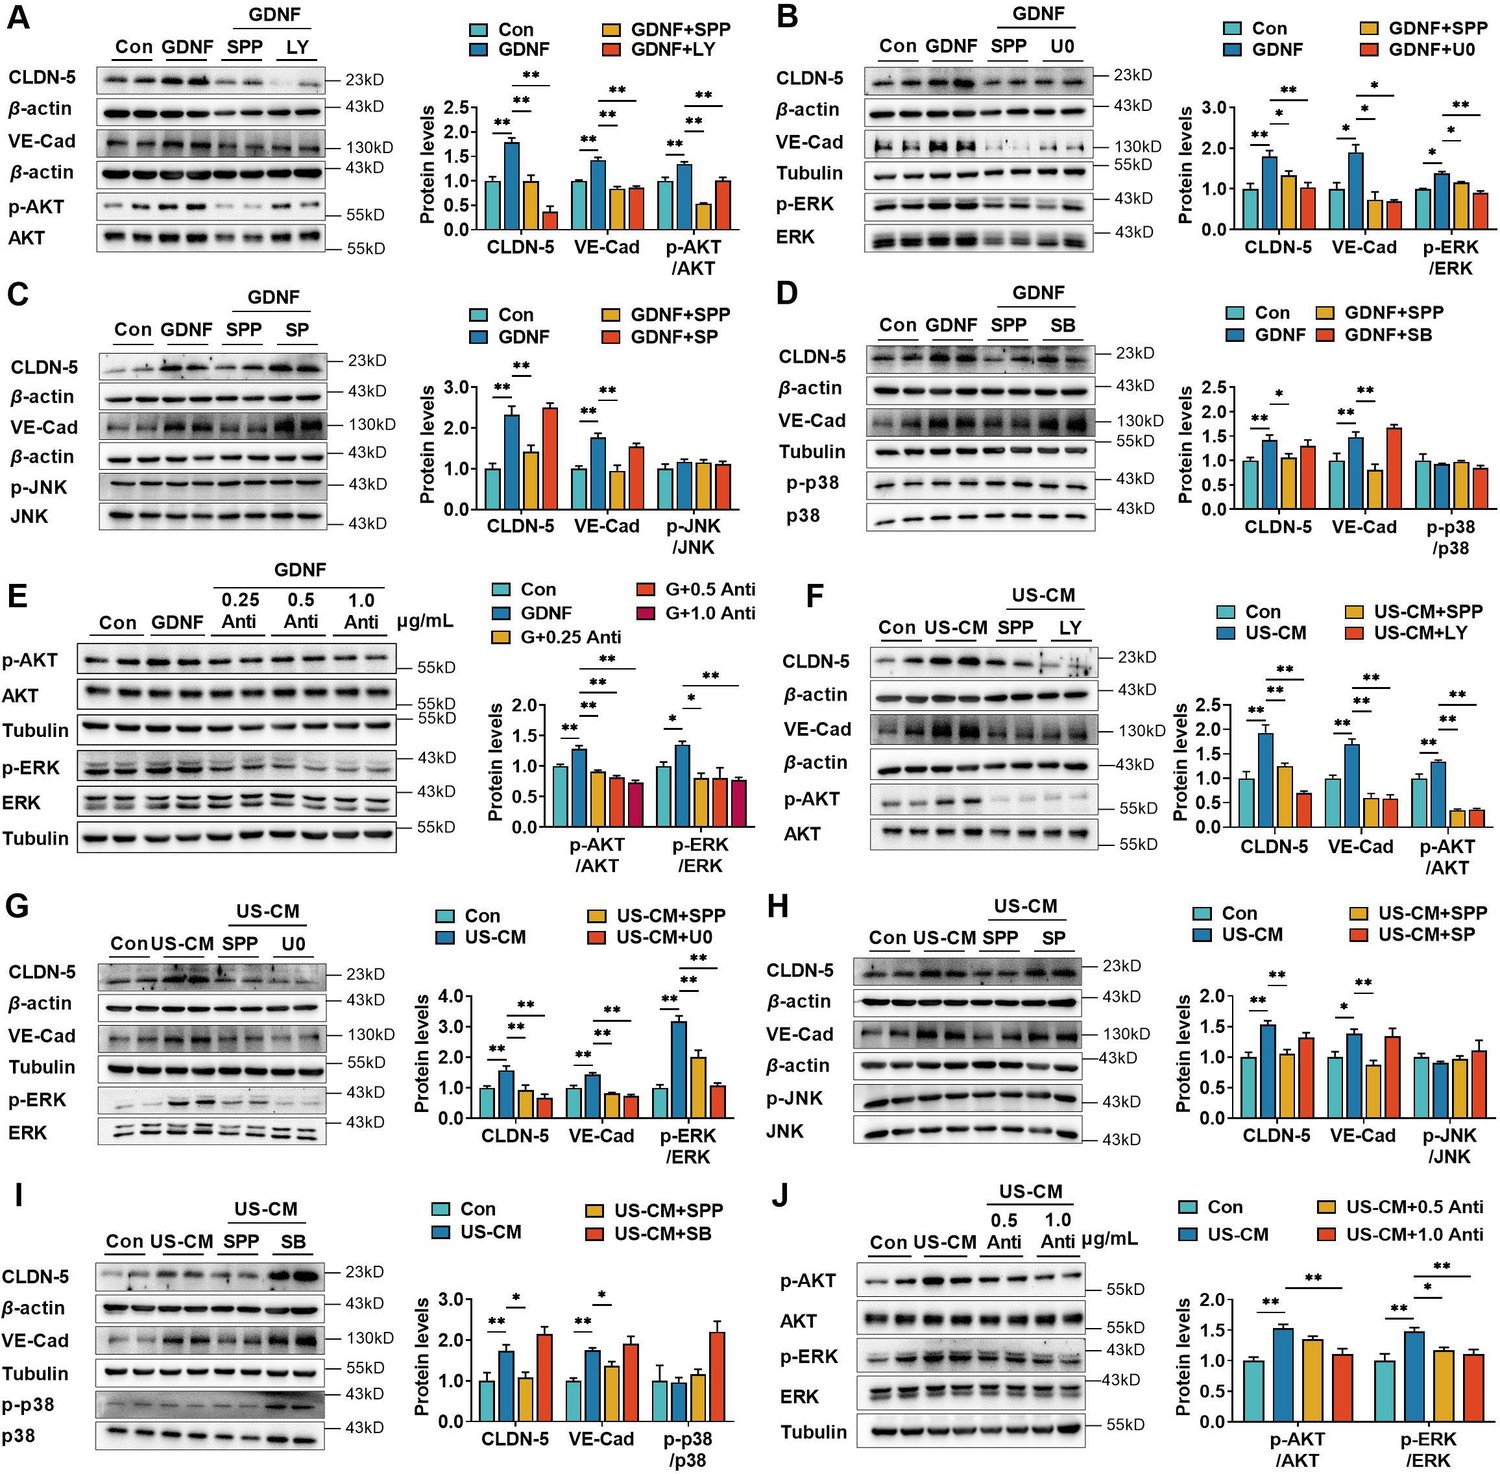
Glial cell line-derived neurotrophic factor (GDNF)-induced claudin-5 and VE-cadherin expression in hCMEC/D3 cells by activating the PI3K/AKT and MAPK/ERK signaling.
(A) Effects of 3 μM LY294002 (LY) on the levels of claudin-5, VE-cadherin, and p-AKT/AKT in hCMEC/D3 cells stimulated by 200 pg/ml GDNF. (B) Effects of 2 μM U0126 (U0) on the levels of claudin-5, VE-cadherin, and p-ERK/ERK in hCMEC/D3 cells stimulated by 200 pg/ml GDNF. (C) Effects of 5 μM SP600125 (SP) on the levels of claudin-5, VE-cadherin, and p-JNK/JNK in hCMEC/D3 cells stimulated by 200 pg/ml GDNF. (D) Effects of 2 μM SB203580 (SB) on the levels of claudin-5, VE-cadherin, and p-p38/p38 in hCMEC/D3 cells stimulated by 200 pg/ml GDNF. (E) Effects of anti-GDNF antibody on the GDNF-induced p-AKT/AKT and p-ERK/ERK ratios. (F) Effects of 3 μM LY on the levels of claudin-5, VE-cadherin, and p-AKT/AKT in hCMEC/D3 cells stimulated by US-CM. (G) Effects of 2 μM U0 on the levels of claudin-5, VE-cadherin, and p-ERK/ERK in hCMEC/D3 cells stimulated by US-CM. (H) Effects of 5 μM SP on the levels of claudin-5, VE-cadherin, and p-JNK/JNK in hCMEC/D3 cells stimulated by US-CM. (I) Effects of 2 μM SB on the levels of claudin-5, VE-cadherin, and p-p38/p38 in hCMEC/D3 cells stimulated by US-CM. (J) Effects of anti-GDNF antibody on the US-CM-induced p-AKT/AKT and p-ERK/ERK ratios. The above data are shown as the mean ± SEM. Four biological replicates per group. One technical replicate for each biological replicate. *p < 0.05; **p < 0.01 by one-way ANOVA test followed by Fisher’s LSD test or Welch’s ANOVA test.
-
Figure 3—source data 1
The western blot raw images in Figure 3.
- https://cdn.elifesciences.org/articles/96161/elife-96161-fig3-data1-v1.zip
-
Figure 3—source data 2
The labeled western blot images in Figure 3.
- https://cdn.elifesciences.org/articles/96161/elife-96161-fig3-data2-v1.zip
-
Figure 3—source data 3
Excel file containing summary data and data analysis of Figure 3.
- https://cdn.elifesciences.org/articles/96161/elife-96161-fig3-data3-v1.xlsx
Figure 4 with 1 supplement
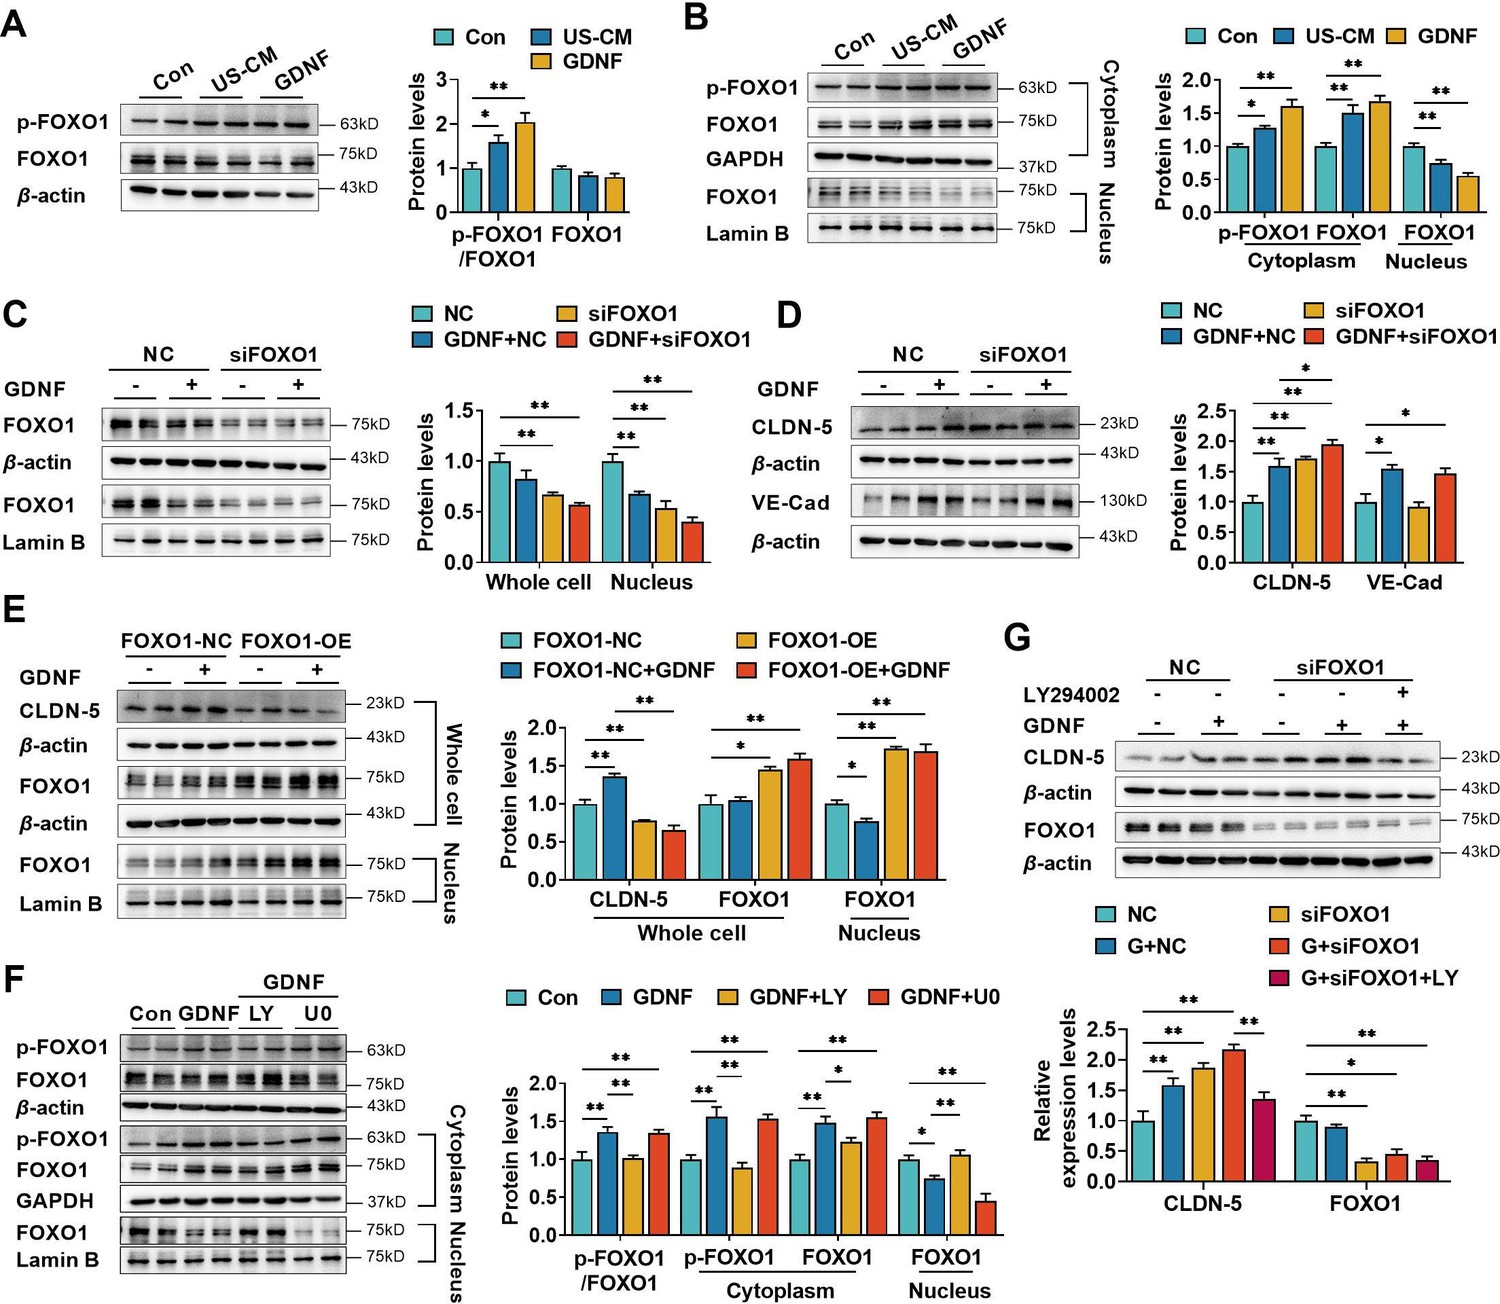
Glial cell line-derived neurotrophic factor (GDNF) induced the claudin-5 expression in hCMEC/D3 cells by activating the PI3K/AKT/FOXO1 pathway.
Effects of US-CM and GDNF on the phosphorylated FOXO1 (p-FOXO1)/FOXO1 ratio, total FOXO1 expression (A), cytoplasmic p-FOXO1, cytoplasmic FOXO1, and nuclear FOXO1 expression (B). The expression levels of total and nuclear FOXO1 (C), claudin-5, and VE-cadherin (D) in hCMEC/D3 cells transfected with FOXO1 siRNA (siFOXO1). NC: negative control. (E) Effects of FOXO1 overexpression (FOXO1-OE) and GDNF on the expression levels of claudin-5, total FOXO1, and nuclear FOXO1. FOXO1-NC: negative control plasmids. (F) Effects of LY and U0 on GDNF-induced alterations of total p-FOXO1/FOXO1 ratio, cytoplasmic p-FOXO1, cytoplasmic FOXO1, and nuclear FOXO1 expression. (G) Effects of LY on the claudin-5 expression upregulated by siFOXO1. The above data are shown as the mean± SEM. Four biological replicates per group. One technical replicate for each biological replicate. *p < 0.05; **p < 0.01 by one-way ANOVA test followed by Fisher’s LSD test, Welch’s ANOVA test, or Kruskal–Wallis test.
-
Figure 4—source data 1
The western blot raw images in Figure 4.
- https://cdn.elifesciences.org/articles/96161/elife-96161-fig4-data1-v1.zip
-
Figure 4—source data 2
The labeled western blot images in Figure 4.
- https://cdn.elifesciences.org/articles/96161/elife-96161-fig4-data2-v1.zip
-
Figure 4—source data 3
Excel file containing summary data and data analysis of Figure 4.
- https://cdn.elifesciences.org/articles/96161/elife-96161-fig4-data3-v1.xlsx
Figure 4—figure supplement 1

The contribution of VE-cadherin on the glial cell line-derived neurotrophic factor (GDNF)-induced claudin-5 expression.
Effects of the VE-cadherin siRNA (siVE-Cad) on mRNA expression of VE-cadherin (A) and claudin-5 (B). Effects of siVE-Cad and GDNF on claudin-5 and VE-cadherin protein expression (C). NC: negative control plasmids. The above data are shown as the mean ± SEM. Four biological replicates per group. Two technical replicates for A and B and one technical replicate for C. Statistical significance was determined using unpaired t-test or one-way ANOVA test followed by Fisher’s LSD test.
-
Figure 4—figure supplement 1—source data 1
The western blot raw images in Figure 4—figure supplement 1.
- https://cdn.elifesciences.org/articles/96161/elife-96161-fig4-figsupp1-data1-v1.zip
-
Figure 4—figure supplement 1—source data 2
The labeled western blot images in Figure 4—figure supplement 1.
- https://cdn.elifesciences.org/articles/96161/elife-96161-fig4-figsupp1-data2-v1.zip
-
Figure 4—figure supplement 1—source data 3
Excel file containing summary data and data analysis of Figure 4—figure supplement 1.
- https://cdn.elifesciences.org/articles/96161/elife-96161-fig4-figsupp1-data3-v1.xlsx
Figure 5
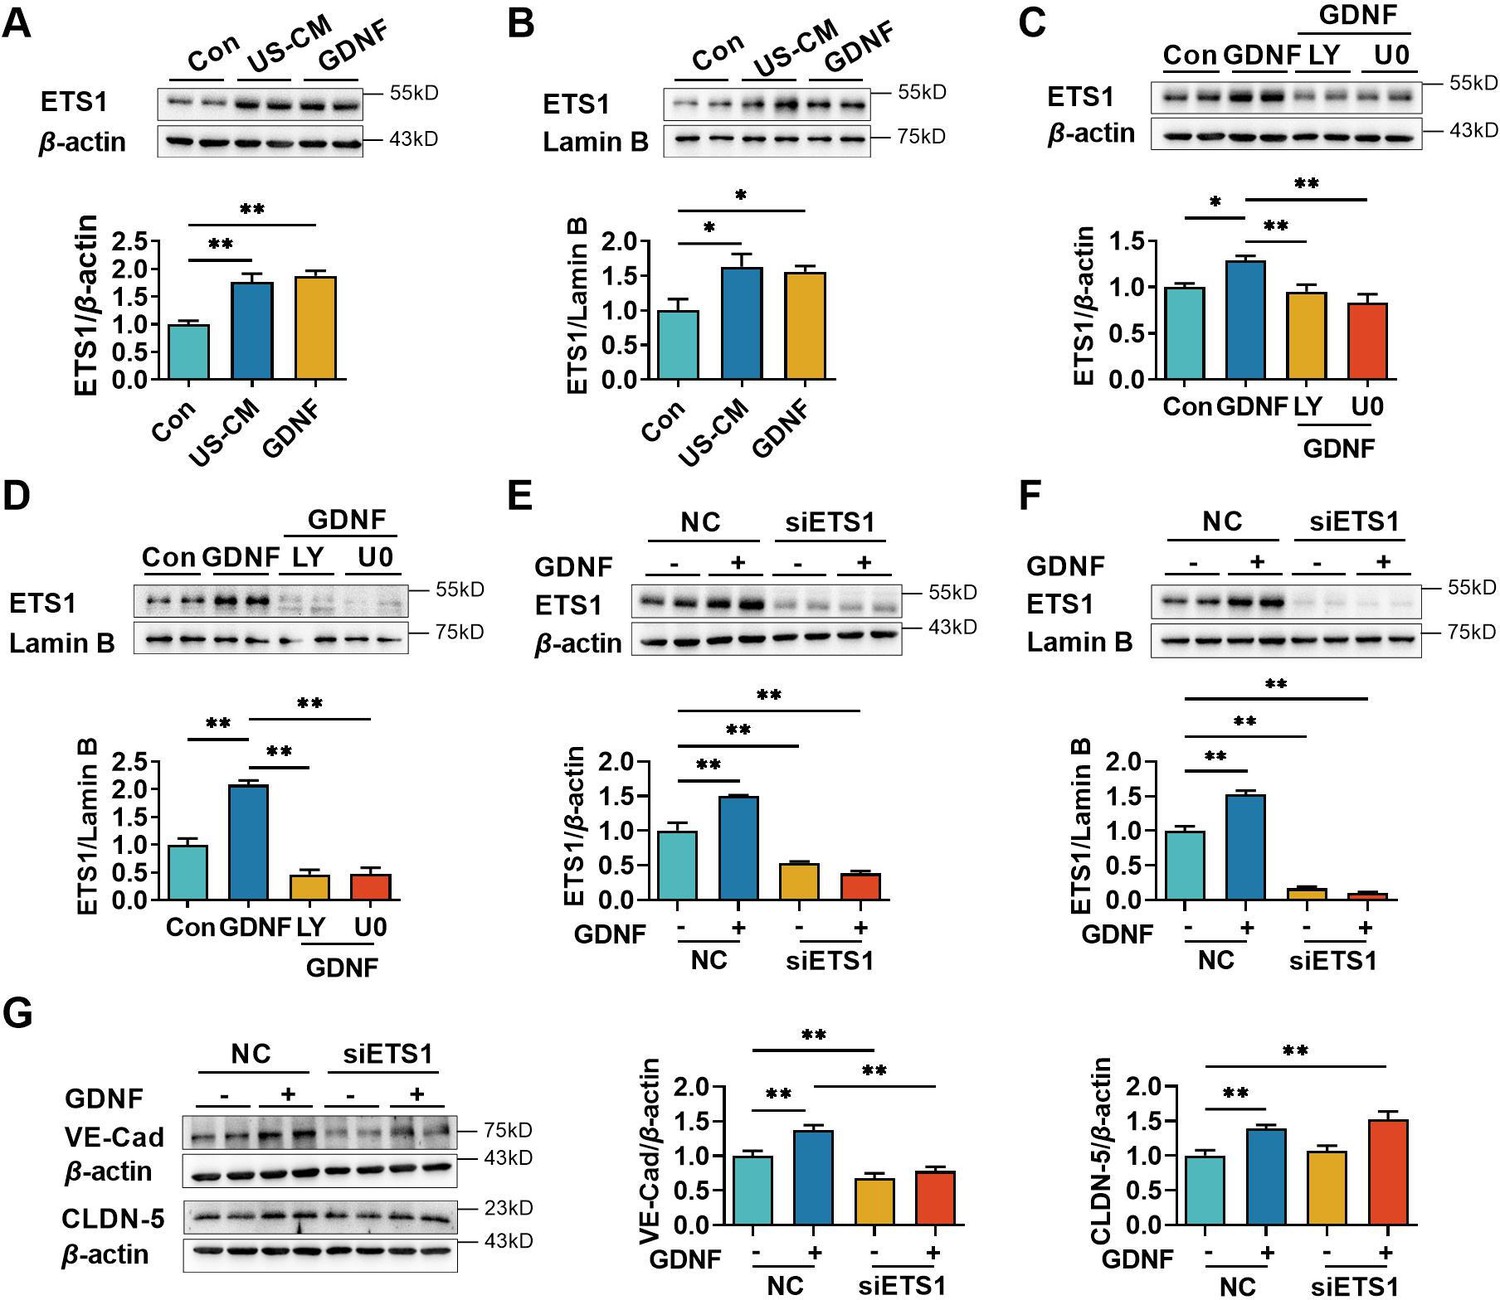
Glial cell line-derived neurotrophic factor (GDNF)-induced VE-cadherin expression in hCMEC/D3 cells by activating the PI3K/AKT/ETS1 and MAPK/ERK/ETS1 pathways.
Effects of US-CM and GDNF on total (A) and nuclear (B) ETS1 expression. Effects of LY and U0 on 200 pg/ml GDNF-induced total (C) and nuclear (D) ETS1 expression. Expression levels of total (E) and the nuclear ETS1 (F) in hCMEC/D3 cells after knocking down ETS1 with siRNA (siETS1). (G) Effects of GDNF and siETS1 on the expression of VE-cadherin and claudin-5. The above data are shown as the mean ± SEM. Four biological replicates per group. One technical replicate for each biological replicate. *p < 0.05; **p < 0.01 by one-way ANOVA test followed by Fisher’s LSD test.
-
Figure 5—source data 1
The western blot raw images in Figure 5.
- https://cdn.elifesciences.org/articles/96161/elife-96161-fig5-data1-v1.zip
-
Figure 5—source data 2
The labeled western blot images in Figure 5.
- https://cdn.elifesciences.org/articles/96161/elife-96161-fig5-data2-v1.zip
-
Figure 5—source data 3
Excel file containing summary data and data analysis of Figure 5.
- https://cdn.elifesciences.org/articles/96161/elife-96161-fig5-data3-v1.xlsx
Figure 6

The deficiency of brain glial cell line-derived neurotrophic factor (GDNF) in mice increased the permeability of blood–brain barrier (BBB) and reduced claudin-5 and VE-cadherin expression in mice brains.
(A) Experimental configuration of AAV-GFP (shNC) or AAV-shGdnf (shGdnf) intracerebroventricular injection. (B) Effects of brain-specific Gdnf silencing on the expression levels of GDNF, claudin-5, and VE-cadherin in the brains. Effects of brain-specific Gdnf silencing on NaF levels in plasma (C), brain (D), and the ratio of brain to plasma (E). Effects of brain-specific Gdnf silencing on FITC-Dex levels in plasma (F), brain (G), and the ratio of brain to plasma (H). The expression ratios of p-AKT/AKT (I), p-ERK/ERK (J), and p-FOXO1/FOXO1 (K) in the brains of Gdnf silencing mice. (L) The expression level of ETS1 in the brains of Gdnf silencing mice. The above data are shown as the mean ± SEM. Six biological replicates per group. One technical replicate for each biological replicate. *p < 0.05; **p < 0.01 by unpaired t-test, unpaired t-test with Welch’s correction, or Mann–Whitney test.
-
Figure 6—source data 1
The western blot raw images in Figure 6.
- https://cdn.elifesciences.org/articles/96161/elife-96161-fig6-data1-v1.zip
-
Figure 6—source data 2
The labeled western blot images in Figure 6.
- https://cdn.elifesciences.org/articles/96161/elife-96161-fig6-data2-v1.zip
-
Figure 6—source data 3
Excel file containing summary data and data analysis of Figure 6.
- https://cdn.elifesciences.org/articles/96161/elife-96161-fig6-data3-v1.xlsx
Figure 7
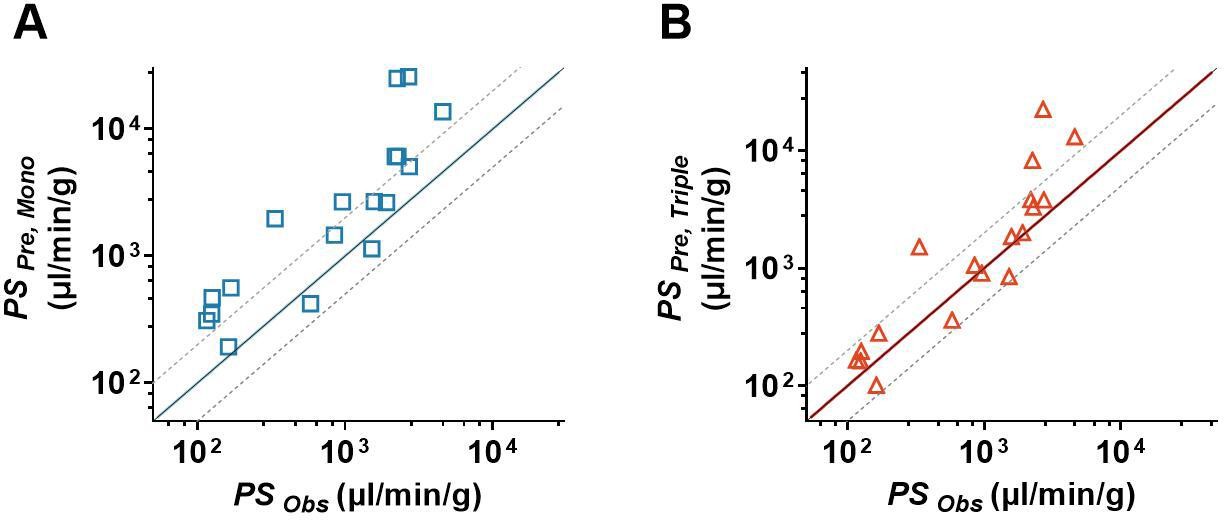
In vitro/in vivo correlation assay of blood–brain barrier (BBB) permeability.
(A) The comparison of the estimated permeability coefficient-surface area product (PSPre, Mono) recalculated from Papp, Mono with the observed in vivo PS values (PSObs). (B) The comparison of the estimated permeability coefficient-surface area product (PSPre, Triple) recalculated from Papp, Triple with the observed in vivo PS values (PSObs). The solid line represents a perfect prediction, and the dashed lines represent the 0.5- to 2-folds of their observations. The PSObs values were determined by in situ brain perfusion in rodents, which were collected from the literature.
Figure 8
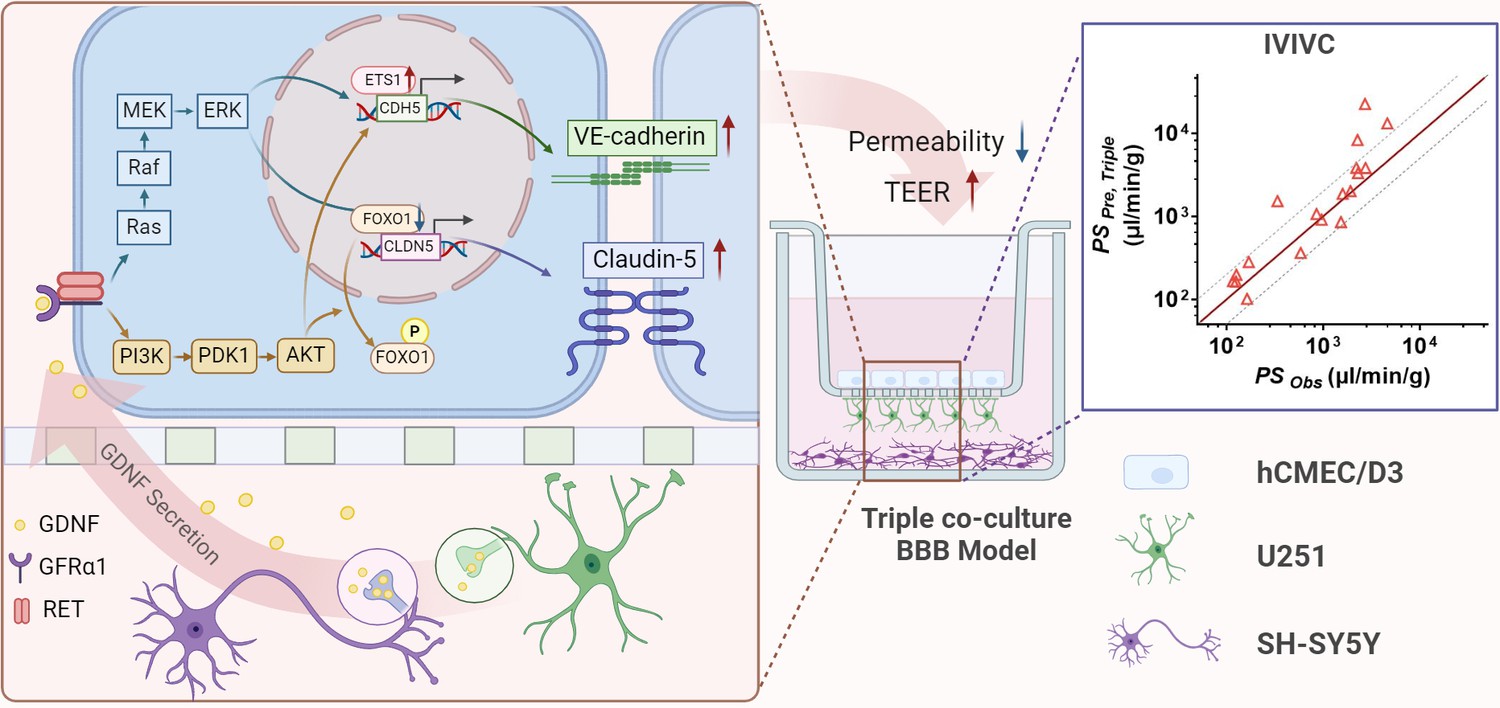
The mechanism of neurons and astrocytes induced the integrity of brain endothelial cells.
Neurons but also astrocytes trigger the activation of PI3K/AKT and MAPK/ERK pathways in brain endothelial cells by glial cell line-derived neurotrophic factor (GDNF) secretion, which in turn regulates transcription factors of claudin-5 (FOXO1) and VE-cadherin (ETS1) to promote claudin-5 and VE-cadherin expression and leads to the enhancement of blood–brain barrier (BBB) integrity. Meanwhile, with the increase in barrier integrity, the in vitro BBB model also obtained a stronger in vivo correlation.
Figure 9
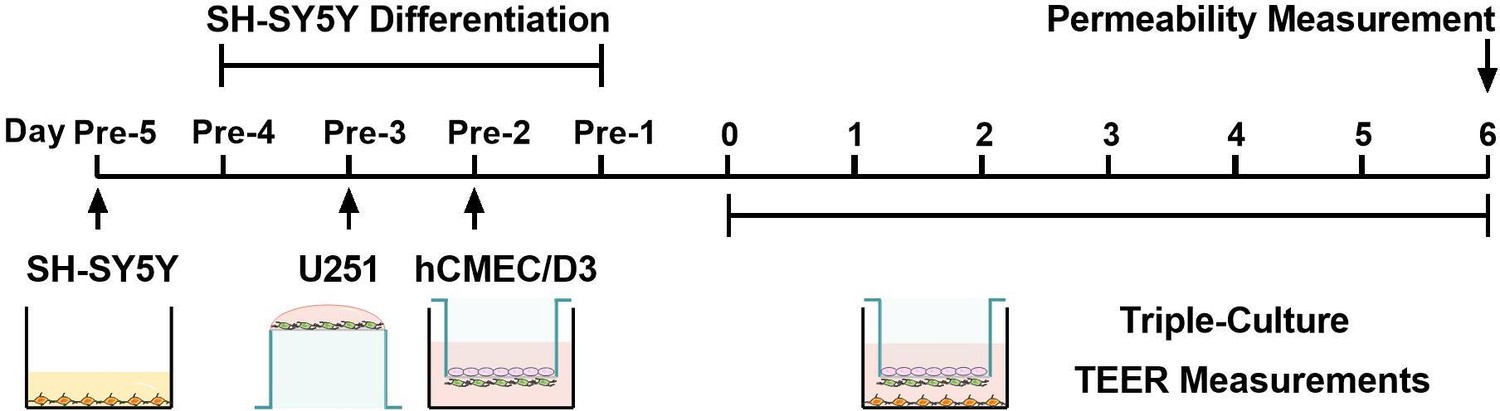
Schematic diagram of the establishment process of the triple co-culture blood–brain barrier (BBB) model.
Tables
Table 1
The unbound fraction in brain (fu, brain), the observed PSObs, and the predicted PS (PSPre), Papp across the hCMEC/D3 mono-culture model (Papp, Mono) and triple co-culture model (Papp, Triple) of the tested drugs.
| Compounds | fu, brain | PSObsμl/min/g | Papp, Mono cm/s × 10−6 | PSPre, Monoμl/min/g | Papp, Triple cm/s × 10−6 | PSPre, Tripleμl/min/g |
|---|---|---|---|---|---|---|
| Amantadine | 0.1985* | 116.10† | 6.84 ± 0.95 | 310.22 | 3.64 ± 0.26 | 165.23 |
| Amitriptyline | 0.01‡ | 4608.00*** | 15.24 ± 0.64 | 13,716.00 | 14.61 ± 0.27 | 13,149.00 |
| Bupropion | 0.12§ | 1519.20† | 15.19 ± 0.20 | 1139.58 | 11.34 ± 0.44 | 850.58 |
| Carbamazepine | 0.116¶ | 959.40† | 34.37 ± 1.26 | 2666.89 | 11.71 ± 0.15 | 908.69 |
| Clozapine | 0.014** | 2260.80† | 38.97 ± 0.54 | 25,052.57 | 12.87 ± 2.06 | 8272.72 |
| Donepezil | 0.07†† | 1581.30† | 20.91 ± 0.75 | 2688.43 | 14.47 ± 0.84 | 1860.43 |
| Doxepin | 0.025† | 2192.40† | 16.88 ± 1.08 | 6076.80 | 10.66 ± 0.92 | 3837.60 |
| Fluoxetine | 0.004† | 2698.20† | 11.48 ± 0.85 | 25,830.00 | 9.97 ± 1.03 | 22,430.25 |
| Gabapentin | 0.782† | 162.90† | 16.75 ± 1.62 | 192.77 | 8.78 ± 0.23 | 101.05 |
| Lamotrigine | 0.273† | 126.00† | 14.26 ± 0.37 | 470.11 | 5.97 ± 0.11 | 196.88 |
| Metoclopramide | 0.365† | 125.10† | 14.14 ± 1.44 | 348.66 | 6.63 ± 0.42 | 163.41 |
| Midazolam | 0.045‡ ‡ | 2727.00† | 25.30 ± 1.00 | 5060.00 | 19.09 ± 0.24 | 3818.00 |
| Mirtazapine | 0.08† | 1912.50† | 23.44 ± 0.44 | 2637.00 | 17.86 ± 0.21 | 2009.25 |
| Olanzapine | 0.034† | 2279.70† | 22.91 ± 3.80 | 6064.41 | 12.49 ± 0.53 | 3306.18 |
| Prazosin | 0.09§ § | 169.20¶ ¶ | 5.61 ± 0.38 | 560.93 | 2.81 ± 0.52 | 280.99 |
| Risperidone | 0.099† | 849.60† | 16.10 ± 2.87 | 1463.64 | 11.70 ± 0.25 | 1063.64 |
| Venlafaxine | 0.205* | 584.10† | 9.58 ± 0.28 | 420.60 | 8.25 ± 0.36 | 362.02 |
| Verapamil | 0.033 ‡ | 335.70 ‡ | 7.21 ± 0.41 | 1965.24 | 5.56 ± 0.06 | 1517.67 |
-
One technical replicate of four biological replicates per group.
-
*
-
†
-
‡
-
§
-
¶
-
**
-
††
-
‡ ‡
-
§ §
-
¶ ¶
-
***
-
Table 1—source data 1
The apparent permeability coefficients of 18 tested drugs from mono- or triple- culture blood–brain barrier (BBB) model.
- https://cdn.elifesciences.org/articles/96161/elife-96161-table1-data1-v1.xlsx
Key resources table
| Reagent type (species) or resource | Designation | Source or reference | Identifiers | Additional information |
|---|---|---|---|---|
| Antibody | β-Actin (mouse monoclonal) | Proteintech | 66009 RRID:AB_2883475 | 1:10,000 |
| Antibody | GAPDH (mouse monoclonal) | Absin | Abs830030ss RRID:AB_2811228 | 1:50,000 |
| Antibody | β-Tubulin (mouse monoclonal) | Fdbio Science | FD0064 RRID:AB_3076327 | 1:10,000 |
| Antibody | Lamin B (mouse monoclonal) | Proteintech | 66095 RRID:AB_2721256 | 1:10,000 |
| Antibody | Claudin-5 (rabbit polyclonal) | Wanleibio | WL03731 RRID:AB_3076320 | 1:1000 |
| Antibody | Occludin (rabbit polyclonal) | Wanleibio | WL01996 RRID:AB_3076325 | 1:500 |
| Antibody | ZO-1 (mouse polyclonal) | Proteintech | 21773-1-AP RRID:AB_10733242 | 1:5000 |
| Antibody | VE-cadherin (rabbit polyclonal) | Wanleibio | WL02033 RRID:AB_3076321 | 1:1000 |
| Antibody | β-Catenin (rabbit polyclonal) | Wanleibio | WL0962a RRID:AB_3076323 | 1:5000 |
| Antibody | BCPR (rabbit polyclonal) | CST | 4477S RRID:AB_10544928 | 1:1000 |
| Antibody | P-gp (rabbit monoclonal) | CST | 13978S RRID:AB_2798357 | 1:1500 |
| Antibody | p-AKT (mouse monoclonal) | Huaan Biotechnology | ET1607 RRID:AB_2940863 | 1:2000 |
| Antibody | AKT (mouse monoclonal) | Huaan Biotechnology | ET1609 RRID:AB_3069857 | 1:2000 |
| Antibody | p-ERK (rabbit polyclonal) | Proteintech | 28733-1-AP RRID:AB_2881202 | 1:1000 |
| Antibody | ERK (rabbit polyclonal) | Proteintech | 11257-1-AP RRID:AB_2139822 | 1:1000 |
| Antibody | p-p38 (rabbit monoclonal) | CST | 4511S RRID:AB_10890701 | 1:250 |
| Antibody | p38 (rabbit monoclonal) | CST | 8690S RRID:AB_10999090 | 1:250 |
| Antibody | p-JNK (rabbit polyclonal) | Wanleibio | WL01813 RRID:AB_2910628 | 1:1000 |
| Antibody | JNK (rabbit polyclonal) | Wanleibio | WL01295 RRID:AB_3064853 | 1:1000 |
| Antibody | FOXO1 (rabbit polyclonal) | Proteintech | 18592 RRID:AB_2934932 | 1:1000 |
| Antibody | p-FOXO1 (rabbit polyclonal) | Wanleibio | WL03634 RRID: AB_3076326 | 1:1000 |
| Antibody | ETS1 (mouse monoclonal) | Santa Cruz | sc-55581 RRID:AB_831289 | 1:500 |
| Antibody | ETS1 (mouse monoclonal) | Proteintech | 66598 RRID:AB_2881958 | 1:3000 |
| Cell line (Homo sapiens) | hCMEC/D3 cells | JENNIO Biological Technology, Guangzhou, China | Cat#JNO-H0520 RRID:CVCL_U985 | Authenticated (STR profiling) |
| Cell line (H. sapiens) | U251 cells | Cellcook Biological Technology, Guangzhou, China | Cat#CC1701 RRID:CVCL_0021 | Authenticated (STR profiling) |
| Cell line (H. sapiens) | SH-SY5Y cells | Cellcook Biological Technology, Guangzhou, China | Cat#CC2101 RRID:CVCL_0019 | Authenticated (STR profiling) |
| Software, algorithm | GraphPad Prism | Version 8.0.2 | RRID:SCR_002798 | |
| Software, algorithm | BioTek Cytation 5 Cell Imaging Multi-Mode Reader | BioTek Cytation 5 | RRID:SCR_019732 | |
| Software, algorithm | QuantStudio 3 Real Time PCR System | QuantStudio 3 | RRID:SCR_018712 | |
| Software, algorithm | FACS Celesta Flow Cytometer | BD Biosciences | RRID:SCR_019597 | |
| Software, algorithm | Flowjo software | Version 10.4 | RRID:SCR_008520 | |
| Commercial assay or kit | GDNF-Elisa kit | R&D system RRID:SCR_006140 | Cat#212-GD | |
| Commercial assay or kit | bFGF-Elisa kit | Elabscience RRID:SCR_025982 | Cat#E-EL-H6042 | |
| Commercial assay or kit | IGF-1-Elisa kit | Elabscience RRID:SCR_025982 | Cat#E-EL-H0086 | |
| Commercial assay or kit | TGF-β-Elisa kit | Elabscience RRID:SCR_025982 | Cat#E-EL-0162 | |
| Peptide, recombinant protein | GDNF | R&D system RRID:SCR_006140 | Cat#212-GD | |
| Peptide, recombinant protein | bFGF | MedChemExpress RRID:SCR_025062 | Cat#HY-P7331 | |
| Peptide, recombinant protein | IGF-1 | MedChemExpress RRID:SCR_025062 | Cat#HY-P70783 | |
| Peptide, recombinant protein | TGF-β | MedChemExpress RRID:SCR_025062 | Cat#HY-P70543 | |
| Chemical compound, drug | SPP-86 | MedChemExpress RRID:SCR_025062 | Cat#HY-110193 | |
| Chemical compound, drug | PP2 | MedChemExpress RRID:SCR_025062 | Cat#HY-13805 | |
| Chemical compound, drug | LY294002 | MedChemExpress RRID:SCR_025062 | Cat#HY-10108 | |
| Chemical compound, drug | U0126 | MedChemExpress RRID:SCR_025062 | Cat#S1102 | |
| Chemical compound, drug | SP600125 | Selleck RRID:SCR_003823 | Cat#HY-12041 | |
| Chemical compound, drug | SB203580 | MedChemExpress RRID:SCR_025062 | Cat#HY-10256 |
Table 2
Initial concentrations in donor chamber and chromatographic conditions of prazosin, verapamil, and lamotrigine.
| Compound | Concentration (μM) | Wavelength (nm) |
|---|---|---|
| Prazosin | 5 | Ex: 250 |
| Em: 390 | ||
| Verapamil | 5 | Ex: 280 |
| Em: 310 | ||
| Lamotrigine | 6 | 220 |
Table 3
The summary of mass charge ratio, extraction, initial concentrations in donor chamber.
| Compound | Concentration (μM) | Mass charge ratio[M+H]+ | Extraction |
|---|---|---|---|
| Amantadine | 3 | 181 | Water-saturated N-butanol |
| Amitriptyline | 1.5 | 278 | Ethyl acetate |
| Bupropion | 3 | 240 | Ethyl acetate |
| Carbamazepine | 3 | 237 | Ethyl acetate |
| Clozapine | 4 | 327 | Ethyl acetate |
| Donepezil | 3 | 380 | Methyl tert-butyl ether |
| Doxepin | 4 | 317 | Methyl tert-butyl ether |
| Fluoxetine | 3 | 310 | Ethyl acetate |
| Gabapentin | 10 | 172 | Ethyl acetate |
| Metoclopramide | 4 | 301 | Ethyl acetate |
| Midazolam | 3 | 327 | Ethyl acetate |
| Mirtazapine | 3 | 266 | Methyl tert-butyl ether |
| Olanzapine | 3 | 313 | Methyl tert-butyl ether |
| Risperidone | 4 | 427 | Methyl tert-butyl ether |
| Venlafaxine | 10 | 278 | Ethyl acetate |
Table 4
Primer sequences for quantitative real-time PCR (qPCR) for indicted genes.
| Gene (protein) | Forwards primer, 5′→3′ | Reverse primer, 3′→5′ |
|---|---|---|
| ACTB (β-actin) | GGACTTCGAGCAAGAGATGG | AGCACTGTGTTGGCGTACAG |
| GAPDH (GAPDH) | TGTGGGCATCAATGGATTTGG | ACACCATGTATTCCGGGTCAAT |
| CLDN5 (claudin-5) | CTCTGCTGGTTCGCCAACAT | CAGCTCGTACTTCTGCGACA |
| OCLN (occludin) | ACAAGCGGTTTTATCCAGAGTC | GTCATCCACAGGCGAAGTTAAT |
| TJP1 (ZO-1) | ACCAGTAAGTCGTCCTGATCC | TCGGCCAAATCTTCTCACTCC |
| CDH5 (VE-cadherin) | AAGCGTGAGTCGCAAGAATG | TCTCCAGGTTTTCGCCAGTG |
| ABCB1 (P-gp) | TTGCTGCTTACATTCAGGTTTCA | AGCCTATCTCCTGTCGCATTA |
| ABCG2 (BCRP) | ACGAACGGATTAACAGGGTCA | CTCCAGACACACCACGGAT |
| SLC22A1 (OCT1) | ACGGTGGCGATCATGTACC | CCCATTCTTTTGAGCGATGTGG |
| SLC22A2 (OCT2) | CATCGTCACCGAGTTTAACCTG | AGCCGATACTCATAGAGCCAAT |
| SLC22A8 (OAT3) | ATGGCCCAGTCTATCTTCATGG | GACGGTGCTCAGGGTAATGC |
| SLCO1A1 (OATP1A1) | TAATGTGGGTGTACGTCCTAGT | GCTCCTGTTTCTACAAGCCCAA |
| GDNF (GDNF) | GCAGACCCATCGCCTTTGAT | CCACACCTTTTAGCGGAATGC |
| BDNF (BDNF) | CTACGAGACCAAGTGCAATCC | AATCGCCAGCCAATTCTCTTT |
| NGF (NGF) | TGTGGGTTGGGGATAAGACCA | GCTGTCAACGGGATTTGGGT |
| IGF1 (IGF-1) | GCTCTTCAGTTCGTGTGTGGA | GGTCATGGATGGACCTTACTGT |
| VEGFA (VEGF) | CCCACTGAGGAGTCCAACAT | AAATGCTTTCTCCGCTCTGA |
| FGF2 (bFGF) | AGAAGAGCGACCCTCACATCA | CGGTTAGCACACACTCCTTTG |
| TGFB1 (TGF-β) | GGCCAGATCCTGTCCAAGC | GTGGGTTTCCACCATTAGCAC |
Table 5
The target sequences for small interfering RNA (siRNA) or short hairpin RNA (shRNA).
| Gene | Target sequence |
|---|---|
| ETS1 | CGCTATACCTCGGATTACT |
| FOXO1 | AATCTCCTAGGAGAAGAGCTG |
| Gdnf | GCCAGTGTTTATCTGATAC |
| CDH5 | GCCTCTGTCATGTACCAAA |
Additional files
Download links
A two-part list of links to download the article, or parts of the article, in various formats.
Downloads (link to download the article as PDF)
Open citations (links to open the citations from this article in various online reference manager services)
Cite this article (links to download the citations from this article in formats compatible with various reference manager tools)
Neurons enhance blood–brain barrier function via upregulating claudin-5 and VE-cadherin expression due to glial cell line-derived neurotrophic factor secretion
eLife 13:RP96161.
https://doi.org/10.7554/eLife.96161.3


