Systematic evaluation of multifactorial causal associations for Alzheimer’s disease and an interactive platform MRAD developed based on Mendelian randomization analysis
- Department of Pharmacology, College of Basic Medical Sciences, Jilin University, China
- Department of Neurology, Xuanwu Hospital, Capital Medical University, China
- Neurology and Intracranial Hypertension & Cerebral Venous Disease Center National Health Commission of China, Xuanwu Hospital, Capital Medical University, China
- School of Nursing, Jilin University, China
Figures
Figure 1
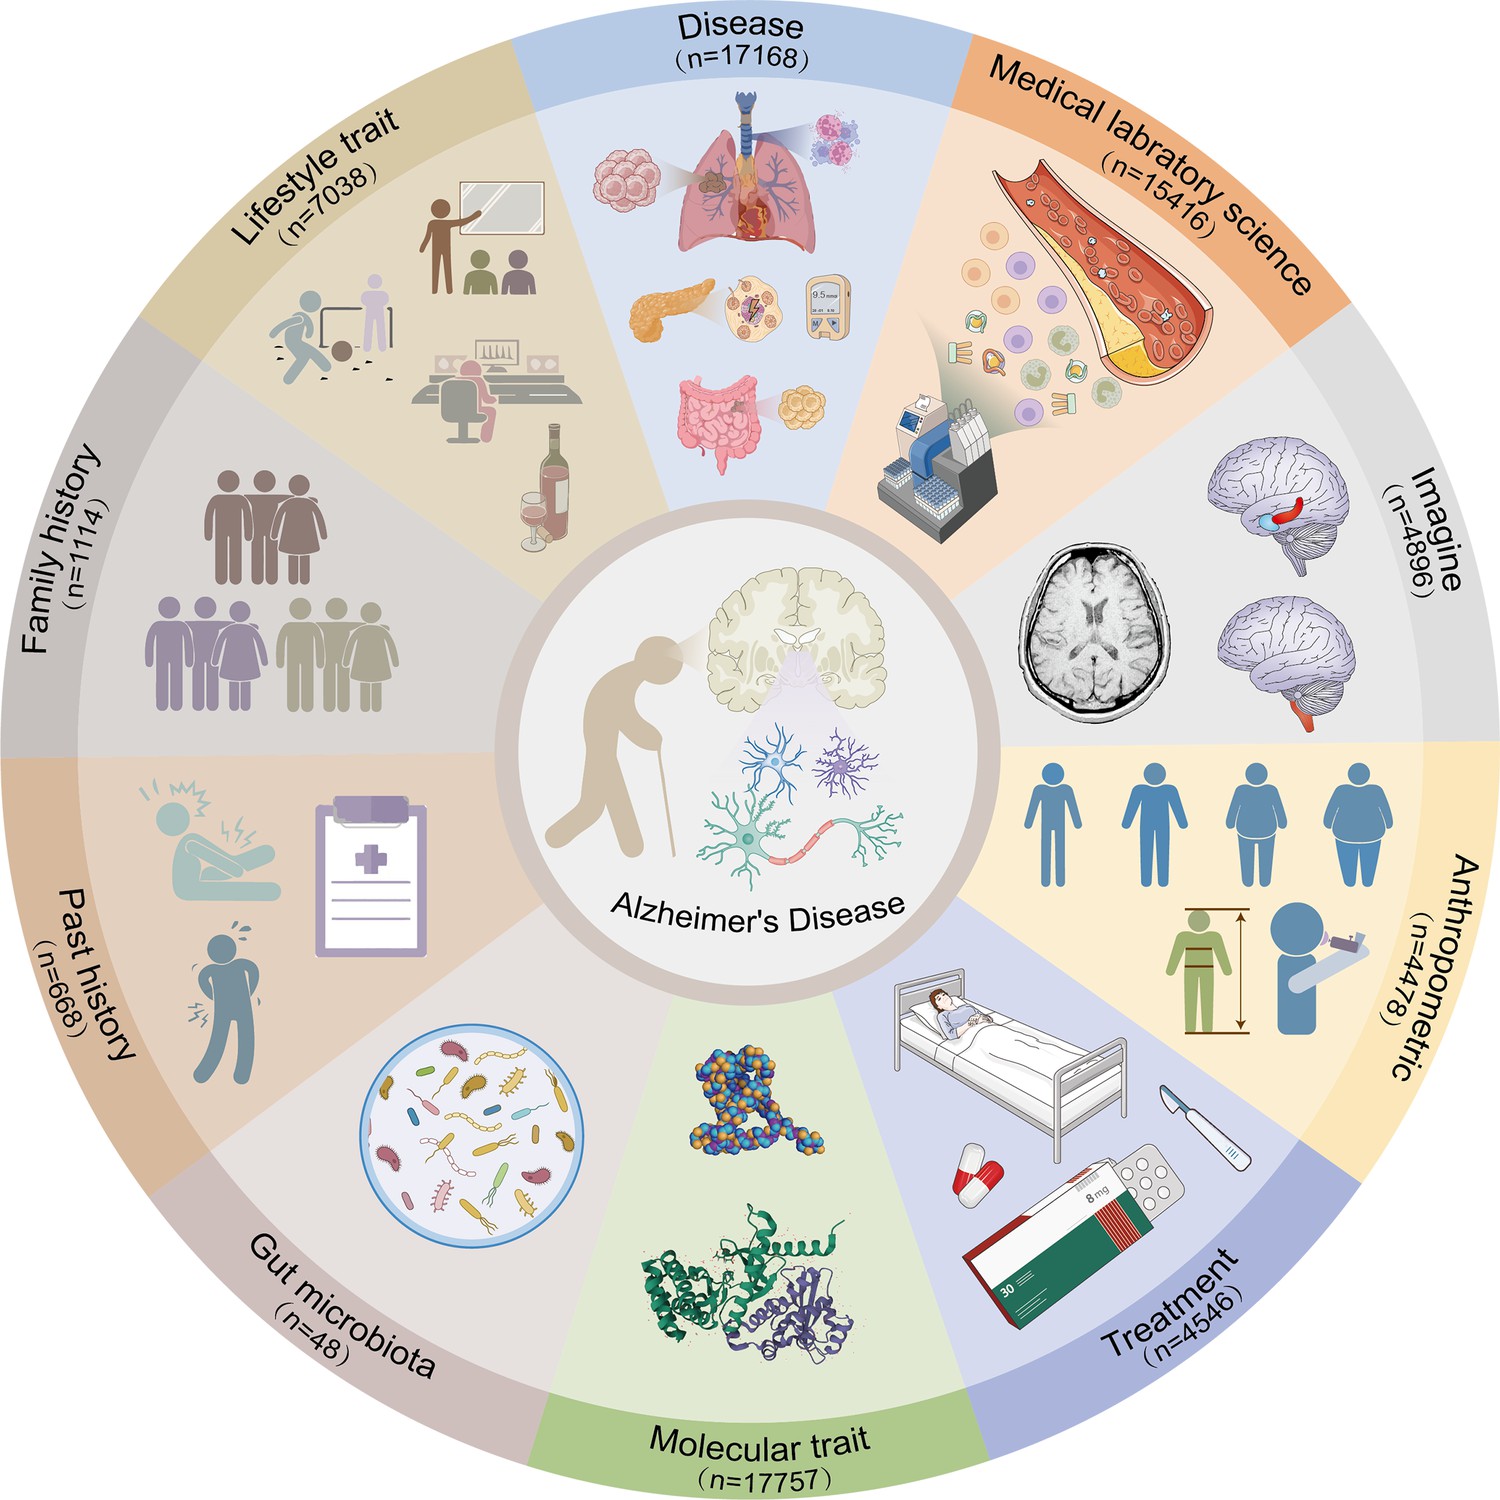
Categories of the exposure traits identified by the inverse-variance weighted (IVW) model.
Figure 2 with 4 supplements
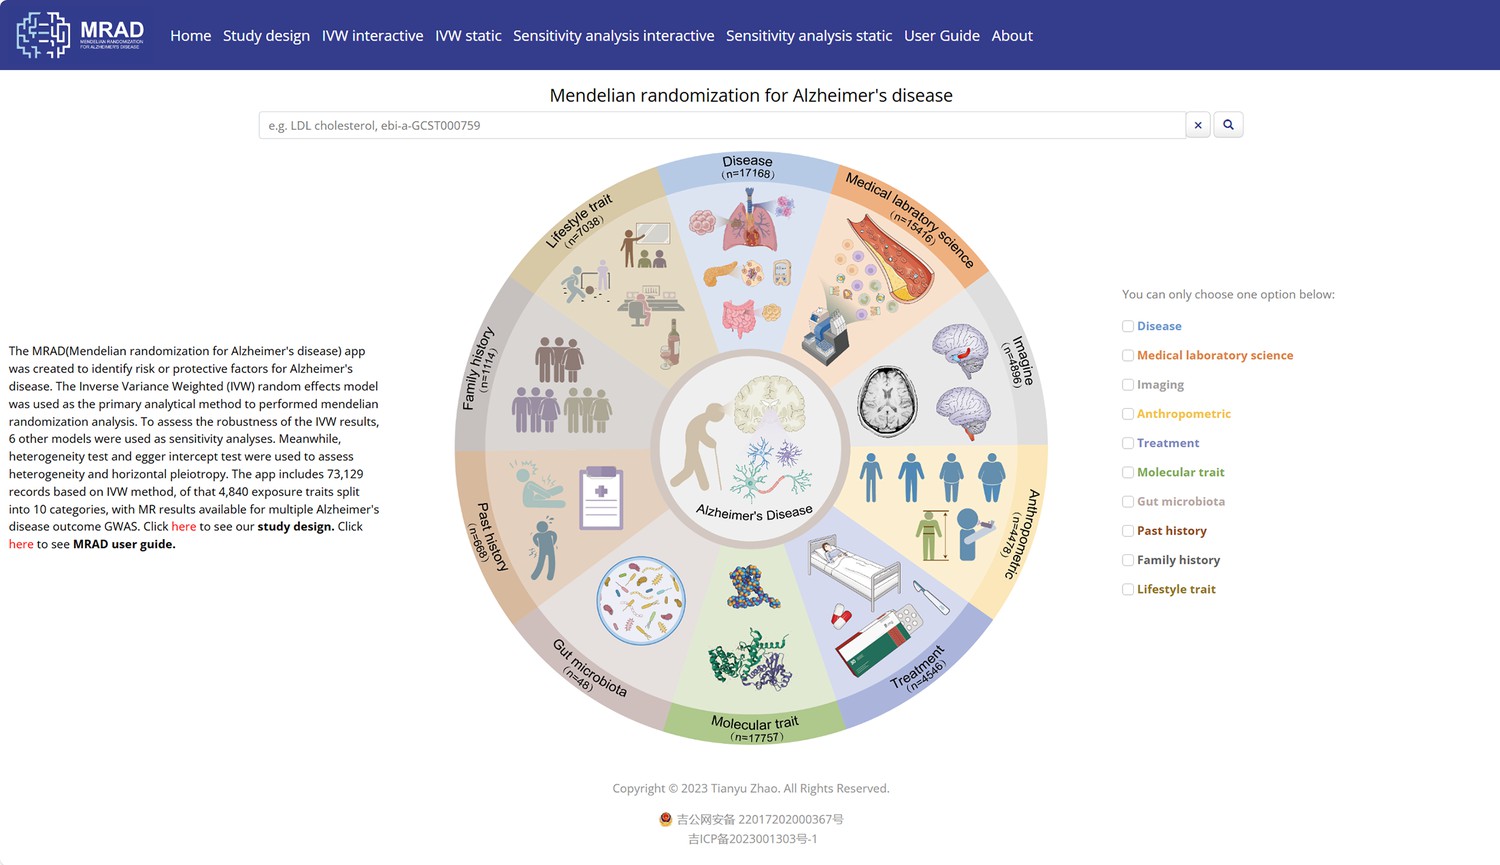
Home module.
-
Figure 2—source data 1
Inverse-variance weighted (IVW) interactive module.
- https://cdn.elifesciences.org/articles/96224/elife-96224-fig2-data1-v1.zip
-
Figure 2—source data 2
Sensitivity analysis interactive module.
- https://cdn.elifesciences.org/articles/96224/elife-96224-fig2-data2-v1.zip
Figure 2—figure supplement 1
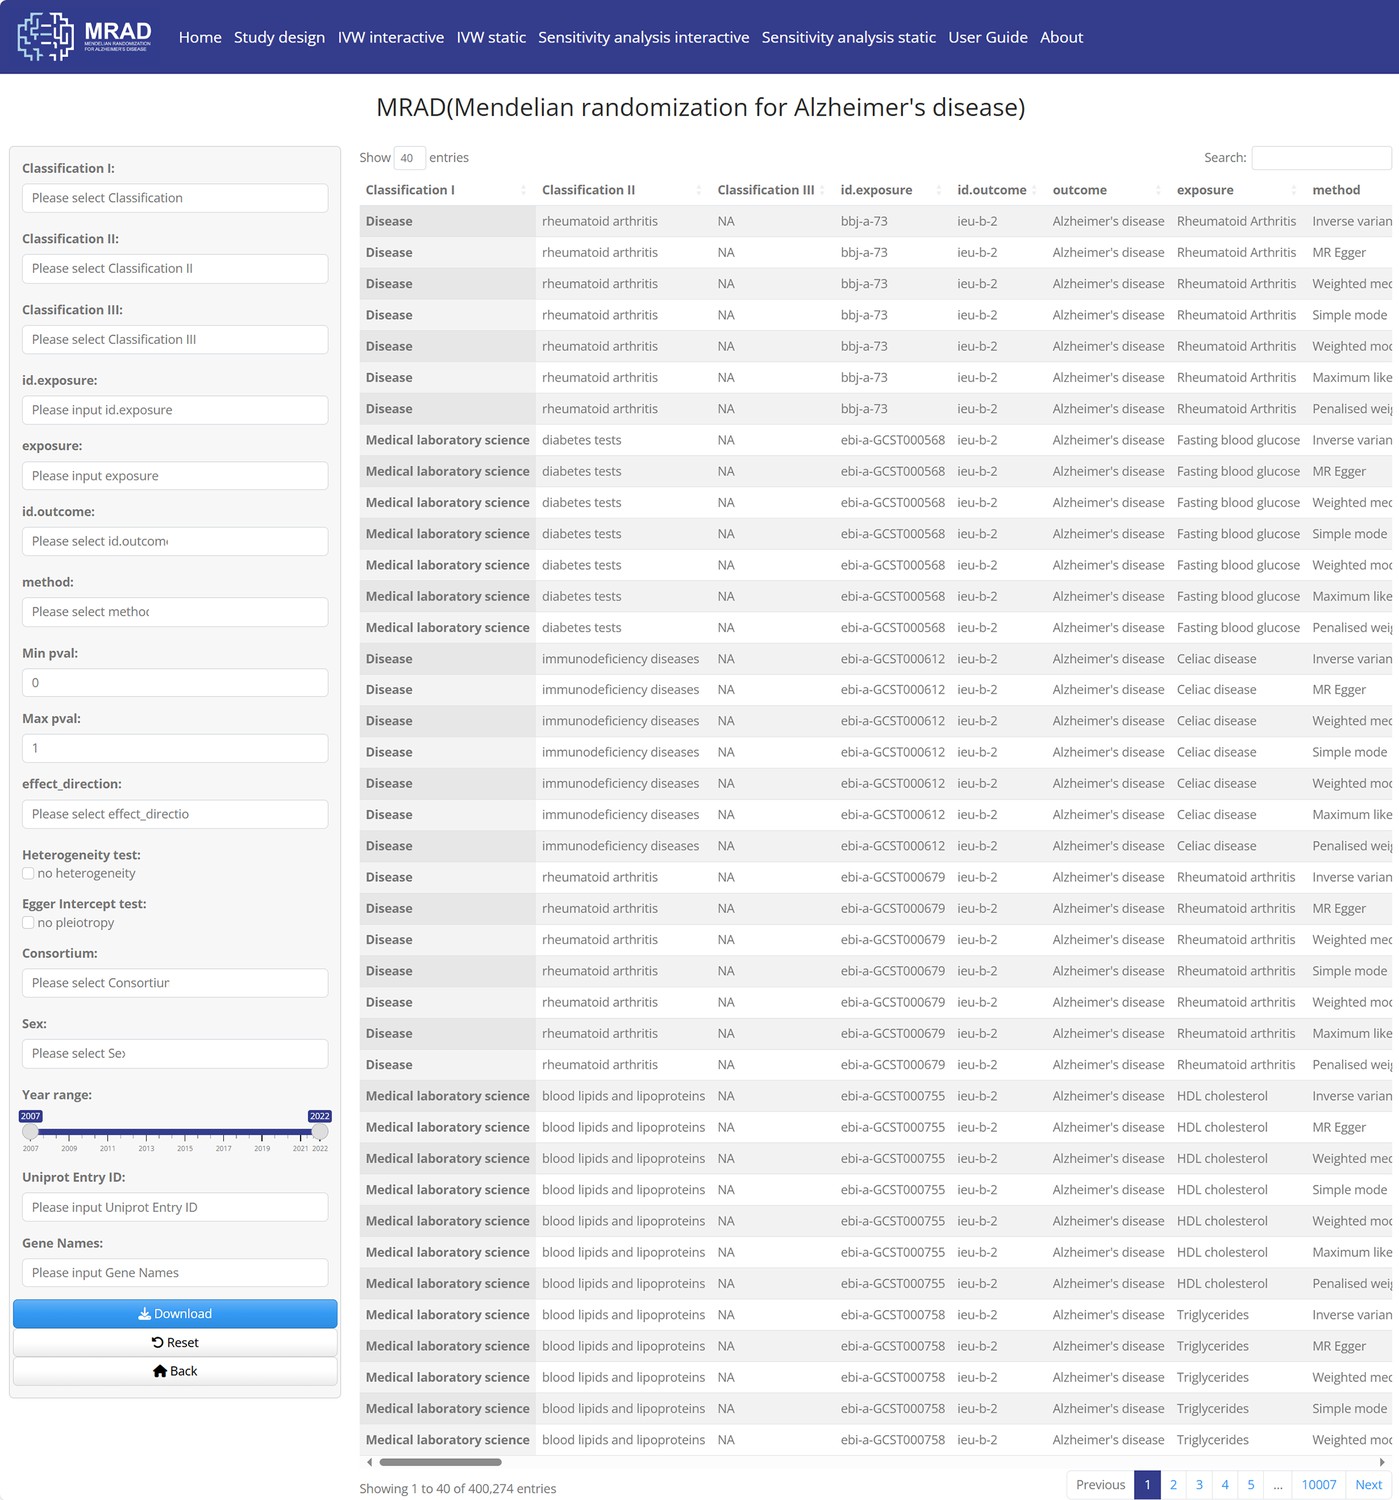
400,274 records search interface of Mendelian randomization for Alzheimer's disease (MRAD).
Figure 2—figure supplement 2
Study design module.
Figure 2—figure supplement 3
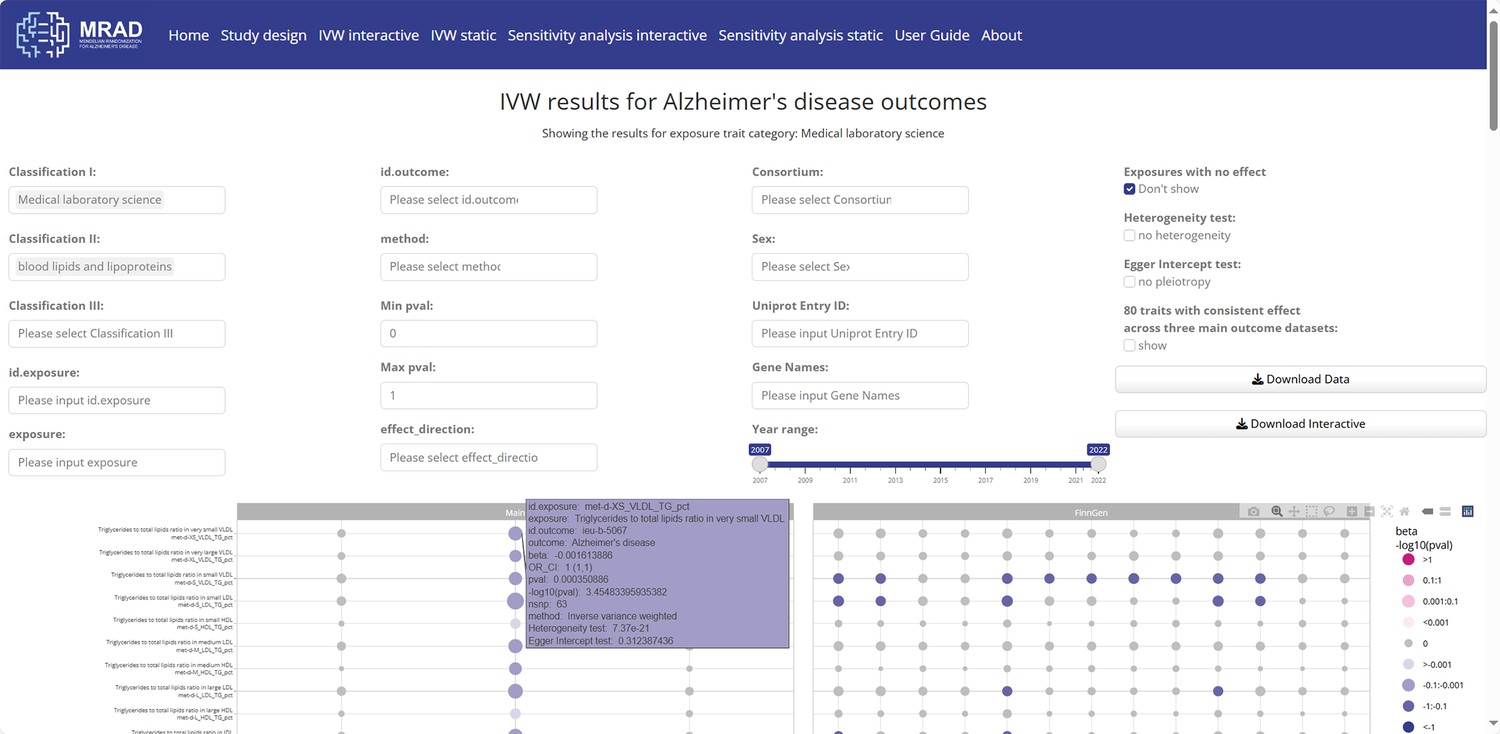
Interactive visual results in the inverse-variance weighted (IVW) interactive module.
Figure 2—figure supplement 4
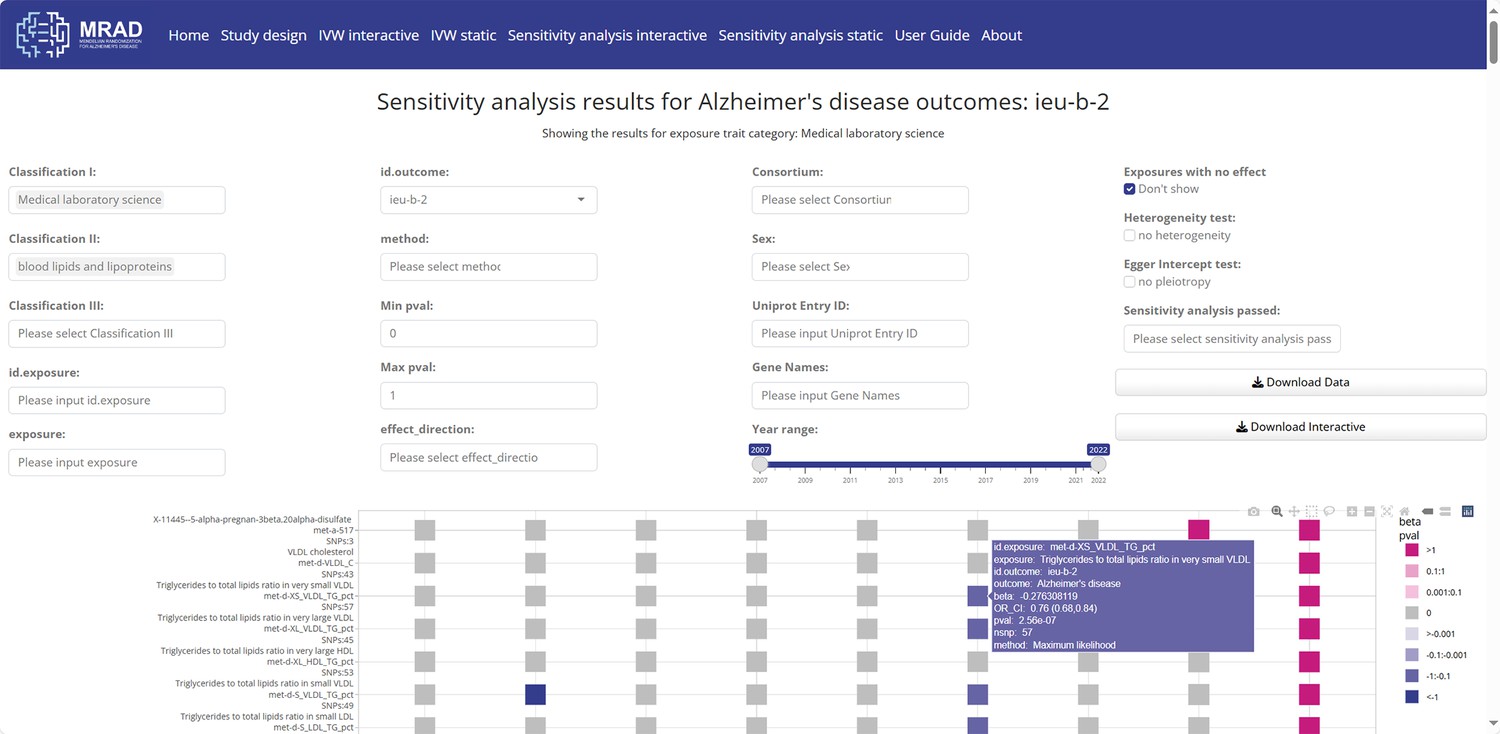
Interactive visual results in the sensitivity analysis interactive module.
Figure 3 with 8 supplements
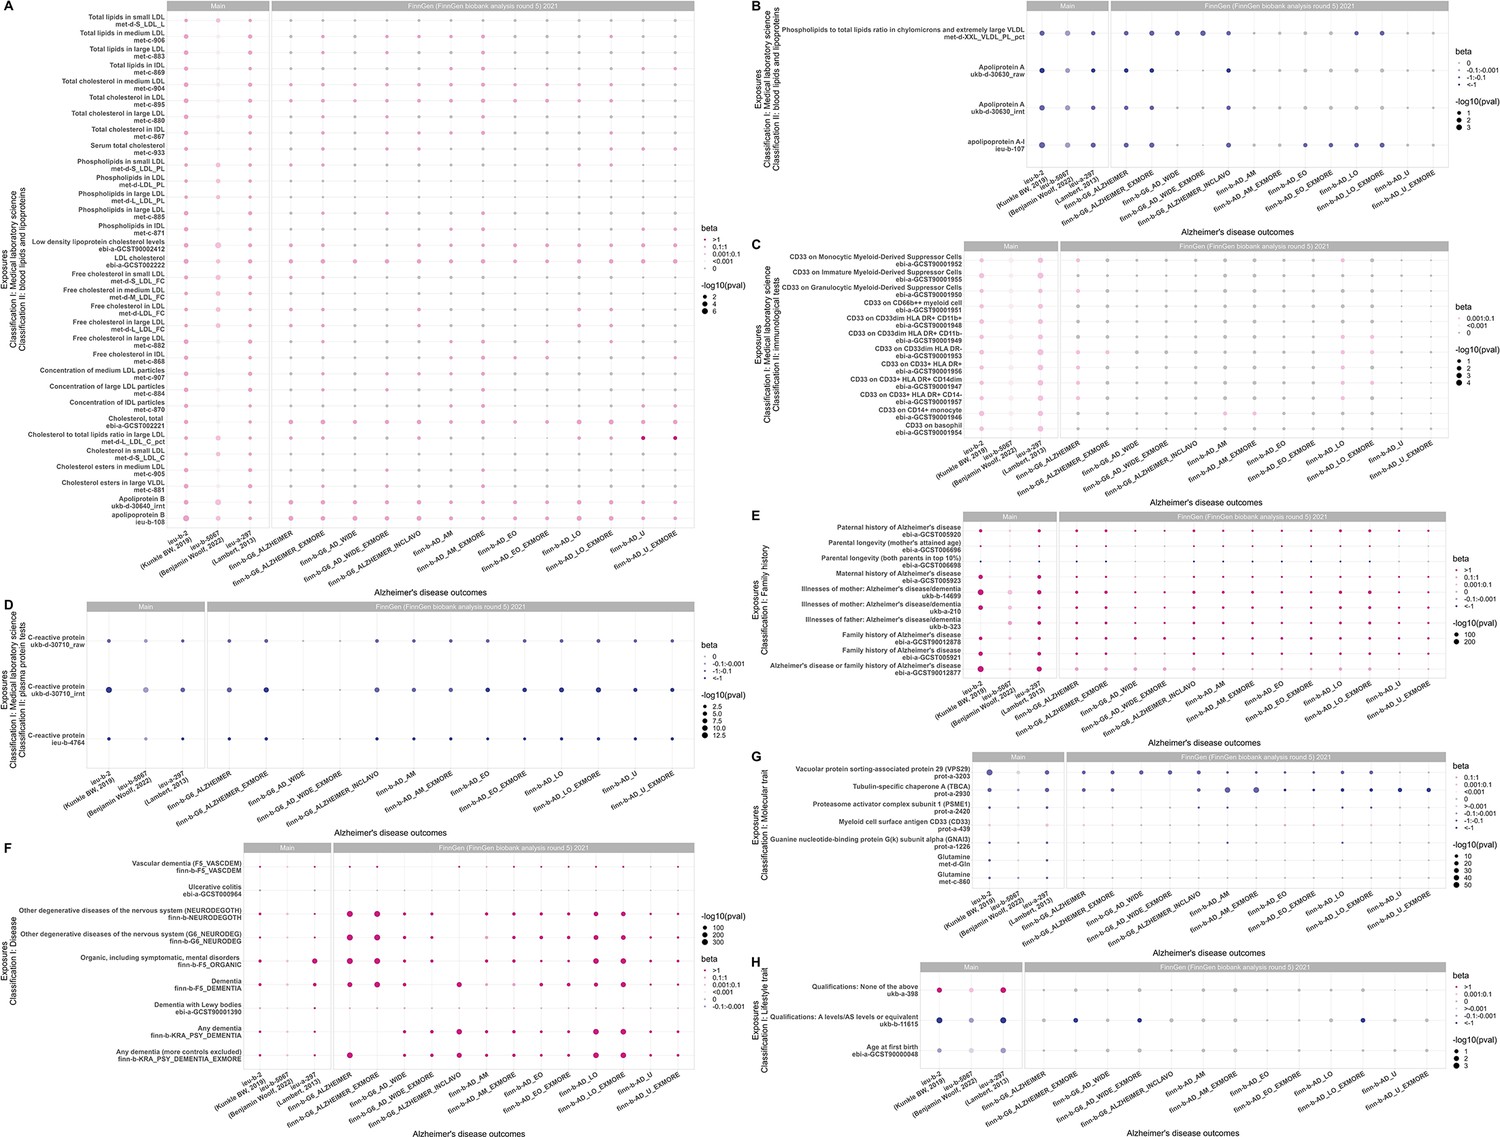
80 exposure traits with causal effects on the main outcome traits of Alzheimer's disease (AD) based on the major analysis method random-effects inverse-variance weighted (IVW) model.
(A) Thirty-two blood lipids and lipoproteins items that were positively associated with the main outcome traits of AD. (B) Four blood lipids and lipoproteins items that were negatively associated with the main outcome traits of AD. (C) Twelve immunological test items that were positively associated with the main outcome traits of AD. (D) Three plasma protein test items that were negatively associated with the main outcome traits of AD. (E) Ten family history items with causal effects on the main outcome traits of AD. (F) Nine disease items with causal effects on the main outcome traits of AD. (G). Seven molecular trait items with causal effects on the main outcome traits of AD. (H) Three lifestyle trait items with causal effects on the main outcome traits of AD. Note: The pink dots in the figure represent positive association, the blue dots in the figure represent negative association, with the color depth of the dots being positively proportional to the OR value (the darker the color, the larger the OR value), and the size of the dots being inversely proportional to the p-value (the smaller the p-value, the larger the dots). The gray dots represent no significant causal association (p>0.05).
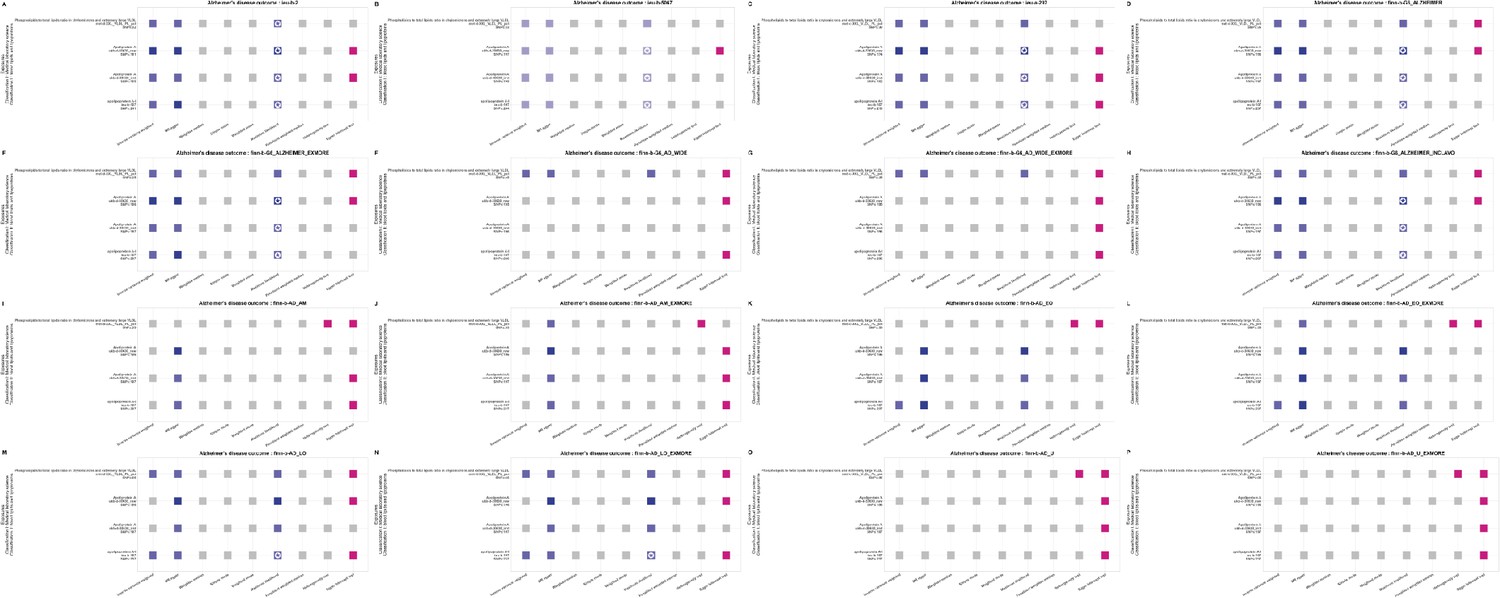
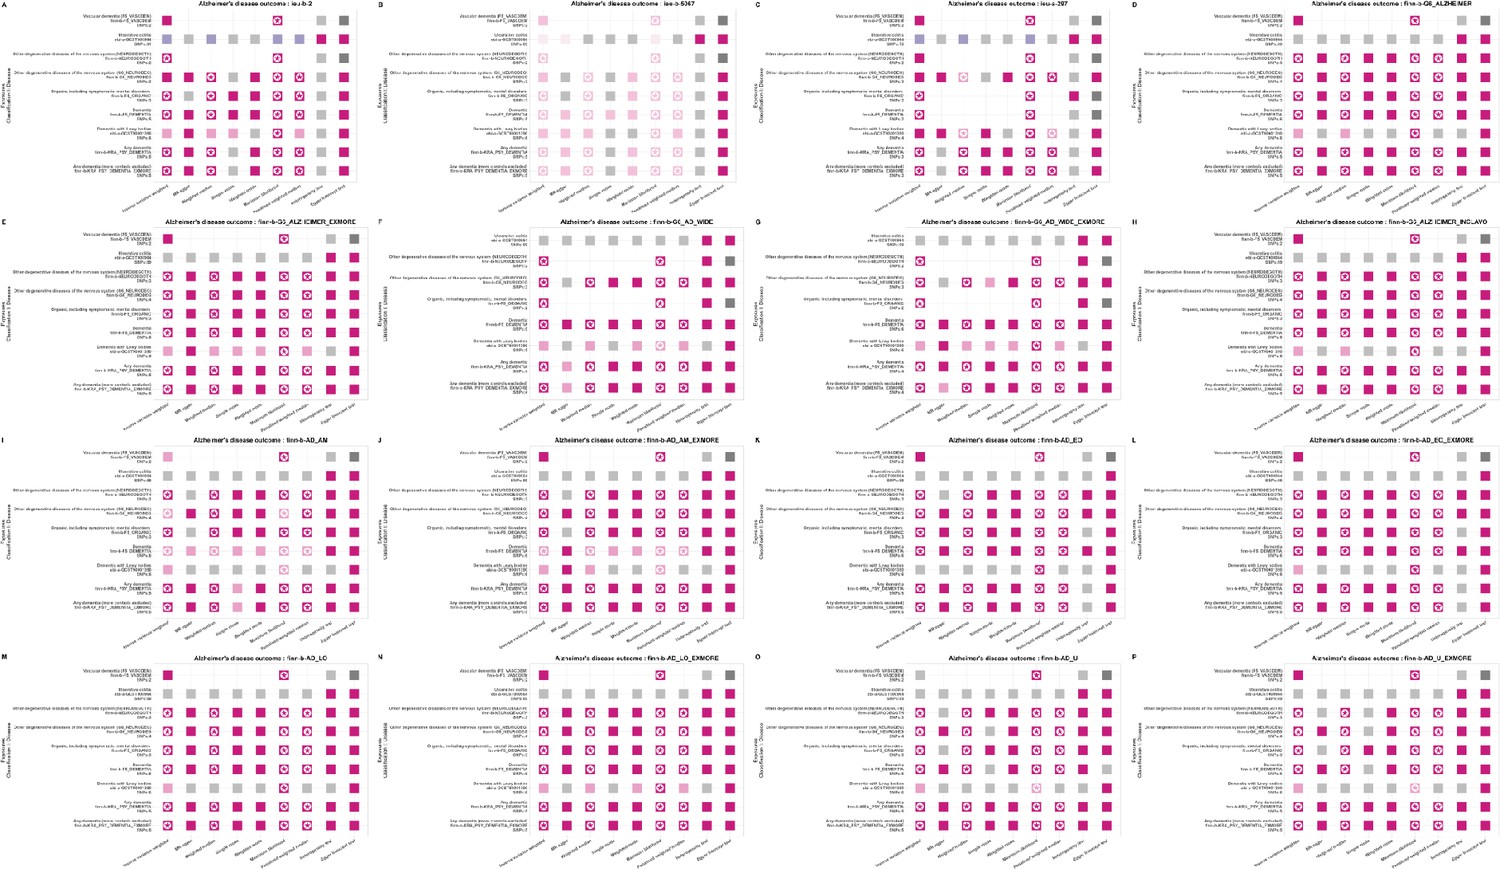
Figure 3—figure supplement 1
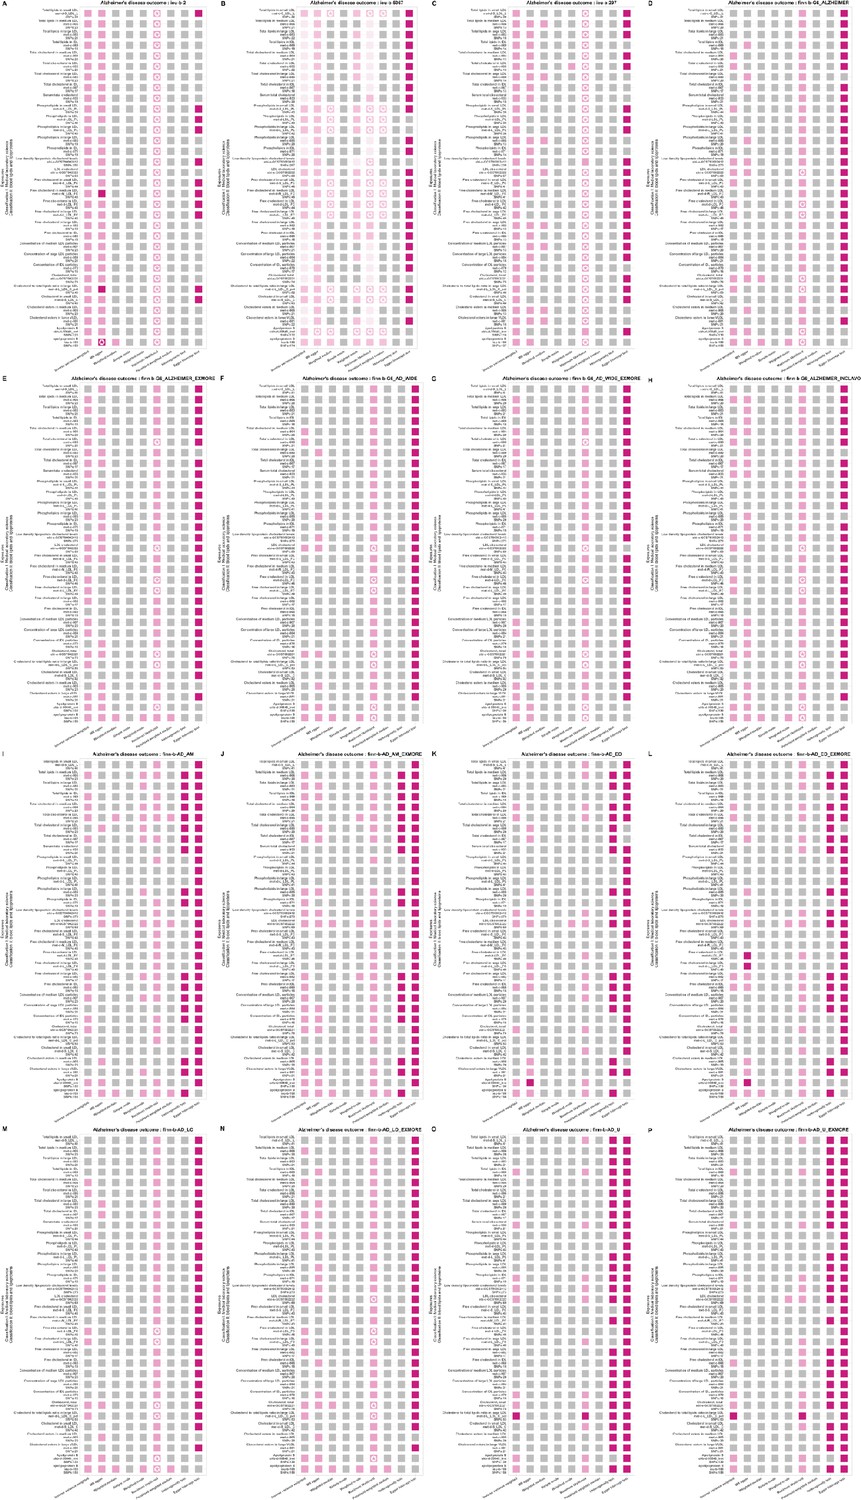
Statistical models for causal effect results of thirty-two blood lipids and lipoproteins items that were positively associated with the main outcome traits of Alzheimer's disease (AD).
Note: (i) For column Inverse variance weighted, Mendelian randomization (MR) egger, Weighted median, Simple mode, Weighted mode, Maximum likelihood, and Penalized weighted median: the pink dots in the figure represent positive association, the blue dots represent negative association, with the color depth of the dots being positively proportional to the odds ratio (OR) value (the darker the color, the larger the OR value), and the size of the dots being inversely proportional to the p-value (the smaller the p-value, the larger the dots). The gray dots represent no significant causal association (p>0.05). The star mark(✪) represents that is significant at the Bonferroni threshold (p<1.727e-07). (ii) For column Heterogeneity test: the pink dots in the figure represent the effect of heterogeneity was considered negligible (heterogeneity_pval >0.05). The gray dots represent significant association (p<0.05). (iii) For column Egger intercept test: the pink dots in the figure represent there was no significant difference between Egger Intercept and 0, indicating no horizontal pleiotropy (Horizontal_pval>0.05). The gray dots represent significant association (p<0.05). The dark gray dots are not applicable due to the quantity of single nucleotide polymorphism (SNP) being less than 3.
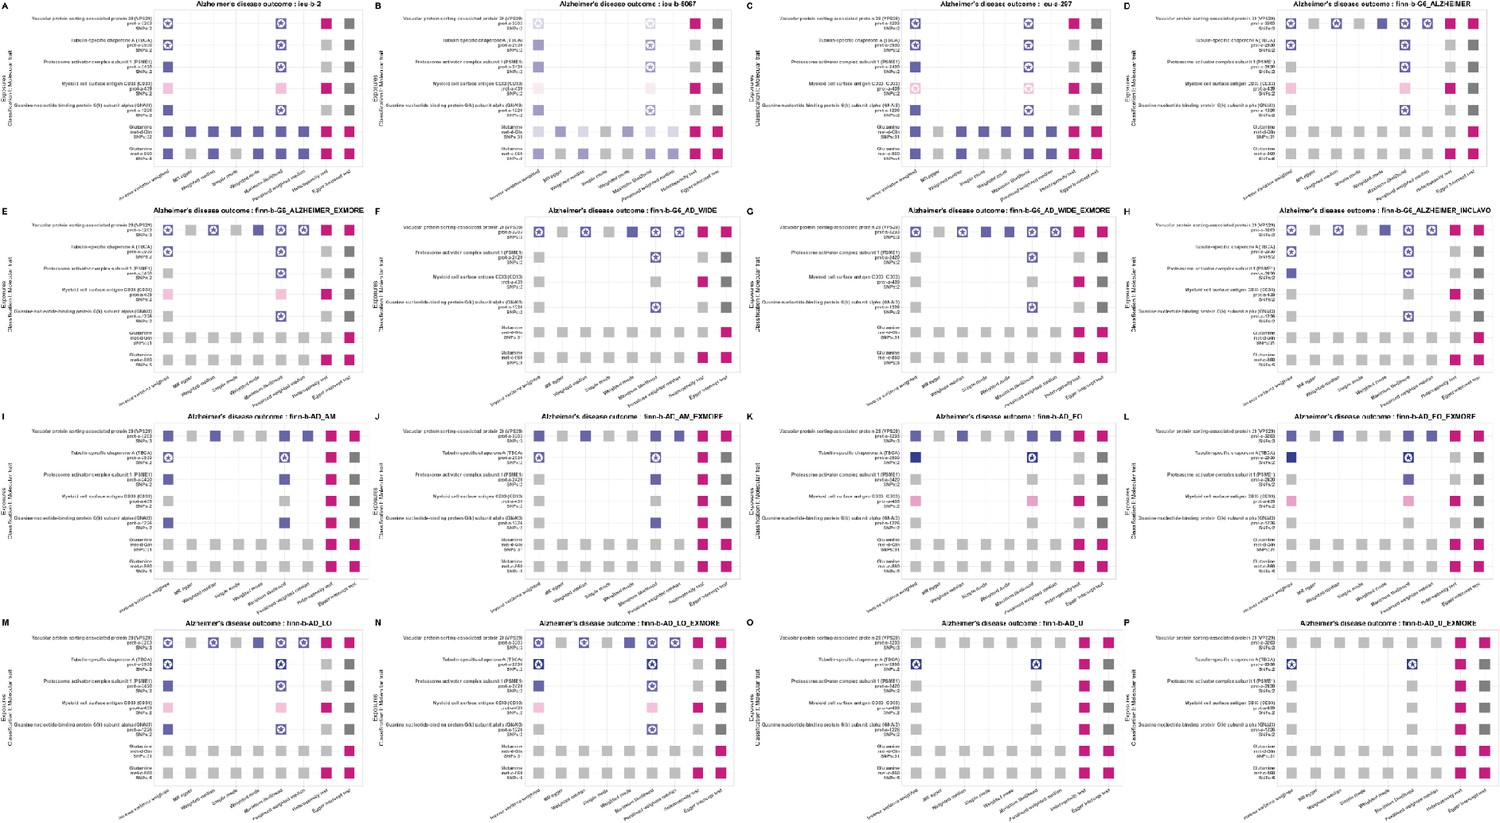
Figure 3—figure supplement 2
Statistical models for causal effect results of four blood lipids and lipoproteins items that were negatively associated with the main outcome traits of Alzheimer’s disease (AD).
The figure note follows that of Figure 3—figure supplement 1.
Figure 3—figure supplement 3
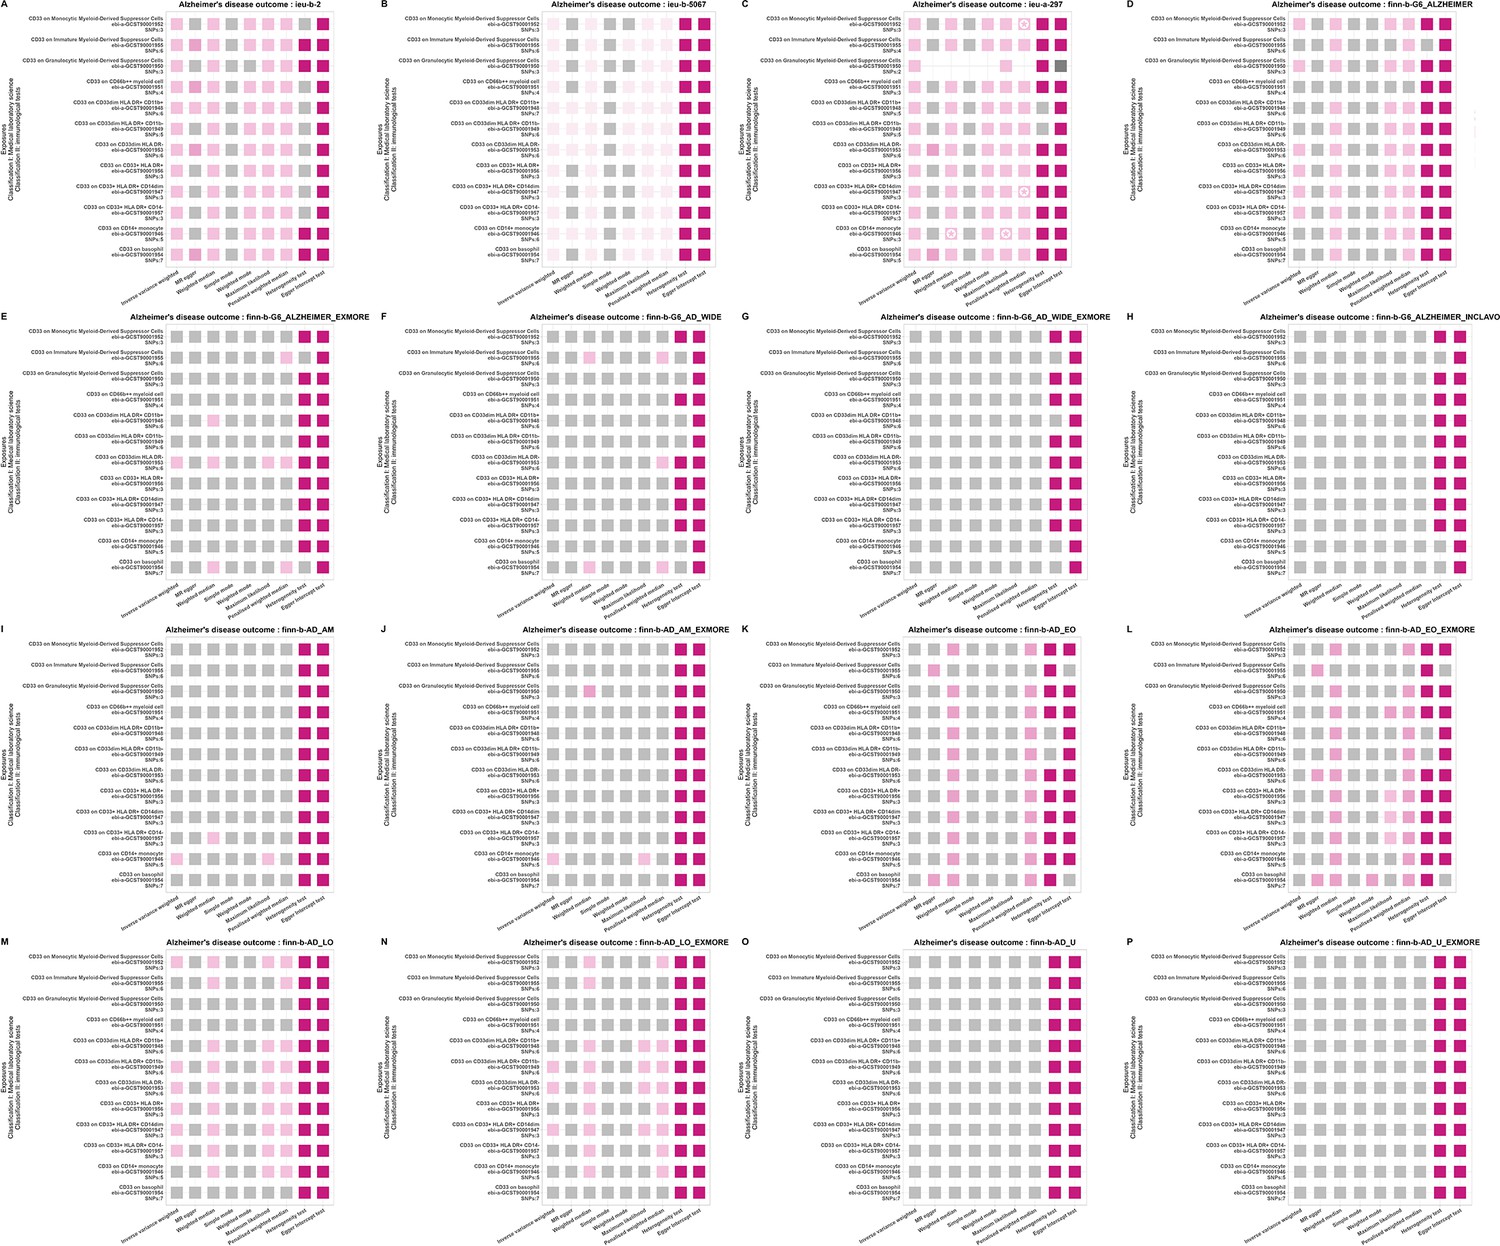
Statistical models for causal effect results of twelve immunological test items that were positively associated with the main outcome traits of Alzheimer's disease (AD).
The figure note follows that of Figure 3—figure supplement 1.
Figure 3—figure supplement 4
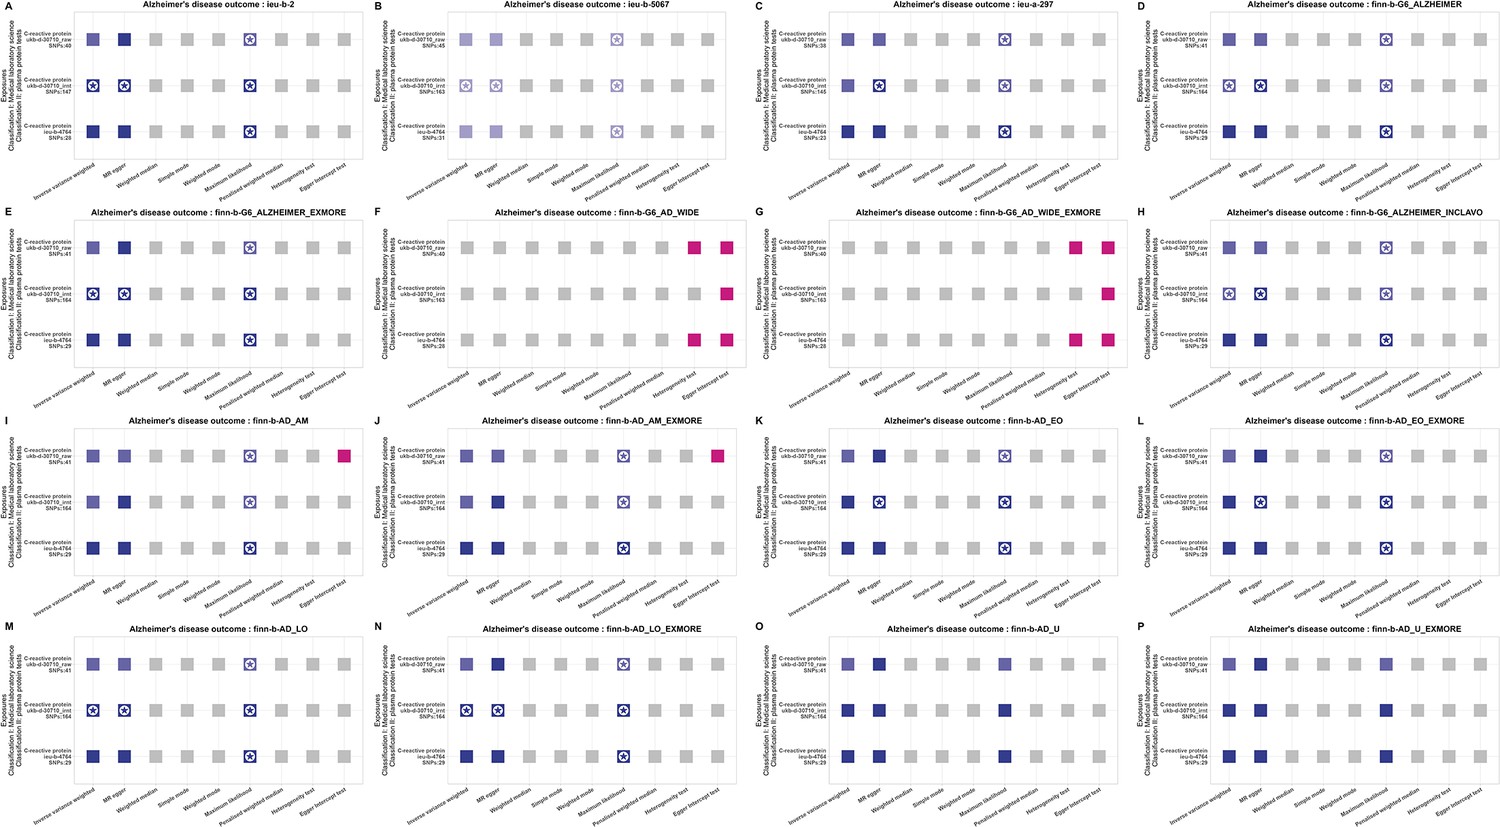
Statistical models for causal effect results of three plasma protein tests items that were negatively associated with the main outcome traits of Alzheimer's disease (AD).
The figure note follows that of Figure 3—figure supplement 1.
Figure 3—figure supplement 5
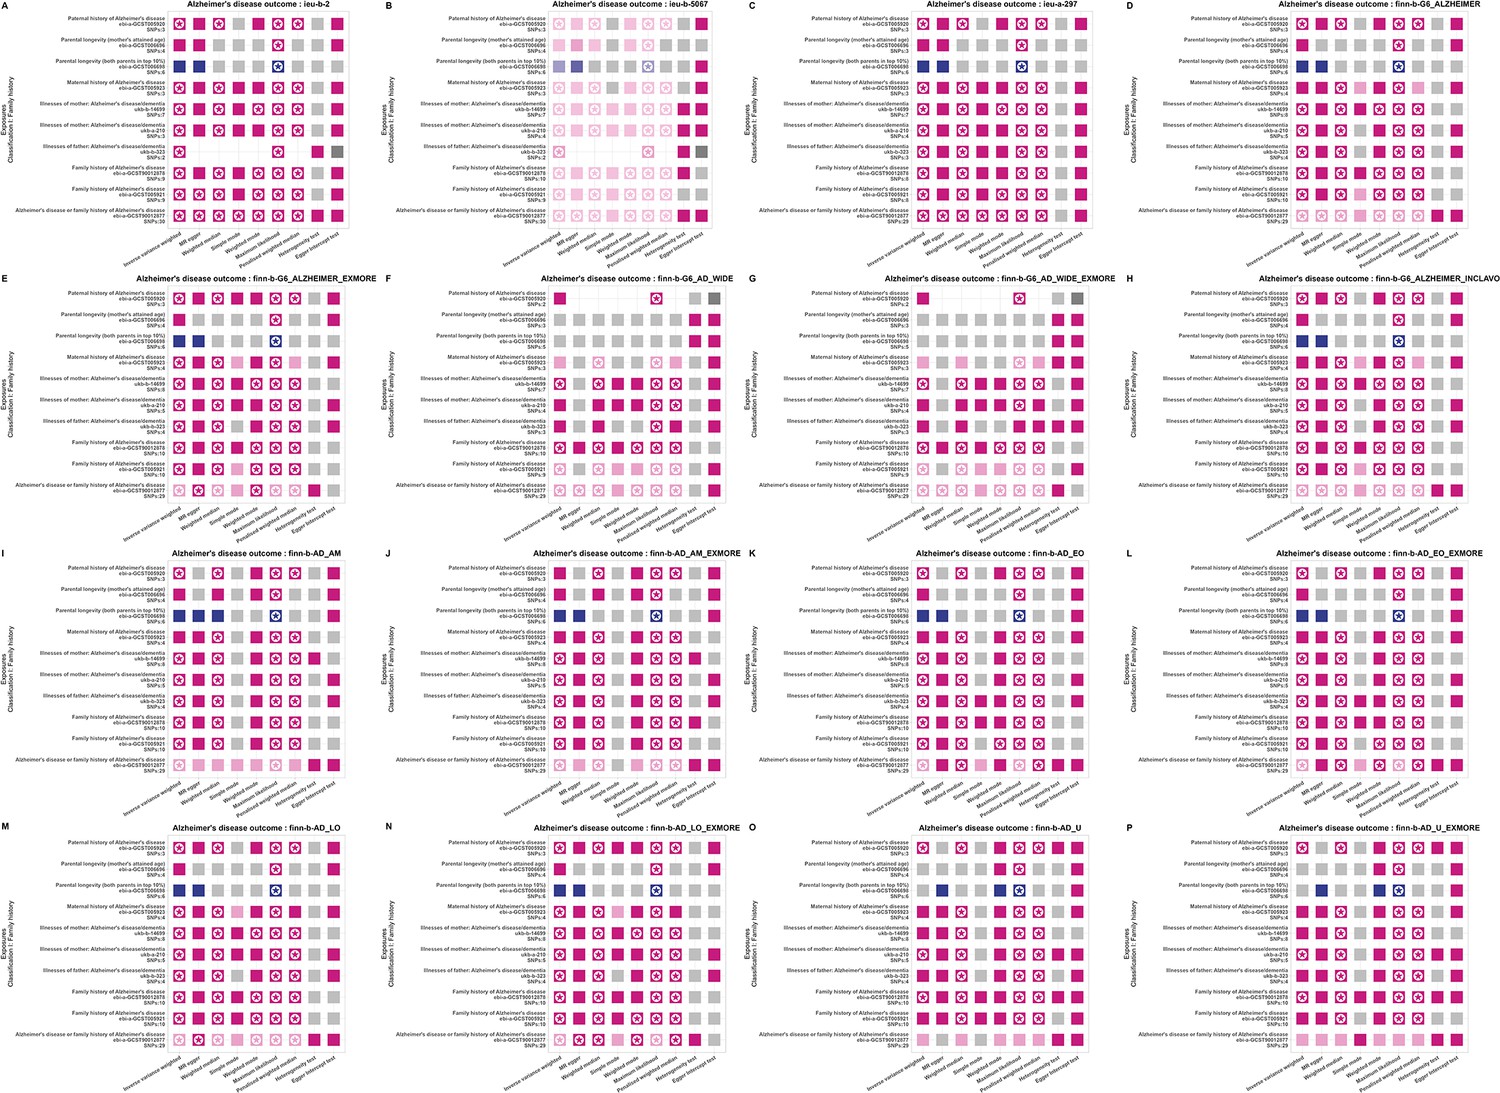
Statistical models for causal effect results of ten family history items with causal effects on the main outcome traits of Alzheimer's disease (AD).
The figure note follows that of Figure 3—figure supplement 1.
Figure 3—figure supplement 6
Statistical models for causal effect results of nine disease items with causal effects on the main outcome traits of Alzheimer's disease (AD).
The figure note follows that of Figure 3—figure supplement 1.
Figure 3—figure supplement 7
Statistical models for causal effect results of seven molecular trait items with causal effects on the main outcome traits of Alzheimer’s disease (AD).
The figure note follows that of Figure 3—figure supplement 1.
Figure 3—figure supplement 8
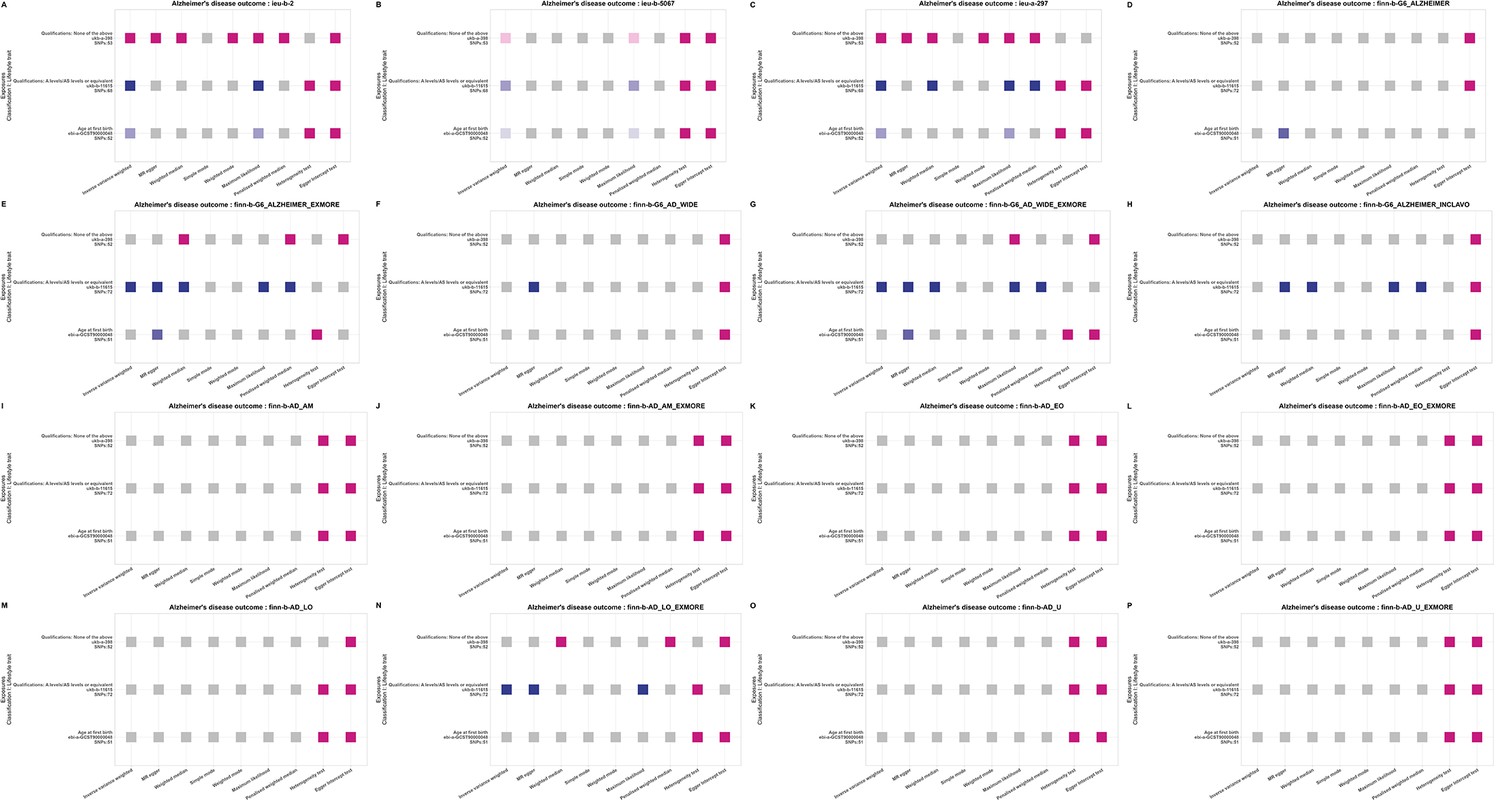
Statistical models for causal effect results of three lifestyle trait items with causal effects on the main outcome traits of Alzheimer’s disease (AD).
The figure note follows that of Figure 3—figure supplement 1.
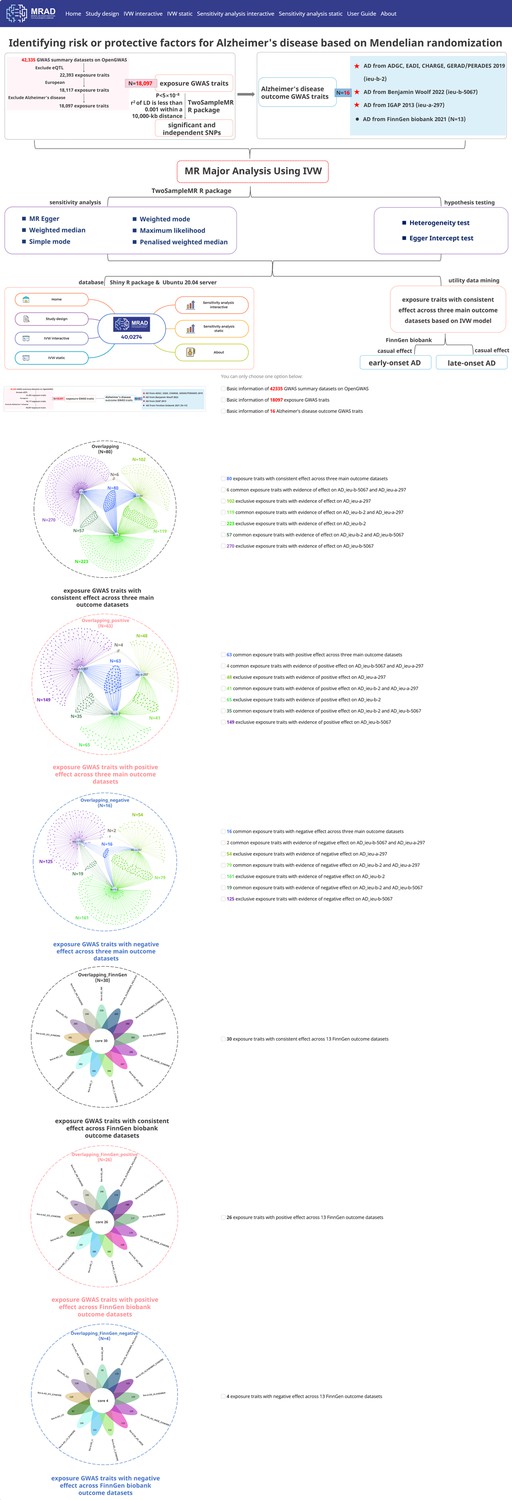
Figure 4
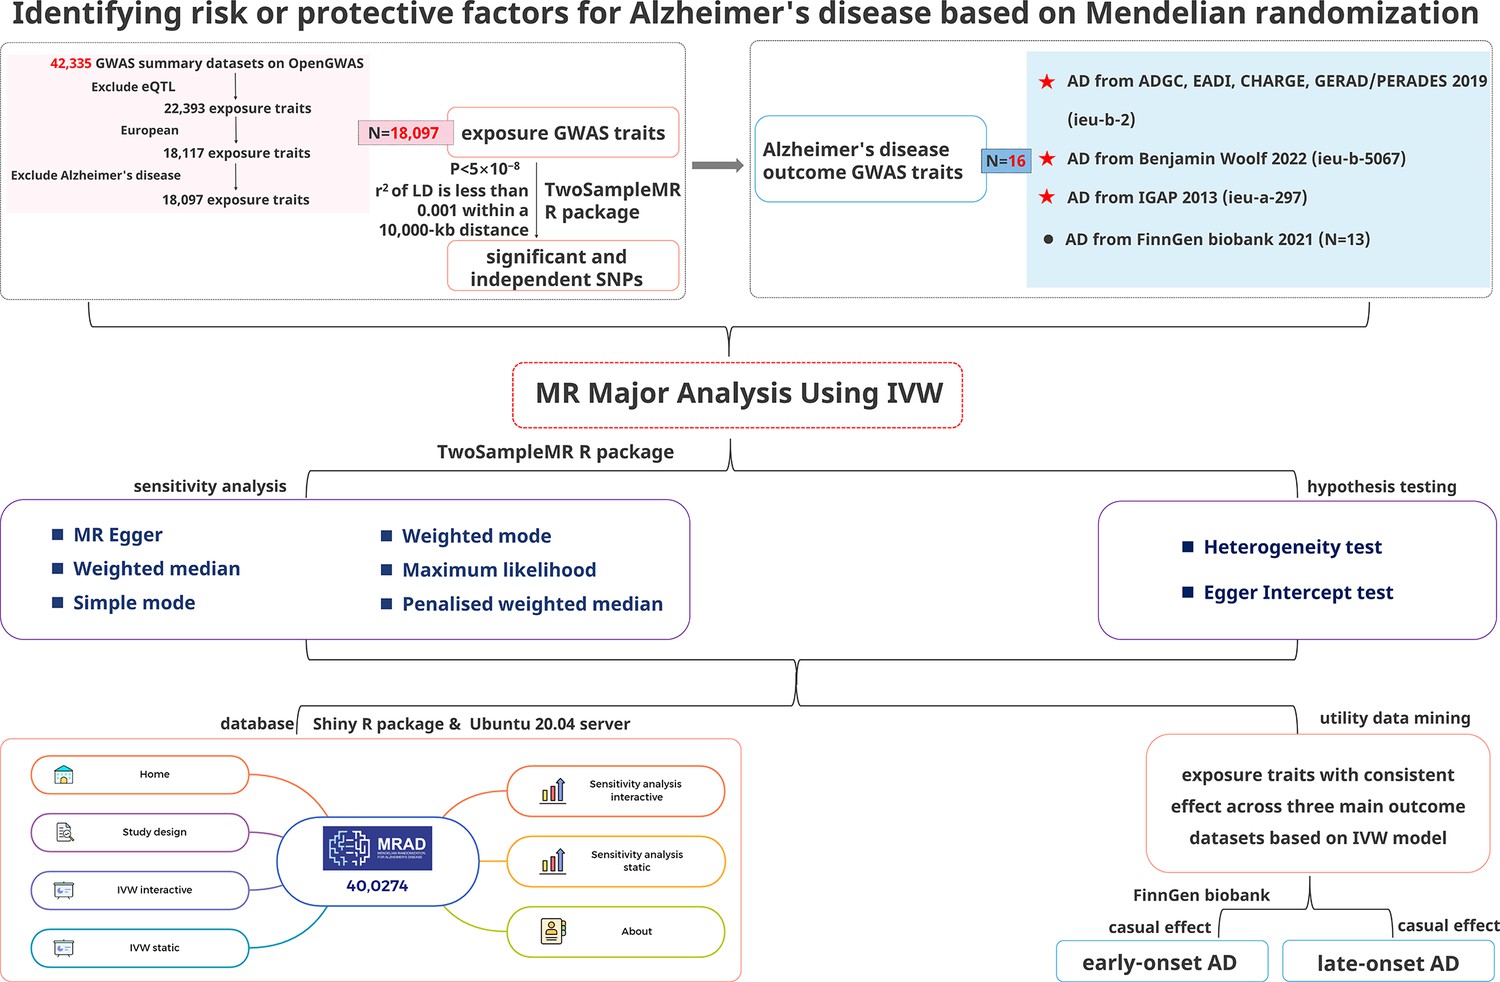
Study design.
Figure 5
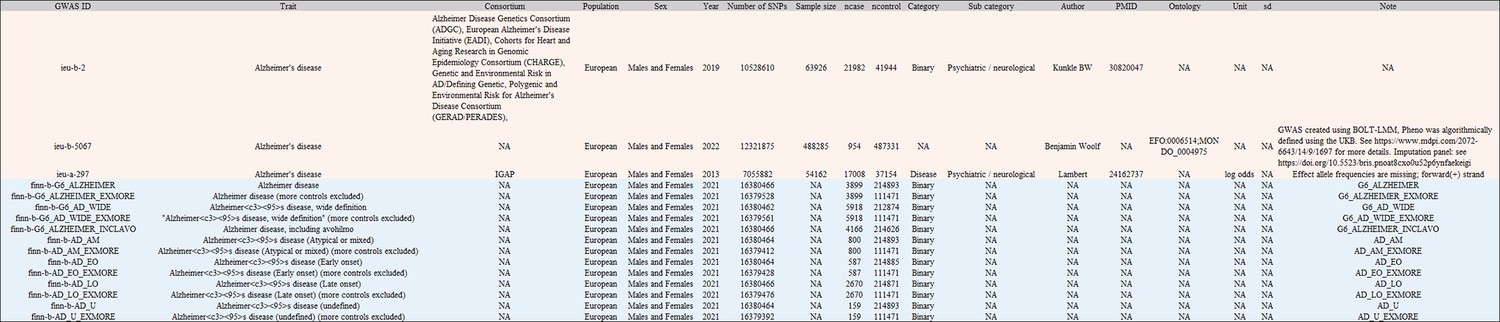
Basic information in 16 outcome traits in MRC IEU OpenGWAS.
Tables
Key resources table
| Reagent type (species) or resource | Designation | Source or reference | Identifiers | Additional information |
|---|---|---|---|---|
| Software, algorithm | MRC IEU OpenGWAS | Elsworth et al., 2020 | https://gwas.mrcieu.ac.uk/ | |
| Software, algorithm | UniProt | UniProt Consortium, 2018 | https://www.uniprot.org/ RRID:SCR_002380 | |
| Software, algorithm | EVenn | Tong et al., 2022 | http://www.ehbio.com/test/venn/#/ | |
| Software, algorithm | R (version 4.1.2) software | Simon Urbanek et al. | https://www.r-project.org/ RRID:SCR_001905 | |
| Software, algorithm | TwoSampleMR (version 0.5.8) | Hemani et al., 2018 | https://github.com/MRCIEU/TwoSampleMR RRID:SCR_019010 | TwoSampleMR package in the R (version 4.1.2) software |
| Software, algorithm | Shiny (version 1.8.0) | rstudio | https://shiny.posit.co/ RRID:SCR_001626 | Shiny package in R (version 4.1.2) |
| Software, algorithm | MRAD | this paper | https://gwasmrad.com/mrad/ | This paper, a new online data analysis platform for identifying the risk or protective factors for AD called MRAD. |
Additional files
-
Supplementary file 1
Sensitivity analysis and Bonferroni correction results.
- https://cdn.elifesciences.org/articles/96224/elife-96224-supp1-v1.xlsx
-
Supplementary file 2
Basic information of exposure traits in MRC IEU OpenGWAS.
- https://cdn.elifesciences.org/articles/96224/elife-96224-supp2-v1.xlsx
-
MDAR checklist
- https://cdn.elifesciences.org/articles/96224/elife-96224-mdarchecklist1-v1.docx
Download links
A two-part list of links to download the article, or parts of the article, in various formats.
Downloads (link to download the article as PDF)
Open citations (links to open the citations from this article in various online reference manager services)
Cite this article (links to download the citations from this article in formats compatible with various reference manager tools)
Systematic evaluation of multifactorial causal associations for Alzheimer’s disease and an interactive platform MRAD developed based on Mendelian randomization analysis
eLife 13:RP96224.
https://doi.org/10.7554/eLife.96224.3


