Root cap cell corpse clearance limits microbial colonization in Arabidopsis thaliana
- Cluster of Excellence on Plant Sciences (CEPLAS), Institute for Plant Sciences, University of Cologne, Germany
- Cologne Excellence Cluster for Cellular Stress Responses in Aging-Associated Diseases (CECAD), University of Cologne, Germany
- Center for Molecular Medicine Cologne (CMMC), University of Cologne, Germany
- Faculty of Medicine, University Hospital Cologne, Germany
- Department of Plant Biotechnology and Bioinformatics, Ghent University, Belgium
- VIB Center for Plant Systems Biology, Belgium
Figures
Figure 1 with 1 supplement
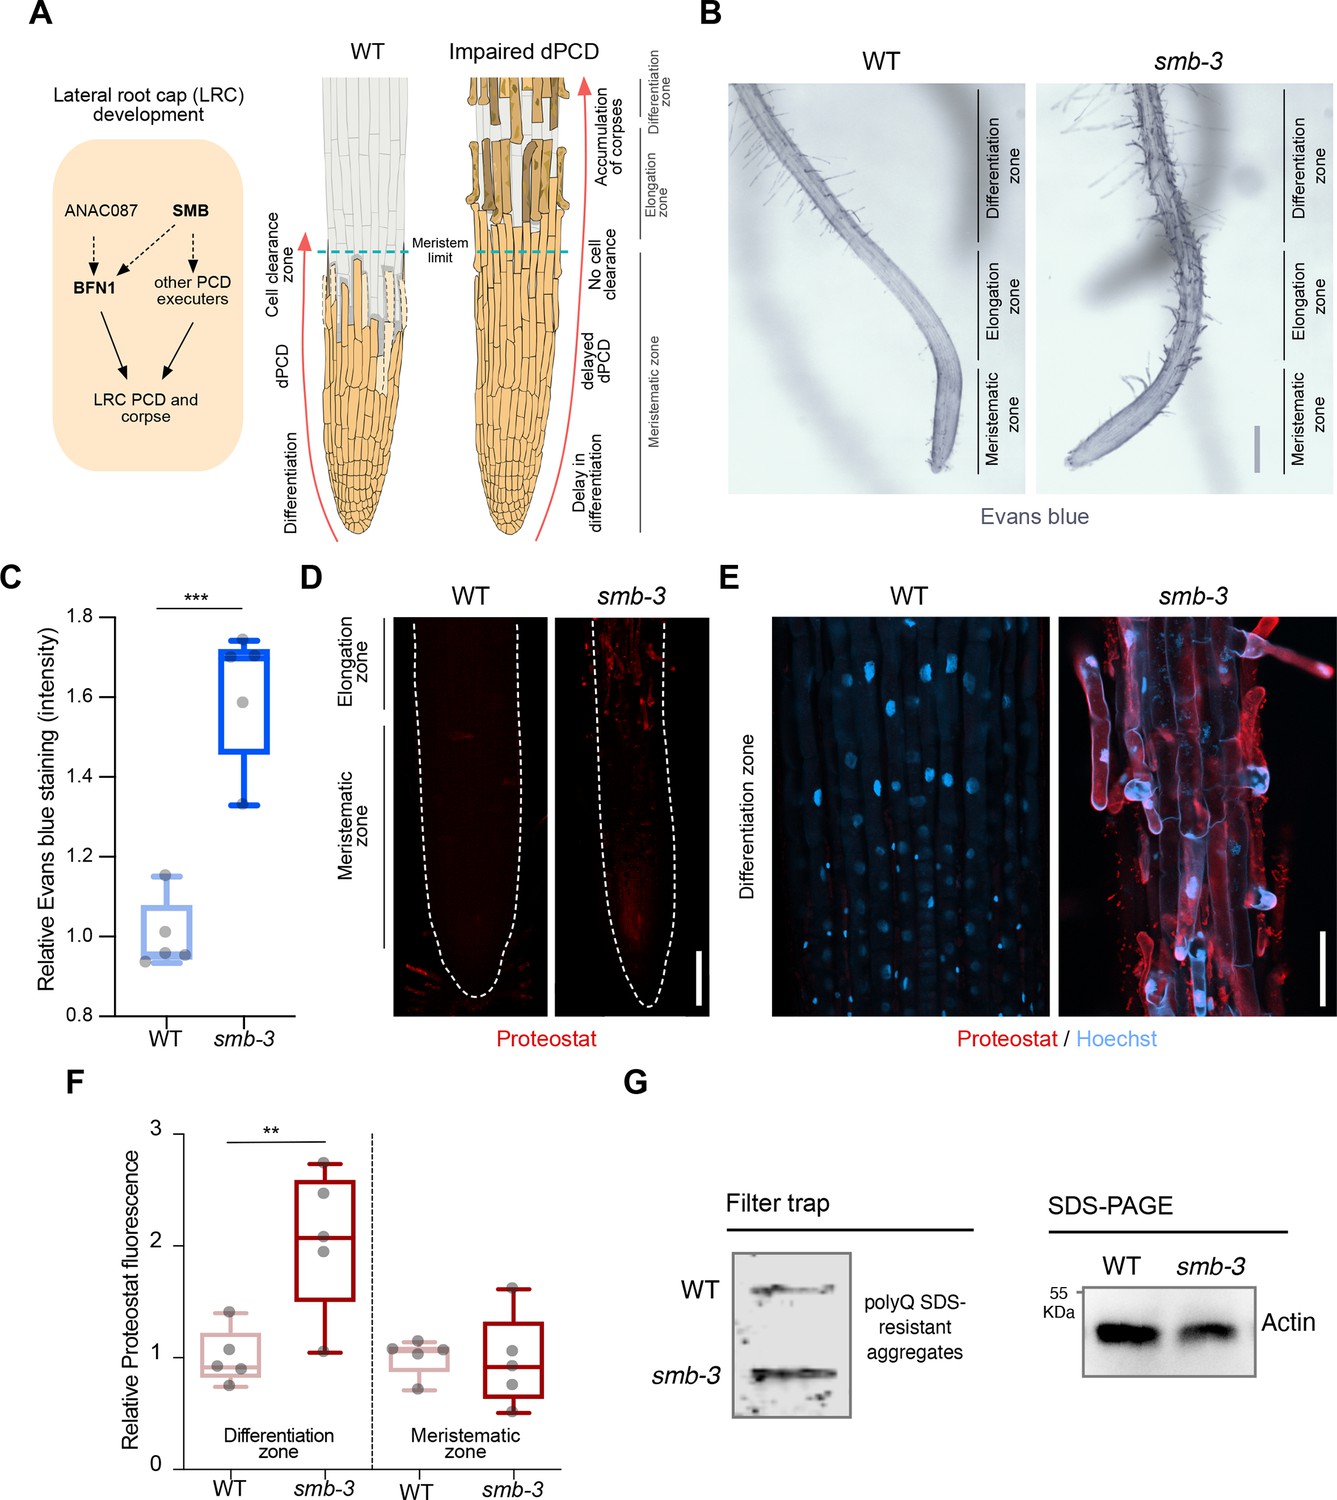
smb-3 mutant roots exhibit uncleared cell corpses loaded with misfolded / aggregated proteins.
(A) Schematic representation of lateral root cap (LRC) development in WT and smb-3 mutant plants, impaired in dPCD. (B) Evans blue staining of 10-day-old WT and smb-3 mutant roots, showing an overview of the meristematic, elongation and differentiation zone. Evans blue highlights the accumulation of LRC cell corpses on smb-3 mutant roots starting at the transition into the elongation zone. Scale indicates 150 μm. (C) Relative quantification of Evans blue staining of the differentiation zone of 14-day-old WT and smb-3 mutant roots (refers to image shown in B). Five plants per genotype were used. All data points were normalized to the mean of the WT control. Statistical relevance was determined by unpaired, two-tailed Student’s t test (F [4, 4]=3.596; p<0.001). (D) Confocal Scanning Laser Microscopy (CLSM) images of 10-day-old WT and smb-3 mutant roots stained with Proteostat (red) showing the meristematic- and the beginnings of the elongation-zone. Scale indicates 100 μm. (E) Magnification of the differentiation zone of WT and smb-3 mutant roots, both stained with Proteostat (red) and Hoechst (blue). WT roots do not show any Proteostat signal, while smb-3 mutants display extensive protein aggregate accumulation in uncleared LRC cell corpses. Scale indicates 50 μm. (F) Quantification of relative Proteostat fluorescence levels, comparing the differentiation and meristematic zones of WT and smb-3 mutants. Five 10-day-old plants were used for each genotype. All data points were normalized to the mean of the WT control, analyzing differentiation and meristematic zone separately. Statistical significance was determined by one-way ANOVA and Tukey’s post hoc test (F [3, 16]=8,314; p<0.01). (G) Filter trap and SDS-PAGE analysis with anti-poly-glutamine (polyQ) antibodies of 15-day-old WT and smb-3 mutant roots. The images are representative of two independent experiments.
-
Figure 1—source data 1
PDF file containing the original blots for Figure 1G, indicating the relevant bands.
- https://cdn.elifesciences.org/articles/96266/elife-96266-fig1-data1-v1.zip
-
Figure 1—source data 2
Original files for the blots displayed in Figure 1G.
- https://cdn.elifesciences.org/articles/96266/elife-96266-fig1-data2-v1.zip
Figure 1—figure supplement 1
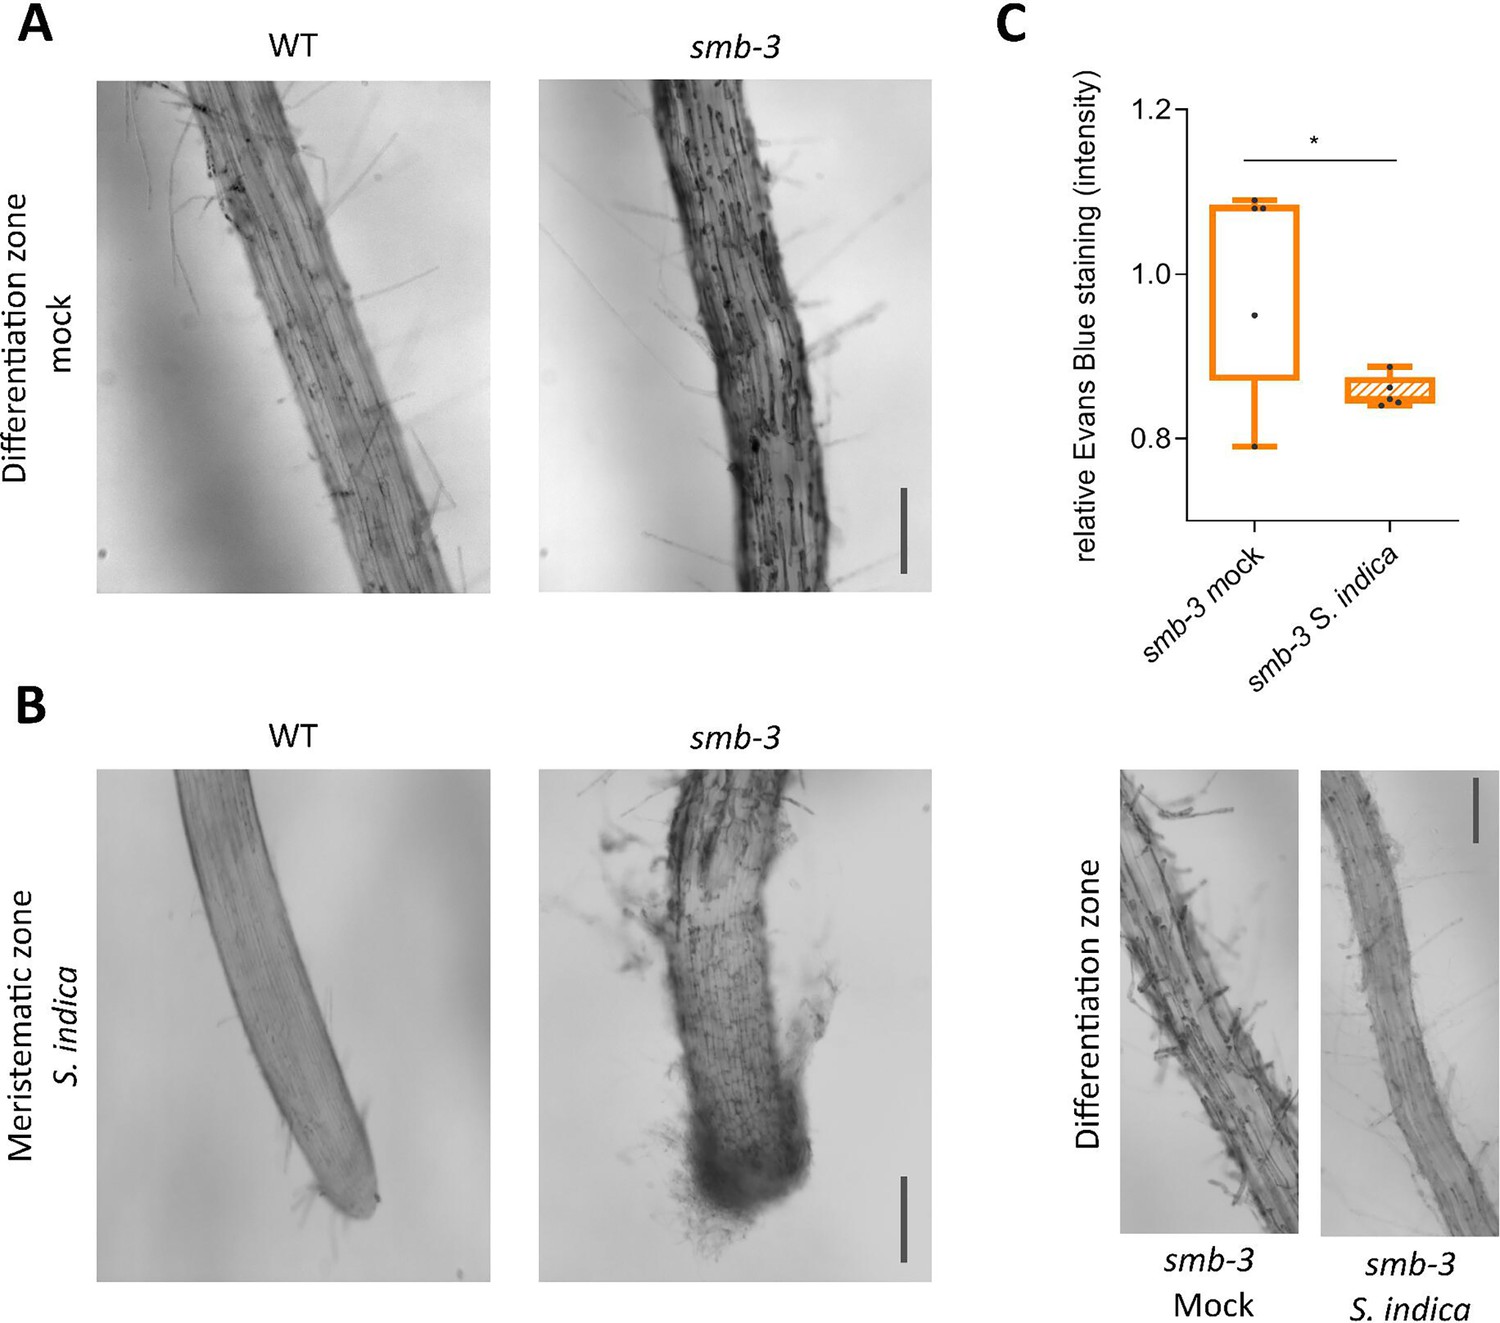
Accumulation of LRC cell corpses on smb-3 mutants.
(A) Evans blue staining of 14-day-old WT and smb-3 mutant roots under mock conditions, showcasing the accumulation of LRC cell corpses along the differentiation zone caused by the SMB loss-of-function mutation. Scale indicates 100 µm. (B) Microscopy images of S. indica colonized WT and smb-3 mutant roots visualizing the hypercolonization of the meristematic zone of smb-3 mutant root tips at 10 dpi, stained with Evans blue. Scale indicates 100 µm. (C) Quantification of cell death via Evans blue staining, showing a clearing of LRC cell corpses on smb-3 mutant roots during S. indica colonization. Five plants were imaged for each mock and S. indica treatment at 10 dpi. Statistical significance was determined using an unpaired, two-tailed Student’s t-test before normalization (F [4, 4]=46.19; p<0.05). Microscopy images show corresponding mock and S. indica-treatments of smb-3 mutant roots. Scale indicates 100 µm.
Figure 2
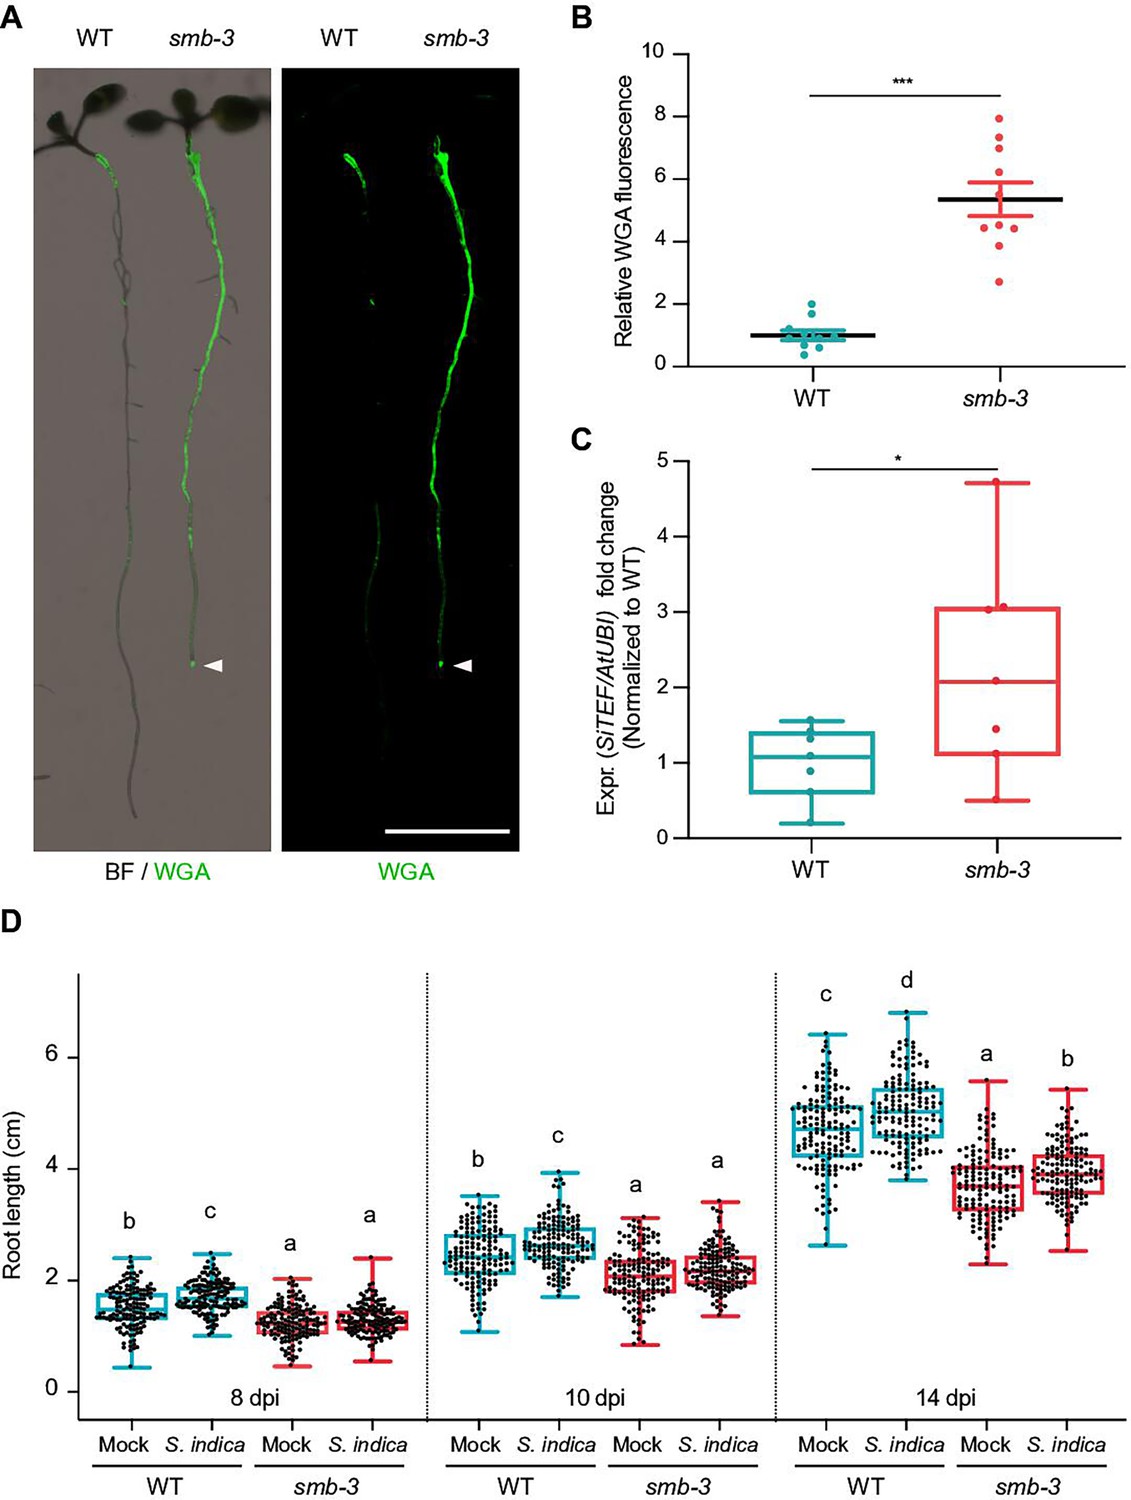
smb-3 mutants display extraradical hypercolonization and increased intraradical colonization by S. indica.
(A) Representative images show extraradical colonization of 10-day-old WT and smb-3 mutant seedlings (seed inoculated). S. indica was stained with WGA-AF 488. Roots were scanned and captured with a LI-COR Odyssey M imager using the bright field (BF) and Alexa Fluor 488 channel (green). White arrowheads indicate colonization of the root tip in the smb-3 mutant background. Scale indicates 5 mm. (B) Relative quantification of WGA-AF 488 signal as proxy for extraradical colonization on smb-3 mutants and WT roots (refers to image shown in A). The statistical comparison was made by two-tailed Student’s t test for unpaired samples (F [9, 9]=11.85; p<0.001) using 10 plants. (C) Measurement of intraradical colonization in WT and smb-3 mutant roots at 10dpi were performed by qPCR. Roots from seven biological replicates were collected and washed to remove extra-radical hyphae, pooling approximately 30 seedlings for each genotype per replicate. The graph is normalized to WT. Statistical analysis was done via two-tailed Student’s t test for unpaired samples (F [6, 6]=8.905; p<0.05). (D) Root length measurements of WT plants and smb-3 mutant plants, during S. indica colonization (seed inoculated) or mock treatment. 50 plants for each genotype and treatment combination were observed and individually measured over a time period of two weeks. WT roots show S. indica-induced growth promotion, while growth promotion of smb-3 mutants was delayed and only observed at later stages of colonization. This experiment was performed three times, with fresh fungal material, showing similar results. Statistical analysis was performed via one-way ANOVA and Tukey’s post hoc test (F [11, 1785]=1149; p<0.001). For visual representation of statistical relevance each time point was additionally evaluated via one-way ANOVA and Tukey’s post hoc test at 8 dpi (F [3, 593]=69.24; p<0.001), 10dpi (F [3, 596]=47.59; p<0.001) and 14dpi (F [3, 596]=154.3; p<0.001).
Figure 3
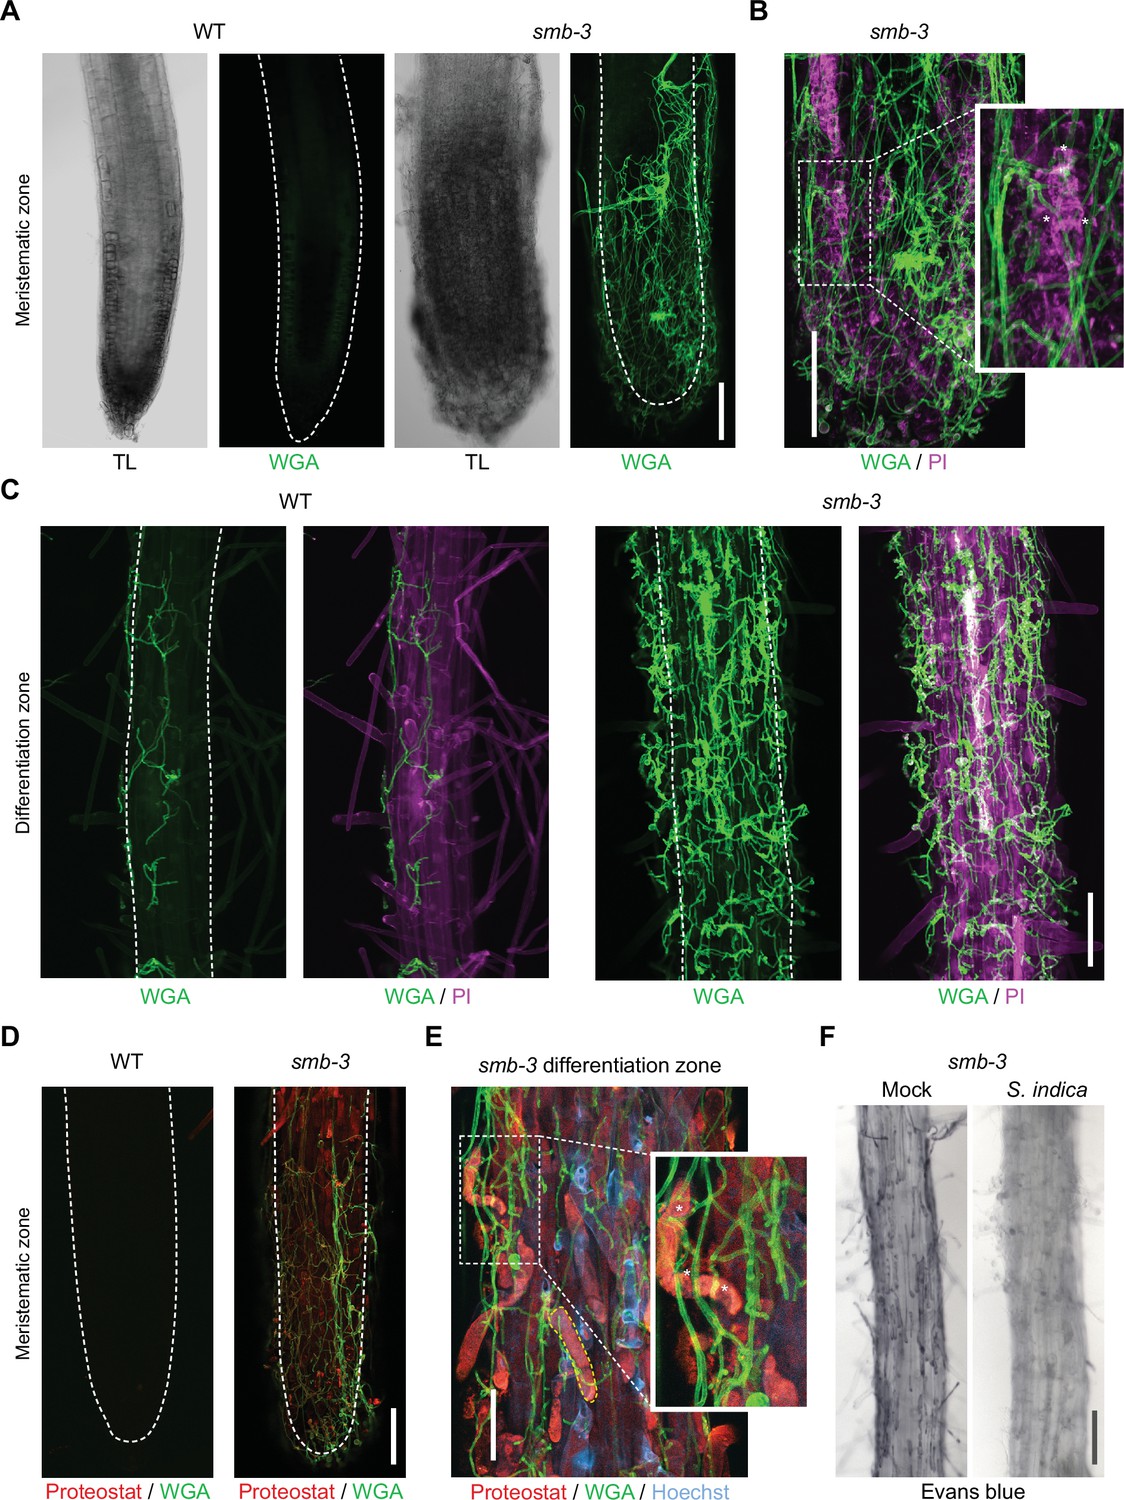
Cytological analyses of S. indica-colonized smb-3 mutants and WT roots.
For CLSM analyses, 7-day-old seedlings were inoculated with S. indica spores and roots were analyzed at 10 dpi. (A) Representative images of the meristematic zone of Arabidopsis WT and smb-3 mutants during S. indica colonization. WGA-AF 488 stain (green) was used to visualize fungal structures. Transmitted light (TL) images are also shown. Scale indicates 100 μm (B) Magnification of a smb-3 mutant root tip colonized with S. indica. Asterisks indicate penetration of hyphae into dead cells stained with propidium iodide (PI, Sigma-Aldrich) shown in magenta. Scale indicates 100 μm. (C) Representative images of the differentiation zone of WT and smb-3 mutants colonized with S. indica and stained with WGA-AF 488 and PI. Scale indicates 100 μm. (D) Representative images of the meristematic zone of WT and smb-3 mutant root tips inoculated with S. indica, stained with WGA-AF 488 and Proteostat (red). Scale indicates 100 μm (E) Magnification of the root differentiation zone of smb-3 mutants showing S. indica colonization, stained with WGA-AF 488, Hoechst and Proteostat. Penetration of fungal hyphae into uncleared cell corpses is marked with asterisks. Dotted yellow line indicates lateral root cap (LRC) cell corpse. Scale indicates 50 µm. (F) Representative images of the differentiation zone of S. indica-colonized WT and smb-3 roots at 10 dpi, stained with Evans blue. Scale indicates 100 μm.
Figure 4 with 1 supplement
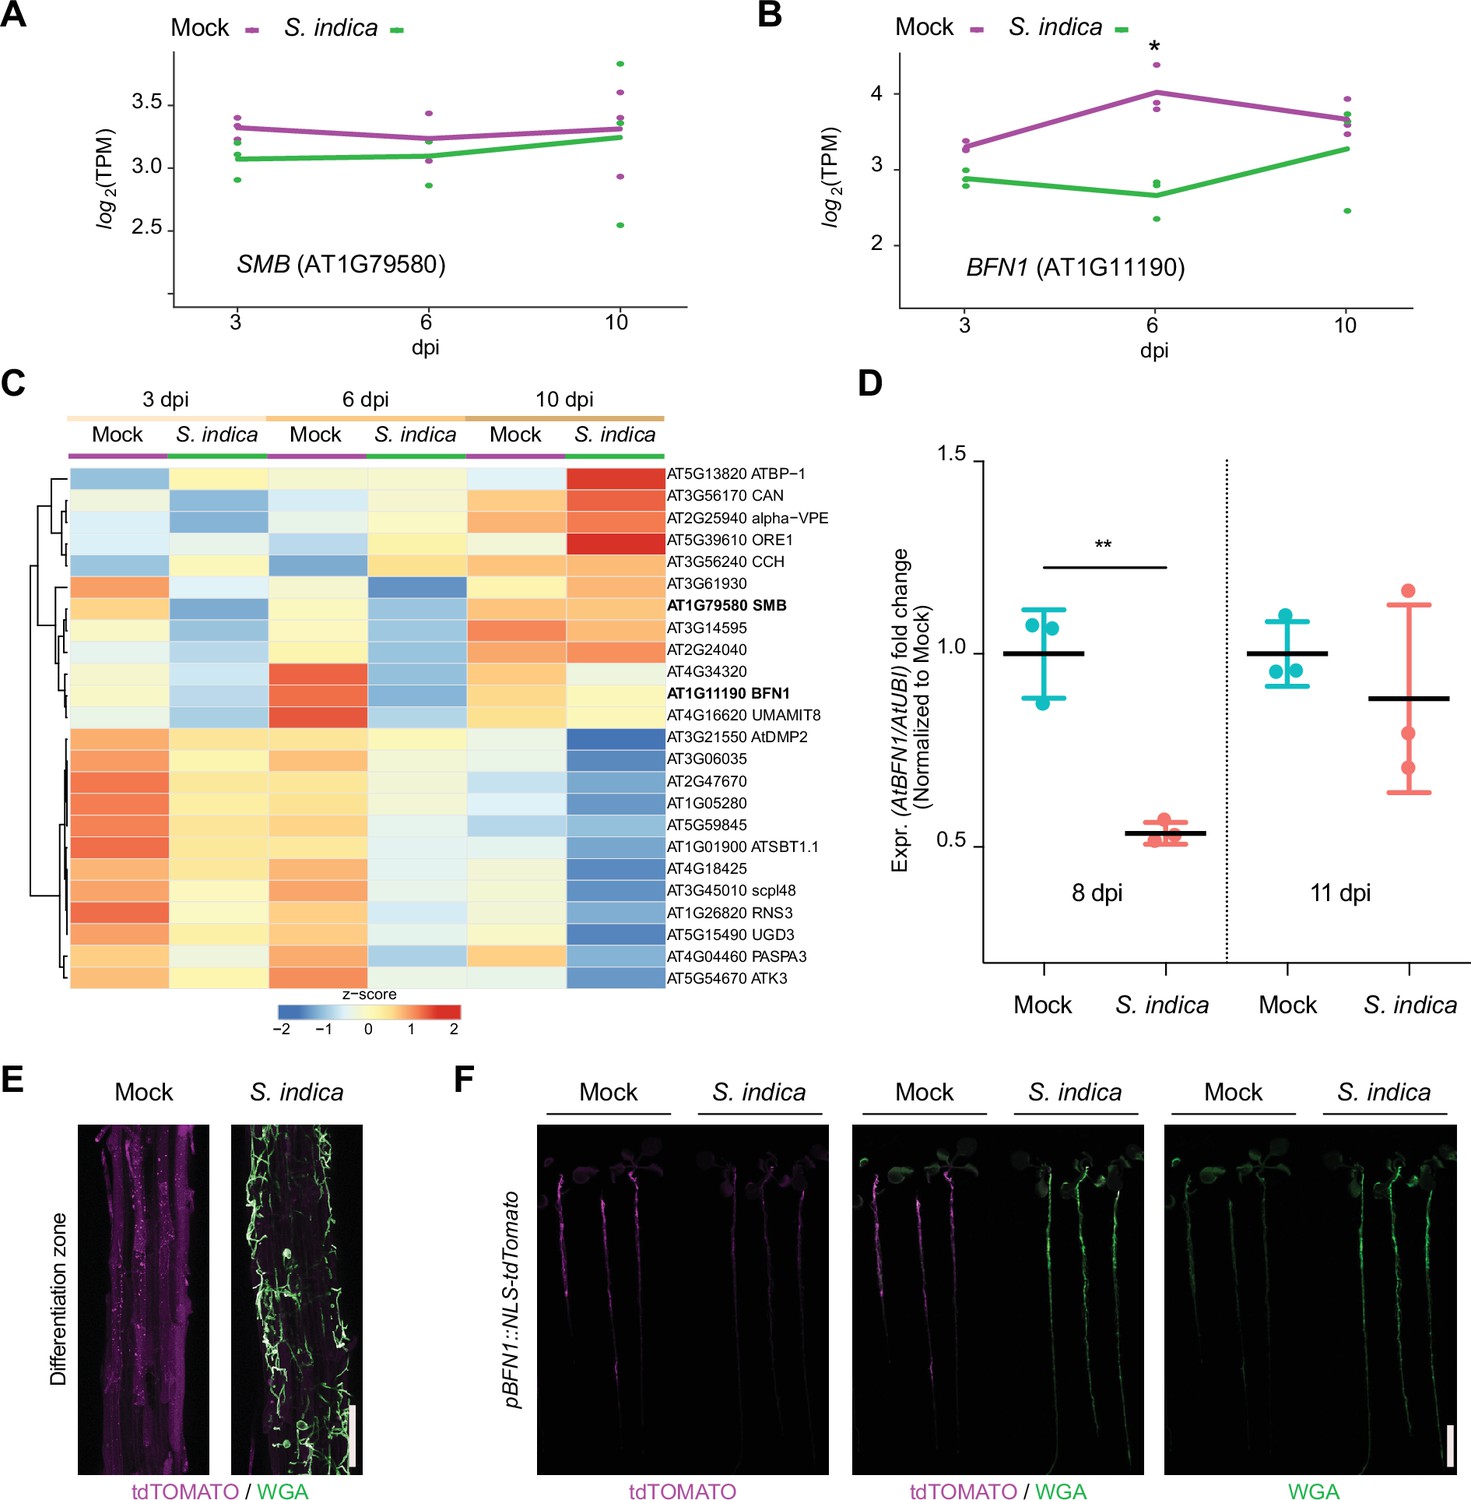
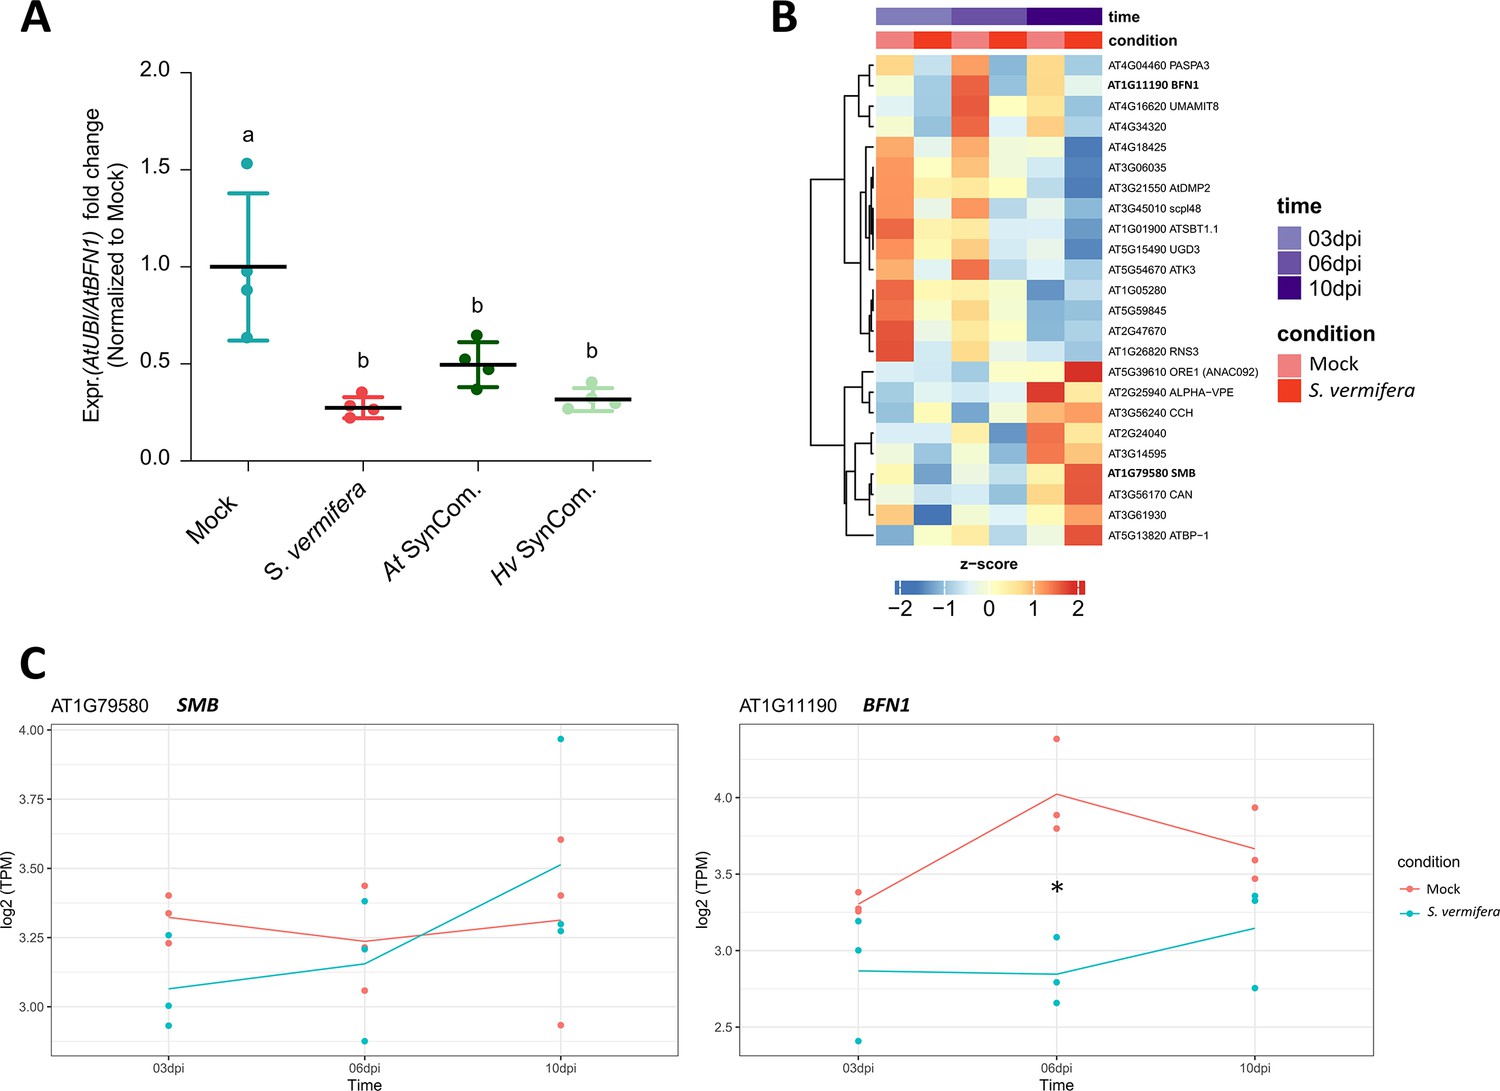
BFN1 is downregulated during interaction with S. indica.
RNA-Seq expression profiles of (A) SMB and (B) BFN1 in Arabidopsis roots mock-treated or inoculated with S. indica at 3, 6, and 10 dpi. The log2-transformed Transcript per Kilobase million (TPM) values are shown and the lines indicate average expression values among the 3 biological replicates. Asterisk indicates significantly different expression (adjusted p-value <0.05) (C) The heat map shows the expression values (TPM) of Arabidopsis dPCD marker genes with at least an average of 1 TPM across Arabidopsis roots mock-treated or inoculated with S. indica at 3, 6, and 10 dpi. The TPM expression values are log2 transformed and row-scaled. Genes are clustered using spearman correlation as distance measure. Each treatment displays the average of three biological replicates. The dPCD gene markers were previously defined (Olvera-Carrillo et al., 2015). (D) BFN1 expression in WT Arabidopsis roots during S. indica colonization at 8 and 11 dpi. RNA was isolated from three biological replicates, pooling 30 plants per conditions for qPCR analysis, comparing BFN1 expression with an Arabidopsis ubiquitin marker gene. Statistical significance was determined by one-way ANOVA and Tukey’s post hoc test (F [3, 8]=7263; p<0.05). (E) Representative CLSM images of the differentiation zone of mock- and S. indica- colonized pBFN1::NLS-tdTOMATO reporter roots at 7 dpi. The tdTOMATO signal (magenta) represents BFN1 expression and S. indica was stained with WGA-AF 488 (green). Scale indicates 100 µm. (F) Whole seedling scans of mock- and S. indica-treated pBFN1::NLS-tdTOMATO plants taken with a LI-COR Odyssey M imager at 7 dpi. Images show BFN1 expression via tdTOMATO signal in mock conditions and BFN1 expression in presence of S. indica (stained with WGA-AF 488). Scale indicates 5 mm.
Figure 4—figure supplement 1
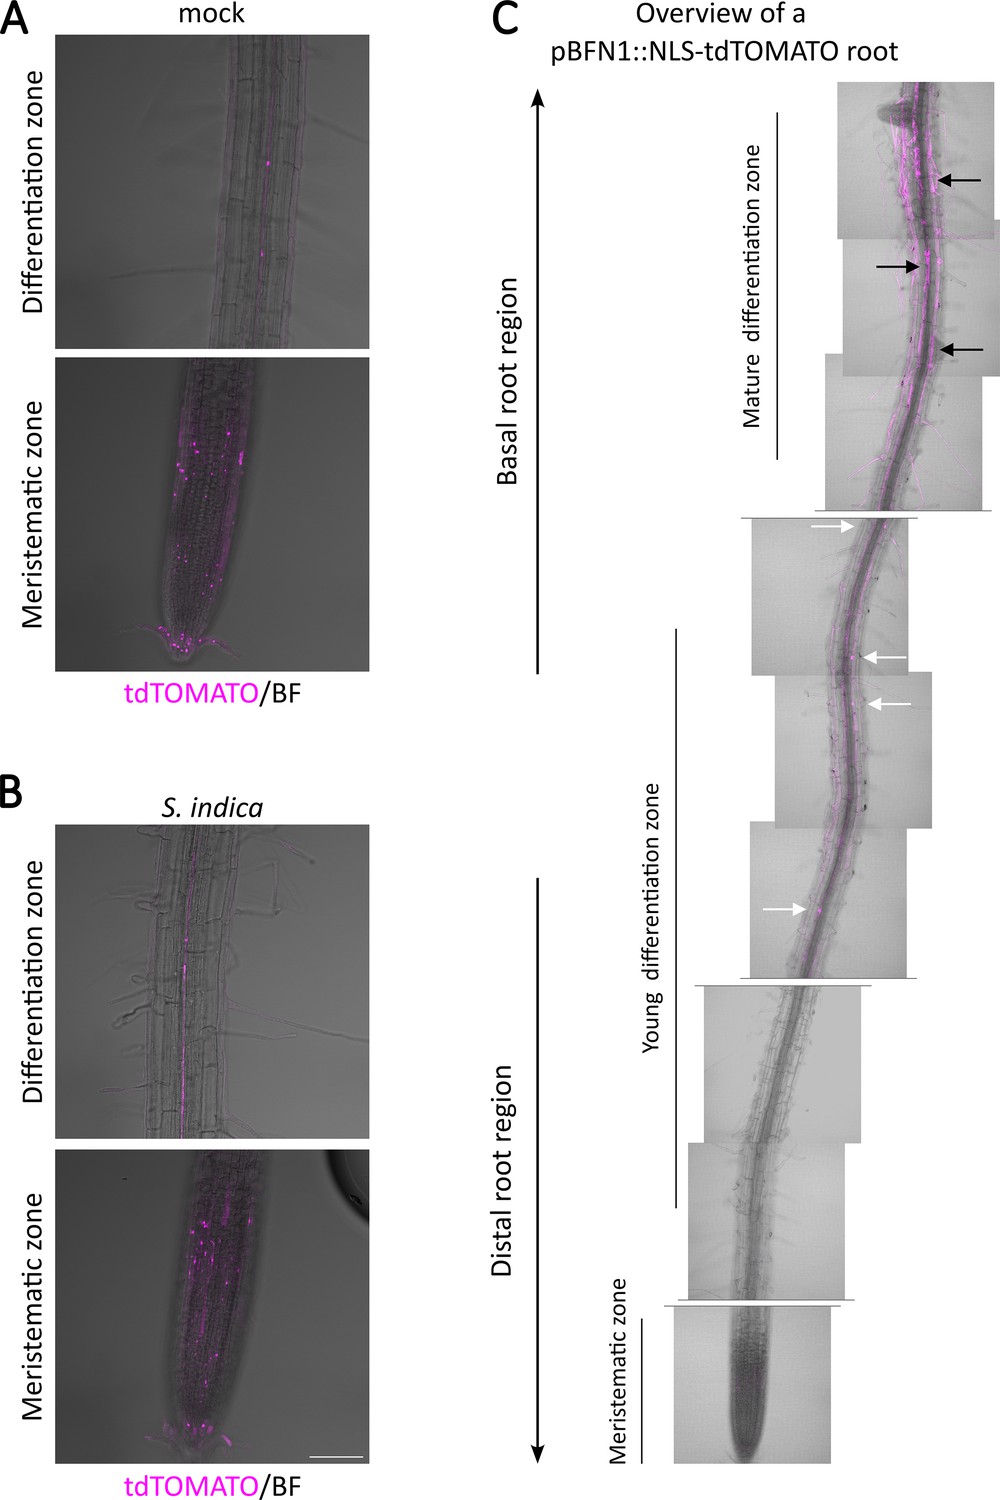
Expression pattern of BFN1 in root tissue.
CLSM images showing Z-stacks of the BFN1 promoter reporter line pBFN1::NLS-tdTOMATO show BFN1 expression via tdTOMATO signal (purple) accumulation in the nucleus of LRC cells and xylem cells. No significant changes in BFN1 expression in the root cap and xylem were observed in mock treated (A) and S. indica colonized (B) roots at 7dpi. Scale indicates 100 µm. (C) Mosaic scan of a mock-treated pBFN1::NLS-tdTOMATO reporter plant. Overview shows single planes of the primary root axis. White arrows indicate BFN1 expression in intact young epidermal cells, black arrows indicate BFN1 expression in mature epidermal cells post nuclear rupture of a 2-week-old seedling.
Figure 5 with 3 supplements
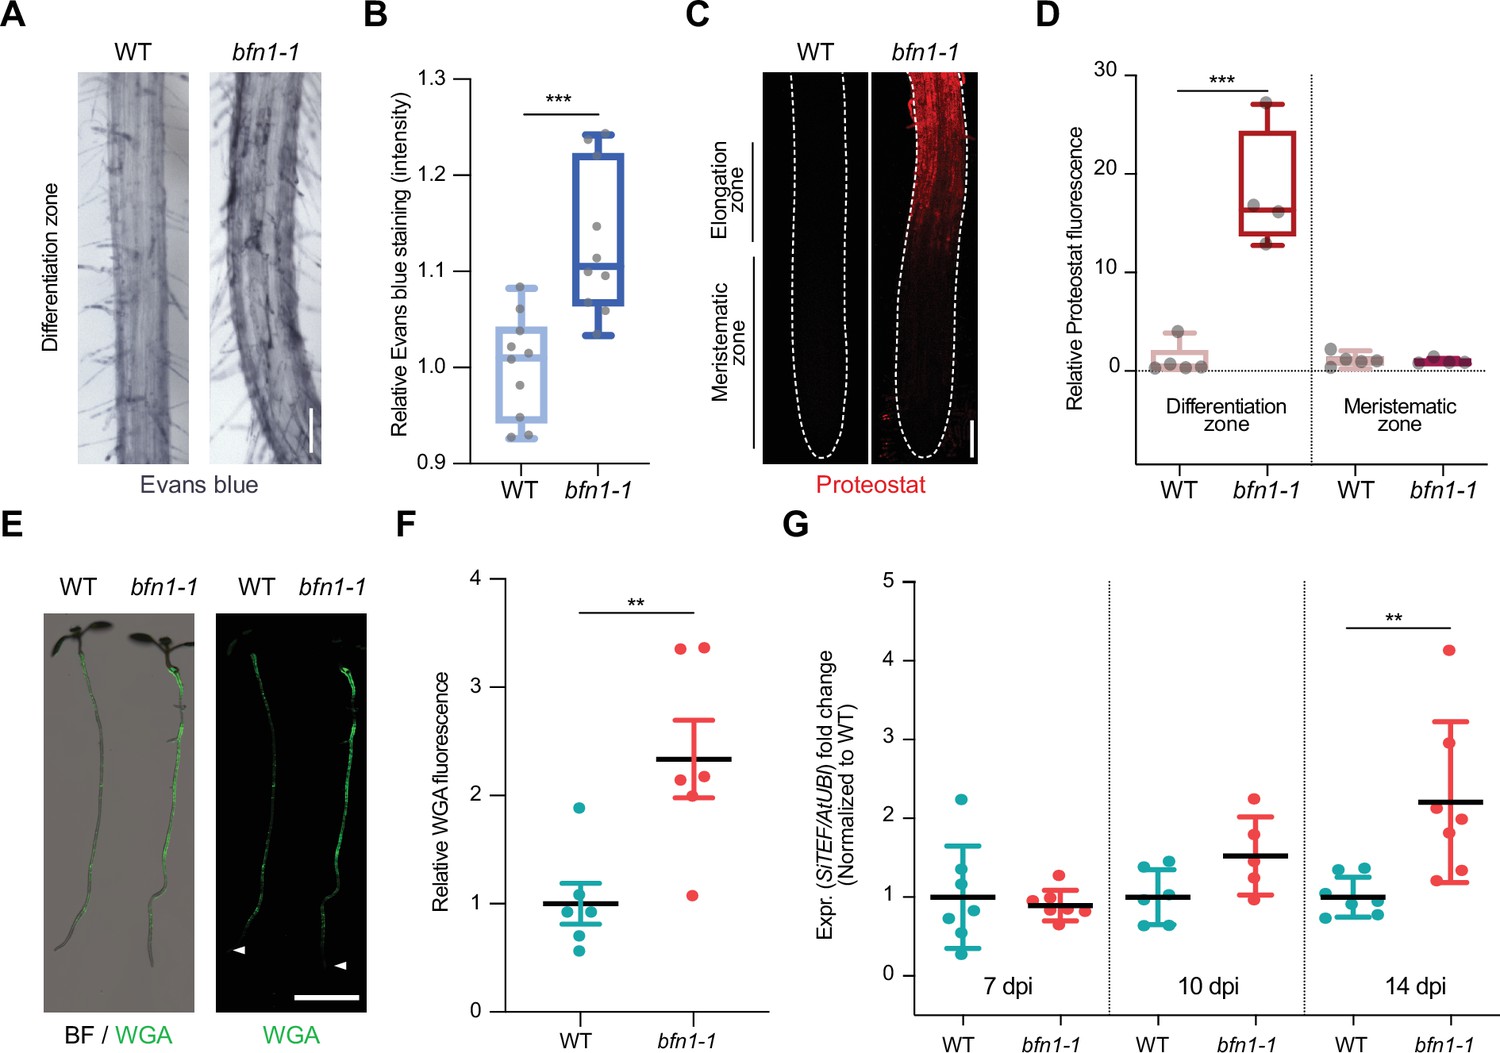
BFN1 downregulation promotes fungal accommodation.
(A) Microscopy images of the differentiation zone of 14-day-old WT and bfn1-1 mutant roots, stained with Evans blue. Scale indicates 100 μm. (B) Relative quantification of Evans blue staining (refers to image shown in A), comparing 14-day-old WT and bfn1-1 mutants. Ten plants were used for each genotype. Data were normalized to the WT control. Statistical significance was determined using an unpaired, two-tailed Student’s t test (F [9, 9]=2.033; p<0.001). (C) Proteostat staining of 10-day-old WT and bfn1-1 mutant root tips. Scale indicates 100 μm. (D) Quantification of Proteostat staining (refers to image shown in C) using 4–5 10-day-old WT and bfn1-1 mutants. Statistical analysis was performed via one-way ANOVA and Tukey’s post hoc test (F [3, 14]=33,55; p<0.001). (E) Extraradical colonization of 10-day-old WT and bfn1-1 mutant plants, seed-inoculated with S. indica and stained with WGA-AF 488 (green). Roots were scanned with a LI-COR Odyssey M imager. Arrowheads indicate the position of the uncolonized root tips. Scale indicates 5 mm. (F) Relative quantification of extraradical colonization of bfn1-1 mutant and WT roots, using WGA-AF 488 signal as a proxy for fungal biomass (refers to image shown in E). Data were normalized to the WT control. Statistical comparisons were made by unpaired, two-tailed Student’s t test for unpaired samples (F [5, 5]=3.597; p<0.01). (G) Intraradical colonization of WT and bfn1-1 mutants was measured via qPCR. Roots from seven biological replicates were collected and washed to remove outer extraradical mycelium, pooling approximately 30 plants per time point and replicate for each genotype. Each time point was normalized to WT for relative quantification of colonization. Statistical analysis was performed via one-way ANOVA and Tukey’s post hoc test (F [5, 33]=5.358; p<0.01).
Figure 5—figure supplement 1
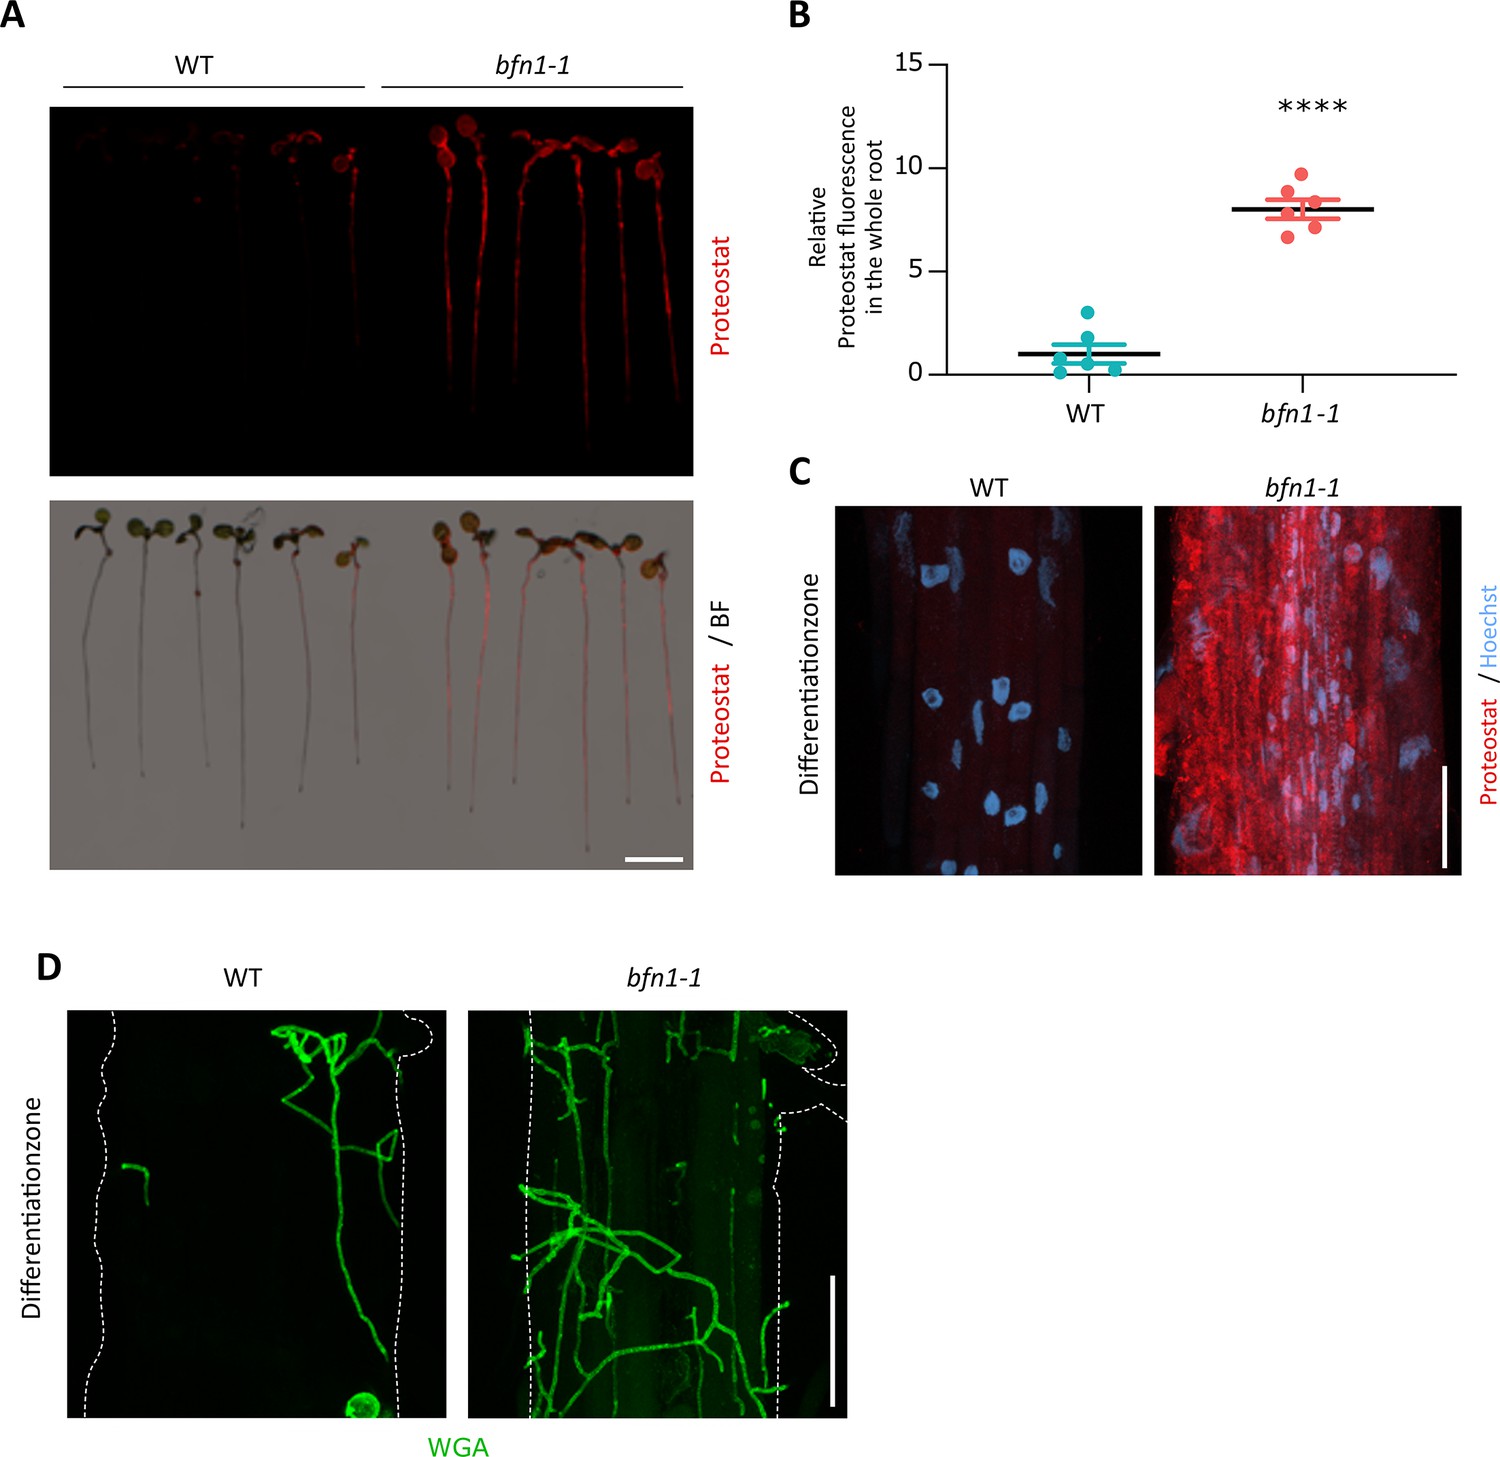
bfn1-1 mutant shows increased protein aggregation in roots.
(A) Images show Proteostat staining (red) of 10-day-old WT and bfn1-1 seedlings. Roots were scanned and captured with a LI-COR Odyssey M imager using the bright field (BF) and the 520 nm wavelength channel. Scale bar indicates 5 mm. (B) Relative quantification of Proteostat signal in WT and bfn1-1 roots. The statistical comparison was made by two-tailed Student’s t-test for unpaired samples (F [5, 5] = 1.005; p<0.001). (C) CLSM of differentiated cells of WT and bfn1-1 roots. Proteostat (red) and Hoechst (blue) channels are shown. Scale indicates 50 µm. (D) CLSM images of the differentiation zone of Arabidopsis WT and bfn1-1 roots inoculated with S. indica and stained with WGA-AF 488. Scale represents 50 μm.
Figure 5—figure supplement 2
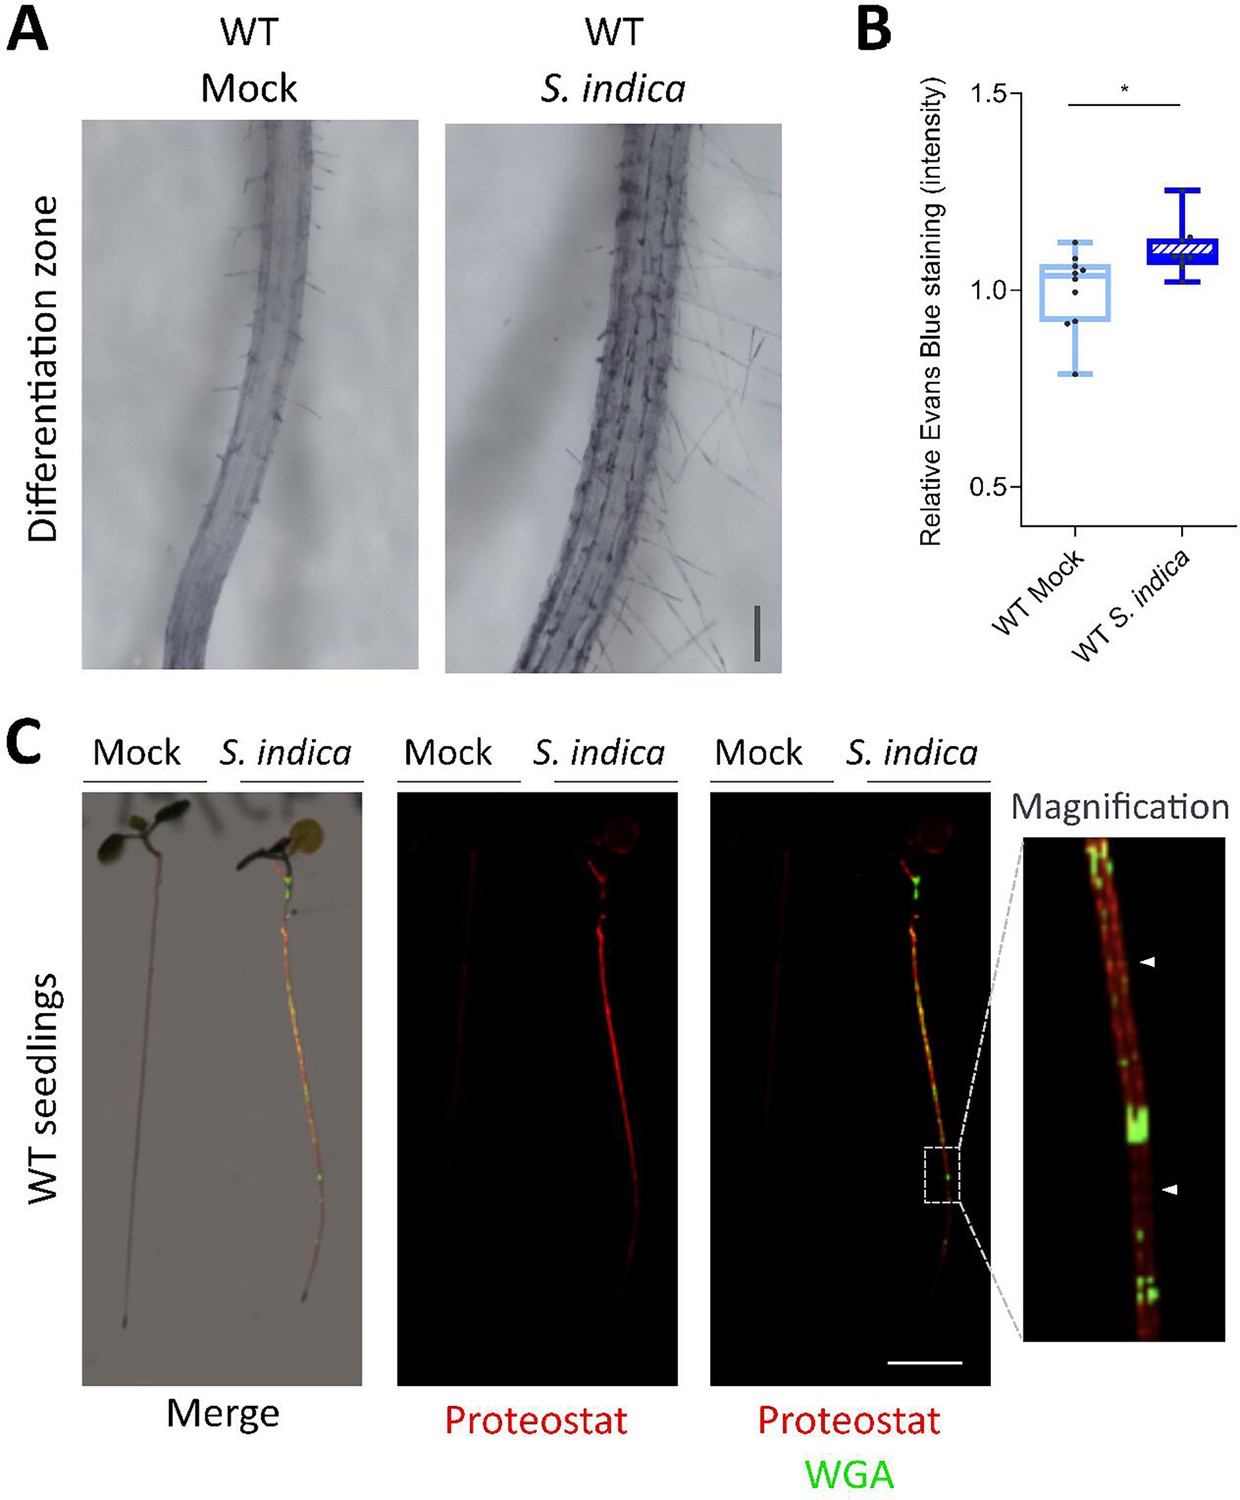
Phenotypic analysis of S. indica colonization on WT Arabidopsis roots.
(A) Evans blue staining of WT roots visualize S. indica-induced cell death in the differentiation zone at 12 dpi. Scale indicates 100 µm. (B) Quantification of S. indica induced cell death in WT Arabidopsis, measuring relative Evans blue staining intensity (representative images shown in A). Ten plants at 12 dpi were evaluated. Statistical analysis was performed with a two-tailed Student’s t test for unpaired samples (F [9, 8] = 2.248; p<0.05). (C) Representative images of S. indica-colonized WT seedlings stained with Proteostat (red) and WGA-AF 488 (green), showing S. indica-induced protein aggregation/misfolding. Magnification panel shows Proteostat staining in zones of the root where S. indica is not present (white arrowheads). Scale indicates 5 mm.
Figure 5—figure supplement 3
AtBFN1 is downregulated during colonization with beneficial microbes.
(A) qRT-PCR shows downregulation of BFN1 in Arabidopsis during colonization by S. vermifera and bacterial SynComs from H. vulgare (Hv) and A. thaliana. RNA was harvested from four replicates at 6 dpi, pooling 30 plants per replicate for each treatment. BFN1 expression levels are normalized to mock conditions. Statistical evaluation was performed via one-way ANOVA and Tukey’s post hoc test (F [43, 12] = 10.84; p<0.001). (B) Heatmap shows RNA-Seq expression of dPCD marker genes (Olvera-Carrillo et al., 2015) in mock-treated and S. vermifera-colonized Arabidopsis roots at 3, 6, and 10 dpi. TPM expression values are log2 transformed and row-scaled, showing an average of three biological replicates. Genes are clustered using Spearman correlation as distance measure. (C) BFN1 and SMB expression profiles corresponding to RNA-Seq expression. Asterisk indicates significantly different expression (adjusted p-value <0.05).
Figure 6
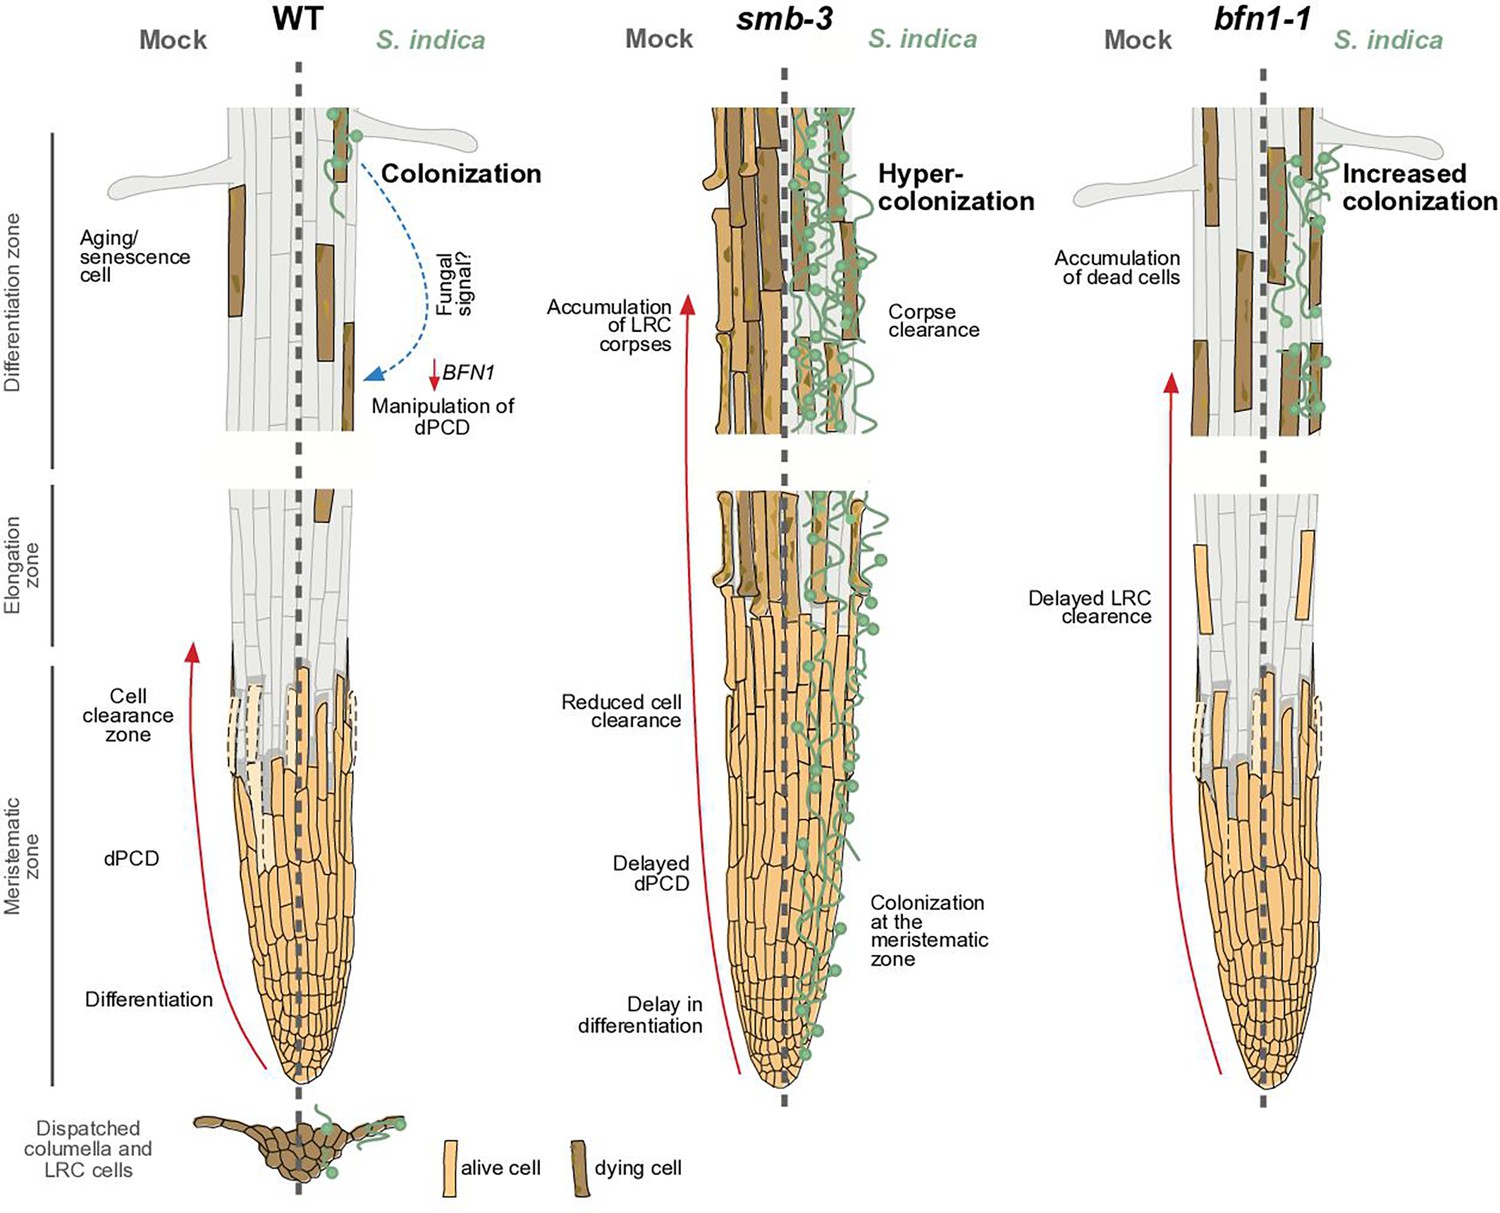
dPCD and its proposed effects on plant-microbe interactions.
The root cap protects and covers the stem cells of the root apical meristem. Its size in Arabidopsis is maintained by a high cellular turnover of root cap cells. While the columella root cap is shed from the root tip, a dPCD machinery marks the final step of LRC differentiation and prevents LRC cells from entering into the elongation zone. Induction of cell death by the transcription factor SMB is followed by irreversible DNA fragmentation and cell corpse clearance, mediated by the nuclease BFN1, a downstream executor of dPCD (Fendrych et al., 2014). The absence of dPCD induction in the smb-3 knockout mutant leads to a delay in LRC differentiation and allows LRC cells to enter the elongation zone, where they die uncontrolled, resulting in an accumulation of LRC cell corpses along the differentiation zone. In a WT background, the fungal endophyte S. indica colonizes the differentiation zone of Arabidopsis roots and can also be found in shed columella cell packages. The impaired dPCD of the smb-3 mutant phenotype results in a hypercolonization of Arabidopsis roots, along the differentiation zone as well as the meristematic zone, highlighting that the continuous clearance of root cap cells is necessary for restricting microbial accommodation at the meristematic zone. Loss of the downstream dPCD executor BFN1 does not affect fungal colonization in the meristematic zone but increases accommodation by S. indica in the differentiation zone, where BFN1 appears to be involved in dPCD of senescent epidermal cells and undergoes downregulation during S. indica colonization.
Tables
Key resources table
| Reagent type (species) or resource | Designation | Source or reference | Identifiers | Additional information |
|---|---|---|---|---|
| Strain, strain background (Serendipita indica) | DSM11827 | German 362 Collection of Microorganisms and Cell Cultures, Braunschweig, Germany | DSM11827 | |
| Strain, strain background (Arabidopsis thaliana) | WT Col-0 | N-60000 | Col-0 | |
| Genetic reagent (A. thaliana) | bfn1-1 | Fendrych et al., 2014 | GK-197G12 | |
| Genetic reagent (A. thaliana) | smb-3 | Fendrych et al., 2014 | SALK_143526 C | |
| Genetic reagent (A. thaliana) | pBFN1::NLS-tdTOMATO | Huysmans et al., 2018 | ||
| Commercial assay, kit | Proteostat Aggresome detection kit | Enzo Life Sciences | CAT# ENZ-51035–0025 | 0.5 µl/ml Proteostat and 0.5 µl/ml Hoechst 33342 |
| Antibody | anti-polyQ (Mouse monoclonal) | Merck | MAB1574 | 1:1000 |
| Antibody | anti-Actin (Rabbit polyclonal) | Agrisera | AS132640 | 1:5000 |
| Software, algorithm | Prism8 | https://www.graphpad.com/ | RRID:SCR_002798 | |
| Software, algorithm | ImageJ | https://imagej.net/ | RRID:SCR_003070 | |
| Software, algorithm | EmpiriaStudio Software | LI-COR Biosciences | RRID:SCR_022512 | v. 3.2.0.186 |
| Software, algorithm | LASX | https://www.leica-microsystems.com/ | RRID:SCR_013673 | |
| Sequence-based reagent | AtUBI_F | This paper | PCR primers | CCAAGCCGAAGAAGATCAAG |
| Sequence-based reagent | AtUBI_R | This paper | PCR primers | ACTCCTTCCTCAAACGCTGA |
| Sequence-based reagent | FW_BFN1-A_qPCR | This paper | PCR primers | GGCGTCAAGTCTGGTGAAAC |
| Sequence-based reagent | RV_BFN1-A_qPCR | This paper | PCR primers | ACCCGGTTTAGTATCATGGCT |
| Sequence-based reagent | TEF_S. indica qPCR_F | This paper | PCR primers | GCAAGTTCTCCGAGCTCATC |
| Sequence-based reagent | TEF_S. indica qPCR_R | This paper | PCR primers | CCAAGTGGTGGGTACTCGTT |
| Other | Odyssey M Imaging System | LI-COR Biosciences | Equipment | |
| Other | FV1000 confocal laser scanning microscope | Olympus | Equipment | |
| Other | LSM Meta 710 | Carl Zeiss Technology | Equipment | |
| Other | Leica M165 FC Microscope | Leica Microsystems | Equipment | |
| Other | CFX connect real time system | BioRad | Equipment | |
| Other | Alexa Fluor 488 conjugated with Wheat Germ Agglutinin (WGA-AF) stain | Invitrogen | CAT# 11261 | 5 µl/mL from 1 mg/ml stock |
| Other | Propidium iodide (PI) stain | Sigma-Aldrich | 10 µg/ml | |
| Other | Evans blue stain | Sigma-Aldrich | CAS# 314-13-6 | 2 mM Evans blue staining concentration |
Additional files
Download links
A two-part list of links to download the article, or parts of the article, in various formats.
Downloads (link to download the article as PDF)
Open citations (links to open the citations from this article in various online reference manager services)
Cite this article (links to download the citations from this article in formats compatible with various reference manager tools)
Root cap cell corpse clearance limits microbial colonization in Arabidopsis thaliana
eLife 13:RP96266.
https://doi.org/10.7554/eLife.96266.3


