DNA methylome regulates virulence and metabolism in Pseudomonas syringae
- Department of Biomedical Sciences, City University of Hong Kong, China
- Shenzhen Research Institute, City University of Hong Kong, Shenzhen, China
- Chengdu Research Institute, City University of Hong Kong, China
- Institute of Digital Medicine, City University of Hong Kong, China
- Tung Research Centre, City University of Hong Kong, China
Figures
Figure 1 with 1 supplement
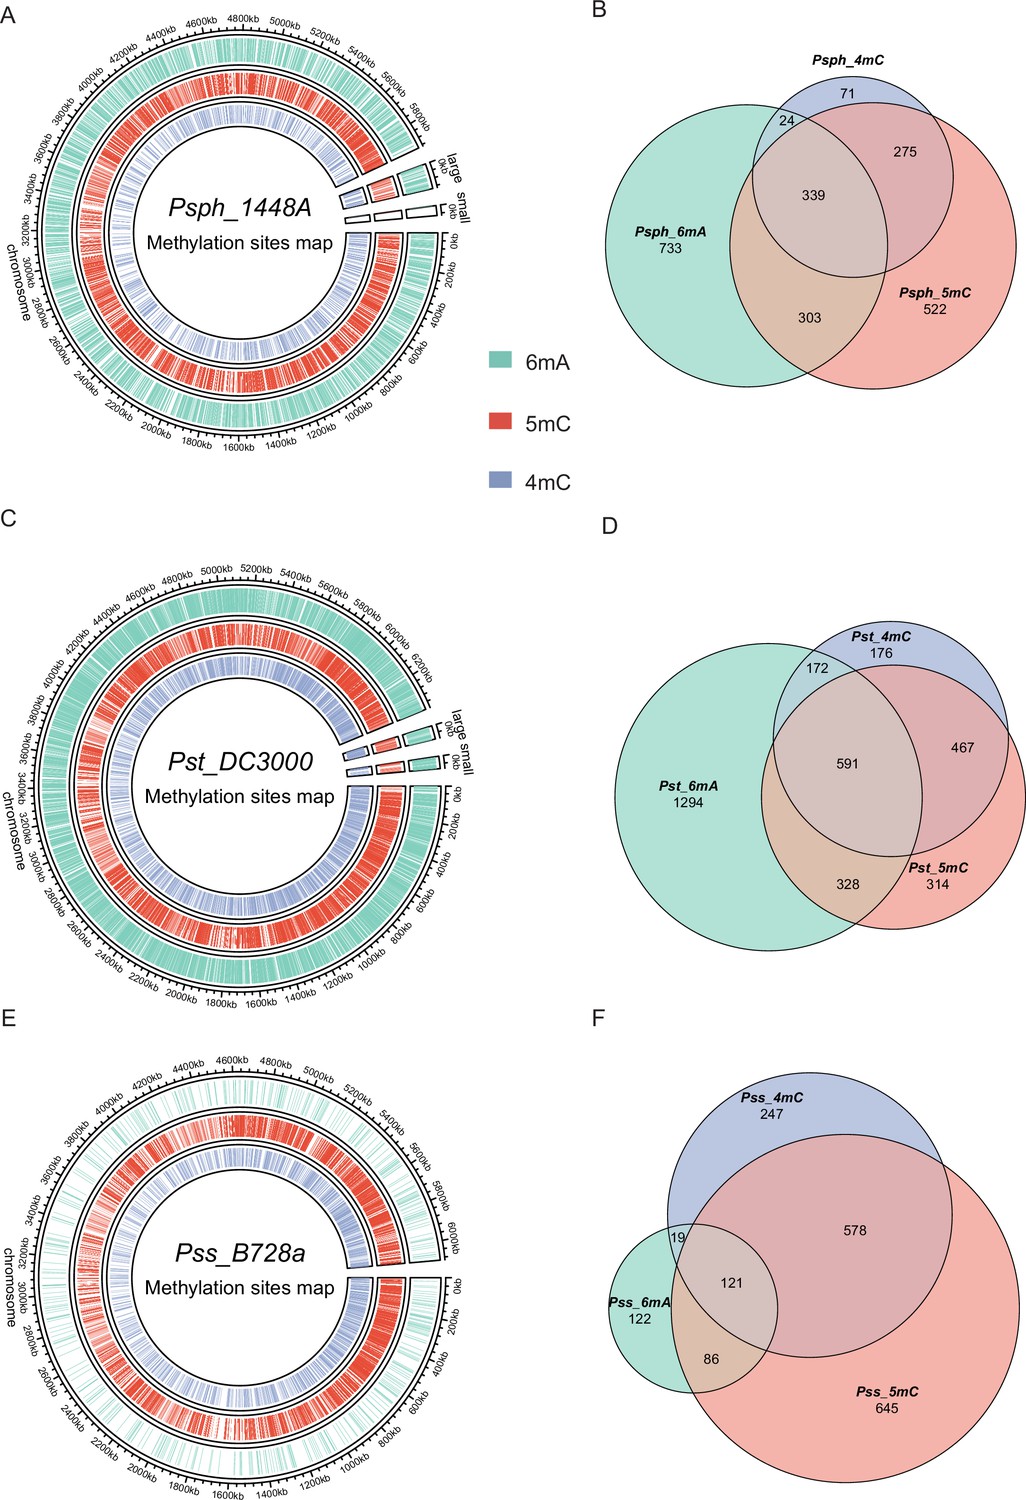
Genome-wide identification of P. syringae DNA methylation.
(A) The circle map displays the distribution of 6mA, 5mC, and 4mC in Psph WT. (B) The Venn plot reveals overlapped genes within three types of DNA methylation of Psph WT. (C) The circle map displays the distribution of 6mA, 5mC, and 4mC in Pst WT. (D) The Venn plot reveals overlapped genes within three types of DNA methylation of Pst WT. (E) The circle map displays the distribution of 6mA, 5mC, and 4mC in Pss WT. (F) The Venn plot reveals overlapped genes within three types of DNA methylation of Pss WT.
Figure 1—figure supplement 1
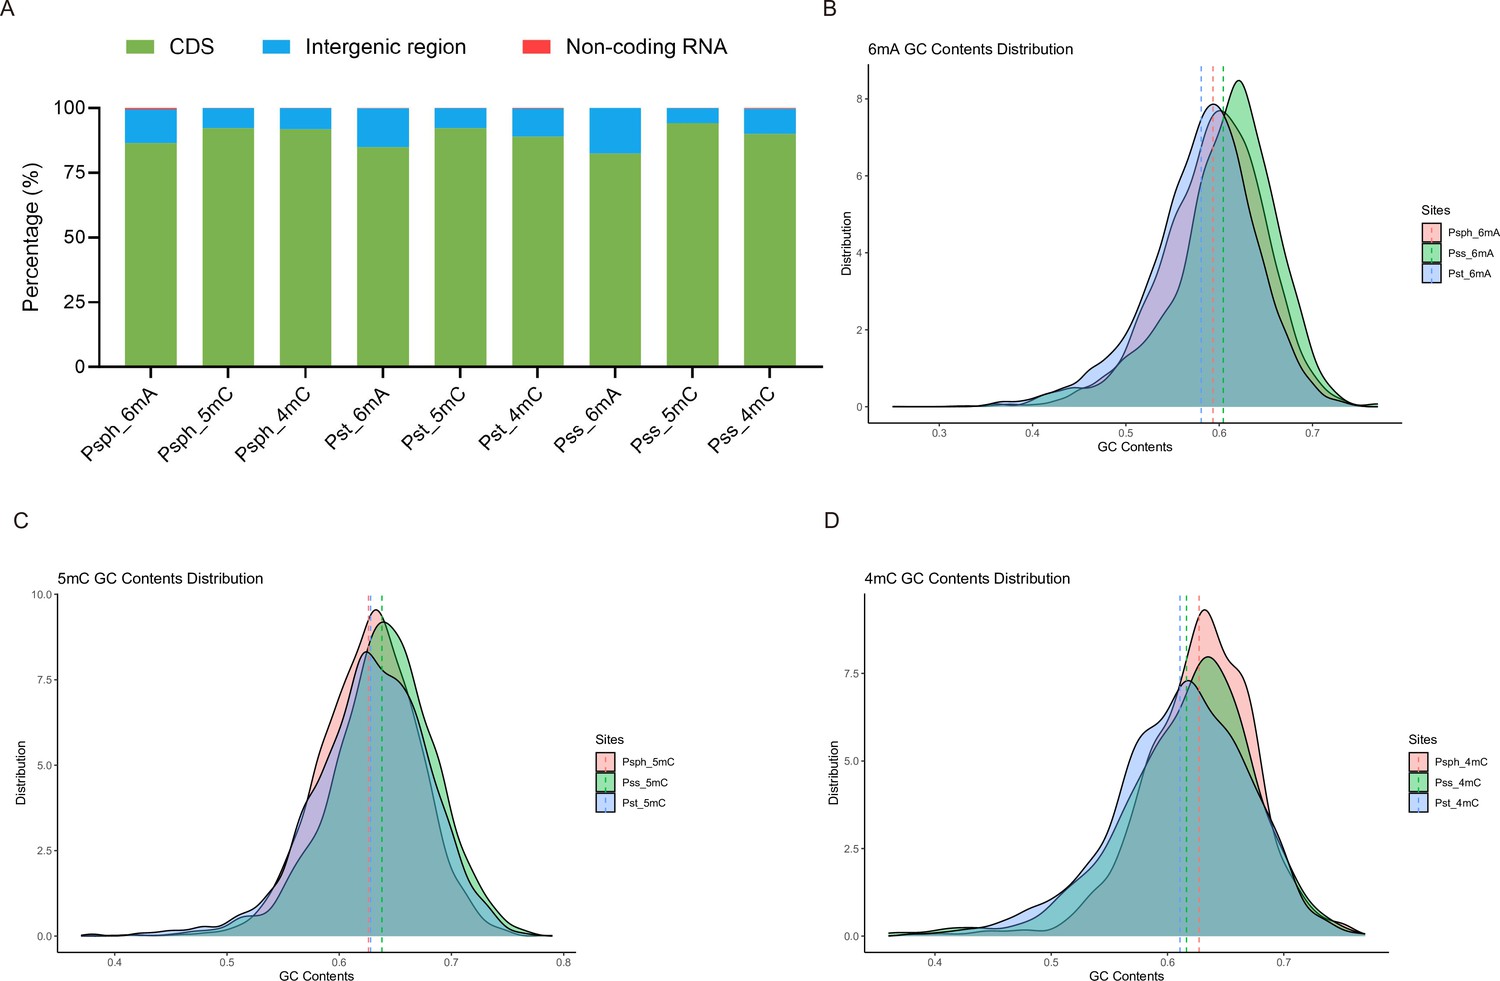
Distribution patterns of methylation sites in three model strains.
(A) Bar plot shows the distribution of modified sites located in different regions of coding sequence (CDS), intergenic region, and non-coding RNA. (B) GC contents distribution of 6mA between three P. syringae strains. (C) GC contents distribution of 5mC between three P. syringae strains. (D) GC contents distribution of 4mC between three P. syringae strains.
Figure 2 with 1 supplement
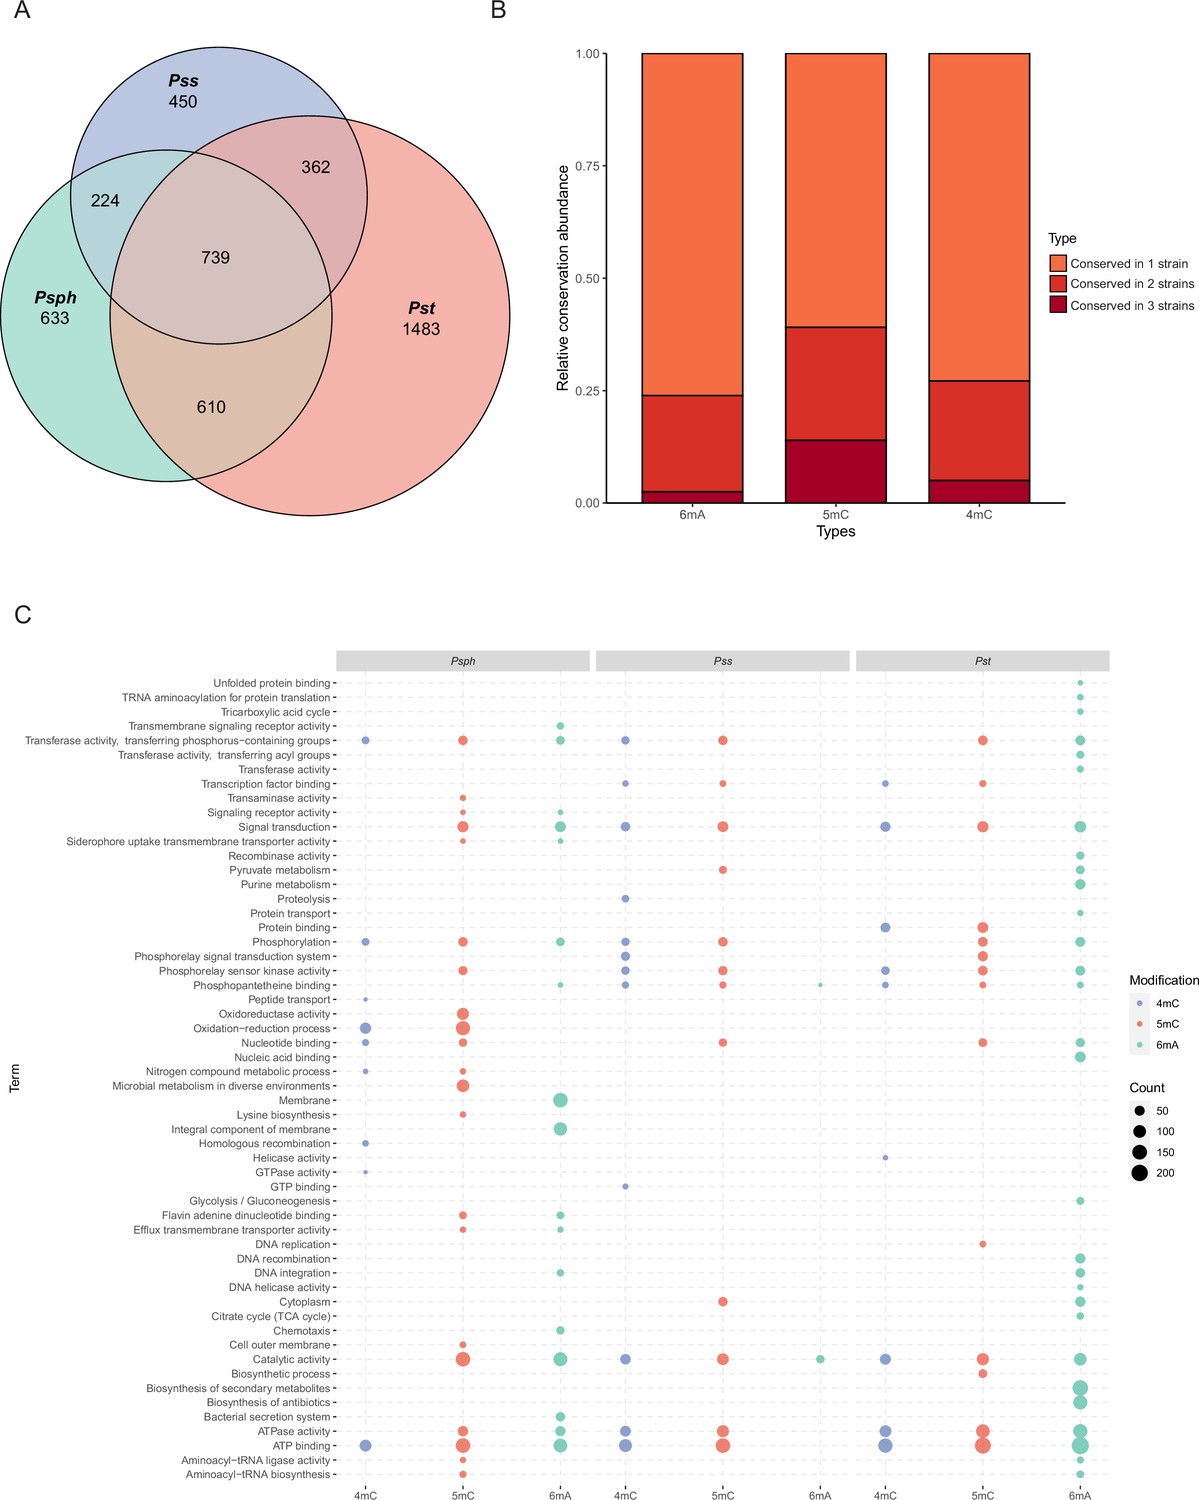
Functional enrichment analysis of methylation sites in three P. syringae strains.
(A) Repartition of the total pool of modified genes among strains. (B) Proportion of methylated genes detected in one, two, or three genomes for all P. syringae strains and conserved DNA methylation sites with detected genes. (C) The dot plot revealed the significantly enriched functional pathways in gene ontology (GO) and Kyoto Encyclopedia of Genes and Genomes (KEGG) databases among three P. syringae strains. The specific names of each pathway were listed on the left, and each column with dots indicated the number of genes within one kind of methylation in one of three P. syringae strains. The size of the dots indicates the number of related genes.
Figure 2—figure supplement 1
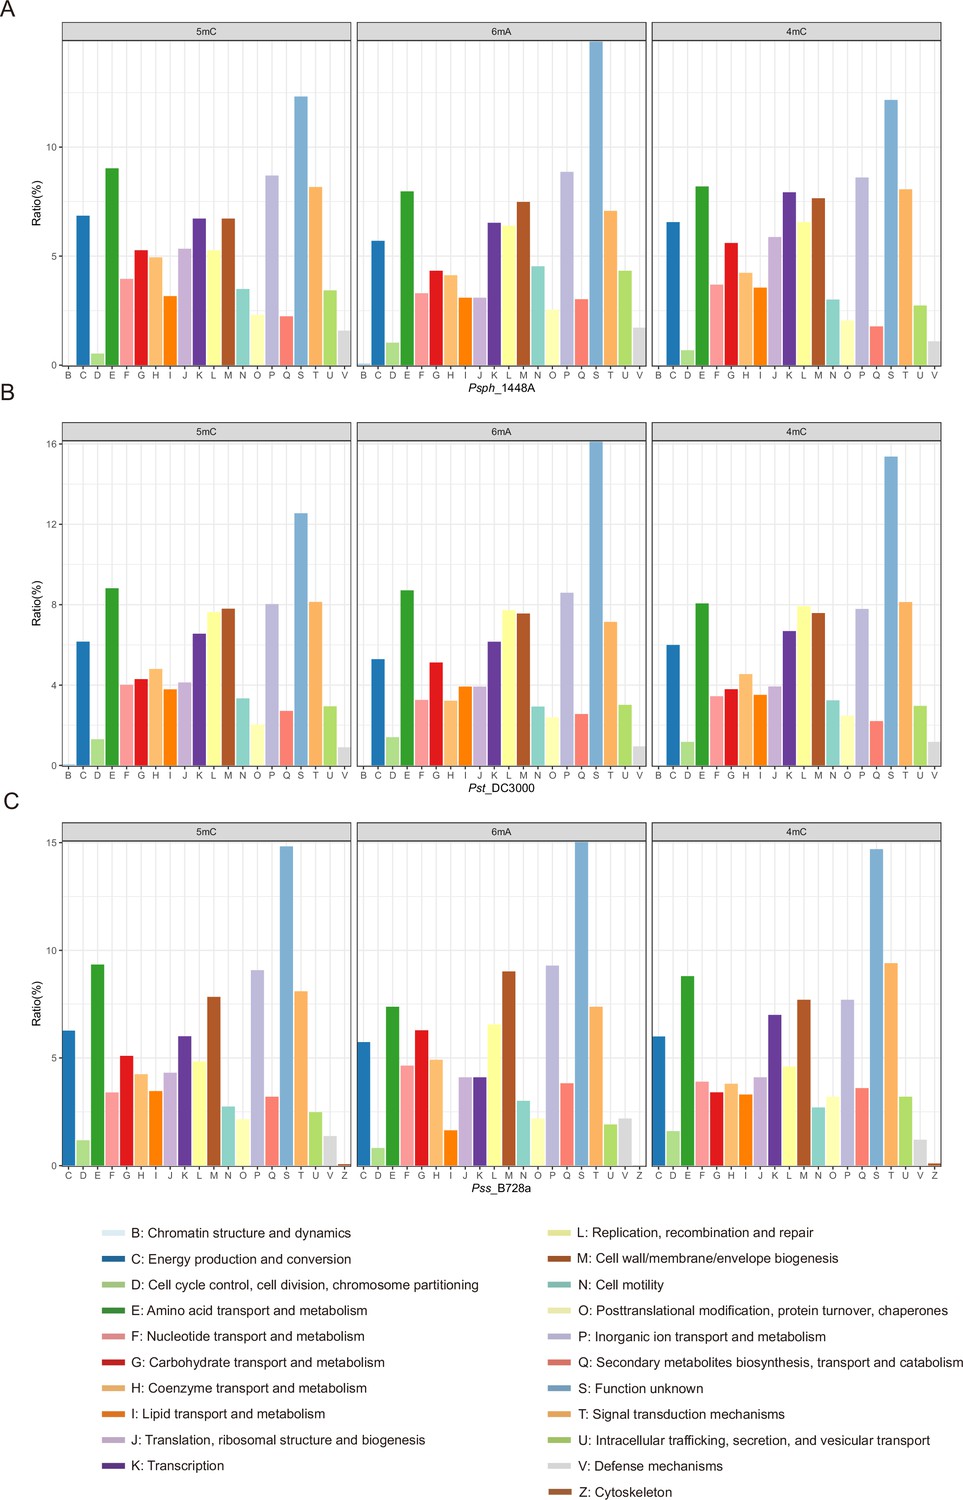
Cluster of Orthologous Group (COG) analysis of methylation sites in P. syringae.
(A) COG classification of three DNA methylations in Psph. (B) COG classification of three DNA methylations in Pst. (C) COG classification of three DNA methylations in Pss.
Figure 3 with 3 supplements
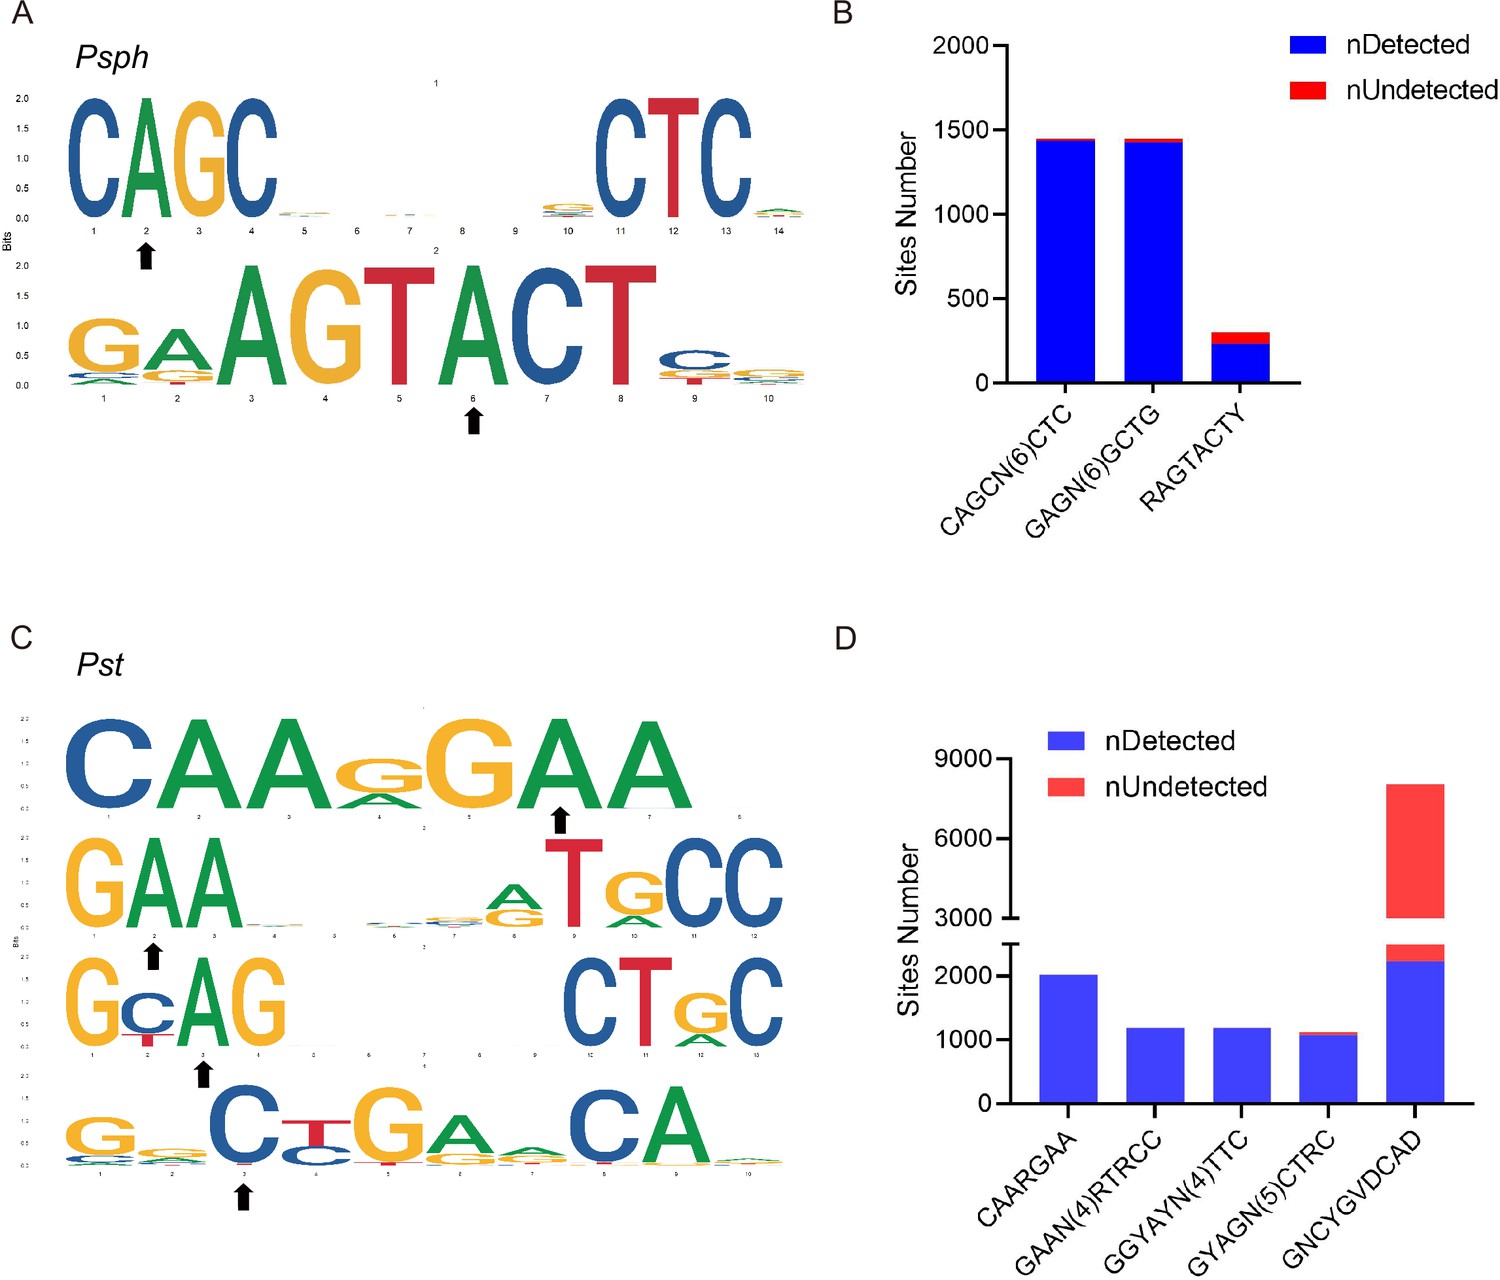
DNA methylation motifs in P. syringae.
(A) 6mA methylation motifs found in Psph using SMRT-seq. The black arrows indicate the site of adenine methylation. (B) Bar plot shows the abundance of methylated numbers throughout all motif sites in Psph. (C) 6mA and 4mC methylation motifs found in Pst using SMRT-seq. The black arrows indicate the site of base methylation. (D) Bar plot shows the abundance of methylated numbers throughout all motif sites in Pst.
Figure 3—figure supplement 1
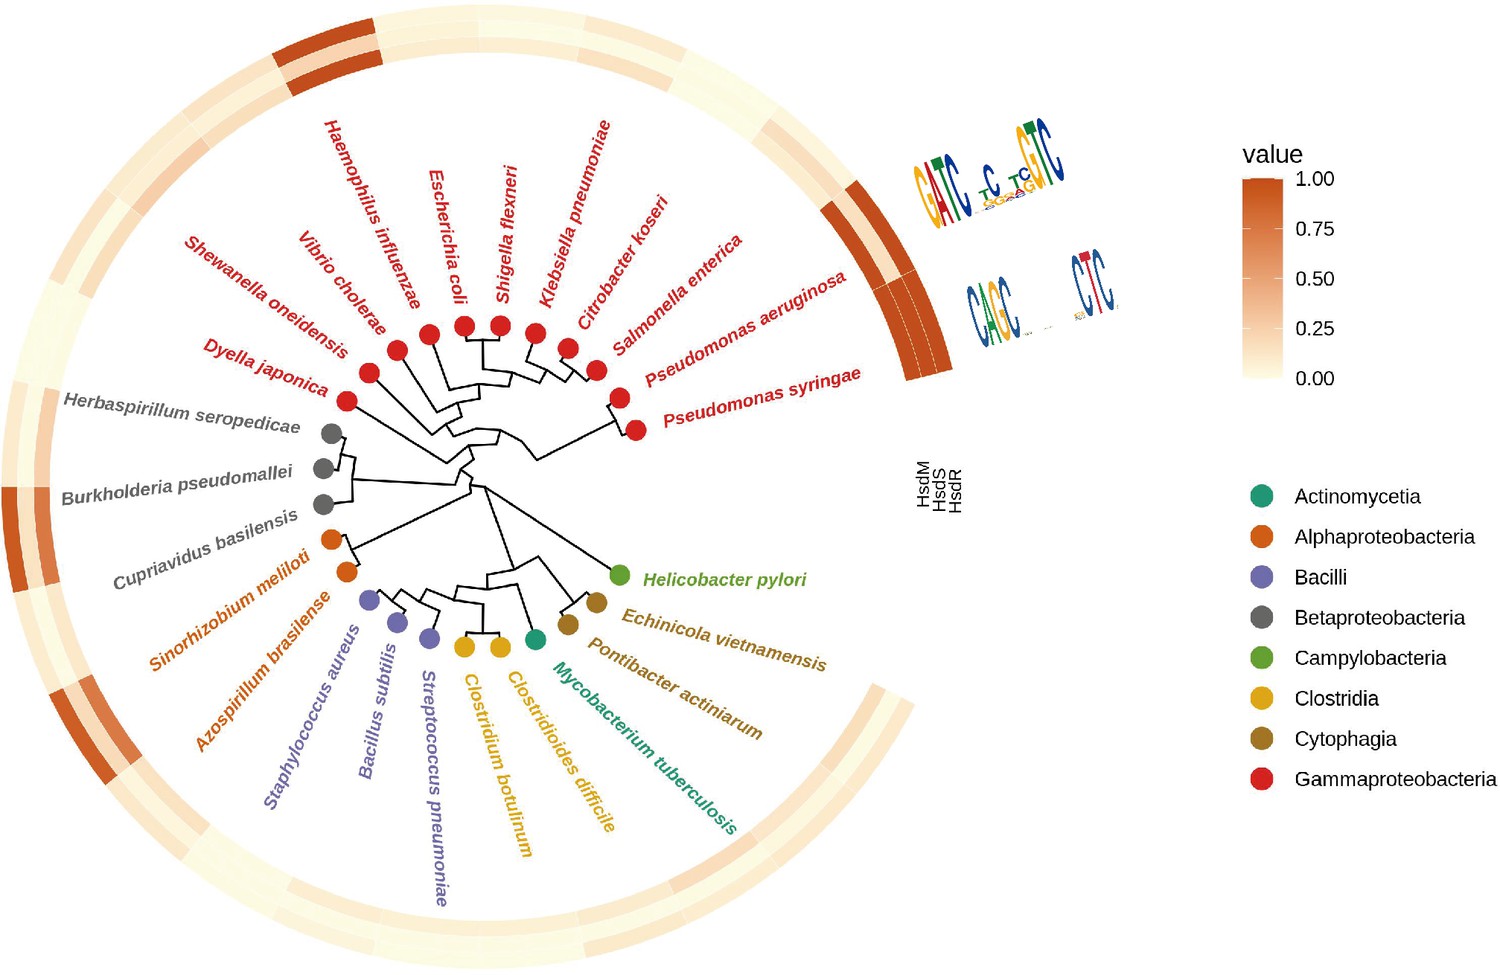
Comparative genomic analysis of Type I RM system among bacterial genus.
Different species are highlighted in different colors. The color key indicates the %identity compared to the MTases in Psph.
Figure 3—figure supplement 2
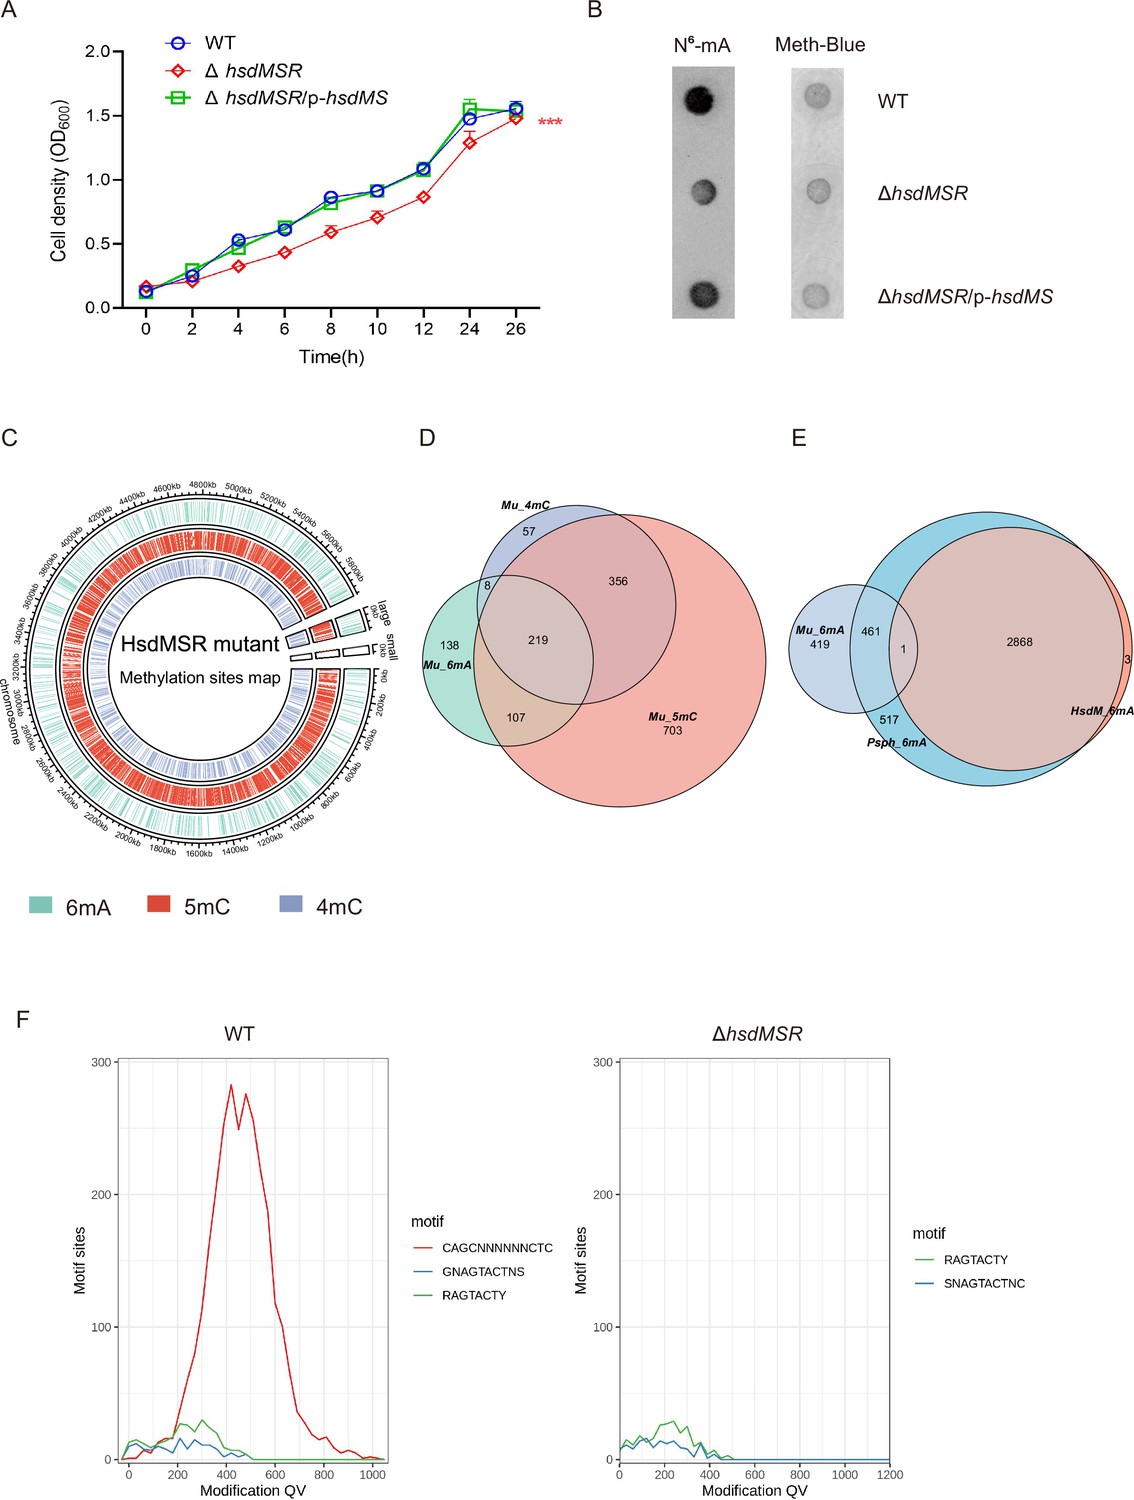
Identification of Type I DNA methyltransferase in Psph.
(A) Growth curve of Psph WT, ΔhsdMSR, and complemented strains at 28°C in KB medium. (B) HsdMSR can catalyze 6mA formation in Psph. (C) The circle map displays the distribution of 6mA, 5mC, and 4mC in the HsdMSR mutant. (D) The Venn plot reveals overlapped genes within three types of DNA methylation of HsdMSR mutant. (E) The Venn plot reveals overlapped 6mA sites among Psph WT, HsdMSR mutant, and the loci of the motif CAGCN(6)CTC. (F) SMRT-seq reveals that HsdMSR catalyzed the 6mA motif CAGCN(6)CTC.
Figure 3—figure supplement 3
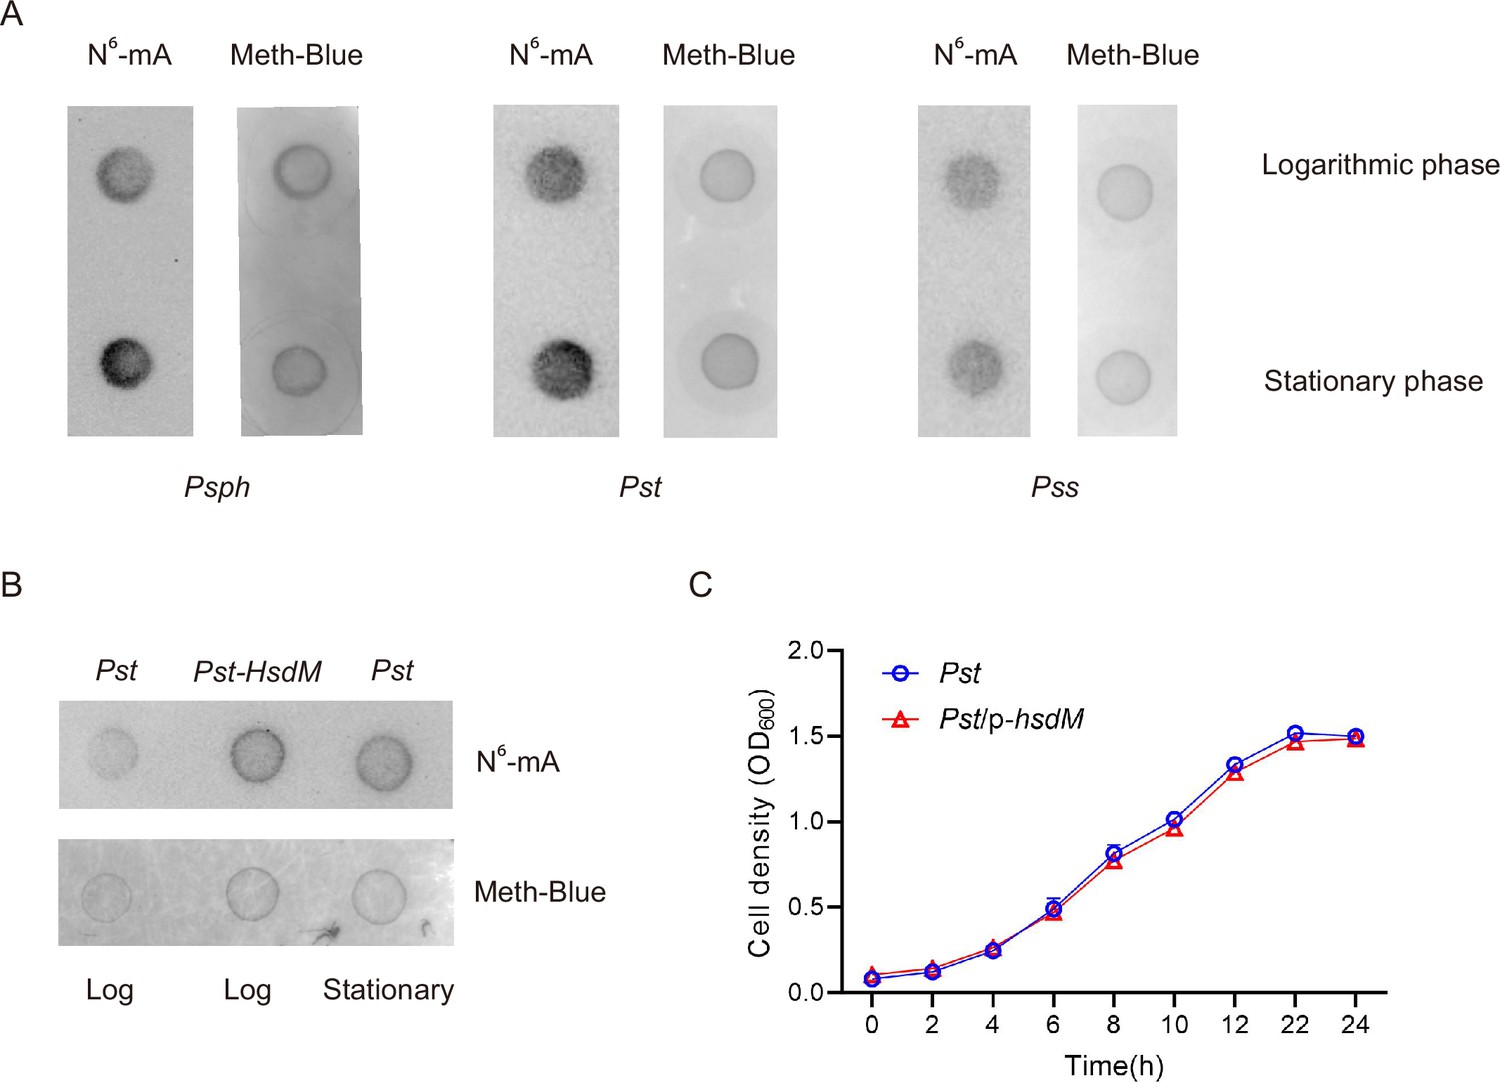
Effects of growth phases on methylation in P. syringae.
(A) Dot blot results of three P. syringae strains in logarithmic and stationary phases. (B) Overexpression of HsdM showed a higher 6mA modification level than that in wild-type (WT). (C) Overexpression of HsdM did not affect the growth of Pst.
Figure 4
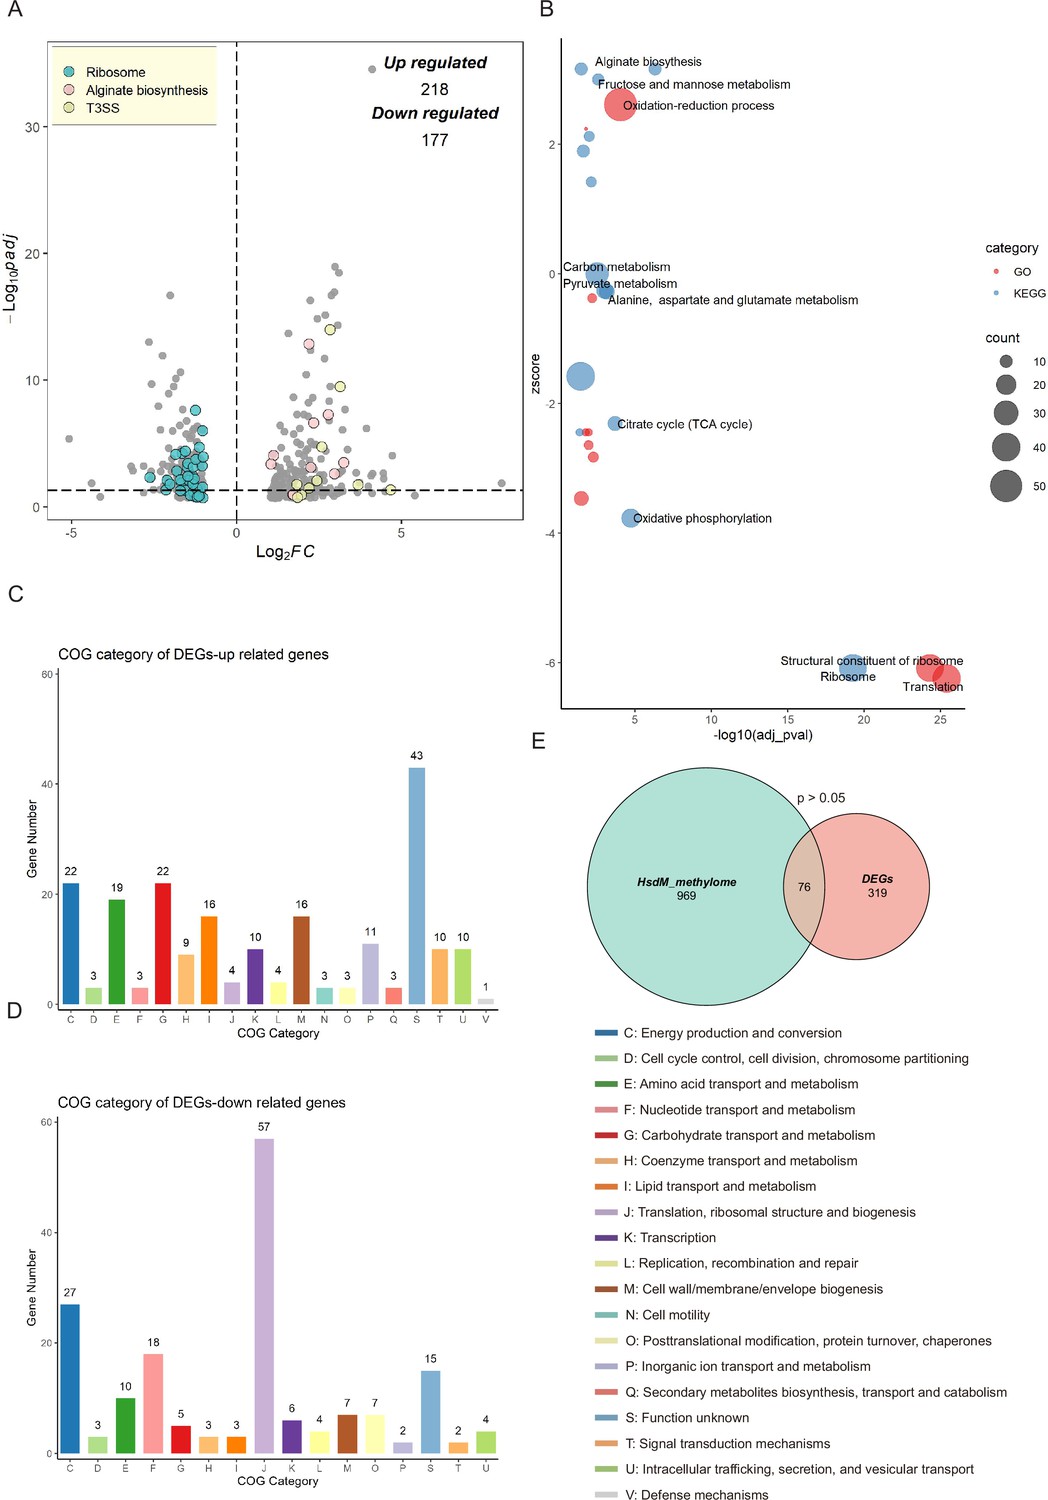
Transcriptional changes profiling of hsdMSR mutant in Psph.
(A) The volcano plot reveals differentially expressed genes (DEGs) between Psph WT and ΔhsdMSR. The DEGs were (|log2FC| > 1 and adjusted p-value <0.05) in blue (ribosomal protein), pink (alginate biosynthesis), and yellow (T3SS). Each dot represents one gene. (B) Bubble plot shows enriched gene ontology (GO) (red) and Kyoto Encyclopedia of Genes and Genomes (KEGG) (blue) terms based on the DEGs between Psph WT and ΔhsdMSR. The x-axis shows the significance of functional annotation terms (−log10 adjusted p-value), and the y-axis indicates the Z-score of terms. The bubble size represents the gene number of terms. (C) Cluster of Orthologous Group (COG) classification and distribution of upregulated DEGs. (D) COG classification and distribution of downregulated DEGs. COG terms are highlighted in different colors. (E) Venn plot reveals the overlapped genes between DEGs and genes within the HsdMSR motif.
Figure 5 with 1 supplement
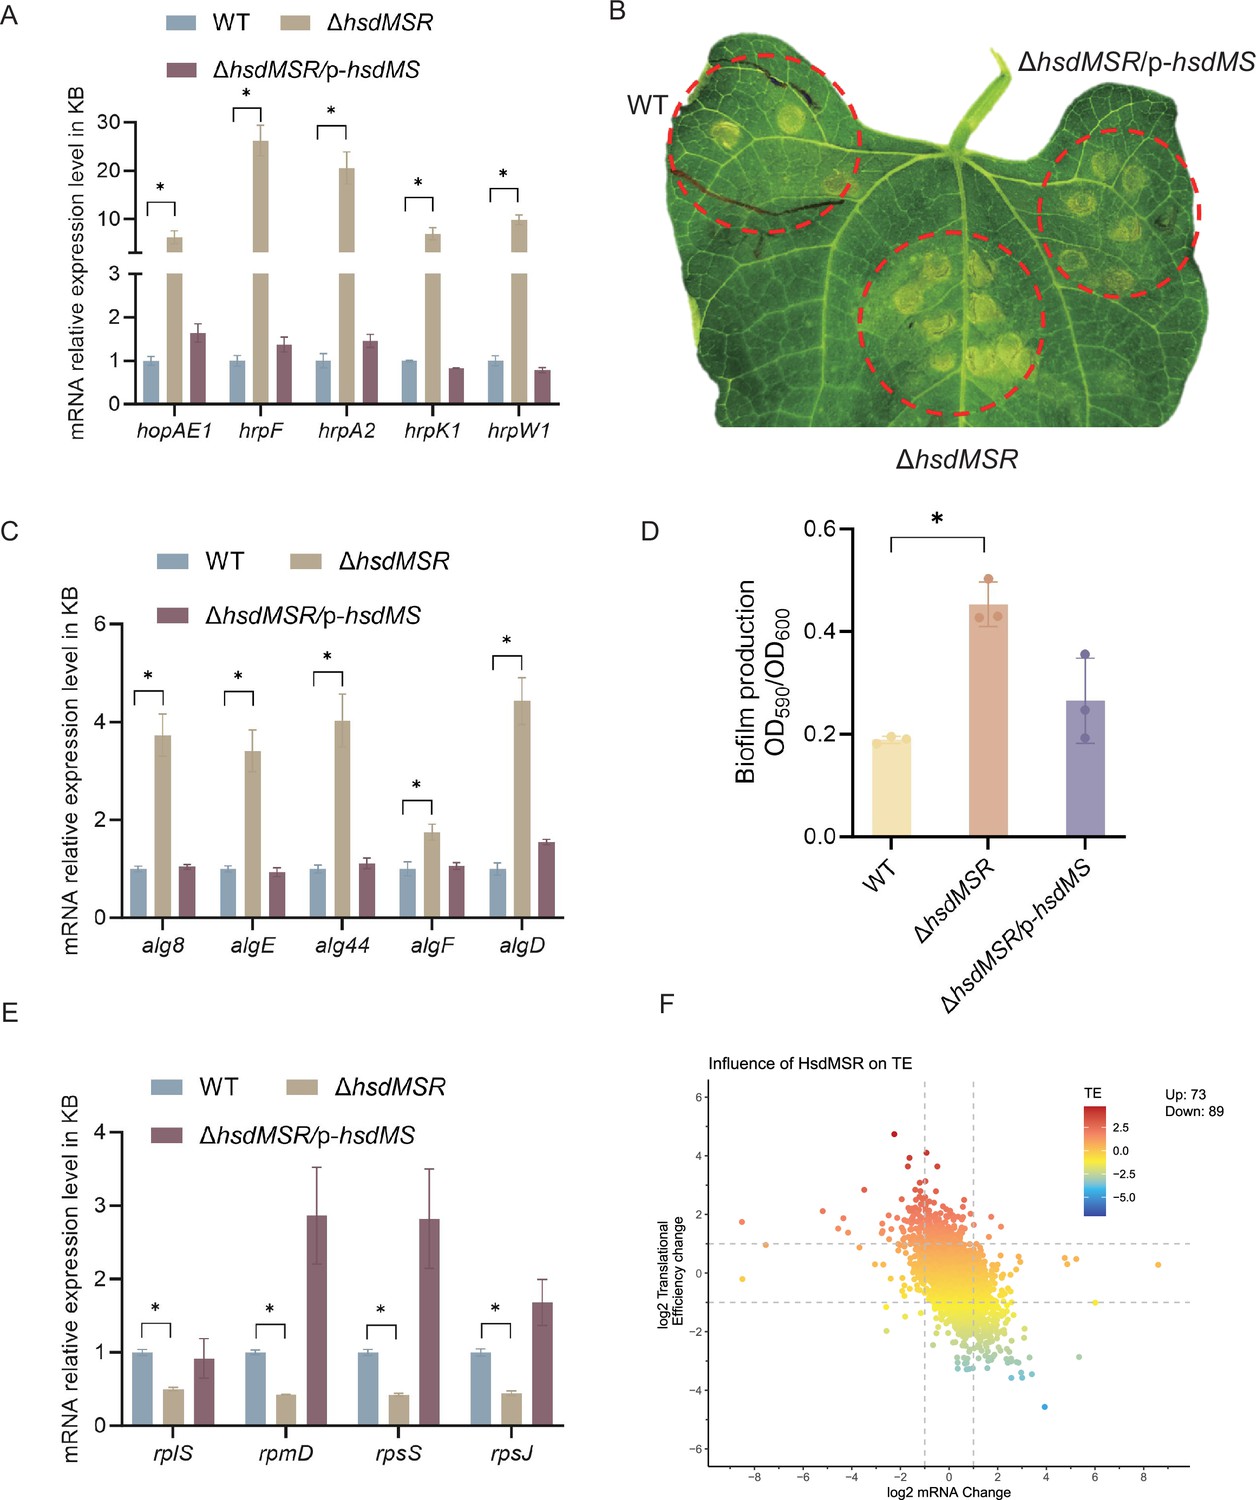
Influence of HsdMSR on virulence and metabolism in Psph.
(A) HsdMSR negatively regulated T3SS-related genes. Data are shown as means ± SD (n = 3). Statistical significance was determined using two-tailed Student's t-test (*p < 0.05). (B) Disease symptoms caused by Psph WT, ΔhsdMSR, and the complemented strains, photographing 6 days after inoculation of 105 CFU/ml bacteria. (C) HsdMSR negatively regulated alginate biosynthesis-related genes. Data are shown as means ± SD (n = 3). Statistical significance was determined using two-tailed Student's t-test (*p < 0.05). (D) The quantification of biofilm production in the Psph WT, ΔhsdMSR, and the complemented strains using a crystal violate staining assay. Data are shown as means ± SD (n = 3). Statistical significance was determined using two-tailed Student's t-test (*p < 0.05). (E) HsdMSR positively regulated ribosomal protein-related genes. Data are shown as means ± SD (n = 3). Statistical significance was determined using two-tailed Student's t-test (*p < 0.05). (F) The scatterplot shows the translational efficiency (TE) and mRNA change between Psph WT and ΔhsdMSR. The x-axis presents the log2FC of the mRNA level, and the y-axis shows the log2FC of the TE. The greater TE is represented in red, whereas the lesser TE is displayed in blue.
Figure 5—figure supplement 1
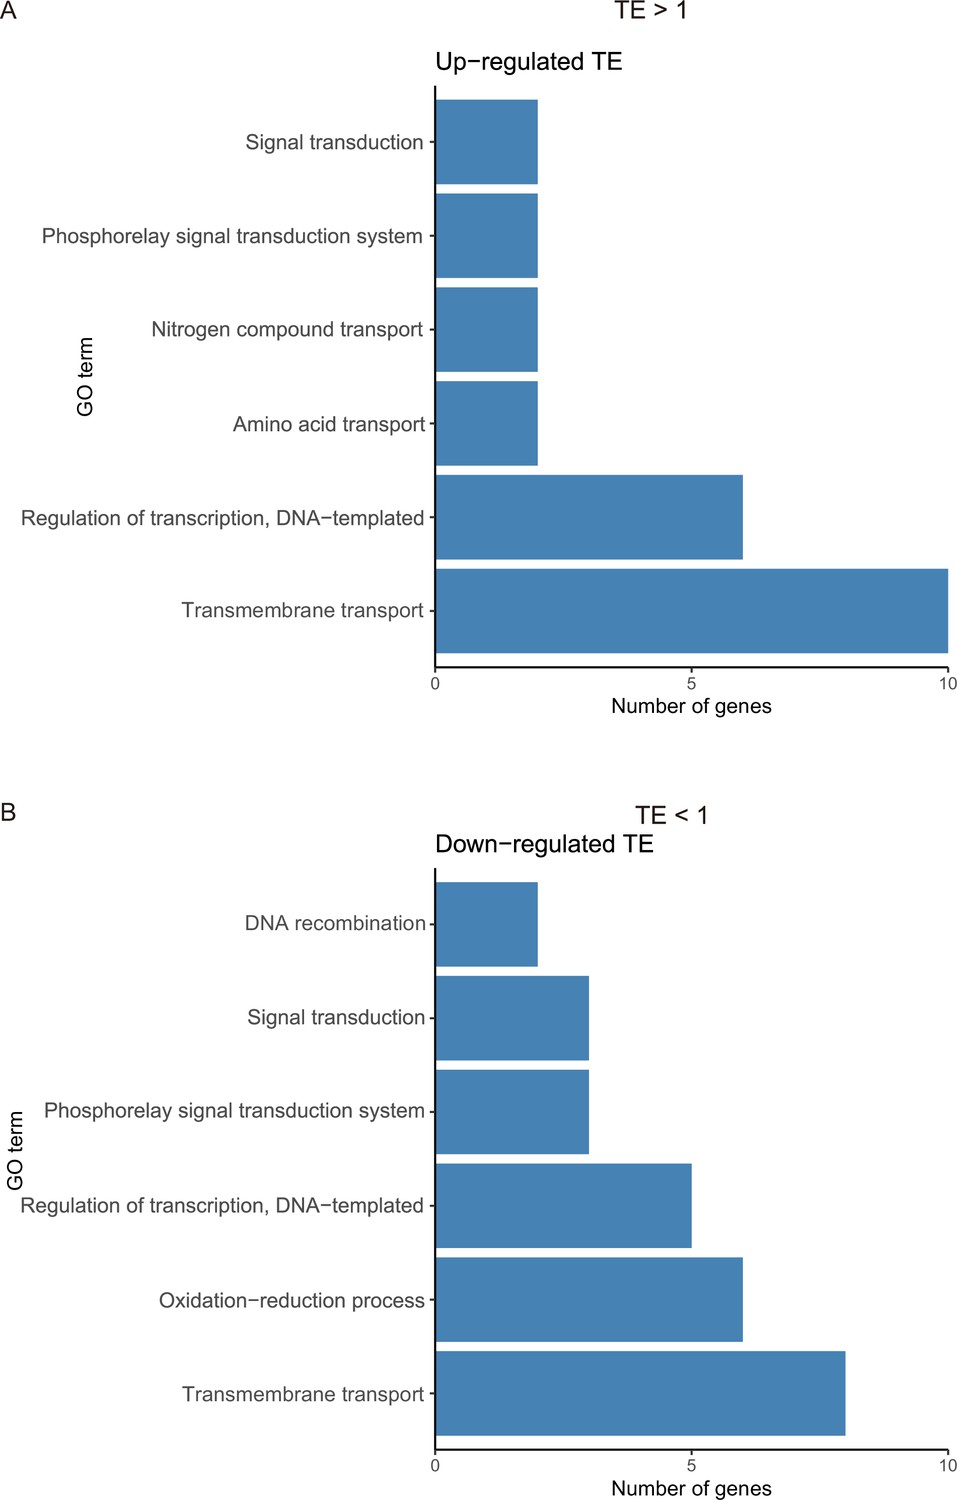
Number of genes with significant translational efficiency (TE) changes.
(A) The gene ontology (GO) terms for the genes in which TE changed more than 1-FC. (B) The GO terms for the genes in which TE changed less than 1-FC.
Figure 6

6mA methylation regulates gene transcription based on fully methylated.
(A) Upstream region sequence of hrpF carrying the HsdMSR motif. Adenine methylation is highlighted in red. (B) Constantly lux activity detection of the hrpF between Psph WT and ΔhsdMSR. Data are shown as means ± SD (n = 3). (C) Lux activity of hrpF between Psph WT and ΔhsdMSR with single- or double-point mutations. In the HsdMSR motif, ‘A’ was replaced by ‘C’ or ‘T’ was replaced by ‘G’, highlighted in bold and underlined. Data are shown as means ± SD (n = 9).
Additional files
-
Supplementary file 1
Restriction–modification systems predicted in P. syringae.
- https://cdn.elifesciences.org/articles/96290/elife-96290-supp1-v1.docx
-
Supplementary file 2
Modified genes conserved in three P. syringae strains.
- https://cdn.elifesciences.org/articles/96290/elife-96290-supp2-v1.csv
-
Supplementary file 3
Differentially expressed genes (DEGs) between Psph WT and ΔhsdMSR.
- https://cdn.elifesciences.org/articles/96290/elife-96290-supp3-v1.csv
-
Supplementary file 4
Differentially expressed genes (DEGs) carrying HsdMSR motif in their putative promoter regions.
- https://cdn.elifesciences.org/articles/96290/elife-96290-supp4-v1.csv
-
Supplementary file 5
Genes with changed translational efficiency (TE) between Psph WT and ΔhsdMSR.
- https://cdn.elifesciences.org/articles/96290/elife-96290-supp5-v1.csv
-
Supplementary file 6
Strains, plasmids, and primers.
- https://cdn.elifesciences.org/articles/96290/elife-96290-supp6-v1.xlsx
-
MDAR checklist
- https://cdn.elifesciences.org/articles/96290/elife-96290-mdarchecklist1-v1.docx
Download links
A two-part list of links to download the article, or parts of the article, in various formats.
Downloads (link to download the article as PDF)
Open citations (links to open the citations from this article in various online reference manager services)
Cite this article (links to download the citations from this article in formats compatible with various reference manager tools)
DNA methylome regulates virulence and metabolism in Pseudomonas syringae
eLife 13:RP96290.
https://doi.org/10.7554/eLife.96290.3


