DNA methylome regulates virulence and metabolism in Pseudomonas syringae
- Department of Biomedical Sciences, City University of Hong Kong, China
- Shenzhen Research Institute, City University of Hong Kong, Shenzhen, China
- Chengdu Research Institute, City University of Hong Kong, China
- Institute of Digital Medicine, City University of Hong Kong, China
- Tung Research Centre, City University of Hong Kong, China
eLife Assessment
This valuable study presents findings on DNA methylation as an efficient epigenetic transcriptional regulating strategy in bacteria. The authors utilized single-molecule real-time sequencing to profile the DNA methylation landscape across three model pathovars of Pseudomonas syringae, identifying significant epigenetic mechanisms through the Type-I restriction-modification system, which includes a conserved sequence motif associated with N6-methyladenine. The evidence presented is solid and the study provides novel insights into the epigenetic mechanisms of P. syringae, expanding the understanding of bacterial pathogenicity and adaptation.
https://doi.org/10.7554/eLife.96290.3.sa0Significance of the findings:
Valuable: Findings that have theoretical or practical implications for a subfield
- Landmark
- Fundamental
- Important
- Valuable
- Useful
Strength of evidence:
Solid: Methods, data and analyses broadly support the claims with only minor weaknesses
- Exceptional
- Compelling
- Convincing
- Solid
- Incomplete
- Inadequate
During the peer-review process the editor and reviewers write an eLife Assessment that summarises the significance of the findings reported in the article (on a scale ranging from landmark to useful) and the strength of the evidence (on a scale ranging from exceptional to inadequate). Learn more about eLife Assessments
Abstract
Bacterial pathogens employ epigenetic mechanisms, including DNA methylation, to adapt to environmental changes, and these mechanisms play important roles in various biological processes. Pseudomonas syringae is a model phytopathogenic bacterium, but its methylome is less well known than that of other species. In this study, we conducted single-molecule real-time sequencing to profile the DNA methylation landscape in three model pathovars of P. syringae. We identified one Type I restriction–modification system (HsdMSR), including the conserved sequence motif associated with N6-methyladenine (6mA). About 25–40% of the genes involved in DNA methylation were conserved in two or more of the strains, revealing the functional conservation of methylation in P. syringae. Subsequent transcriptomic analysis highlighted the involvement of HsdMSR in virulent and metabolic pathways, including the Type III secretion system, biofilm formation, and translational efficiency. The regulatory effect of HsdMSR on transcription was dependent on both strands being fully 6mA methylated. Overall, this work illustrated the methylation profile in P. syringae and the critical involvement of DNA methylation in regulating virulence and metabolism. Thus, this work contributes to a deeper understanding of epigenetic transcriptional control in P. syringae and related bacteria.
Introduction
Pseudomonas syringae inflicts leaf spots and cankers on plants globally, and its adequate control poses significant challenges. More than 60 pathovars have been identified, which infect almost all economically important crops in the world (Bull et al., 2010; Xin et al., 2018). P. syringae pv. phaseolicola 1448A (Psph), one of the classical strains of P. syringae, can cause severe halo blight of common beans (Phaseolus vulgaris), which raises it from a common pathogen to a molecular plant–pathogen bacterium (Arnold et al., 2011). P. syringae pv. tomato DC3000 (Pst) and P. syringae pv. syringae B728a (Pss) are two other model strains whose natural host plants are tomatoes and beans, respectively (Xin and He, 2013; Monier and Lindow, 2005). The most important weapon of P. syringae, and the first to be characterized, is the Type III secretion system (T3SS) encoded by hrp and hrc gene clusters, which are flanked by the conserved effector locus and deliver T3 effectors into host cells (Clarke et al., 2010).
The expression of T3SS genes is inhibited in nutrient media such as King’s B (KB), whereas it is induced in minimal medium or plant cells (Rahme et al., 1992; Xiao et al., 2004; Xiao et al., 1992). The HrpRSL pathway is the primary regulator of the T3SS in P. syringae, with HrpRS activating hrpL expression. HrpL then binds to the hrp box to induce the translation of downstream T3 effectors (Xiao et al., 1994; Hutcheson et al., 2001; Hendrickson et al., 2000). HrpRSL also impacts other virulence-related mechanisms, including motility, biofilm formation, siderophore production, and oxidative stress resistance, which are under the control of complicated regulatory networks, allowing P. syringae to infect plants (Haefele and Lindow, 1987; Dasgupta et al., 2003; Deng et al., 2014; Fan et al., 2020; Xie et al., 2021; Shao et al., 2021; Huang et al., 2022). However, the methylome and function of DNA methylation in P. syringae pathogenesis and metabolism remain largely unknown.
In bacteria, DNA methylation is the primary level of epigenetic regulation because these prokaryotes lack the histones and nucleosomes of eukaryotic cells. Bacterial DNA has three primary forms of methylation: N6-methyladenine (6mA), N4-methylcytosine (4mC), and N5-methylcytosine (5mC). The latter is the most common type in eukaryotes, while 6mA is the dominant form in prokaryotes. DNA methylation in bacteria is mainly the product of methyltransferase (MTase) enzymes, which transfer a methyl group from S-adenosyl-L-methionine to various positions on target bases, depending on the modification (Gold et al., 1963). MTases originate from the restriction–modification (R–M) system, which protects bacterial cells from invading DNA by recognizing and cleaving specific unmethylated motifs (Casadesús and Low, 2006; Wion and Casadesús, 2006). There are three main types of R–M systems, Types I, II, and III, categorized according to the related subunits and the precise site of DNA restriction (Bickle and Krüger, 1993; Loenen et al., 2014a). Additionally, orphan MTases are an emerging group of MTases without cognate restriction that are involved in the regulation of DNA replication and gene expression (Casadesús and Low, 2006). The Type I R–M system contains three host-specificity determinant (hsd) subunits, restriction (R), modification (M), and specificity (S), which are encoded by hsdR, hsdM, and hsdS, respectively. Genome sequencing and bioinformatics analyses have revealed that the HsdMSR system exists in around half of all bacteria and archaea species (Loenen et al., 2014a). Nonetheless, the biological roles and specific motifs alongside their targets of most MTases remain unknown, especially those related to 6mA (Blow et al., 2016).
A new sequencing technology, single-molecule real-time (SMRT) sequencing, can detect all three forms of DNA methylation, but particularly 6mA (Beaulaurier et al., 2019). SMRT-seq has been applied for complete genome sequencing and insertion sequence profiling in different P. syringae pv. actinidiae (Psa) strains (Ho et al., 2019; Poulter et al., 2018; Poulter et al., 2017). In P. aeruginosa, Type I R–M systems, along with their specific motifs, have been identified in the model strain PAO1 and two clinical strains via SMRT-seq. These MTases are considered to play important roles in P. aeruginosa virulence or drug resistance (Doberenz et al., 2017; Han et al., 2022; Li et al., 2023).
To study the targets and functions of DNA modifications in P. syringae, SMRT-seq was used to identify global methylation sites and reveal their conserved and divergent functions in the three model strains in this study. We found that HsdMSR in Psph was involved in modulating three pathways, namely T3SS, biofilm production, and the metabolism-related gene expression of ribosomal proteins. Moreover, we found that HsdMSR-mediated transcriptional regulation depends on the full methylation of both DNA strands. Taken together, our results provide insights into the involvement of DNA methylation in the phenotypic traits of P. syringae and transcription regulatory mechanisms that may apply to other pathogenic bacteria.
Results
Genome-wide methylome profiling of three model P. syringae strains
According to REBASE (Roberts et al., 2023) database prediction, 0–2 Type I R–M systems and 3–4 Type II R–M systems exist in the three pathovars of P. syringae, indicating that Type I is more conserved than Type II in this pathogen (Supplementary file 1). To characterize their methylomes, we performed SMRT-seq to obtain the methylation patterns on a genome-wide scale using DNA extracted from the stationary phase of the three wild-type (WT) strains. Our results revealed a total of 10,302 modified bases, of which 3849, 4646, and 1807 nucleotides were significantly identified as being 6mA, 5mC, and 4mC modified, with an interpulse duration ratio (IPD) of >1.5 throughout the genome of Psph (Figure 1A). After identifying the significantly modified sites, we orientated the gene locus tags within the methylated bases. Most genes harbored only 6mA modifications, although 339 genes harbored all three DNA methylation types (Figure 1B).
Figure 1 with 1 supplement see all
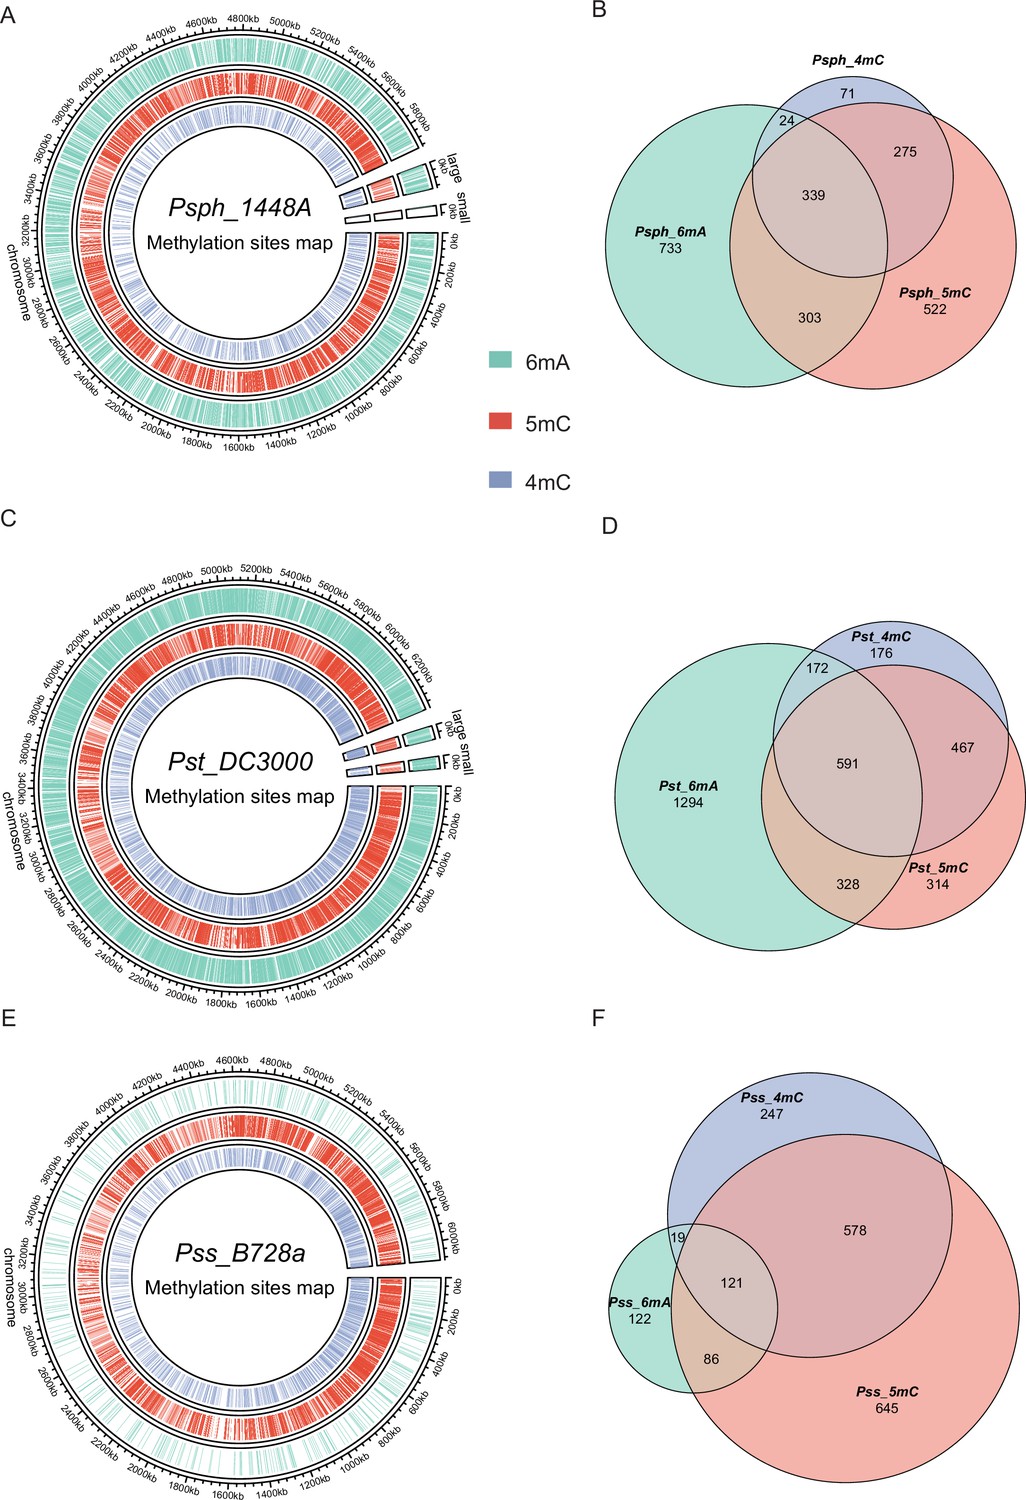
Genome-wide identification of P. syringae DNA methylation.
(A) The circle map displays the distribution of 6mA, 5mC, and 4mC in Psph WT. (B) The Venn plot reveals overlapped genes within three types of DNA methylation of Psph WT. (C) The circle map displays the distribution of 6mA, 5mC, and 4mC in Pst WT. (D) The Venn plot reveals overlapped genes within three types of DNA methylation of Pst WT. (E) The circle map displays the distribution of 6mA, 5mC, and 4mC in Pss WT. (F) The Venn plot reveals overlapped genes within three types of DNA methylation of Pss WT.
In Pst, a total of 6002, 2242, and 3514 methylation sites were significantly identified as 6mA, 4mC, and 5mC, respectively, using the same cut-off (IPD >1.5) (Figure 1C). Among these modified bases, more genes equipped with all three modification types were detected in Pst than Psph, with 591 (17.7%) genes exhibiting modifications in Pst sequences (Figure 1D). Additionally, the methylome atlas of Pss revealed a lower incidence of methylation than those of Psph and Pst, particularly in terms of 6mA modifications, which were only seen in 457 significant 6mA occurrences under the same threshold (IPD >1.5) and a total of 2853 and 1438 methylation sites were detected as 5mC and 4mC, respectively (Figure 1E). Comparative analysis of the three methylations in Pss showed that the highest numbers of genes were modified by 4mC and 5mC simultaneously (Figure 1F).
Characteristics of modified loci and GC contents in P. syringae
To further uncover the distribution of the modifications throughout the genome, we calculated how many of the three kinds of modified sites were in these three strains. The majority of modifications occurred in coding sequence (CDS) regions, accounting for at least 80% (Figure 1—figure supplement 1A), and less than 20% were in intergenic regions and non-coding RNA (tRNA and rRNA). However, compared with 4mC and 5mC, 6mA was more likely to be in intergenic regions, which suggests that it potentially functions in transcription regulation in P. syringae.
It is known that 5mC occurs within CpG sites in CpG islands, which contain higher GC percentages that is typical in the human genome (Bird, 2002). Additionally, the GC architecture can influence DNA methylation in eukaryotic cells (Gelfman et al., 2013). To determine the GC content characteristics of modification sites in P. syringae, we extracted the sequences 50 bp upstream and downstream from the modified bases and calculated their GC content. The distribution of modification sites and their GC content are shown in density plots. Compared with 4mC and 5mC, the GC contents of 6mA sites were the lowest and the closest to the average GC percentage of P. syringae (58% for Psph and Pst, 59.2% for Pss) (Figure 1—figure supplement 1B). In contrast, 5mC modification bases had the highest GC content, especially in Pss (Figure 1—figure supplement 1C). Furthermore, 4mC sites in Psph had a higher GC content than those in Psa and Pss (Figure 1—figure supplement 1D). Similar phenomena have been observed in various other bacterial species. For instance, the Escherichia coli MTase Dcm can catalyse the 5′CCWGG3′ motif (Militello et al., 2012). Furthermore, in Spiroplasma sp. strain MQ-1, more than 95% of 5mC modifications are found in high-CG sequences, which is similar to the pattern in eukaryotes (Nur et al., 1985).
Methylated genes are functionally conserved among three P. syringae strains
When we compared the three methylation types in the three tested strains, we observed the conservation pattern among them (Figure 2A, B and Supplementary file 2). Notably, about 25–45% of methylated genes were conserved in two and three strains. Interestingly, 5mC had the highest conservation level (39.1%), which might be explained by the rare occurrence of 6mA in Pss. Conversely, an obviously higher degree of conservation was observed in virulence-related genes, including T3SS and alginate biosynthesis-related genes, between Psph and Pst (Supplementary file 2). Additionally, some methylated genes (n = 739) harbored sites for different modification types in the three strains (Figure 2A). For example, the modification sites of a Cro/CI family transcriptional factor (TF) in PSPPH_1319 were for different modification types in the three P. syringae strains. The Cro/CI are important TFs present in phages. The interaction between Cro and CI affects bacteria immunity status in Enterohemorrhagic Escherichia coli (EHEC) strains (Jin et al., 2022). Psph carried 6mA and 5mC, while Pst and Pss had 5mC and 4mC. This difference might result from differences in the MTases and their specific motifs (Supplementary file 2).
Figure 2 with 1 supplement see all
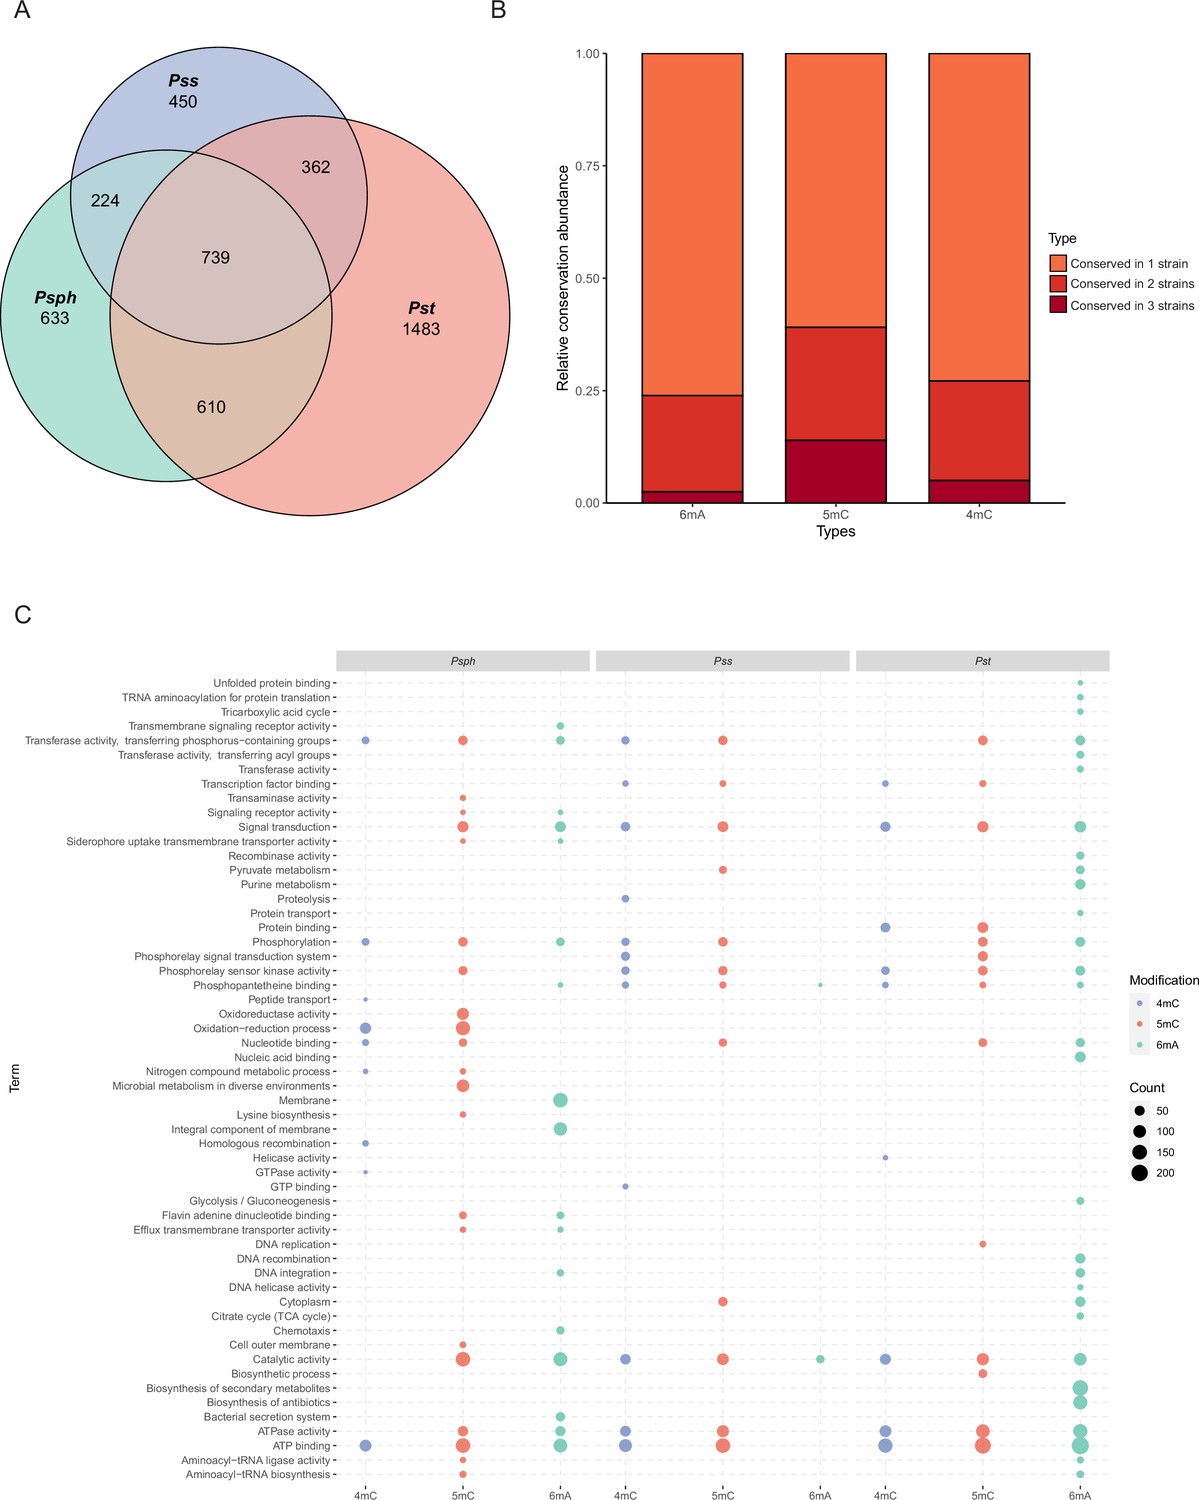
Functional enrichment analysis of methylation sites in three P. syringae strains.
(A) Repartition of the total pool of modified genes among strains. (B) Proportion of methylated genes detected in one, two, or three genomes for all P. syringae strains and conserved DNA methylation sites with detected genes. (C) The dot plot revealed the significantly enriched functional pathways in gene ontology (GO) and Kyoto Encyclopedia of Genes and Genomes (KEGG) databases among three P. syringae strains. The specific names of each pathway were listed on the left, and each column with dots indicated the number of genes within one kind of methylation in one of three P. syringae strains. The size of the dots indicates the number of related genes.
To elucidate the functions of genes methylated with these three modification types, functional enrichment analyses were performed based on gene ontology (GO) and Kyoto Encyclopedia of Genes and Genomes (KEGG) databases (Ashburner et al., 2000; Kanehisa and Goto, 2000). Analysis revealed the shared functional characteristics of genes with 5mC and 4mC modifications in Pss and Pst. In contrast, genes with 6mA modifications exhibited more conserved functional terms between Psph and Pst (Figure 2C). For instance, Pst and Pss contained 4mC-methylated genes enriched in signalling transduction and TF binding, whereas Psph exhibited enrichment in oxidation–reduction process and nucleic acid binding genes. Remarkably, notable conservation of functional terms was observed for genes with 6mA modifications, with at least 21 terms conserved between Psph and Pst. These terms included ATP binding, catalytic activity, integral component of membrane, transferase activity, and phosphorylation. We also conducted Cluster of Orthologous Group (COG) protein function analysis (Cantalapiedra et al., 2021; Huerta-Cepas et al., 2019), which assigned the methylated genes from the three strains to 20 categories with diverse functions (Figure 2—figure supplement 1A–C). In Psph, the top three COG classifications encompassed inorganic ion transport, amino acid transport, and transcription (Figure 2—figure supplement 1A). Furthermore, the abundance of modified genes related to cell wall/membrane/envelope biogenesis (M category) in Pss was lower than that of Psph and Pst. Despite the slight variations in COG distribution, the overall pattern exhibited considerable similarity and conservation across the three strains.
Six conserved sequence motifs of 6mA and 4mC were identified in P. syringae
Obtaining the whole methylomes of the three strains led us to investigate the associated MTases and their target motifs. The PacBio motif finder and MEME suite (Bailey et al., 2015) were used to determine the specific sequence motifs within 50 bp upstream and downstream of the significantly modified bases. Using the results of both software packages with corresponding cut-offs, we identified two 6mA motifs in Psph: CAGCN(6)CTC and RAGTACTY (Figure 3A). The bolded bases indicate the methylation sites in these motifs. The two motifs occurred a total of 2998 and 300 times in double strands, and more than 98% and 77% of those occurrences were methylated, respectively, revealing the high methylation rates of these two motifs and implying their crucial roles in Psph (Figure 3B). However, the analysis did not obtain any identified motifs for cytosine modifications.
Figure 3 with 3 supplements see all
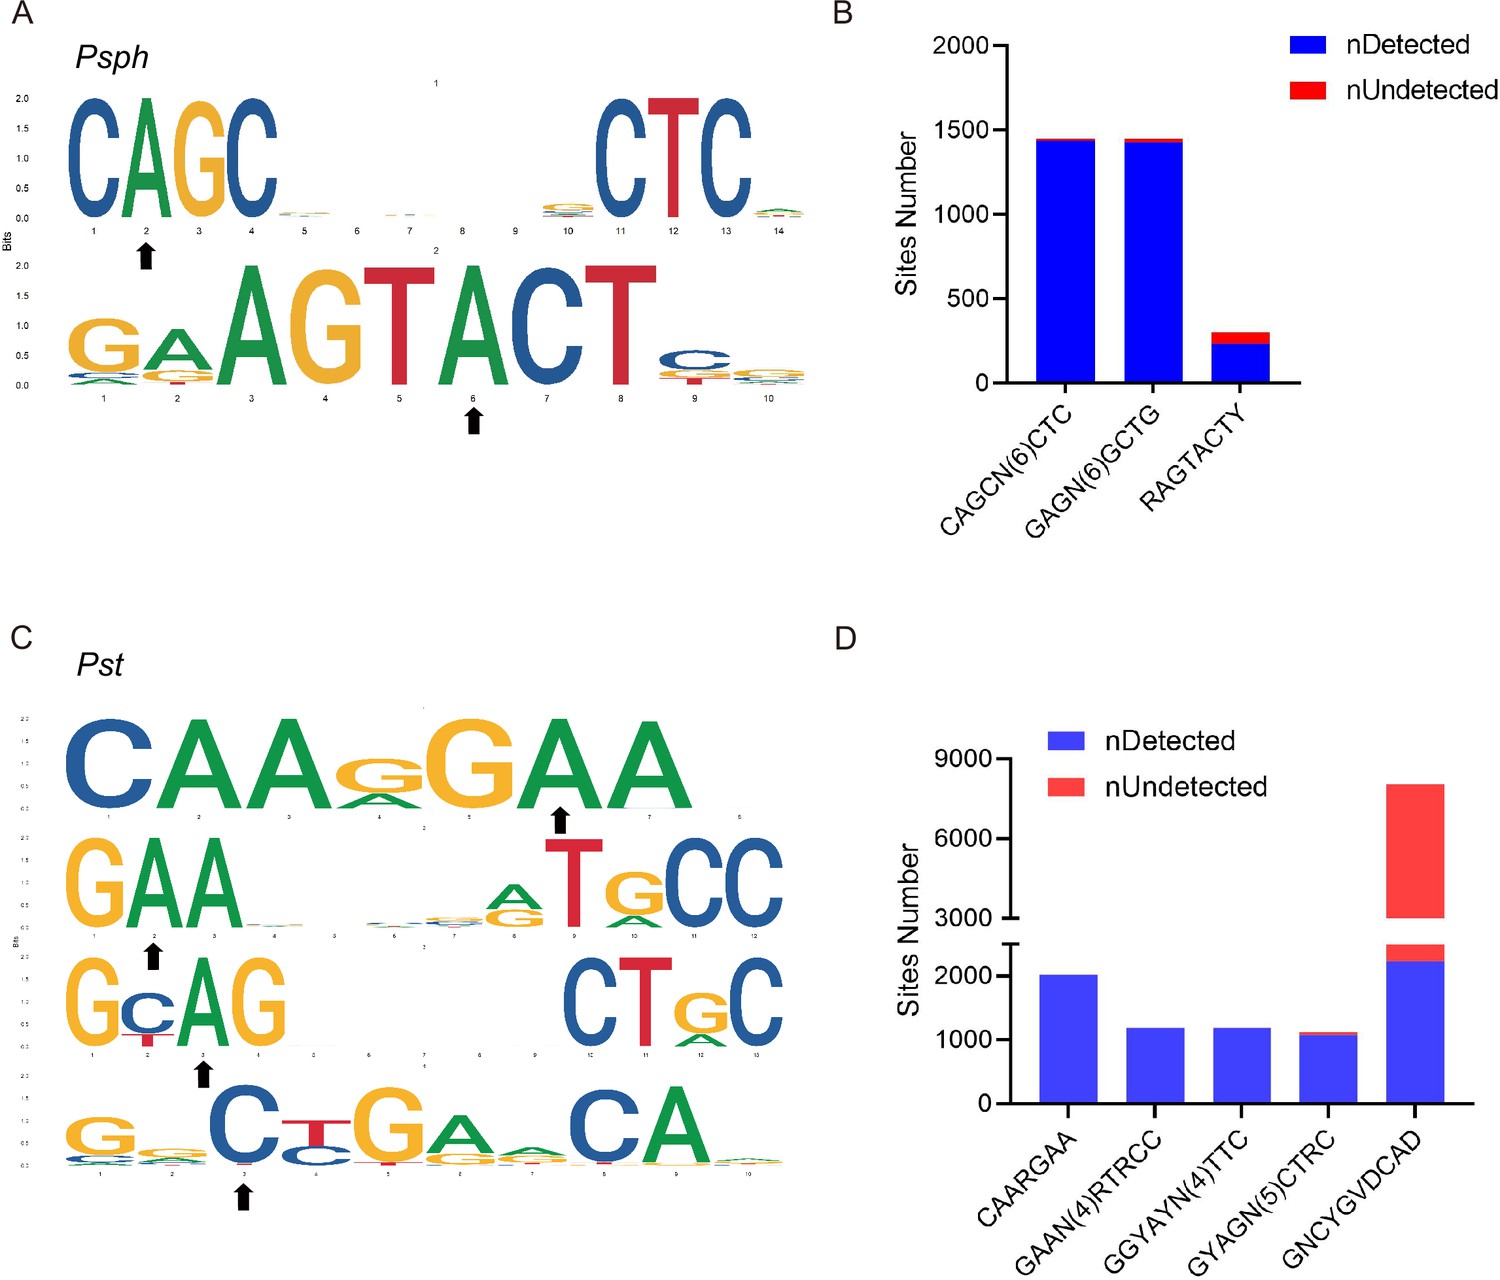
DNA methylation motifs in P. syringae.
(A) 6mA methylation motifs found in Psph using SMRT-seq. The black arrows indicate the site of adenine methylation. (B) Bar plot shows the abundance of methylated numbers throughout all motif sites in Psph. (C) 6mA and 4mC methylation motifs found in Pst using SMRT-seq. The black arrows indicate the site of base methylation. (D) Bar plot shows the abundance of methylated numbers throughout all motif sites in Pst.
Three motifs for 6mA and one motif for 4mC were identified in Pst (Figure 3C). The first 6mA motif, CAARGAA, was found 2022 times in the genome, with 2019 of the occurrences methylated (99.8%) (Figure 3D). The second 6mA motif, GAAN(4)RTRCC, was fully methylated in both strands. Similarly, the last 6mA motif, GYAGN(5)CTRC, exhibited a high methylation level (96%) in the genome of Pst. Conversely, the only motif identified for 4mC in Pst displayed a considerably lower methylation level than the 6mA sites, with 2207 occurrences of methylation out of a total of 8048 sites (approximately 27%). Notably, no credible motifs were found in Pss because of its noticeably lower modification levels compared with the other two strains. Overall, the application of SMRT-seq to the three model P. syringae strains identified specific sequence motifs, including 6mA motifs, exhibiting extensive methylation statuses.
In vivo validation revealed the activity and specificity of Type I R–M system MTase in Psph
The first motif, CAGCN(6)CTC, identified in Psph is similar to the counterpart modified by a Type I R–M MTase in P. aeruginosa (Beaulaurier et al., 2019; Figure 3—figure supplement 1), suggesting that the putative HsdMSR is responsible for the observed motif. As no other motifs exhibited a discernible association with the Type II R–M MTases, we opted to focus our investigation on the putative HsdMSR in Psph. To determine the potential functions of the putative MTases, we constructed MTase knockout mutants and complementary strains of HsdMSR. Growth curve experiments showed the adverse effects on ΔhsdMSR compared to the WT strain (Figure 3—figure supplement 2A). To confirm the activity of HsdMSR, a dot blot assay was used to detect the 6mA intensity in WT and ΔhsdMSR. The results shown in Figure 3—figure supplement 2B illustrated that 6mA levels were significantly decreased in ΔhsdMSR compared to the WT, but were restored in the complemented strain. In addition, SMRT-seq was performed on ΔhsdMSR, which further profiled methylation patterns in ΔhsdMSR (Figure 3—figure supplement 2C, D). As expected, we found almost all of the reduction 6mA sites in the ΔhsdMSR were from motif CAGCN(6)CTC (Figure 3—figure supplement 2E, F). We also noticed that 5mC and 4mC sites in the mutant were relatively similar to that in WT (Figure 3—figure supplement 2E), and the slight difference might be caused by sequencing errors. Overall, we propose that HsdMSR only catalyze the 6mA located on the motif CAGCN(6)CTC, but does not affect other 6mA sites and other modification types.
In accordance with previous studies showing that growth conditions affect the bacterial methylation status (Gonzalez and Collier, 2013; Krebes et al., 2014; Sánchez-Romero and Casadesús, 2020), we applied dot blot experiments using the same amount of DNA (1 μg) from these three P. syringae strains to detect the 6mA levels during both logarithmic and stationary phases. The results revealed that 6mA levels in the stationary phase were much higher than those in the logarithmic phase in Psph and Pst, but no significant change in Pss (Figure 3—figure supplement 3A). Additionally, we found that during the stationary phase, 6mA methylation levels in Psph and Pst were higher than those in Pss. These findings were consistent with the MTases predication on these three strains since Pss does not harbor any Type I R–M systems, which are important for 6mA medication in bacteria. We also overexpressed HsdM in Pst and performed additional experiments in WT and the HsdM overexpression strains, including dot blot and growth curve assays. The results showed that the MTase overexpressed strain presents a higher 6mA level than WT during the logarithmic phase, and the overexpression of MTase had no effects on growth in Pst (Figure 3—figure supplement 3B, C). Taken together, the results demonstrated that 6mA levels change with the bacterial growth phase in Psph and Pst, and HsdMSR is responsible for maintaining 6mA sites within the sequence motif of CAGCN(6)CTC in Psph.
Transcriptomic analysis profiling of differentially regulated genes associated with virulence and metabolism in the HsdMSR mutant
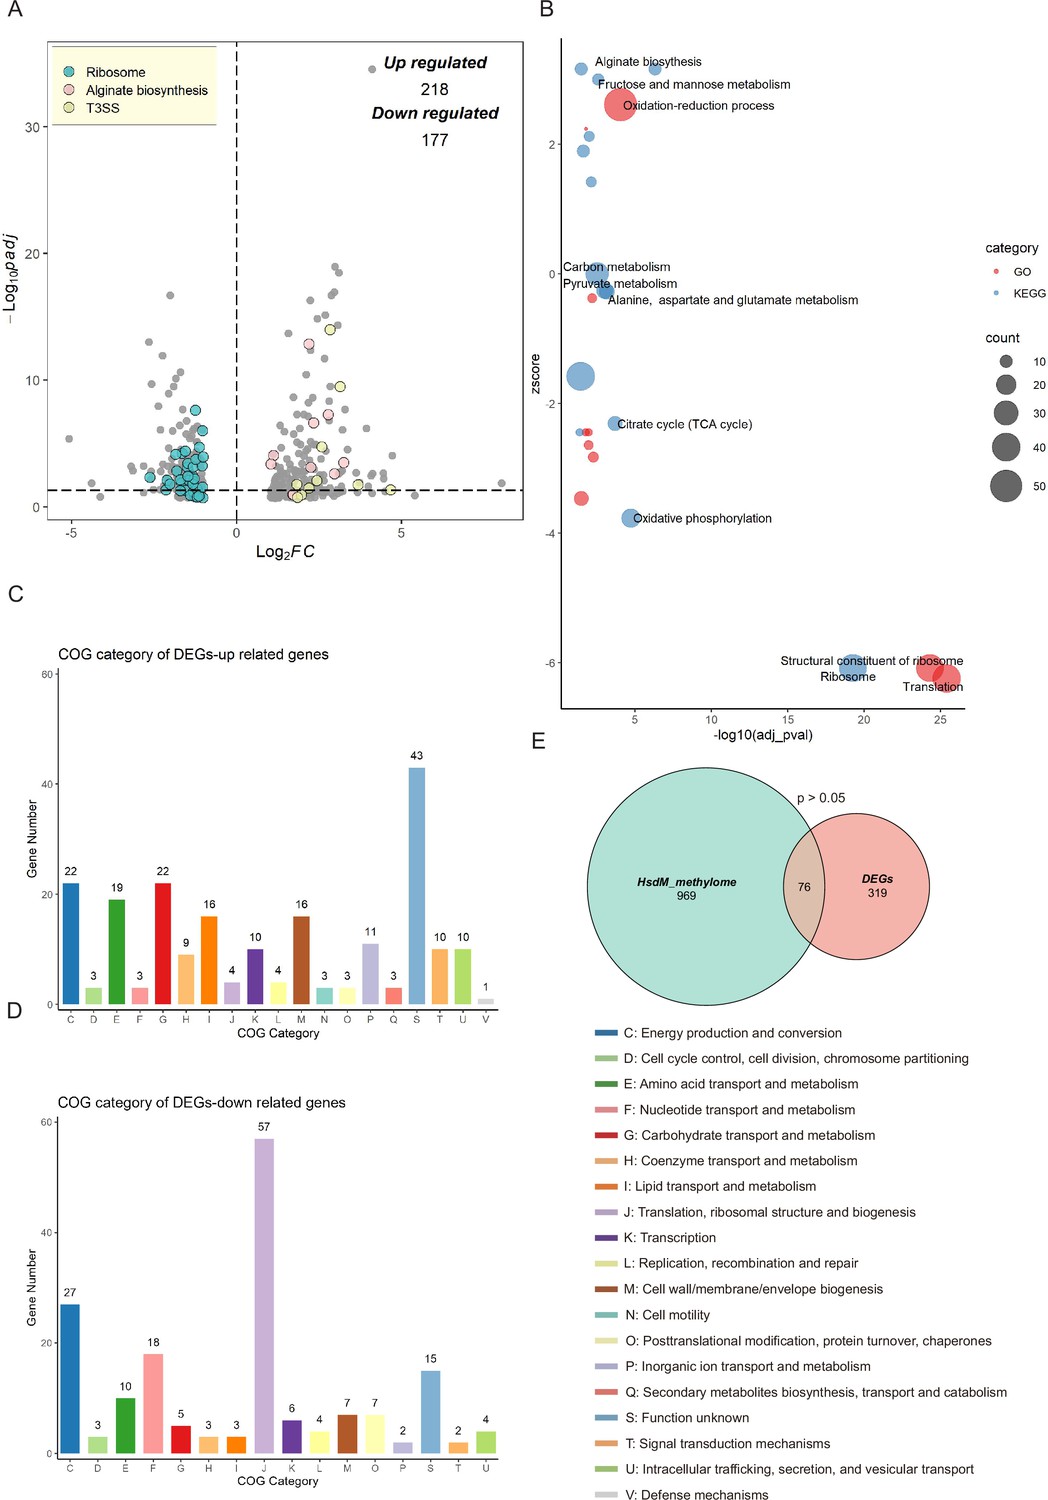
To explore the regulatory influence of HsdMSR on gene expression, RNA-seq was applied to analyze WT and ΔhsdMSR in the stationary growth phase, which ensured that the strains had sufficient DNA methylation levels. Differentially expressed genes (DEGs) were obtained with the cut-off of |log2FC| > 1 and an adjusted p-value <0.05. We identified 395 DEGs between WT and ΔhsdMSR under these experimental conditions. Among these, 218 genes were upregulated, while 177 genes were downregulated compared with the WT (Figure 4A and Supplementary file 3). To investigate the functional differences between WT and ΔhsdMSR, GO and KEGG databases were used to perform functional enrichment analyses based on the DEGs. When using adjusted p-value <0.05 as a significant cut-off, the upregulated functional terms included alginate biosynthesis, fructose and mannose metabolism, and the oxidation–reduction process (Figure 4B). The downregulated pathways included the citrate cycle, oxidative phosphorylation, ribosome structure, and translation (Figure 4B). A total of 116 genes showed bigger differences (|log2FC| > 2) except for genes related to ribosomal protein, T3SS, and alginate synthesis. Among these genes, 31 were annotated as hypothetical proteins and 4 as transcription factors with unknown functions, and the remaining genes mostly encoded metabolism-related enzymes. These enzymes might have effects on growth defects in ΔhsdMSR.
Figure 4
Transcriptional changes profiling of hsdMSR mutant in Psph.
(A) The volcano plot reveals differentially expressed genes (DEGs) between Psph WT and ΔhsdMSR. The DEGs were (|log2FC| > 1 and adjusted p-value <0.05) in blue (ribosomal protein), pink (alginate biosynthesis), and yellow (T3SS). Each dot represents one gene. (B) Bubble plot shows enriched gene ontology (GO) (red) and Kyoto Encyclopedia of Genes and Genomes (KEGG) (blue) terms based on the DEGs between Psph WT and ΔhsdMSR. The x-axis shows the significance of functional annotation terms (−log10 adjusted p-value), and the y-axis indicates the Z-score of terms. The bubble size represents the gene number of terms. (C) Cluster of Orthologous Group (COG) classification and distribution of upregulated DEGs. (D) COG classification and distribution of downregulated DEGs. COG terms are highlighted in different colors. (E) Venn plot reveals the overlapped genes between DEGs and genes within the HsdMSR motif.
We also analyzed the function alteration via COG category analysis of DEGs, which revealed that the upregulated genes were more likely to be involved in lanes E (amino acid transport and metabolism), G (carbohydrate transport and metabolism), and I (lipid transport and metabolism) (Figure 4C). Downregulated DEGs were significantly involved in lanes F (nucleotide transport and metabolism) and J (translation, ribosomal structure, and biogenesis) (Figure 4D). To investigate the correlation between DEGs and HsdM-recognizing motif sites, we performed comparative analysis. Although the overlap was not statistically significant (p > 0.05), we identified 76 overlapping genes (Figure 4E). Eight DEGs harbored the HsdMSR methylation motif at the putative promoter region (within 100 bp upstream of the gene) (Supplementary file 4).
HsdMSR was required for T3SS and biofilm formation in P. syringae
To confirm the RNA-seq results, we performed quantitative real-time PCR (RT-qPCR) experiments on T3SS genes. Several T3SS effector genes were identified as upregulated, including hopAE1, hrpF, hrpA2, hrpK1, and hrpW1. RT-qPCR was applied under the same conditions as RNA-seq, and the transcriptional levels of all genes were confirmed as being significantly higher in the ΔhsdMSR than the WT (Figure 5A). These gene expression levels were restored in the complemented strain. To determine whether the loss of HsdMSR affected the Psph virulence phenotypes because of alterations to T3 effectors, we allowed the WT, ΔhsdMSR, and complemented strains to infiltrate the primary leaves of bean plants. At 6 days post-inoculation, ΔhsdMSR was observed to induce more severe symptoms than the WT and complemented strains (Figure 5B). Overall, HsdMSR inhibited the expression of T3 effectors under KB conditions, and the loss of this modification system enhanced the pathogenicity of the strain during plant infection.
Figure 5 with 1 supplement see all
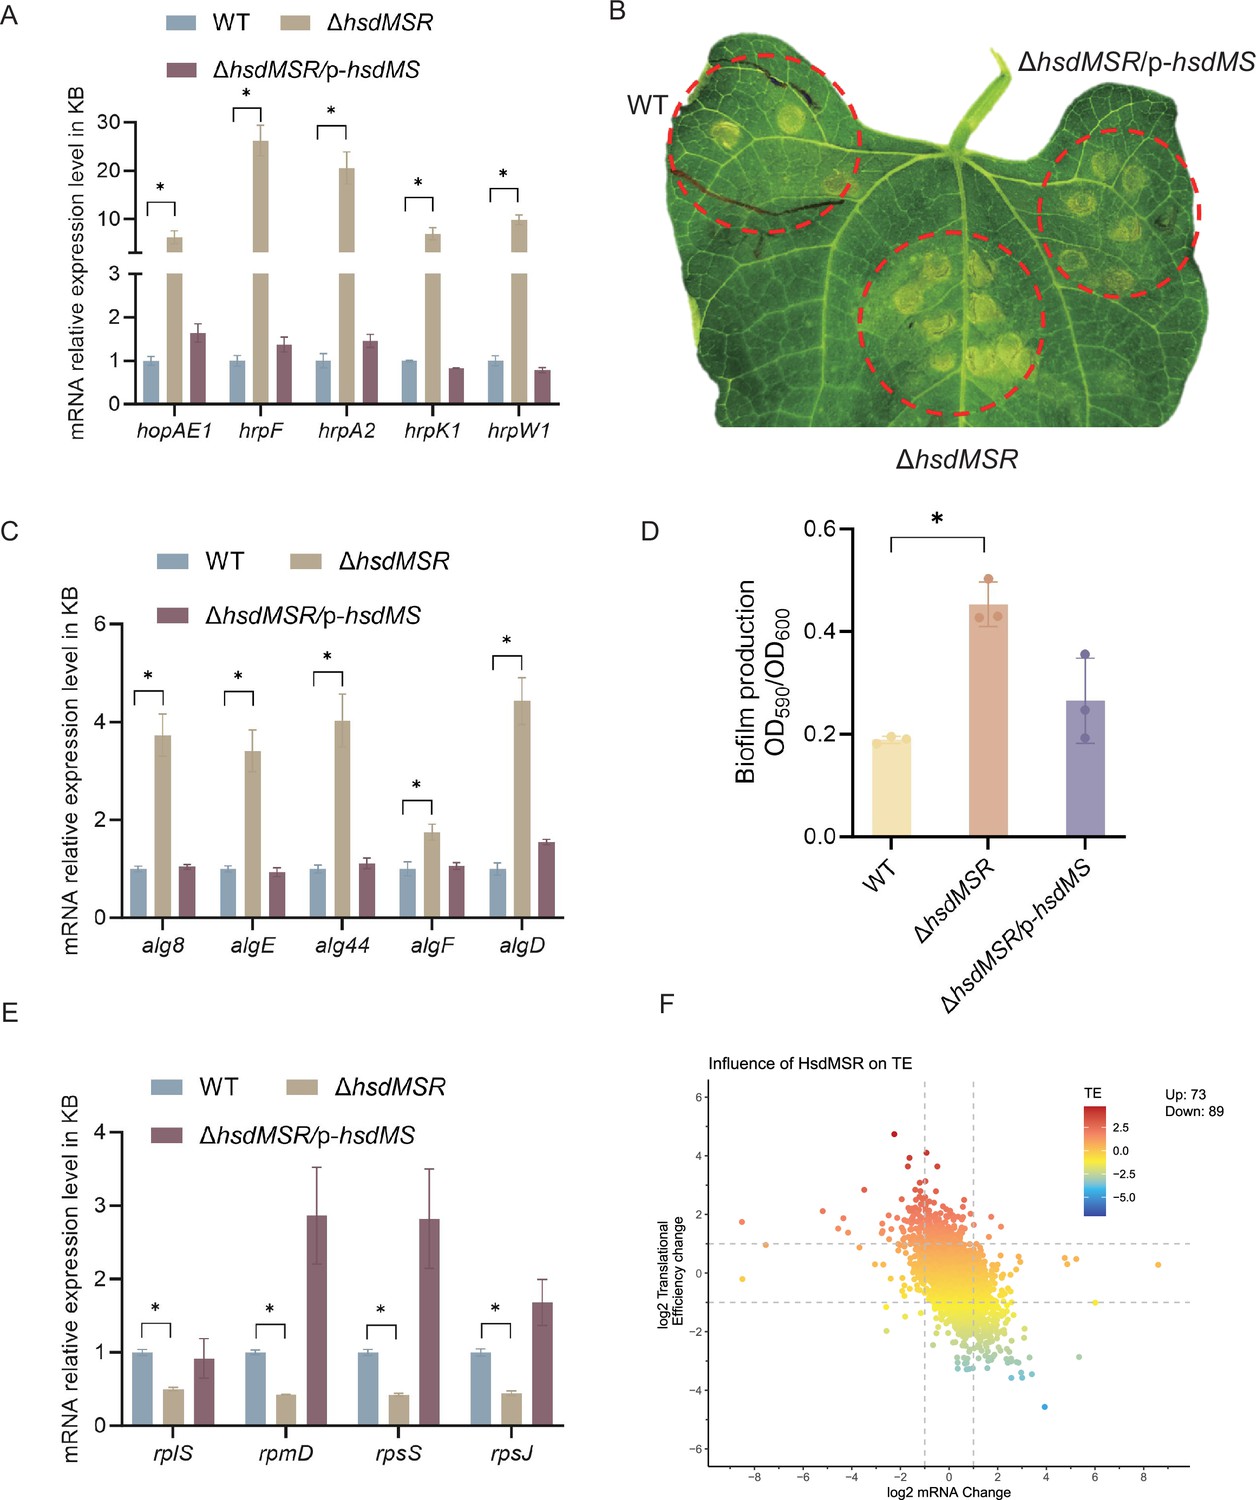
Influence of HsdMSR on virulence and metabolism in Psph.
(A) HsdMSR negatively regulated T3SS-related genes. Data are shown as means ± SD (n = 3). Statistical significance was determined using two-tailed Student's t-test (*p < 0.05). (B) Disease symptoms caused by Psph WT, ΔhsdMSR, and the complemented strains, photographing 6 days after inoculation of 105 CFU/ml bacteria. (C) HsdMSR negatively regulated alginate biosynthesis-related genes. Data are shown as means ± SD (n = 3). Statistical significance was determined using two-tailed Student's t-test (*p < 0.05). (D) The quantification of biofilm production in the Psph WT, ΔhsdMSR, and the complemented strains using a crystal violate staining assay. Data are shown as means ± SD (n = 3). Statistical significance was determined using two-tailed Student's t-test (*p < 0.05). (E) HsdMSR positively regulated ribosomal protein-related genes. Data are shown as means ± SD (n = 3). Statistical significance was determined using two-tailed Student's t-test (*p < 0.05). (F) The scatterplot shows the translational efficiency (TE) and mRNA change between Psph WT and ΔhsdMSR. The x-axis presents the log2FC of the mRNA level, and the y-axis shows the log2FC of the TE. The greater TE is represented in red, whereas the lesser TE is displayed in blue.
Besides T3SS, alginate biosynthesis-related genes were also observed among the DEGs between WT and ΔhsdMSR. Alginate biosynthesis proteins have been demonstrated to be essential for extracellular polymeric substances production, which enhances biofilm formation during the bacterial infection process (Boyd and Chakrabarty, 1995; Ichinose et al., 2013). RT-qPCR experiments were performed on the relevant genes, including alg8, algE, alg44, algF, and algD. The expression levels of these genes in ΔhsdMSR were significantly increased compared with the WT and complemented strain (Figure 5C). To further investigate the influence of HsdMSR on biofilm formation, we performed a crystal violet staining assay to detect biofilm production by the three strains. The intensity of crystal violet staining of biofilms formed by the WT and complemented strains was significantly less strong than that of ΔhsdMSR cells (Figure 5D), supporting the role of HsdMSR in controlling biofilm formation. We therefore concluded that HsdMSR regulates the virulence of P. syringae by tuning its expression of T3SS and alginate biosynthesis genes.
HsdMSR regulated ribosomal protein synthesis and translational efficiency
We noticed that HsdMSR was important for bacterial growth (Figure 3—figure supplement 2), while the expression of many ribosomal protein genes was reduced with the deletion of hsdMSR (Figure 5E). Regulation of ribosomal gene expression is essential to the integrity of the ribosome structure, which affects translation (Zhou et al., 2015). Therefore, we hypothesized that the low expression level of ribosome proteins in ΔhsdMSR would result in delayed growth. We selected four genes encoding different ribosome subunits (rplS, rpmD, rpsS, and rpsJ) to verify the RNA-seq results through RT-qPCR. While rplS and rpmD encode 50S ribosomal proteins (L19 and L30), rpsS and rpsJ are responsible for 30S ribosomal proteins (S19 and S10). The RT-qPCR results demonstrated that the mRNA expression levels of these genes were significantly lower in ΔhsdMSR than in WT, while levels in the complemented strain were restored to the WT level (Figure 5E).
Given the important role of ribosomal proteins in translation, we performed ribosome profiling, also termed Ribo-seq, of the Psph WT and ΔhsdMSR strains to detect the influence of HsdMSR on translational efficiency (TE) (Supplementary file 5). When we compared the WT and ΔhsdMSR, the TE of 162 genes was significantly different (|log2FC| > 1.5) (Figure 5F). Of these genes, 73 genes had enhanced TE, while 89 had suppressed TE (Figure 5F). Most of these genes were related to transmembrane transport and transcription regulation (Figure 5—figure supplement 1A, B). Remarkably, the TE of genes linked to the oxidation–reduction process tended to be suppressed (Figure 5—figure supplement 1B). These results showed that HsdMSR plays an important role in the regulation of metabolism by promoting ribosomal protein synthesis and modulating TE in Psph.
HsdMSR regulation of hrpF was dependent on the full methylation of both strands
To investigate whether and how HsdMSR directly affects gene expression, we focused on those DEGs whose upstream regions harbor its motif. Interestingly, we noticed a methylation motif in the upstream region of hrpF (encoding the pathogenicity factor HrpF), which increased its expression level in the Psph WT strain (Figures 5A and 6A). To further explore the effects of HsdMSR on the transcription of hrpF, we constructed a lux-reporter plasmid carrying the motif and extended it by 50 bp, which covered the upstream region of hrpF. After transferring the plasmid into the WT and ΔhsdMSR strains, we detected a significant difference in the expression level of hrpF-lux between these two strains. The hrpF-lux signal in ΔhsdMSR increased along with culture time and reached a peak at 24 hr when the methylation level was also elevated in the late growth stage (Figure 6B). This result of the lux-reporter assay confirmed the RNA-seq and RT-qPCR results showing that hrpF was remarkably upregulated in ΔhsdMSR compared with the WT strain.
Figure 6

6mA methylation regulates gene transcription based on fully methylated.
(A) Upstream region sequence of hrpF carrying the HsdMSR motif. Adenine methylation is highlighted in red. (B) Constantly lux activity detection of the hrpF between Psph WT and ΔhsdMSR. Data are shown as means ± SD (n = 3). (C) Lux activity of hrpF between Psph WT and ΔhsdMSR with single- or double-point mutations. In the HsdMSR motif, ‘A’ was replaced by ‘C’ or ‘T’ was replaced by ‘G’, highlighted in bold and underlined. Data are shown as means ± SD (n = 9).
To detect the influence of the 6mA site within the HsdMSR motif on the expression of hrpF, we induced a point mutation on the single strand in the reporter plasmid to change the 6mA to C (CCGCN6CTC/ CCGCN6CGC). This resulted in a low hrpF expression level similar to that of the WT sequence carrying the A base (Figure 6C), indicating that a hemi-methylated pattern is insufficient for transcriptional alteration. To verify our hypothesis, we constructed a reporter with two A mutations (CCGCN6CGC), transferred it to the WT and ΔhsdMSR strains, and detected signal changes. As expected, the reporter carrying the HsdMSR motif without two A bases resulted in a significantly higher signal than the hemi-mutated and non-mutated reporters in the WT (Figure 6C). Taken together, the results showed that HsdMSR regulation of hrpF transcription was based on both strands being fully methylated.
Discussion
Recent advances in sequencing technology have expanded our understanding of DNA methylation in bacteria. Numerous DNA MTases have been extensively characterized in different pathogenic bacteria, and data on their distribution patterns, recognition motifs, and biological functions have been collated (Han et al., 2022; Li et al., 2023; Murray et al., 2012; Lee et al., 2015; Fang et al., 2017; Kumar et al., 2018). However, most research has concentrated on animal pathogenic bacteria, with limited insights into phytopathogenic bacteria except for Xanthomonas (Seong et al., 2016; Park et al., 2019; Park et al., 2021). Consequently, in this study, we employed SMRT-seq to profile the methylome patterns and specific conserved sequence motifs of three P. syringae strains. Notably, we discovered that the virulence and metabolism of Psph are regulated by Type I R–M MTase HsdM. The nonfunctional nature of the subunit restriction endonuclease HsdR was acknowledged, although its potential functionality relies on the presence of MTase (Doberenz et al., 2017).
Comprehensive analysis of the methylome atlas revealed that 6mA is the most prevalent modification type in Psph and Pst, mirroring the trends observed in other bacteria. Conversely, Pss displays the lowest occurrences of 6mA throughout its genome (Figure 1). This discrepancy might be attributed to the absence of the Type I R–M MTase responsible for 6mA in Pss. Similarly, the presence of two Type I R–M MTases in Pst possibly contribute to it having a higher number of 6mA sites than Psph. Additionally, all three pathovars had a similar pattern, with 4mC being the least frequent modification type. Despite belonging to the same P. syringae species, the three strains tested displayed remarkably divergent methylation patterns, which is reminiscent of the phenomenon observed in Xanthomonas spp. (Seong et al., 2016).
We further identified two (both 6mA) and four (three 6mA, one 4mC) motifs in Psph and Pst, respectively, but none in Pss (Figure 3). In fact, more motifs were predicted by the MEME and PacBio motif finders, but we chose only those motifs identified by both algorithms for higher accuracy. We found that the 6mA motifs had extremely high methylation levels, ranging from 77% to 100%, in the stationary phase of P. syringae. We subsequently found that the 6mA methylation levels increased during Psph growth, similar to the observations in P. aeruginosa (Doberenz et al., 2017). However, DNA methylation is much more stable under different conditions and growth phases in Helicobacter pylori and Salmonella typhimurium (Krebes et al., 2014; Bourgeois et al., 2022).
MTases have been reported to play important roles in bacterial growth; for example, they are involved in cell cycle processes such as chromosomal replication in E. coli and Caulobacter crescentus (Reyes-Lamothe and Sherratt, 2019; Gonzalez et al., 2014; Kozdon et al., 2013). DNA methylation can activate DnaA and signal the initiation of chromosome replication to affect the growth of gamma-proteobacteria (Seong et al., 2021; Boye et al., 1996). Previous studies revealed that DNA methylation influences bacterial growth through genes related to diverse carbohydrate transport mechanisms (Park et al., 2019). We report that the 6mA modification catalyzed by HsdM in Psph positively affects its growth, which can be explained by the downregulation of ribosomal proteins and the alteration of metabolism-related gene TE. However, many MTases are thought to be uncorrelated to growth in bacterial species such as P. aeruginosa and Klebsiella pneumoniae (Doberenz et al., 2017; Han et al., 2022; Fang et al., 2017).
Many MTases and DNA methylations are involved in bacterial virulence through their modulation of gene expression (Doberenz et al., 2017; Han et al., 2022; Fang et al., 2017; Kumar et al., 2018; Park et al., 2019; Park et al., 2021; Manzer et al., 2023; Banas et al., 2011; Oliveira et al., 2020). In this study, RNA-seq analysis of the hsdMSR mutation strain revealed 395 DEGs. Remarkably, not all DEGs harbored the HsdMSR methylation motif in their promoter region. There were no significant correlations between the HsdM-recognized motif sites in the promoter region and DEGs, even though DNA methylation is generally known to affect gene expression by altering the interactions between DNA and proteins such as TFs, which compete with MTases at specific motif sites and thus influence downstream transcription (Lim and van Oudenaarden, 2007). However, recent studies have revealed that DNA methylation within CDS can also alter gene expression in bacteria; for example, 5mC in CDS can enhance transcription while blocking the transcription of CpG islands in promoters in eukaryotic cells (Kahramanoglou et al., 2012; Rishi et al., 2010). We hypothesize that 6mA in Psph can regulate gene expression directly and indirectly. We confirmed that the 6mA motif in the promoter region of hrpF can directly and negatively regulate gene transcription in a manner dependent on full methylation of the strands (Figure 6). In addition, DNA methylation can change DNA curvature to decrease the thermodynamic stability of the double helix (Diekmann, 1987). Therefore, those DEGs carrying modified sites, including alginate biosynthesis-related genes and T3 effectors, are believed to be caused by the alteration of nucleoid topology, as seen in Salmonella and H. pylori (Kumar et al., 2018; Camacho et al., 2005). Furthermore, the 6mA sites, including those in virulence-related hrc/hrp and alg genes, are conserved in Psph and Pst, implying that similar phenotypes occur in the latter strain. Altogether, 6mA modifications in Psph were observed to act as important epigenetic regulators of gene expression.
Apart from the established roles of 6mA and HsdMSR in P. syringae, certain signals or factors may influence HsdMSR expression. For instance, we confirmed that the growth phase affects methylation levels in P. syringae. Previous studies have shown that increased temperatures can reduce methylation levels, as observed in P. aeruginosa PAO1 (Doberenz et al., 2017). These findings suggest that HsdMSR expression may be responsive to both intrinsic cellular states and extrinsic environmental conditions. To further explore potential upstream TFs regulating the expression of HsdMSR, we searched for TF-binding sites in the hsdMSR promoter using our own databases (Fan et al., 2020; Shao et al., 2021; Sun et al., 2024). As a result, we found three candidate TFs (PSPPH_0061, PSPPH_3268, and PSPPH_3504) that might directly bind and regulate HsdMSR expression. Future studies on these TFs and their interactions with the HsdMSR promoter would help clarify the regulatory network governing HsdMSR activity.
Moreover, R–M systems are known for their intrinsic role as innate immune systems in anti-phage infection, and present in around 90% of bacterial genomes (Oliveira et al., 2014). R–M systems protect bacteria self by recognizing and degrading foreign phage DNA via methylation-specific site and restriction endonucleases (REases) (Loenen et al., 2014b). In addition, other phage-resistance systems are similar to R–M systems but carry extra genes. One is called the phage growth limitation (Pgl) system, which modifies and cleaves phage DNA. However, the Pgl only modifies the phage DNA in the first infection cycle, and cleaves phage DNA in the subsequent infections, which gives a warn to the neighboring cells (Hampton et al., 2020; Hoskisson et al., 2015). To counteract R–M and R–M-like systems, phages have evolved strategies, including unusual modifications such as hydroxymethylation, glycosylation, and glucosylation. They can also encode their own MTases to protect their DNA or employ strategies to evade restriction systems and other anti-RM defenses (Vasu and Nagaraja, 2013; Murphy et al., 2013; Iida et al., 1987).
As more studies apply SMRT-seq to investigate bacterial methylomes, it has become evident that the epigenetic regulation of gene expression is highly prevalent among bacteria. Understanding the mechanisms through which methylation functions can provide novel insights into how strain-specific epigenetic modifications shape the adaptive responses of bacteria to distinct environmental challenges. As the repertoire of MTases varies among P. syringae strains, this approach will help us to better understand the diversity of DNA methylation and epigenetic patterns among P. syringae species.
Materials and methods
Bacterial strains and culture conditions
Request a detailed protocolThe bacterial strains, plasmids, and primers used in this study can be found in Supplementary file 6. All three model strains and mutations were cultured at 28°C in KB medium with shaking at 220 rpm or Luria-Bertani (LB) agar plates. The E. coli strains were grown at 37°C in LB broth with shaking at 220 rpm or on LB agar plates. Antibiotics were used at the following concentrations: kanamycin at 50 μg/ml, spectinomycin at 50 μg/ml, and rifampin 25 μg/ml.
DNA extraction and SMRT sequencing
Request a detailed protocolThree WT model strains and hsdMSR knockout Psph strains were cultured to the stationary phase. The genomic DNA of the strains was extracted using a TIANamp Bacteria DNA kit (Tiangen Biotech), using the manufacturer’s standard protocols. The SMRT sequence was performed at Abace Biotechnology company using Pacific Biosciences sequel II and Ile sequencer (PacBio, Menlo Park, CA, USA). SMRT-seq reads were aligned to the genome reference of Psph 1448A (GCF_000012205.1), Pst DC3000 (GCF_000007805.1), and Pss B728a (GCF_000012245.1), respectively. SMRTLink software v13.0 was used to perform DNA methylation analysis. A modification quality value score of 50 and 100 was used to call the modified bases A and C, respectively.
Deletion mutant and complemented strains construction
Request a detailed protocolThe restriction enzymes digested the pK18mobsacB suicide plasmid (Kvitko and Collmer, 2011) listed in Supplementary file 6. The upstream (∼1500bp) and downstream (∼1000bp) fragments of hsdMSR open reading frame (ORF) were amplified from the Psph genome and digested. Then, the digested upstream and downstream fragments were ligated with T4 DNA ligase (NEB). The ligated fragments were inserted into the digested plasmid using ClonExpress MultiS One Step Cloning Kit (Vazyme). The recombinant plasmids were transformed into the Psph WT strain in the KB plate with rifampin and kanamycin. The single colonies were picked to a sucrose plate and then cultured in both KB with kanamycin/rifampin and KB with rifampin alone. Loss of kanamycin resistance indicated a double crossover. Finally, the deletion strains were further confirmed by qRT-PCR to detect the mRNA level of hsdMSR. For the complemented plasmids, the ORF of hsdMS was amplified by PCR from the Psph genome and cloned into the pHM1 plasmid.
Growth curve measure assay
Request a detailed protocolOvernight cultures of Psph and ΔhsdMSR were diluted to an OD600 of 0.1 in fresh KB liquid medium for use as the inoculum. One hundred μl of the inoculum was aliquoted into a 96-well microtiter plate in triplicate and incubated at 28°C for growth. OD600 values were recorded per 2 hr for eight times for plotting of growth curves.
Dot blotting assay
Request a detailed protocolDot blotting was performed as previously described (Xie et al., 2018). Briefly, DNA samples were denatured at 95°C for 10 min and cooled down on ice for 3 min. Samples were spotted on the nylon membrane and air dry for 5 min, followed by heat-crosslink at 80°C for 2 hr. Membranes were blocked in 5% nonfat dry milk in TBST for 1 hr at room temperature, incubated with N6-mA antibodies (1:1000) overnight at 4°C. After five washes with TBST, membranes were incubated with HRP-linked secondary anti-rabbit IgG antibody (1:5000) for 1 hr at room temperature. Signals were detected with ChemiDoc Imaging Systems (Bio-Rad). After imaging, incubate the membrane with methylene blue staining buffer for 15 min with gentle shaking.
RNA-seq analyses
Request a detailed protocolPsph and ΔhsdMSR strains were first cultured to the stationary phase in KB medium at 28°C. Cultures were collected, and total RNA was extracted using the RNeasy mini kit (QIAGEN) following the manufacturer’s protocol and genomic DNA contamination was removed by DNaseI treatment (NEB). Subsequently, rRNA was depleted by using the MICROBExpress kit (Ambion), and the remaining mRNA was used to generate the cDNA library according to the NEBNext UltraTM II RNA Library Prep Kit protocol (Illumina), which was then sequenced using the Illumina HiSeq 2000 system, generating 150 bp paired-end reads. Two biological replications have been performed. For each RNA-seq sample, raw sequencing reads were quality-trimmed using trim_galore (version 0.6.7) and aligned to the Psph genome using hisat2 (version 7.5.0)(Kim et al., 2015). DEGs were identified using DESeq2 (Love et al., 2014), and function enrichment analysis of DEGs was conducted using the R package clusterProfiler (Yu et al., 2012).
Ribo-seq library construction and analysis
Request a detailed protocolThe construction of the Ribo-seq library followed the previous protocol (Hua et al., 2022). Briefly, bacteria were cultured to an OD600 of 0.4, at which point chloramphenicol was added to a final concentration of 100 µg/ml for 2 min. Cells were then pelleted and washed with pre-chilled lysis buffer [25 mM Tris-HCl, pH 8.0; 25 mM NH4Cl; 10 mM Mg(OAc)2; 0.8% Triton X-100; 100 U/ml RNase-free DNase I; 0.3 U/ml Superase-In; 1.55 mM chloramphenicol; and 17 mM GMPPNP]. The pellet was resuspended in lysis buffer, followed by three freeze–thaw cycles using liquid nitrogen. Sodium deoxycholate was then added to a final concentration of 0.3% before centrifugation. The resulting supernatant was adjusted to 25 A260 units and mixed with 2 ml of 500 mM CaCl2 and 12 µl MNase, making up a total volume of 200 µl. After the digestion, the reaction was quenched with 2.5 ml of 500 mM EGTA. Monosomes were isolated using Sephacryl S400 MicroSpin columns, and RNA was purified using the miRNeasy Mini Kit (QIAGEN). rRNA was removed using the NEBNext rRNA Depletion Kit, and the final library was constructed with the NEBNext Small RNA Library Prep Kit. For each sample, ribosome footprint reads were mapped to the Psph 1448A reference genome, and the TE was calculated by dividing the normalized Ribo-seq counts by the normalized RNA counts. Two biological replicates were performed for all experiments.
RT-qPCR verification
Request a detailed protocolFor RT-qPCR, RNA was purified using the RNeasy minikit (QIAGEN). The cDNA synthesis was performed using a FastKing RT Kit (Tiangen Biotech). The assay was performed by SuperReal Premix Plus (SYBR Green) Kit (Tiangen Biotech) according to the manufacturer’s instruction. Each sample was repeated thrice with 600 ng cDNA and 16S rRNA as the internal control. The fold change represents the relative expression level of mRNA, which can be estimated by the threshold cycle (Ct) values of 2−(ΔΔCt).
Plant infection assay
Request a detailed protocolThe bean (P. vulgaris cv. Red Kidney) plants were used for the pathogenicity assay. The plant was grown in a greenhouse, as described previously (Xiao et al., 2007). Overnight bacterial cultures were diluted to OD600 = 0.2 × 10⁻³ and were hand-inoculated into the primary leaves of week-old bean plants for 6 days.
Biofilm formation assay
Request a detailed protocolBiofilm production was detected, as previously reported (Shao et al., 2019). In brief, overnight bacterial cultures of Psph WT and hsdMSR mutants were diluted into OD600 = 0.1and transferred to a 10-ml borosilicate tube containing 1ml KB medium. Then, the cultures grow statically at 28°C for 3–5 days. Then, 0.1% crystal violet was used to stain the biofilm adhered to the tube tightly for 30 min, and other components bound to the tube loosely were washed off with distilled deionized water. The remaining crystal violet was fully dissolved in 1 ml 95–100% ethanol with constant shaking. Then, it was transferred to a transparent 96-well plate to measure its optical density at 590 nm using a Biotech microplate reader. The experiment was repeated using three independent bacterial cultures.
Data analysis and statistics
Request a detailed protocolThe graphs in this paper were plotted using ggplot2 in R 4.2.0 software and GraphPad Prism 10.0.3 (GraphPad Inc) Differences between groups were analyzed using Student’s two-tailed t-tests. The results of all statistical analyses are shown as mean ± SD. All experiments were repeated independently at least three times with similar results.
Data availability
The Ribo-seq, RNA-seq data, and SMRT-seq data were uploaded to the National Center for Biotechnology Information SRA database as part of BioProject PRJNA1055550 and PRJNA1123379, respectively.
-
NCBI BioProjectID PRJNA1055550. DNA Methylome Regulates Virulence and Metabolism in Pseudomonas syringae.
-
NCBI BioProjectID PRJNA1123379. DNA Methylome Regulates Virulence and Metabolism in Pseudomonas syringae.
References
-
Pseudomonas syringae pv. phaseolicola: from “has bean” to supermodelMolecular Plant Pathology 12:617–627.https://doi.org/10.1111/j.1364-3703.2010.00697.x
-
Gene Ontology: tool for the unification of biologyNature Genetics 25:25–29.https://doi.org/10.1038/75556
-
Effects of DNA methylation on expression of virulence genes in Streptococcus mutansApplied and Environmental Microbiology 77:7236–7242.https://doi.org/10.1128/AEM.00543-11
-
Deciphering bacterial epigenomes using modern sequencing technologiesNature Reviews. Genetics 20:157–172.https://doi.org/10.1038/s41576-018-0081-3
-
Biology of DNA restrictionMicrobiological Reviews 57:434–450.https://doi.org/10.1128/mr.57.2.434-450.1993
-
DNA methylation patterns and epigenetic memoryGenes & Development 16:6–21.https://doi.org/10.1101/gad.947102
-
The epigenomic landscape of prokaryotePLOS Genet 12:e1005854.https://doi.org/10.1371/journal.pgen.1005854
-
Pseudomonas aeruginosa biofilms: role of the alginate exopolysaccharideJournal of Industrial Microbiology 15:162–168.https://doi.org/10.1007/BF01569821
-
Comprehensive list of names of plant pathogenic bacteria, 1980-2007Journal of Plant Pathology 92:551–592.
-
eggNOG-mapper v2: functional annotation, orthology assignments, and domain prediction at the metagenomic scaleMolecular Biology and Evolution 38:5825–5829.https://doi.org/10.1093/molbev/msab293
-
Epigenetic gene regulation in the bacterial worldMicrobiology and Molecular Biology Reviews 70:830–856.https://doi.org/10.1128/MMBR.00016-06
-
Molecular mechanisms of two-component system RhpRS regulating type III secretion system in Pseudomonas syringaeNucleic Acids Research 42:11472–11486.https://doi.org/10.1093/nar/gku865
-
DNA methylation can enhance or induce DNA curvatureThe EMBO Journal 6:4213–4217.https://doi.org/10.1002/j.1460-2075.1987.tb02769.x
-
DNA adenine methylation modulates pathogenicity of Klebsiella pneumoniae genotype K1Journal of Microbiology, Immunology, and Infection = Wei Mian Yu Gan Ran Za Zhi 50:471–477.https://doi.org/10.1016/j.jmii.2015.08.022
-
The functions of DNA methylation by CcrM in Caulobacter crescentus: a global approachNucleic Acids Research 42:3720–3735.https://doi.org/10.1093/nar/gkt1352
-
Flagellar motility confers epiphytic fitness advantages upon Pseudomonas syringaeApplied and Environmental Microbiology 53:2528–2533.https://doi.org/10.1128/aem.53.10.2528-2533.1987
-
The genome sequence of M228, a Chinese isolate of Pseudomonas syringae pv. actinidiae, Illustrates insertion sequence element mobilityMicrobiology Resource Announcements 8:1427.https://doi.org/10.1128/MRA.01427-18
-
Virulence-related regulatory network of Pseudomonas syringaeComputational and Structural Biotechnology Journal 20:6259–6270.https://doi.org/10.1016/j.csbj.2022.11.011
-
Pathogenicity and virulence factors of Pseudomonas syringaeJournal of General Plant Pathology 79:285–296.https://doi.org/10.1007/s10327-013-0452-8
-
KEGG: kyoto encyclopedia of genes and genomesNucleic Acids Research 28:27–30.https://doi.org/10.1093/nar/28.1.27
-
HISAT: a fast spliced aligner with low memory requirementsNature Methods 12:357–360.https://doi.org/10.1038/nmeth.3317
-
The complex methylome of the human gastric pathogen Helicobacter pyloriNucleic Acids Research 42:2415–2432.https://doi.org/10.1093/nar/gkt1201
-
N4-cytosine DNA methylation regulates transcription and pathogenesis in Helicobacter pyloriNucleic Acids Research 46:3429–3445.https://doi.org/10.1093/nar/gky126
-
Construction of Pseudomonas syringae pv. tomato DC3000 mutant and polymutant strainsMethods in Molecular Biology 712:109–128.https://doi.org/10.1007/978-1-61737-998-7_10
-
Comparative genomics and DNA methylation analysis of Pseudomonas aeruginosa clinical isolate PA3 by single-molecule real-time sequencing reveals new targets for antimicrobialsFrontiers in Cellular and Infection Microbiology 13:1180194.https://doi.org/10.3389/fcimb.2023.1180194
-
Type I restriction enzymes and their relativesNucleic Acids Research 42:20–44.https://doi.org/10.1093/nar/gkt847
-
Highlights of the DNA cutters: a short history of the restriction enzymesNucleic Acids Research 42:3–19.https://doi.org/10.1093/nar/gkt990
-
Conservation of Dcm-mediated cytosine DNA methylation in Escherichia coliFEMS Microbiology Letters 328:78–85.https://doi.org/10.1111/j.1574-6968.2011.02482.x
-
Bacteriophage orphan DNA methyltransferases: insights from their bacterial origin, function, and occurrenceApplied and Environmental Microbiology 79:7547–7555.https://doi.org/10.1128/AEM.02229-13
-
The methylomes of six bacteriaNucleic Acids Research 40:11450–11462.https://doi.org/10.1093/nar/gks891
-
Procaryotic and eucaryotic traits of DNA methylation in spiroplasmas (mycoplasmas)Journal of Bacteriology 164:19–24.https://doi.org/10.1128/jb.164.1.19-24.1985
-
The interplay of restriction-modification systems with mobile genetic elements and their prokaryotic hostsNucleic Acids Research 42:10618–10631.https://doi.org/10.1093/nar/gku734
-
Two DNA methyltransferases for site-specific 6mA and 5mC DNA modification in Xanthomonas euvesicatoriaFrontiers in Plant Science 12:621466.https://doi.org/10.3389/fpls.2021.621466
-
The bacterial cell cycle, chromosome inheritance and cell growthNature Reviews. Microbiology 17:467–478.https://doi.org/10.1038/s41579-019-0212-7
-
REBASE: a database for DNA restriction and modification: enzymes, genes and genomesNucleic Acids Research 51:D629–D630.https://doi.org/10.1093/nar/gkac975
-
The bacterial epigenomeNature Reviews. Microbiology 18:7–20.https://doi.org/10.1038/s41579-019-0286-2
-
Methylome analysis of Two Xanthomonas spp: using single-molecule real-time sequencingThe Plant Pathology Journal 32:500–507.https://doi.org/10.5423/PPJ.FT.10.2016.0216
-
Prokaryotic DNA methylation and its functional rolesJournal of Microbiology 59:242–248.https://doi.org/10.1007/s12275-021-0674-y
-
Diverse functions of restriction-modification systems in addition to cellular defenseMicrobiology and Molecular Biology Reviews 77:53–72.https://doi.org/10.1128/MMBR.00044-12
-
N6-methyl-adenine: an epigenetic signal for DNA-protein interactionsNature Reviews. Microbiology 4:183–192.https://doi.org/10.1038/nrmicro1350
-
Organization and environmental regulation of the Pseudomonas syringae pv. syringae 61 hrp clusterJournal of Bacteriology 174:1734–1741.https://doi.org/10.1128/jb.174.6.1734-1741.1992
-
Two-component sensor RhpS promotes induction of Pseudomonas syringae type III secretion system by repressing negative regulator RhpRMolecular Plant-Microbe Interactions 20:223–234.https://doi.org/10.1094/MPMI-20-3-0223
-
Pseudomonas syringae: what it takes to be a pathogenNature Reviews Microbiology 16:316–328.https://doi.org/10.1038/nrmicro.2018.17
-
Ribosomal proteins: functions beyond the ribosomeJournal of Molecular Cell Biology 7:92–104.https://doi.org/10.1093/jmcb/mjv014
Article and author information
Author details
Funding
Guangdong Major Project of Basic and Applied Basic Research (2020B0301030005)
- Xin Deng
Shenzhen Science and Technology Innovation Program (JCYJ20210324134000002)
- Xin Deng
National Natural Science Foundation of China (32172358)
- Xin Deng
Sichuan Science and Technology Program (2024ZYD0134)
- Xin Deng
General Research Funds of Hong Kong (11103221)
- Xin Deng
General Research Funds of Hong Kong (11102223)
- Xin Deng
General Research Funds of Hong Kong (11101722)
- Xin Deng
The funders had no role in study design, data collection and interpretation, or the decision to submit the work for publication.
Acknowledgements
This study was supported by grants from Guangdong Major Project of Basic and Applied Basic Research (2020B0301030005), Shenzhen Science and Technology Fund (JCYJ20210324134000002), the National Natural Science Foundation of China (32172358), General Research Funds of Hong Kong (11103221, 11101722, and 11102223), and the Sichuan Province Science and Technology Program (2024ZYD0134). The funders had no role in study design, data collection, interpretation, or the decision to submit the work for publication.
Version history
- Preprint posted:
- Sent for peer review:
- Reviewed Preprint version 1:
- Reviewed Preprint version 2:
- Version of Record published:
Cite all versions
You can cite all versions using the DOI https://doi.org/10.7554/eLife.96290. This DOI represents all versions, and will always resolve to the latest one.
Copyright
© 2024, Huang, Chen et al.
This article is distributed under the terms of the Creative Commons Attribution License, which permits unrestricted use and redistribution provided that the original author and source are credited.
Metrics
-
- 2,880
- views
-
- 299
- downloads
-
- 10
- citations
Views, downloads and citations are aggregated across all versions of this paper published by eLife.
Citations by DOI
-
- 6
- citations for umbrella DOI https://doi.org/10.7554/eLife.96290
-
- 1
- citation for Reviewed Preprint v1 https://doi.org/10.7554/eLife.96290.1
-
- 1
- citation for Reviewed Preprint v2 https://doi.org/10.7554/eLife.96290.2
-
- 2
- citations for Version of Record https://doi.org/10.7554/eLife.96290.3
Download links
A two-part list of links to download the article, or parts of the article, in various formats.
Downloads (link to download the article as PDF)
Open citations (links to open the citations from this article in various online reference manager services)
Cite this article (links to download the citations from this article in formats compatible with various reference manager tools)
DNA methylome regulates virulence and metabolism in Pseudomonas syringae
eLife 13:RP96290.
https://doi.org/10.7554/eLife.96290.3


