Merging multi-omics with proteome integral solubility alteration unveils antibiotic mode of action
- Biocomputation and Complex Systems Physics Institute (BIFI)-Joint Unit GBsC-CSIC, University of Zaragoza, Spain
- Departamento de Bioquímica y Biología Molecular y Celular, Faculty of Science, University of Zaragoza, Spain
- Aragon Health Research Institute (IIS Aragón), Spain
- Department of Medical Biochemistry and Biophysics, Karolinska Institutet, Sweden
- Chemical Proteomics Unit, Science for Life Laboratory (SciLifeLab), Sweden
- Chemical Proteomics, Swedish National Infrastructure for Biological Mass Spectrometry (BioMS), Sweden
- Department of Biochemical Sciences “A. Rossi Fanelli”, Sapienza University of Rome, Italy
- Departamento de Microbiología, Pediatría, Radiología y Salud Pública, Faculty of Medicine, University of Zaragoza, Spain
- CIBER de Enfermedades Respiratorias—CIBERES, Instituto de Salud Carlos III, Spain
Figures
Figure 1 with 2 supplements
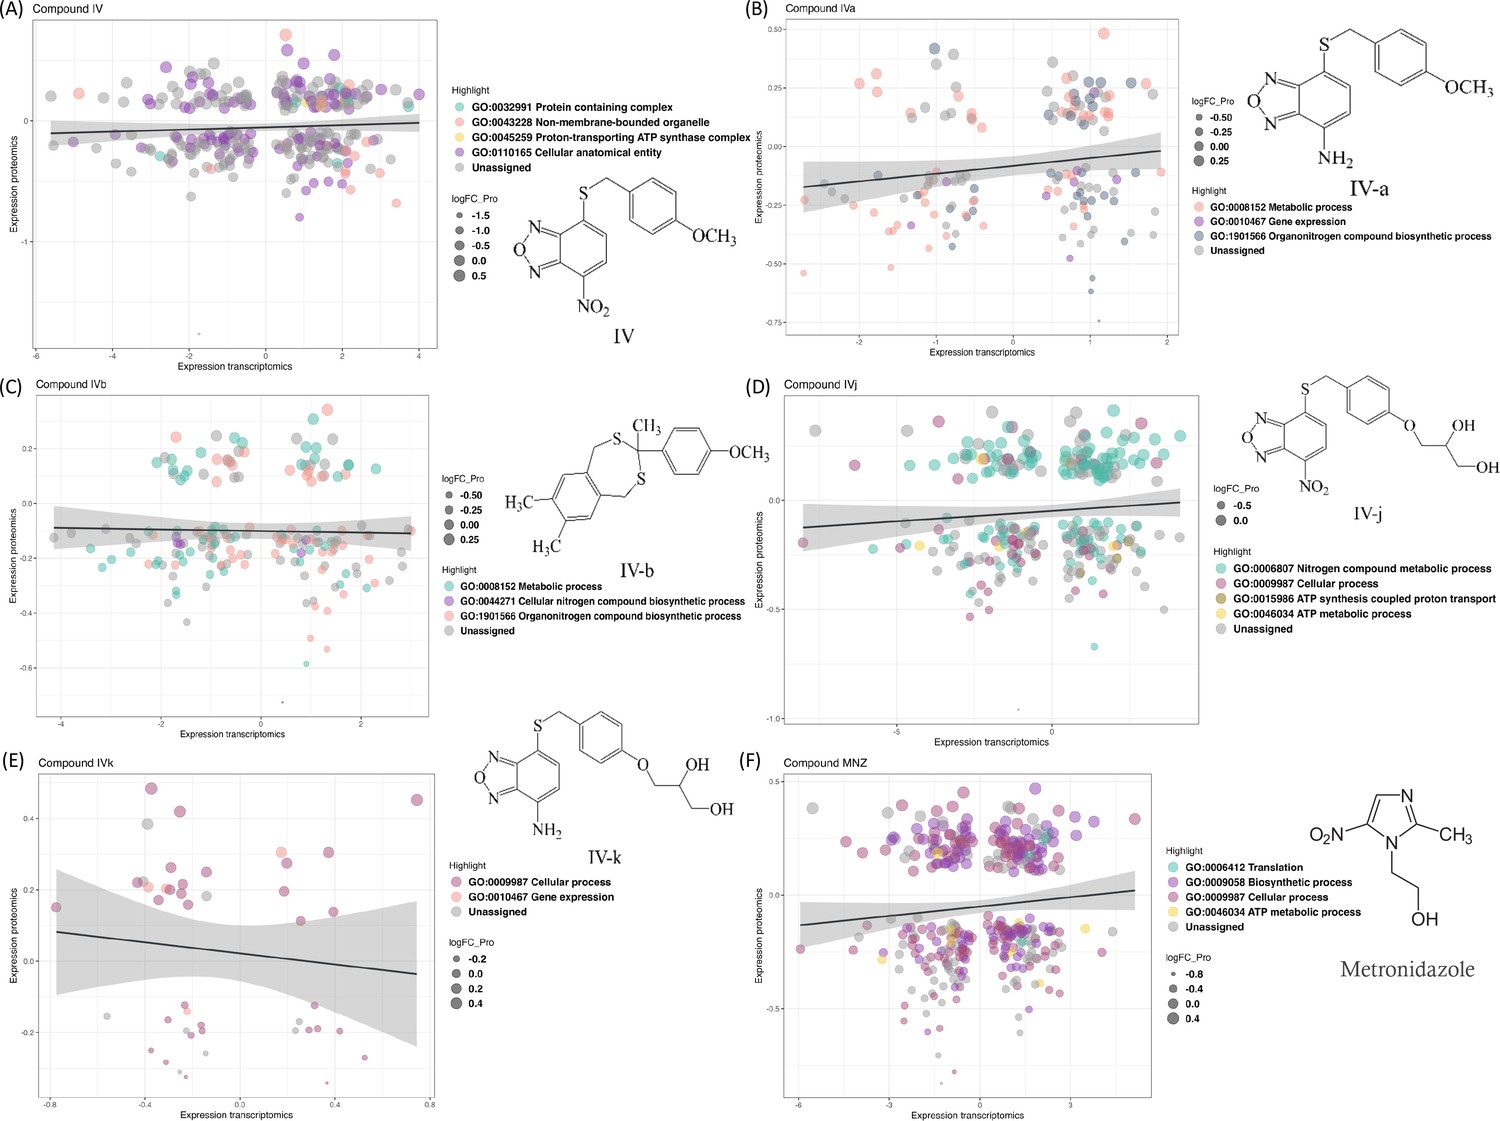
Changes in the transcriptomics and proteomics landscape, along with the associated gene ontology.
(A–F) These panels highlight the common genes and proteins associated with individual compounds, with different colors indicating the distribution of these genes and proteins across various gene ontology terms.
Figure 1—figure supplement 1
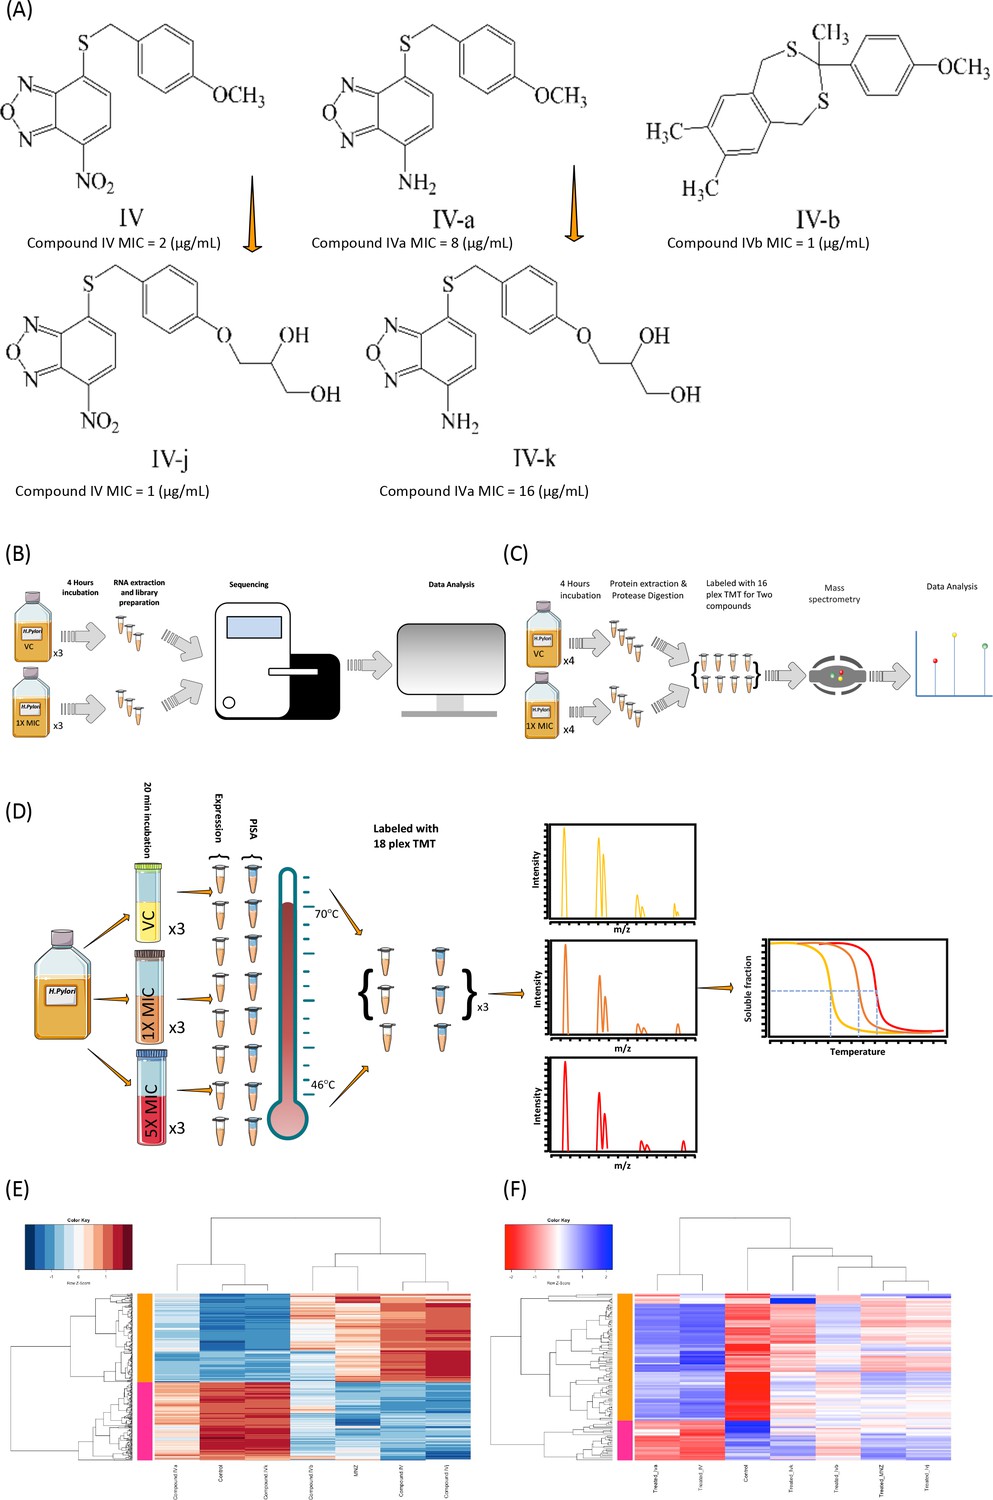
Compounds used in the assay and the study design.
(A) The compounds used in this assay were selected from a high-throughput screening that aimed to identify flavodoxin binders from a diverse chemical library of 10,000 compounds. Through several rounds of chemical variation and efficacy testing, a family of novel nitrobenzoxadiazol-based antimicrobials emerged, with Compound IV as the lead compound. Compounds IVj and IVk are more soluble derivatives of Compound IV, and IVa is a derivative of Compound IV with an amine functionality. The compounds bearing an amine functionality are narrow-spectrum antimicrobials that exhibit high specificity against H. pylori and potentially other gastric Helicobacter species but not enterohepatic Helicobacter species. The two compounds tested that contain a nitro functionality show extended-spectrum activity against Gram-positive bacteria, the Helicobacter genus, and Campylobacter jejuni. These extended-spectrum antimicrobials may have potential for novel therapies against Gram-positive bacteria, while the narrow-spectrum ones may be useful specifically against H. pylori. (B) Transcriptomics study design for drug testing: Provide a description of the transcriptomics study design for drug testing. (C) Proteomics assay study design for drug testing: Provide a description of the proteomics assay study design for drug testing. (D) Proteome Integral Solubility Alteration (PISA) assay study design for determination of intracellular targets: Provide a description of the PISA assay study design for determining intracellular targets. (E) The heatmap displays 771 differentially expressed genes, and hierarchical clustering is performed based on different compounds. (F) The heatmap represents 113 differentially expressed proteins, and hierarchical clustering is conducted based on different compounds.
Figure 1—figure supplement 2
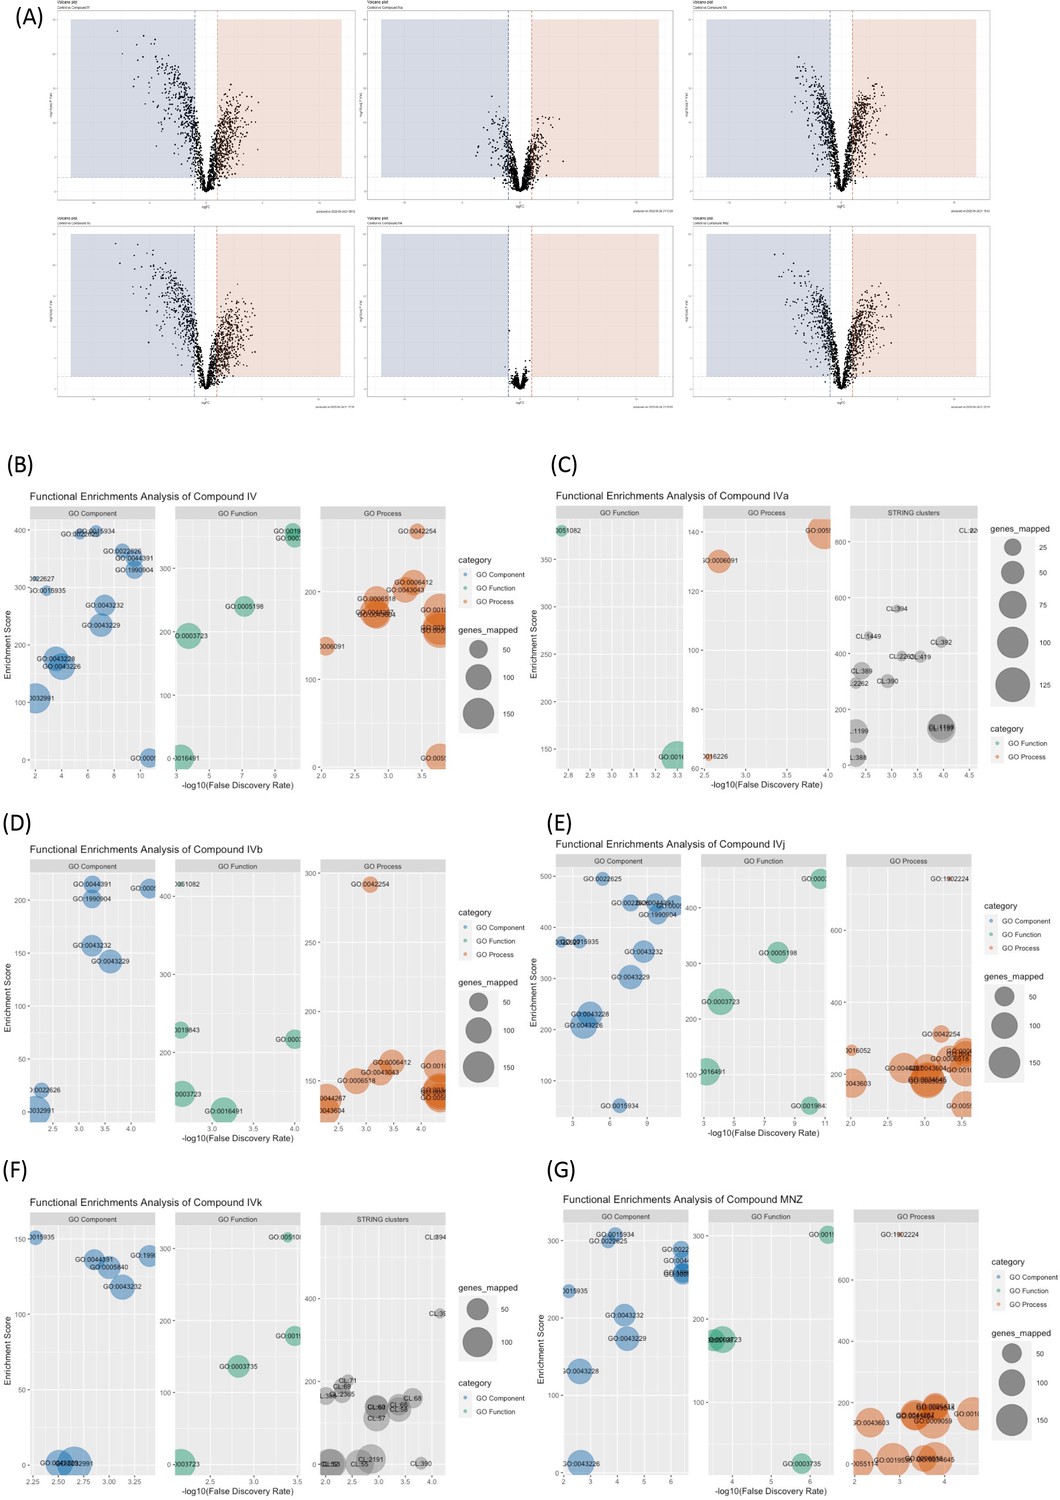
Gene ontology analysis of Compound IV and its derivatives.
(A) Volcano plot: Displays the differentially expressed genes identified from the transcriptomics assay. (B) Distribution of gene ontology components associated with Compound IV: Shows the distribution of gene ontology terms associated with the biological processes, molecular functions, and cellular components influenced by Compound IV. (C) Distribution of gene ontology components and String cluster associated with Compound IVa: Presents the distribution of gene ontology terms and String cluster analysis results associated with Compound IVa. (D) Distribution of gene ontology components associated with Compound IVb: Illustrates the distribution of gene ontology terms associated with the biological processes, molecular functions, and cellular components influenced by Compound IVb. (E) Distribution of gene ontology components associated with Compound IVj: Shows the distribution of gene ontology terms associated with the biological processes, molecular functions, and cellular components influenced by Compound IVj. (F) Distribution of gene ontology components and String cluster associated with Compound IVk: Presents the distribution of gene ontology terms and String cluster analysis results associated with Compound IVk, which is a more soluble derivative of Compound IVa. (G) Distribution of gene ontology components associated with Compound metronidazole (MNZ): Depicts the distribution of gene ontology terms associated with the biological processes, molecular functions, and cellular components influenced by Compound MNZ.
Figure 2 with 2 supplements
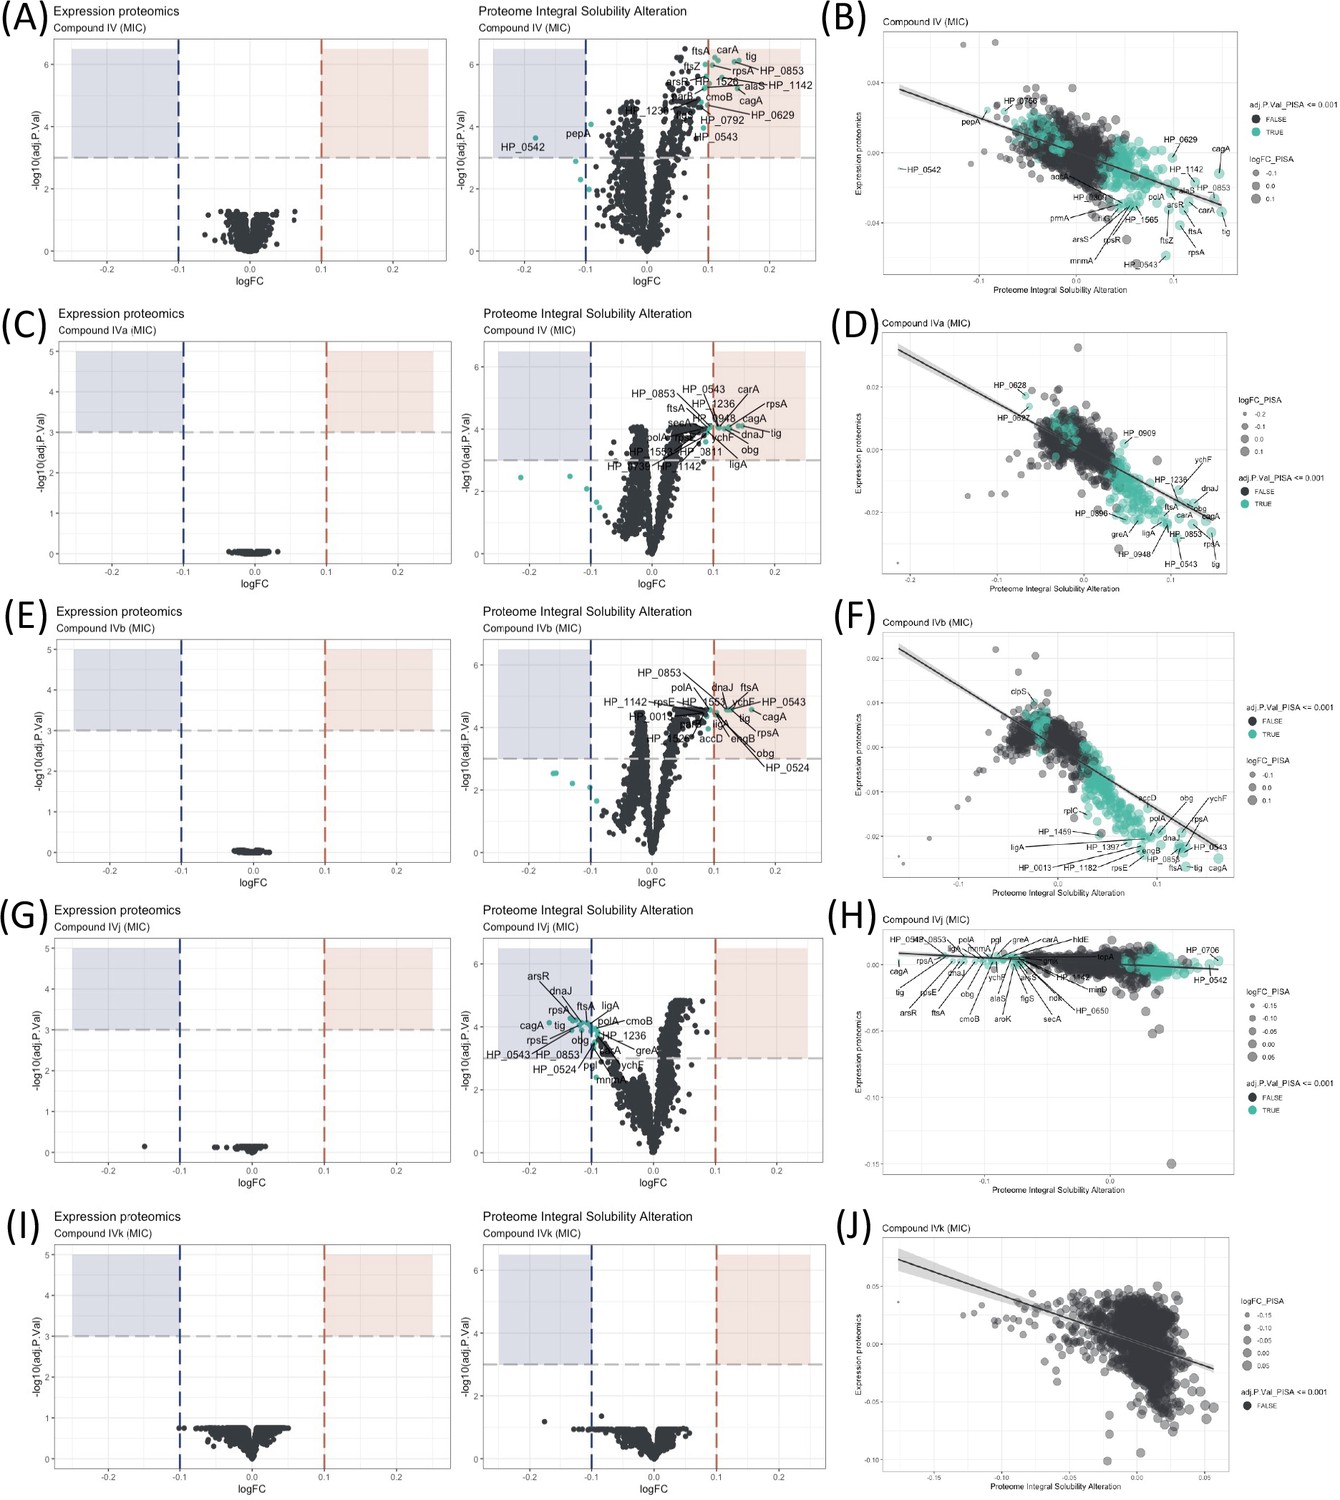
Proteome Integral Solubility Alteration (PISA) analysis where significant intracellular target alterations are depicted in teal.
For Compounds IV, IVa, and IVb, significant solubility changes indicate protein stabilization, whereas for IVj, the significant solubility changes indicate destabilization. (A) Volcano plot of protein solubility alterations for Compound IV at minimum inhibitory concentration (MIC). (B) Scatterplot showing protein solubility changes for Compound IV compared to baseline. (C) Volcano plot of protein solubility alterations for Compound IVa at MIC. (D) Scatterplot displaying protein solubility changes for Compound IVa compared to baseline. (E) Volcano plot of protein solubility alterations for Compound IVb at MIC. (F) Scatterplot indicating protein solubility changes for Compound IVb compared to baseline. (G) Volcano plot of protein solubility alterations for Compound IVj at MIC. (H) Scatterplot highlighting protein solubility changes for Compound IVj compared to baseline. (I) Volcano plot showing no significant alterations in protein solubility for Compound IVk at MIC. (J) Scatterplot displaying no significant alterations in protein solubility for Compound IVk compared to baseline.
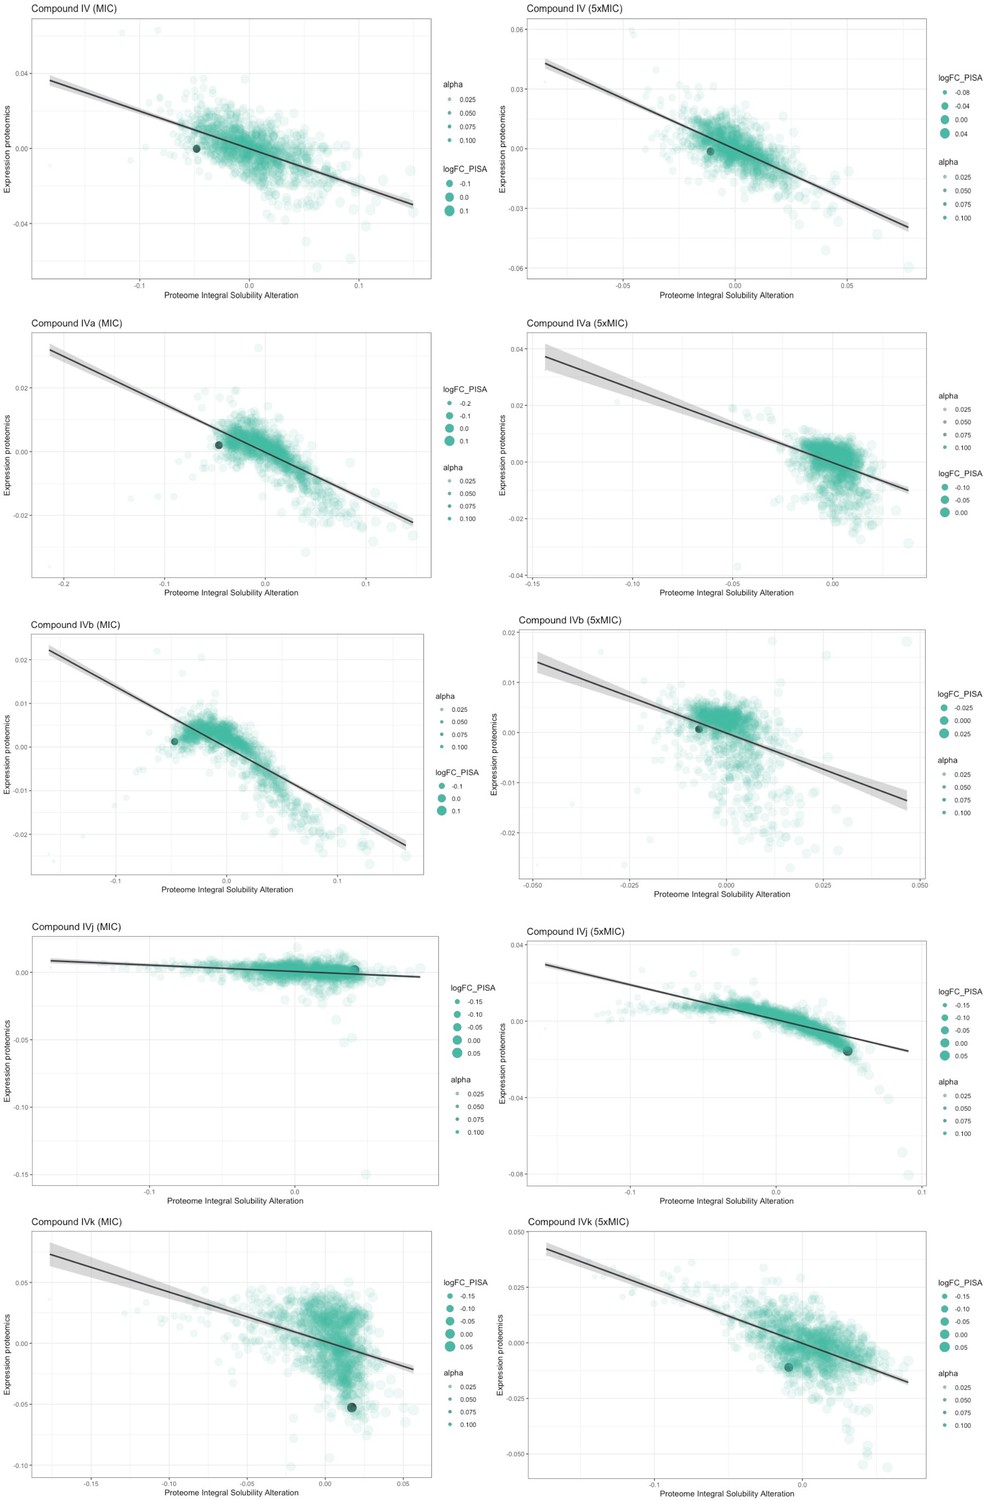
Figure 2—figure supplement 1
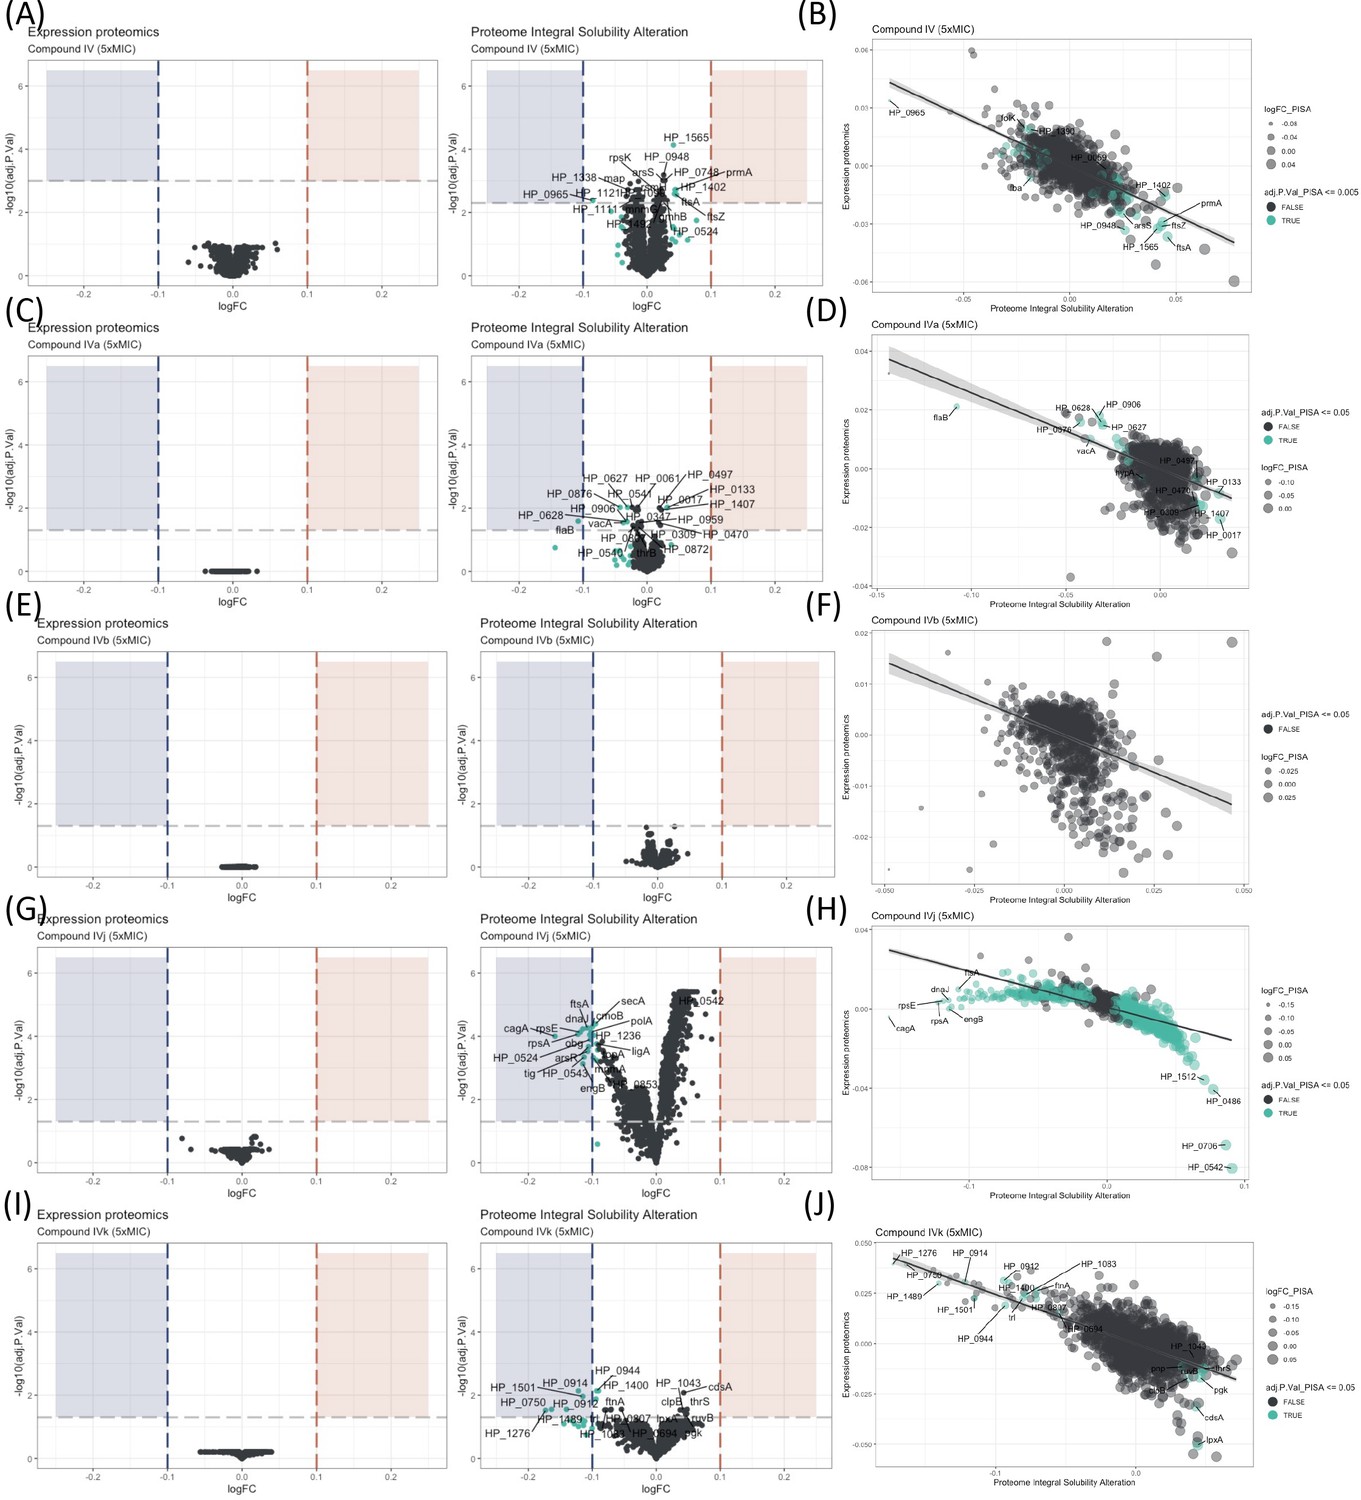
Proteome Integral Solubility Alteration coupled with expression proteomics (PISA-Express) analysis for different compounds at 5× of minimum inhibitory concentration (MIC).
(A) Changes in expression proteomics data and Proteome Integral Solubility Alteration results in five times of MIC concentrations of Compound IV. (B) Comparison of the expression proteomics data with Proteome Integral Solubility Alteration demonstrates significant alterations (teal color) in protein solubility for Compound IV. (C) Changes in expression proteomics data and Proteome Integral Solubility Alteration results in five times of MIC concentrations of Compound IVa. (D) Comparison of the expression proteomics data with Proteome Integral Solubility Alteration demonstrates significant alterations (teal color) in protein solubility for Compound IVa. (E) Compound IVb does not revile any changes in expression proteomics data and Proteome Integral Solubility Alteration results in five times of MIC concentrations of Compound IVb. (F) Comparison of the expression proteomics data and Proteome Integral Solubility Alteration results with five times of MIC concentrations of Compound IVb showing a negative correlation but does not revile any significant changes. (G) Changes in expression proteomics data and Proteome Integral Solubility Alteration results in five times of MIC concentrations of Compound IVj. (H) Comparison of the expression proteomics data with Proteome Integral Solubility Alteration demonstrates significant alterations (teal color) in protein solubility for Compound IVj. (I) Changes in expression proteomics data and Proteome Integral Solubility Alteration results in five times of MIC concentrations of Compound IVk. (J) Comparison of the expression proteomics data with Proteome Integral Solubility Alteration demonstrates significant alterations (teal color) in protein solubility for Compound IVk.
Figure 2—figure supplement 2
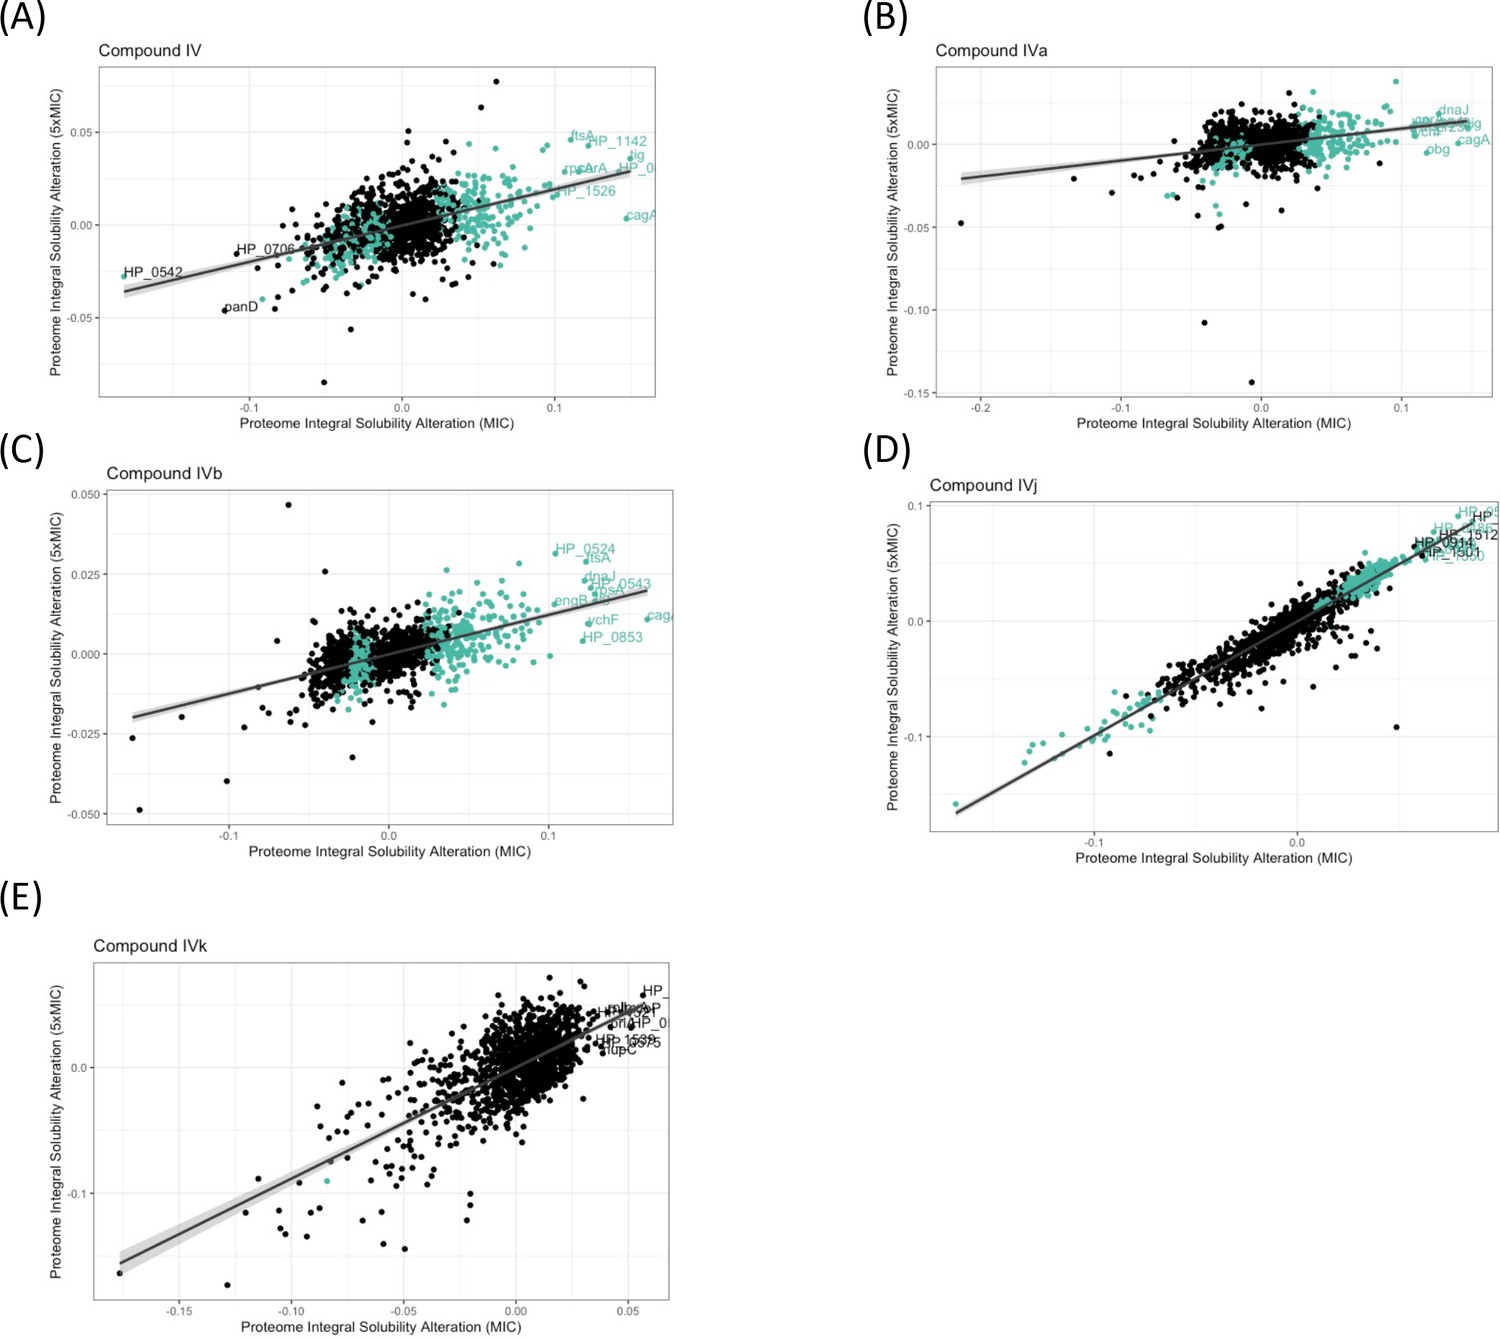
Concentration-dependent changes in Proteome Integral Solubility Alteration.
(A) Concentration-dependent targets for Compound IV: Shows the targets that exhibit a concentration-dependent response to Compound IV, represented by the teal color. (B) Concentration-dependent targets for Compound IVa: Shows the targets that exhibit a concentration-dependent response to Compound IVa, represented by the teal color. (C) Concentration-dependent targets for Compound IVb: Shows the targets that exhibit a concentration-dependent response to Compound IVb, represented by the teal color. (D) Concentration-dependent targets for Compound IVj: Shows the targets that exhibit a concentration-dependent response to Compound IVj, represented by the teal color. (E) We have not detected any significant concentration-dependent targets for Compound IVk.
Figure 3
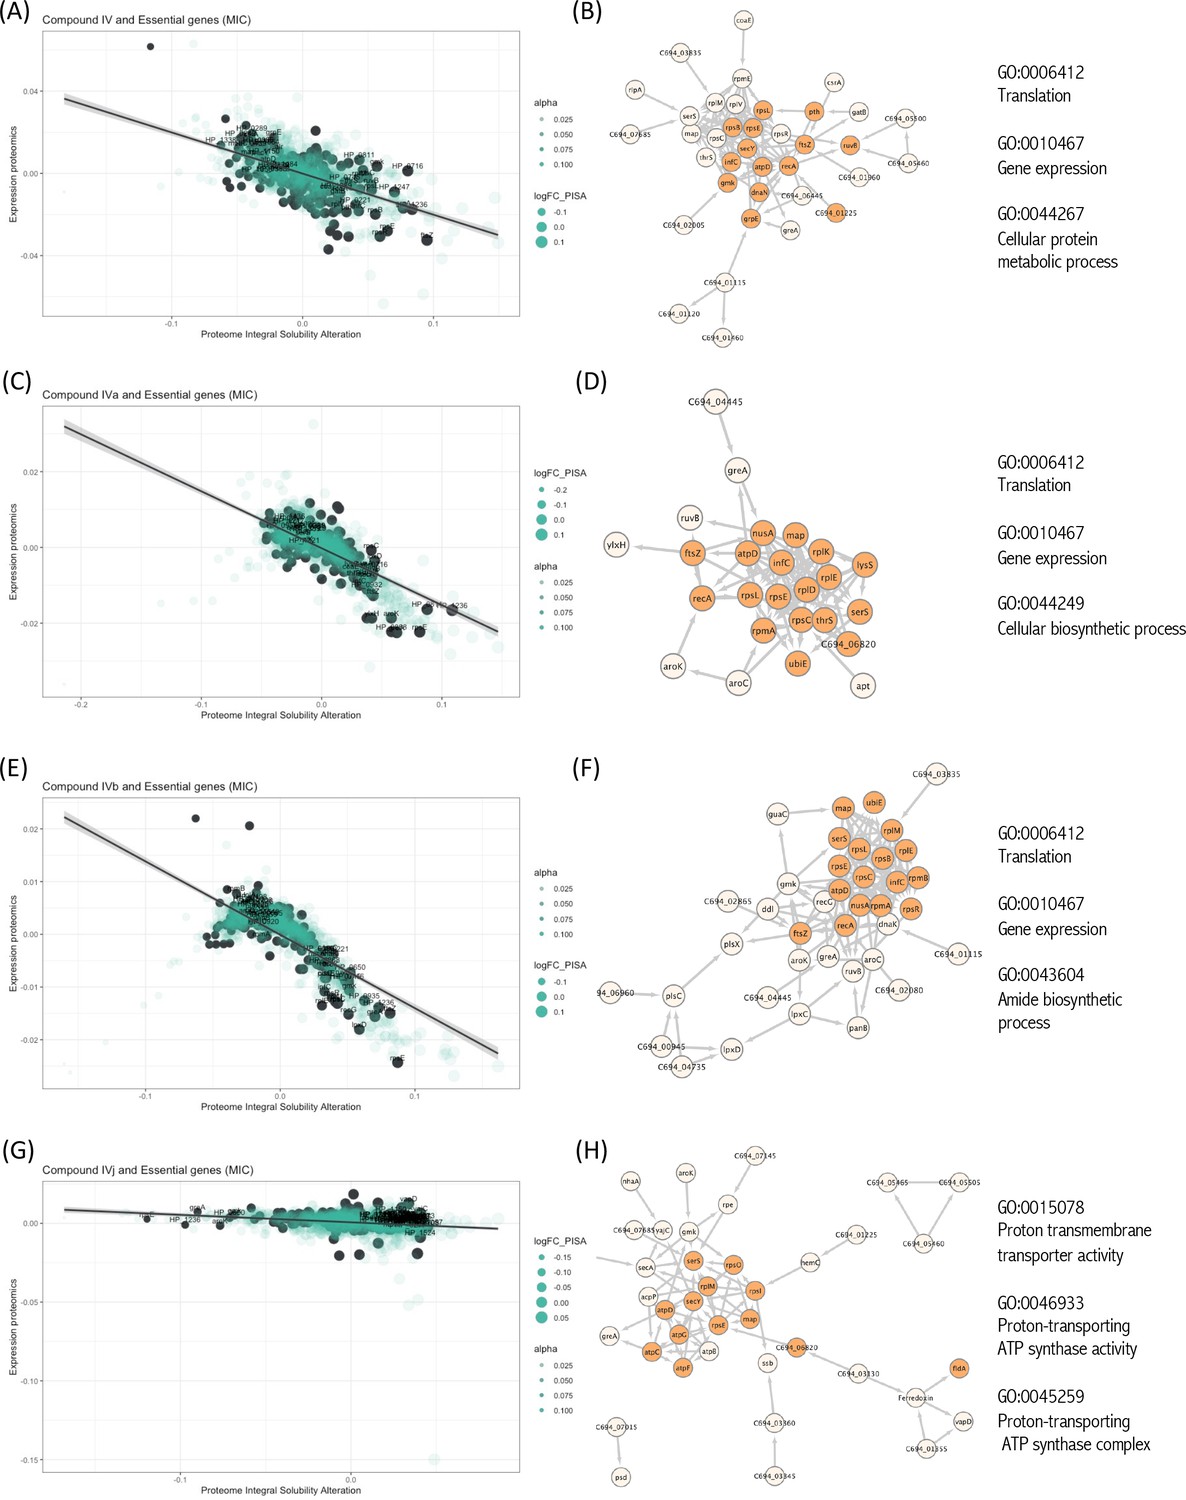
Interactions of compounds with essential proteins.
Significant alterations in protein solubility are highlighted in black, compared to baseline protein expression changes. The panel does not include Compound IVK as no significant alterations in the solubility of essential proteins were detected for this compound. (A) Intracellular essential protein targets detected for Compound IV. (B) Protein co-expression network among the essential proteins with significant alterations induced by Compound IV. Highlighted nodes represent the distribution of the primary gene ontology (GO) term associated with these proteins. (C) Intracellular essential protein targets detected for Compound IVa. (D) Protein co-expression network among the essential proteins with significant alterations induced by Compound IVa. Highlighted nodes represent the distribution of the primary GO term associated with these proteins. (E) Intracellular essential protein targets detected for Compound IVb. (F) Protein co-expression network among the essential proteins with significant alterations induced by Compound IVb. Highlighted nodes represent the distribution of the primary GO term associated with these proteins. (G) Intracellular essential protein targets detected for Compound IVj. (H) Protein co-expression network among the essential proteins with significant alterations induced by Compound IVj. Highlighted nodes represent the distribution of the primary GO term associated with these proteins.
Figure 4 with 4 supplements
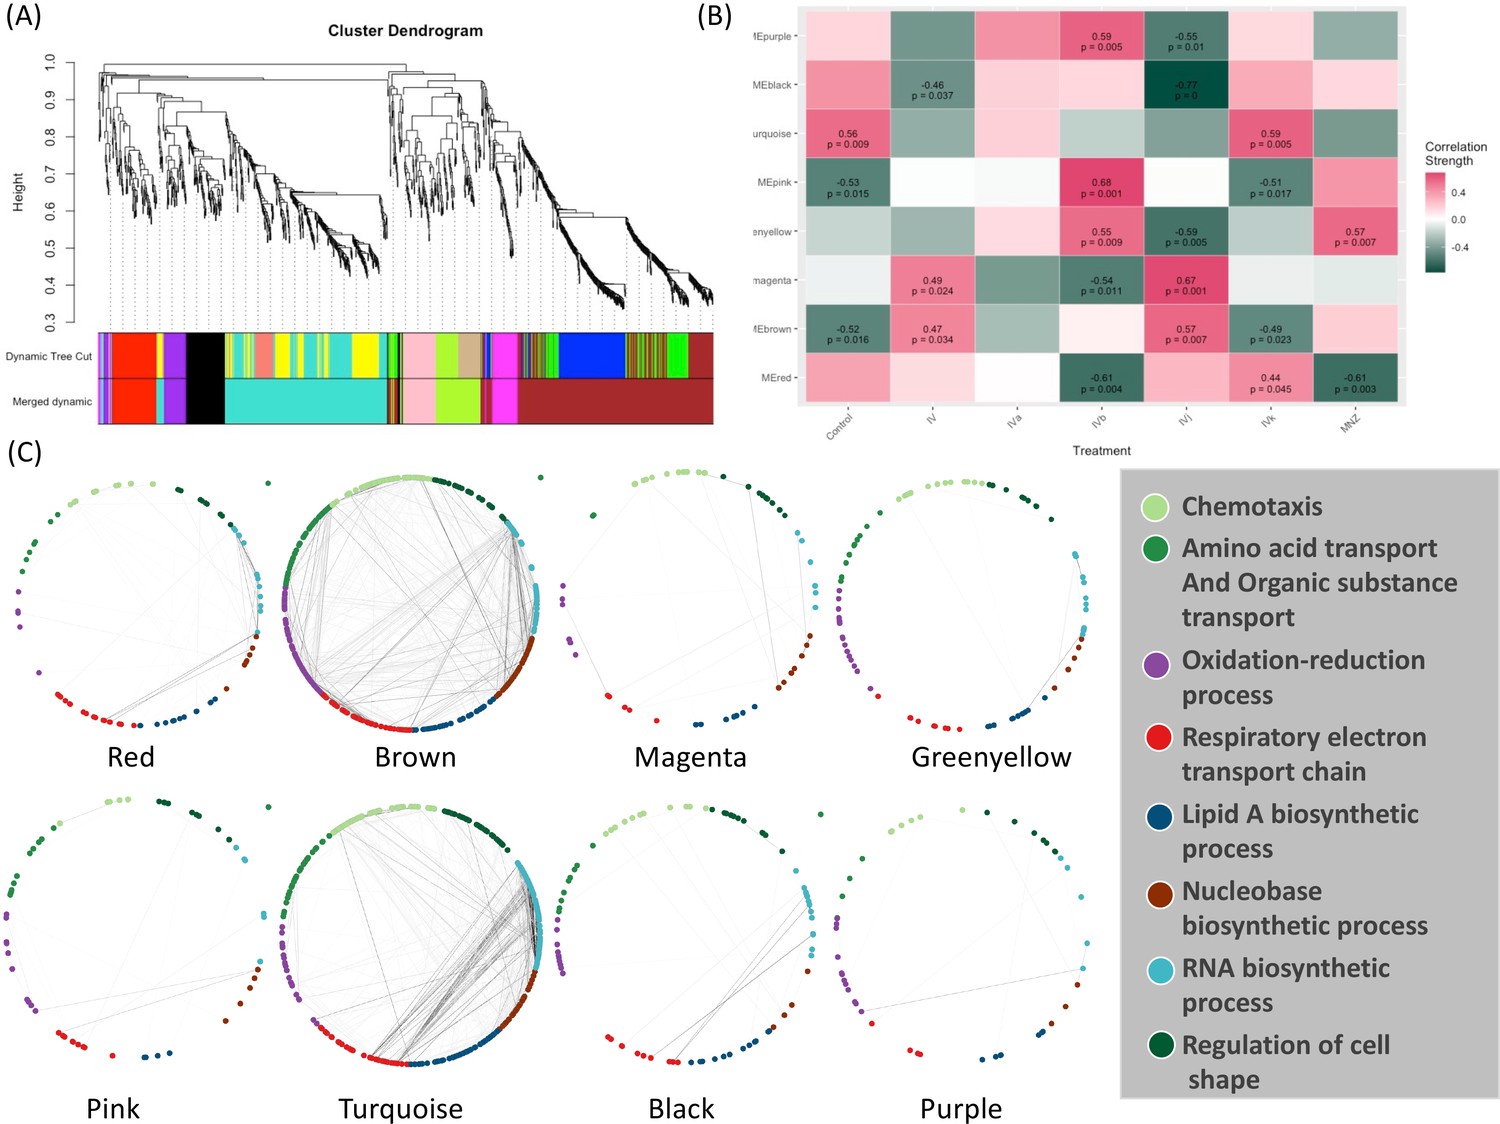
Weighted Correlation Network Analysis (WGCNA) and the selection of drug-associated pathways.
(A) The clustering dendrogram and expression heatmap of genes are presented, identifying the WGCNA modules. (B) The correlation between the identified modules and different treatments is displayed. Modules that exhibit a significant association with traits, indicated by a correlation greater than 0.5 and a p-value less than 0.05. Red and green colors represent positive and negative correlations with gene expression, respectively. (C) The distribution of different WGCNA modules within the protein co-expression network of H. pylori is depicted.
Figure 4—figure supplement 1
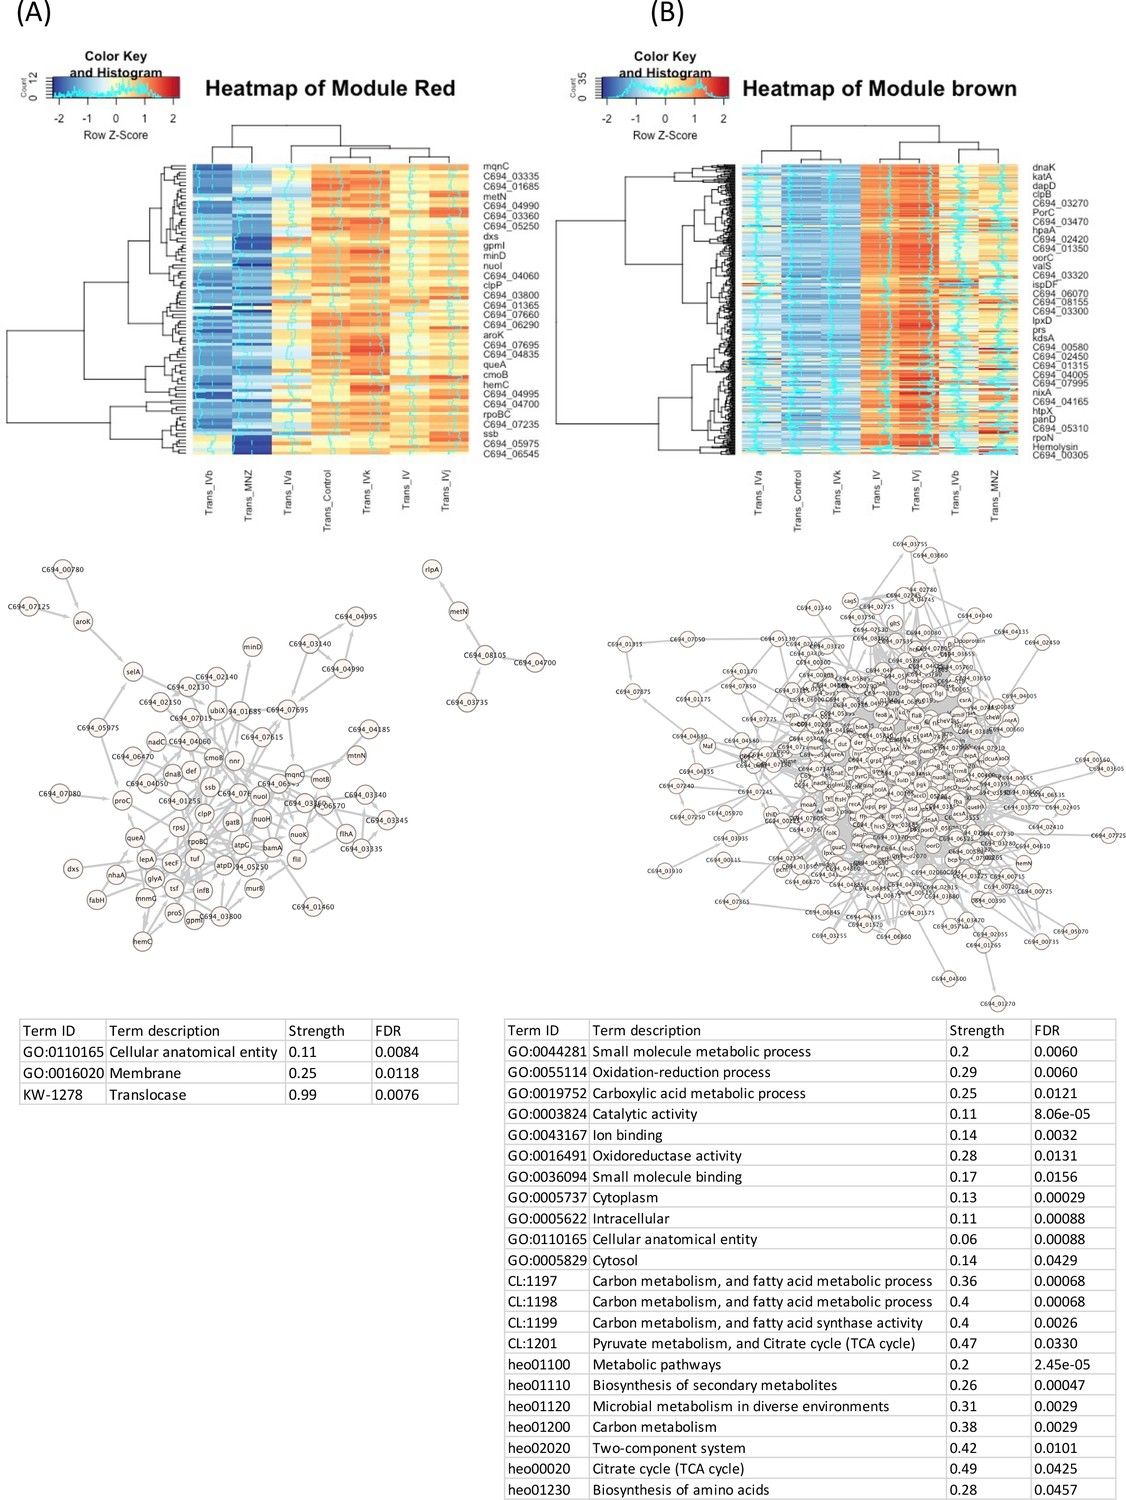
Gene expression heatmap and correlation of different compounds across modules from the WGCNA analysis.
(A) Gene expression heatmap and correlation in module ‘red’: This figure shows the gene expression patterns of Compound IV and its derivatives, along with their correlation in the ‘red’ module. It also depicts the protein–protein co-expression network of the genes in this module and the associated gene ontology. (B) Gene expression heatmap and correlation in module ‘brown’: This figure shows the gene expression patterns of Compound IV and its derivatives, along with their correlation in the ‘brown’ module. It also illustrates the protein–protein co-expression network of the genes in this module and the associated gene ontology.
Figure 4—figure supplement 2
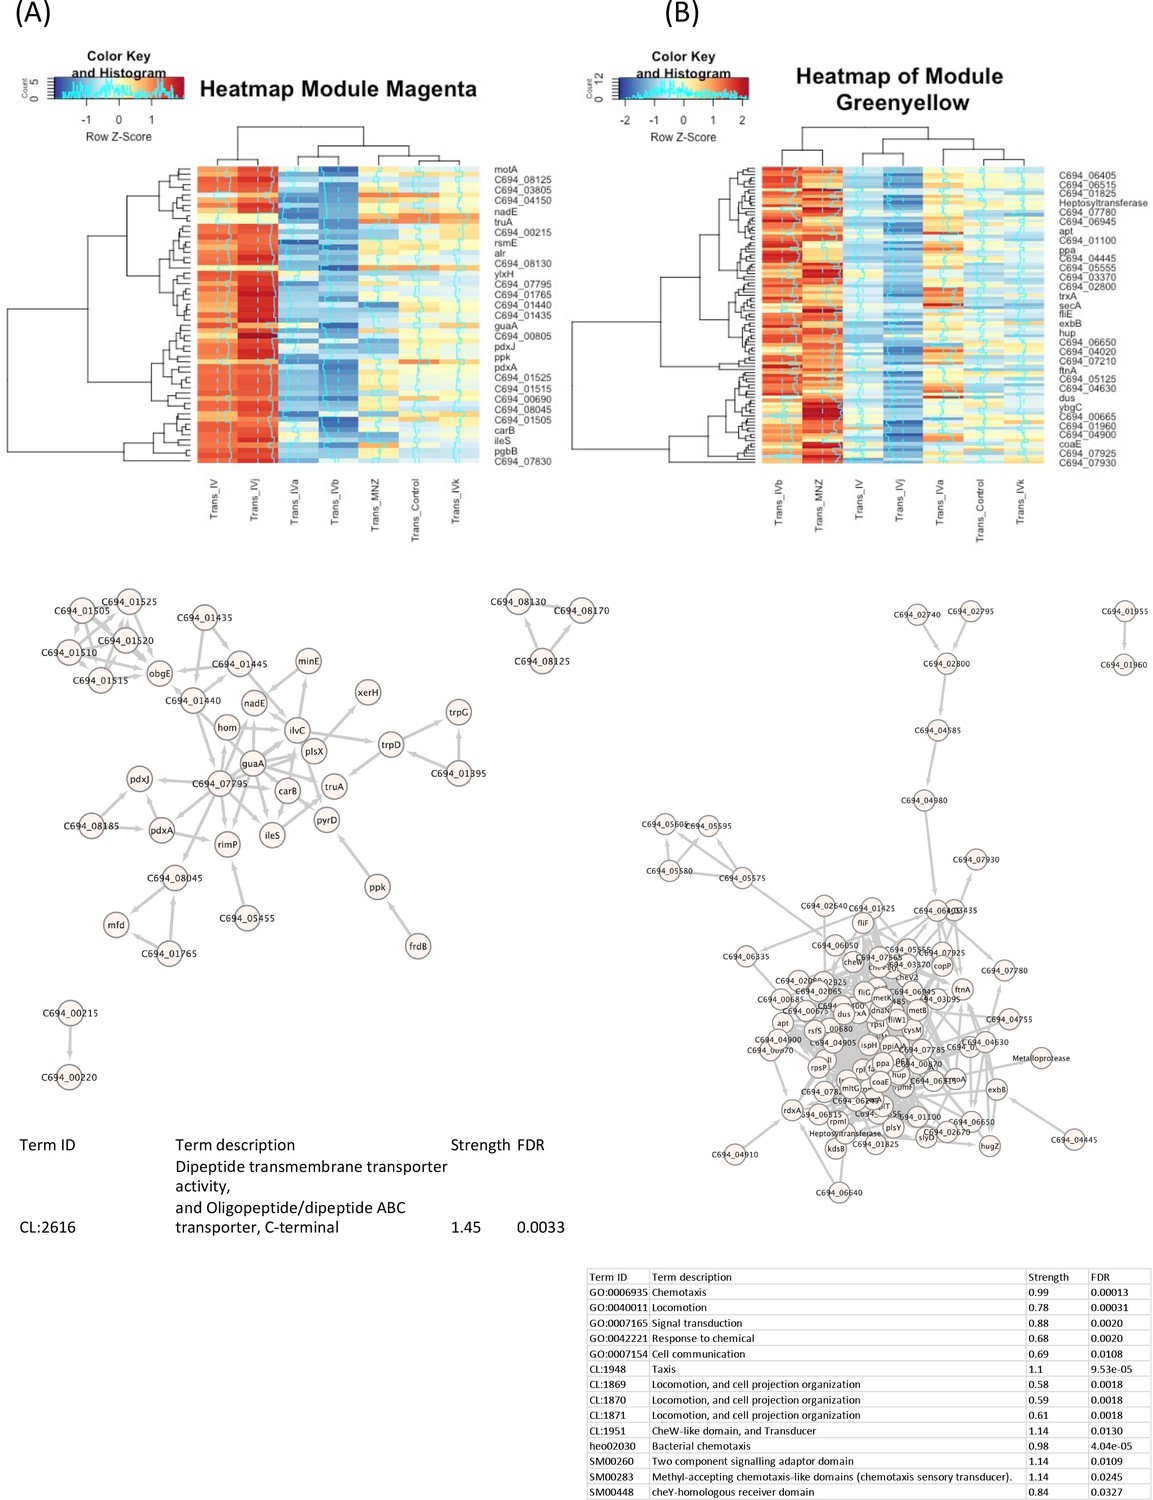
Gene expression heatmap and correlation of different compounds across modules from the WGCNA analysis.
(A) Gene expression heatmap and correlation in module ‘magents’: This figure shows the gene expression patterns of Compound IV and its derivatives, along with their correlation in the ‘magents’ module. It also depicts the protein–protein co-expression network of the genes in this module and the associated gene ontology. (B) Gene expression heatmap and correlation in module ‘Greenyellow’: This figure shows the gene expression patterns of Compound IV and its derivatives, along with their correlation in the ‘Greenyellow’ module. It also illustrates the protein–protein co-expression network of the genes in this module and the associated gene ontology.
Figure 4—figure supplement 3
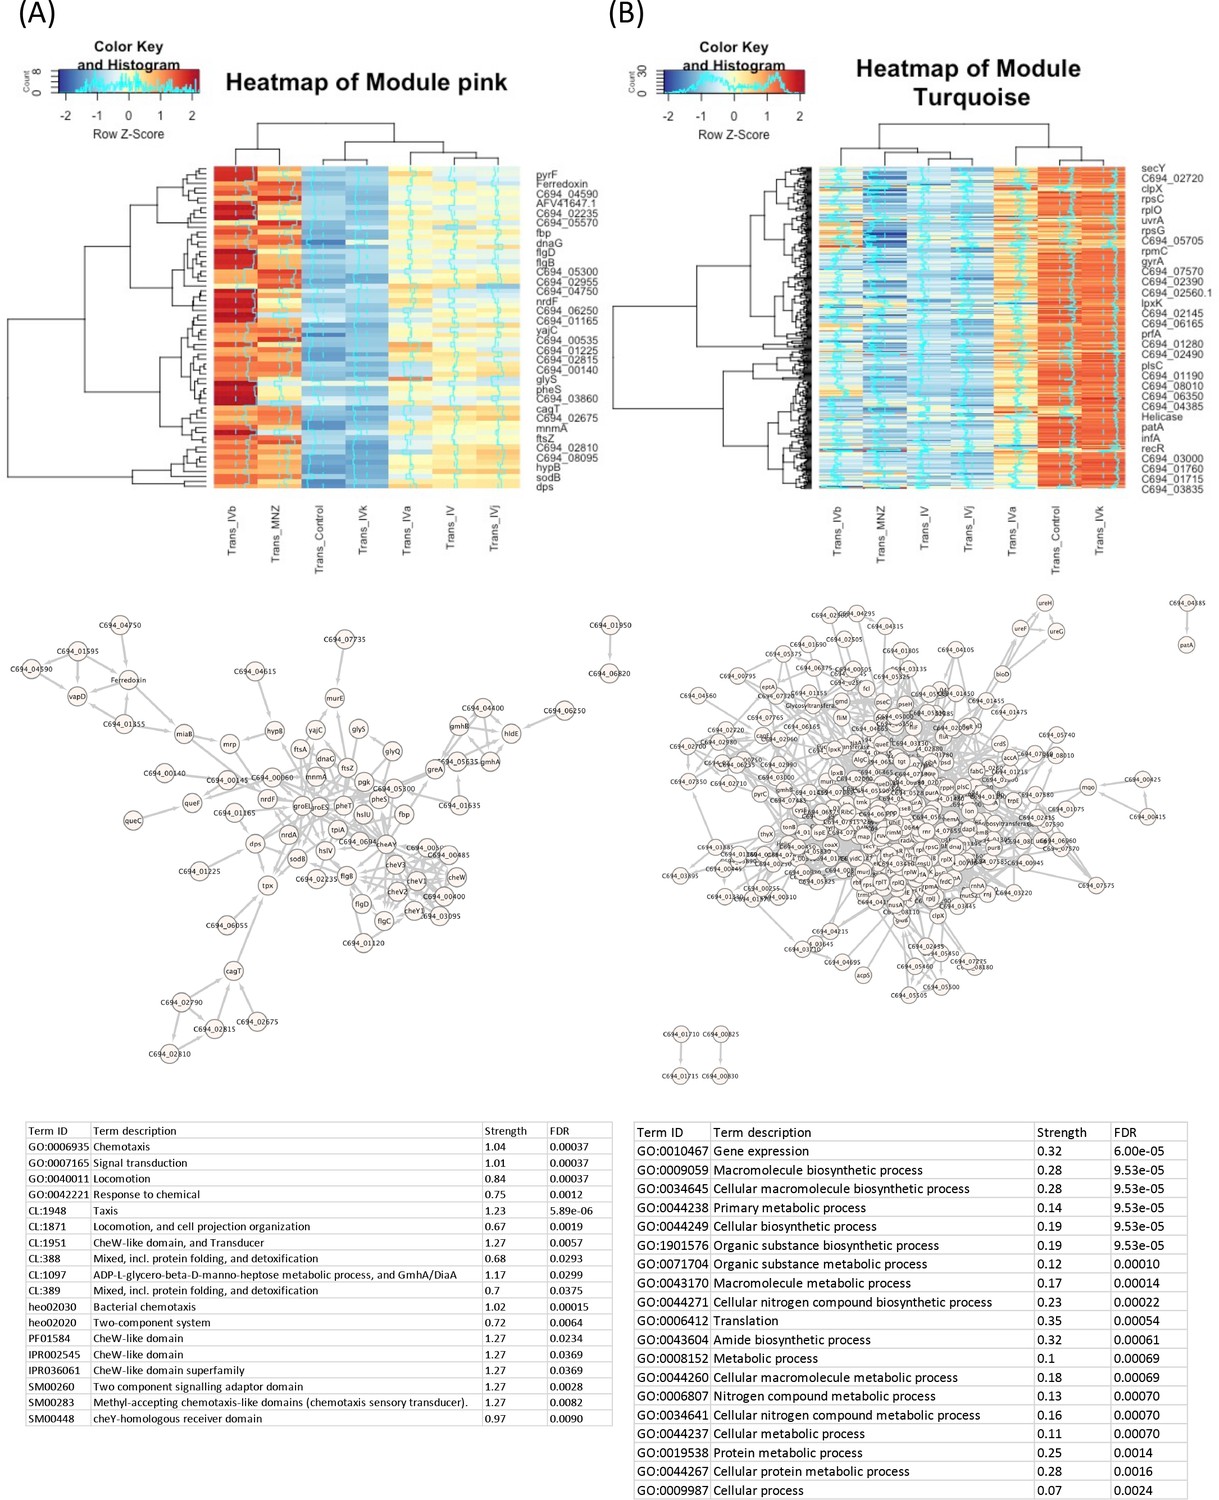
Gene expression heatmap and correlation of different compounds across modules from the WGCNA analysis.
(A) Gene expression heatmap and correlation in module ‘pink’: This figure shows the gene expression patterns of Compound IV and its derivatives, along with their correlation in the ‘pink’ module. It also depicts the protein–protein co-expression network of the genes in this module and the associated gene ontology. (B) Gene expression heatmap and correlation in module ‘turquoise’: This figure shows the gene expression patterns of Compound IV and its derivatives, along with their correlation in the ‘turquoise’ module. It also illustrates the protein–protein co-expression network of the genes in this module and the associated gene ontology.
Figure 4—figure supplement 4
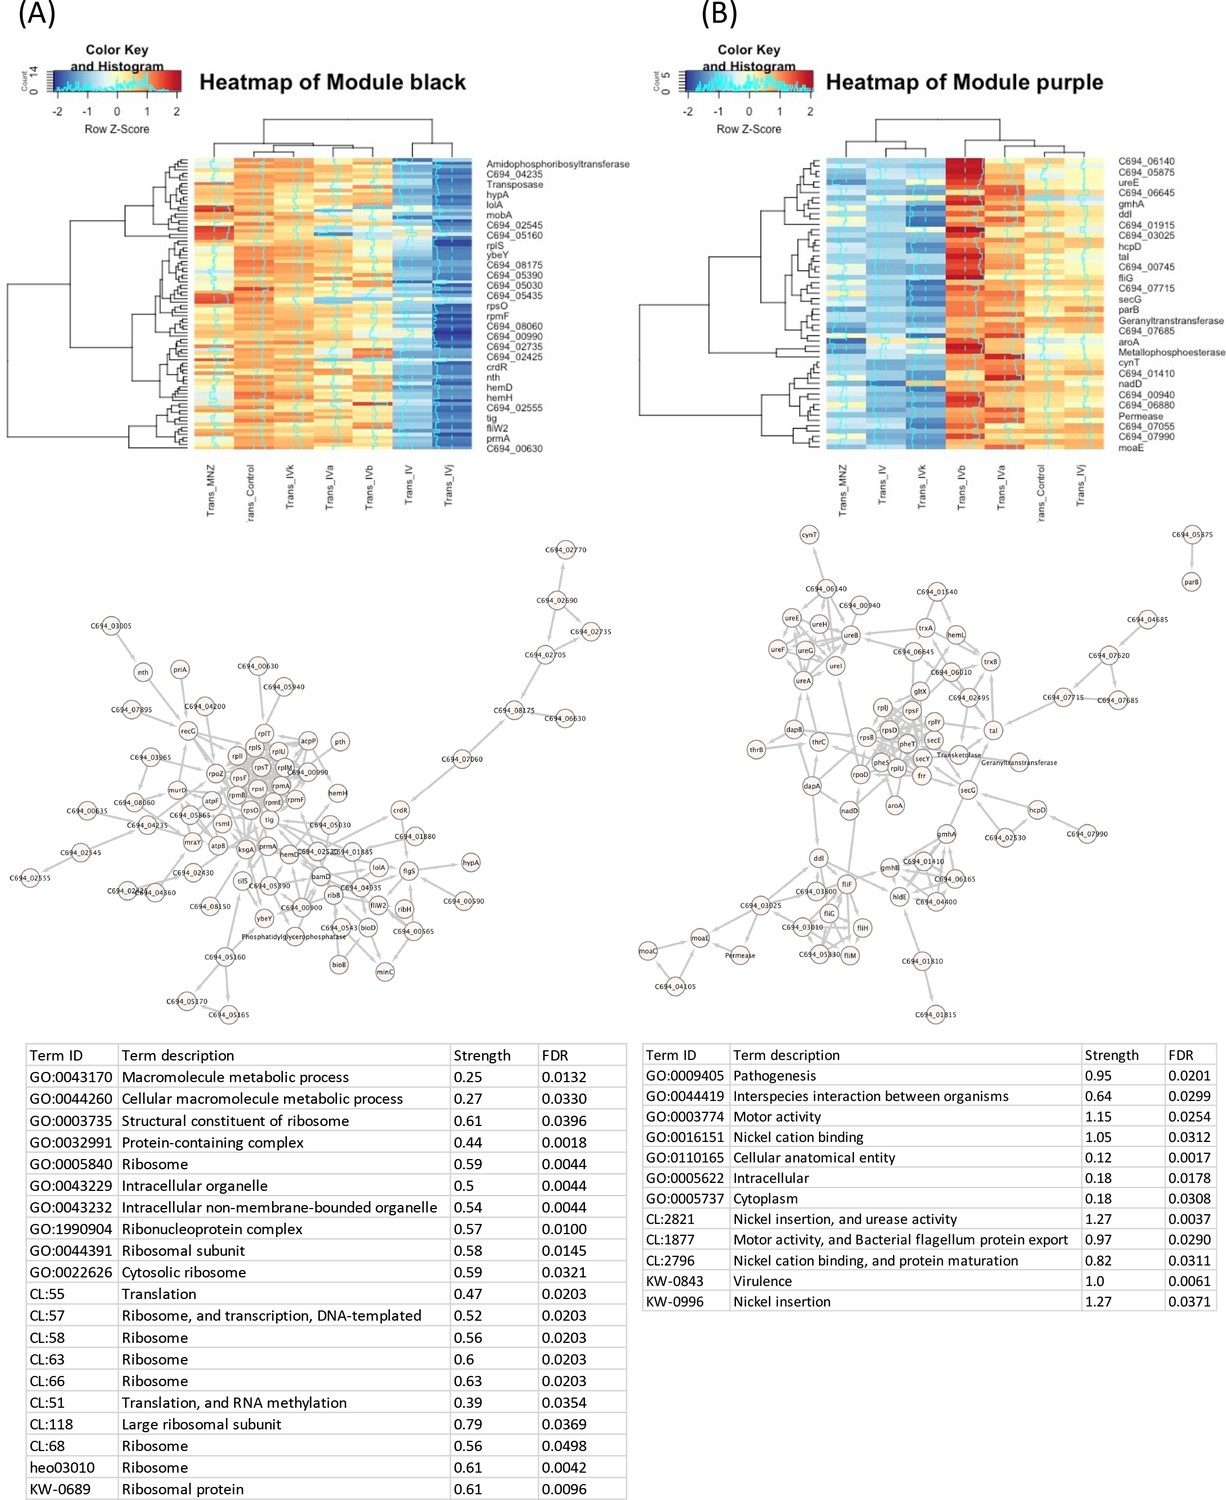
Gene expression heatmap and correlation of different compounds across modules from the WGCNA analysis.
(A) Gene expression heatmap and correlation in module ‘black’: This figure shows the gene expression patterns of Compound IV and its derivatives, along with their correlation in the ‘black’ module. It also depicts the protein–protein co-expression network of the genes in this module and the associated gene ontology. (B) Gene expression heatmap and correlation in module ‘purple’: This figure shows the gene expression patterns of Compound IV and its derivatives, along with their correlation in the ‘purple’ module. It also illustrates the protein–protein co-expression network of the genes in this module and the associated gene ontology.
Figure 5 with 2 supplements
Identification of target-associated pathways.
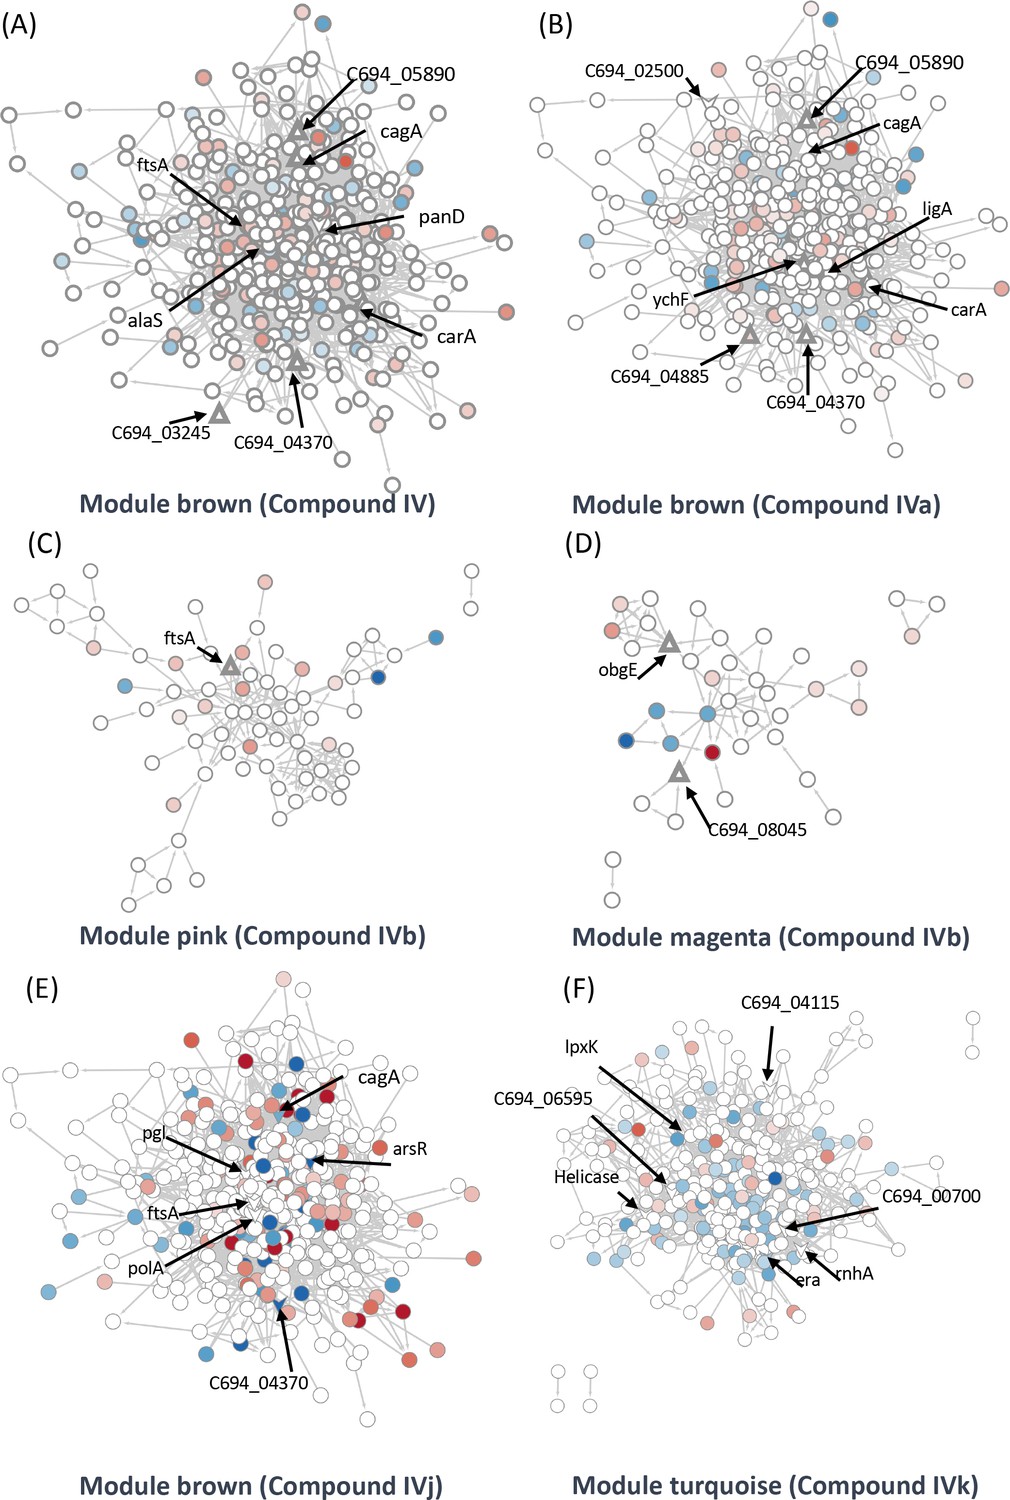
(A) Differential expression of proteins influenced by Compound IV. Upregulated proteins are represented in red, while downregulated proteins are represented in blue. The targets associated with Compound IV are highlighted within the brown module (triangle). (B) Differential expression of proteins influenced by Compound IVa. Upregulated proteins are represented in red, while downregulated proteins are represented in blue. The targets associated with Compound IVa are highlighted within the brown module (triangle). (C) Differential expression of proteins influenced by Compound IVb. Upregulated proteins are represented in red, while downregulated proteins are represented in blue. The targets associated with Compound IVb are highlighted within the pink module (triangle). (D) Differential expression of proteins influenced by Compound IVb. Upregulated proteins are represented in red, while downregulated proteins are represented in blue. The targets associated with Compound IVb are highlighted within the megenta module (triangle). (E) Differential expression of proteins influenced by Compound IVj. Upregulated proteins are represented in red, while downregulated proteins are represented in blue. The targets associated with Compound IVj are highlighted within the brown module (triangle arrow symbol). (F) Differential expression of proteins influenced by Compound IVk. Upregulated proteins are represented in red, while downregulated proteins are represented in blue. The targets associated with Compound IVk are highlighted within the turquoise module (triangle arrow symbol).
Figure 5—figure supplement 1
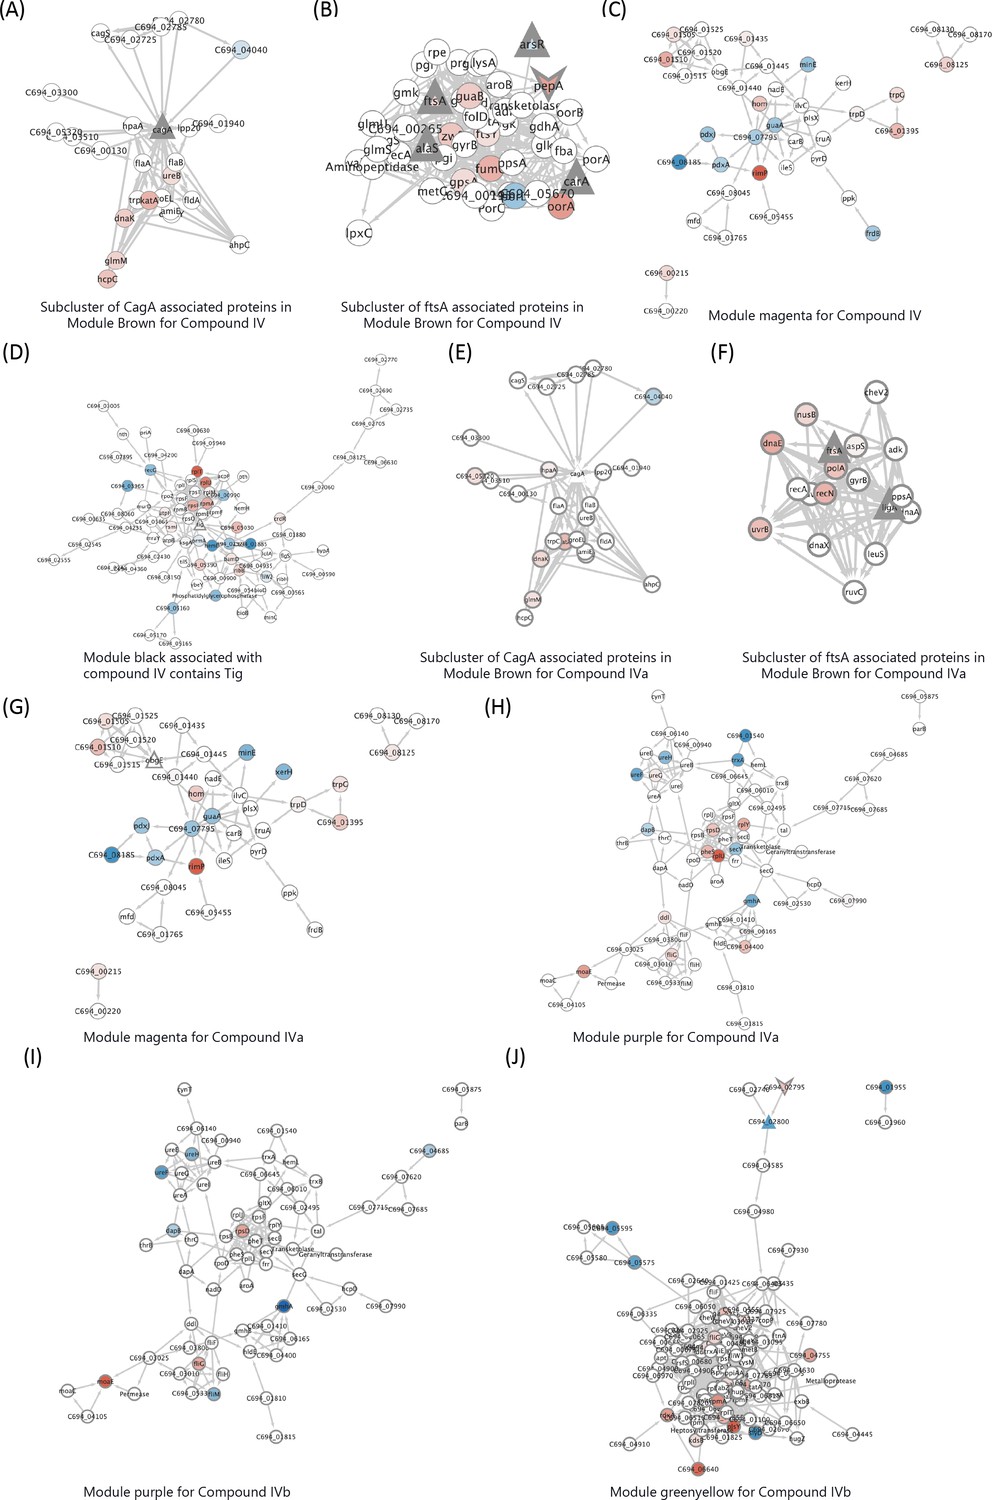
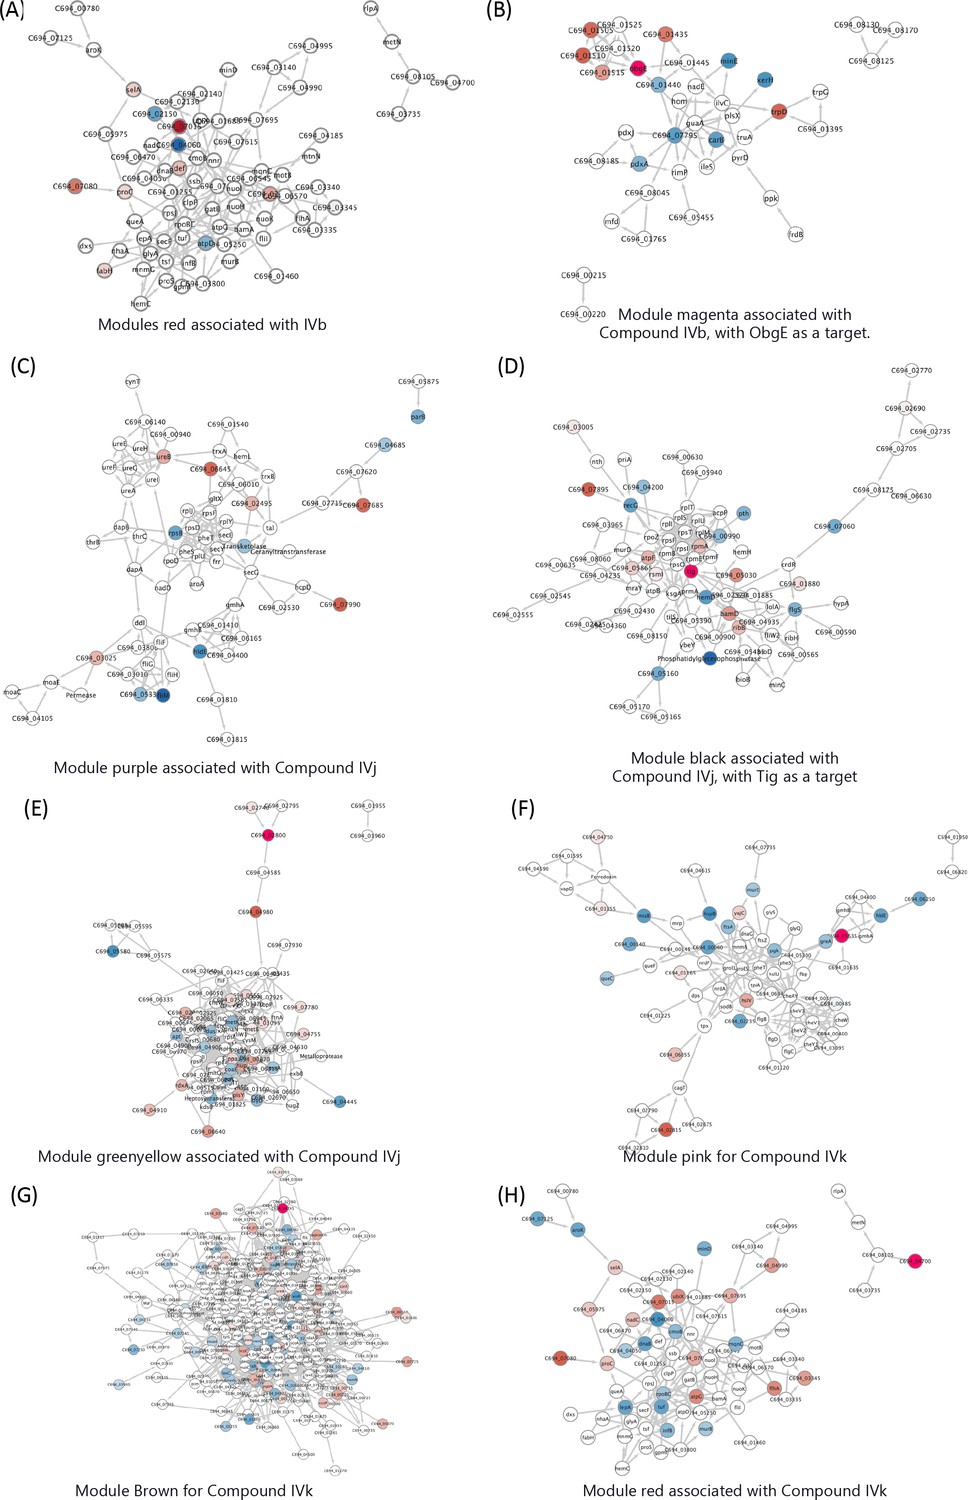
Associations between different modules and specific targets for Compound IV and its derivatives.
(A, B) First neighbors of the target proteins CagA and FtsA from the ‘brown’ module associated with Compound IV. (C) Module ‘magenta’ associated with Compound IV. (D) Module ‘black’ associated with Compound IV, with Tig as a target. (E, F) First neighbors of the target proteins CagA and FtsA from the ‘brown’ module associated with Compound IVa. (G) Module ‘magenta’ associated with Compound IVa, with ObgE as a target. (H) Module ‘purple’ associated with Compound IVa. (I) Module ‘purple’ associated with Compound IVb. (J) Module ‘greenyellow’ associated with Compound IVb, with two uncharacterized proteins as targets.
Figure 5—figure supplement 2
Associations between different modules and specific targets for Compound IV and its derivatives.
(A) Module ‘red’ associated with Compound IVb. (B) Module ‘magenta’ associated with Compound IVb, with ObgE as a target. (C) Module ‘purple’ associated with Compound IVj. (D) Module ‘black’ associated with Compound IVj, with Tig as a target. (E) Module ‘greenyellow’ associated with Compound IVj, with a hypothetical protein as a target. (F) Module ‘pink’ associated with Compound IVk, with a hypothetical protein as a target. (G) Module ‘brown’ associated with Compound IVk, with a hypothetical protein as a target. (H) Module ‘red’ associated with Compound IVk, with a hypothetical protein as a target.
Figure 6 with 2 supplements
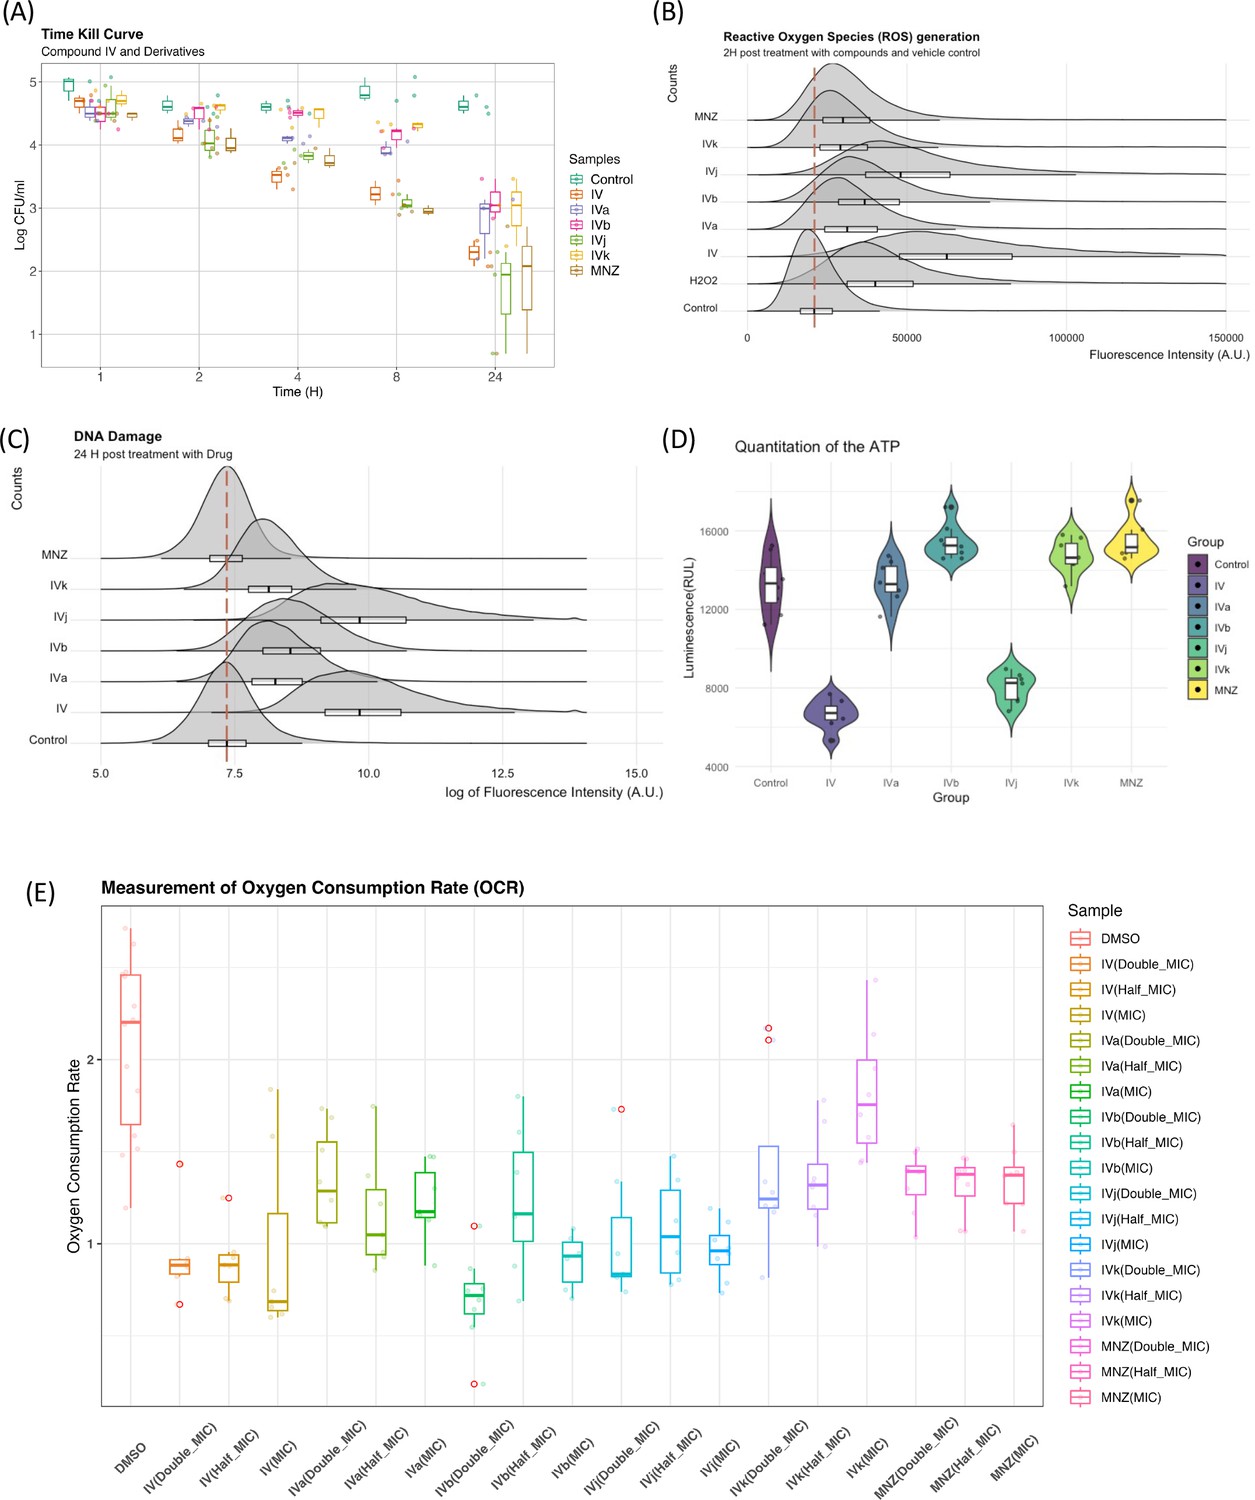
Biophysical assays validating changes in the targeted pathway.
(A) The time-kill curves were obtained by measuring the bacterial growth inhibition using an initial inoculum of 105 CFU/ml at various time points up to 24 hr. We observed bactericidal activity with all of our compounds. (B) Flow cytometry analysis was utilized to quantify the generation of reactive oxygen species (ROS), with fluorescence intensity plotted against counts. The presented data represent the compilation of three independent experiments. (C) Flow cytometry analysis was performed on both control and drug-treated H. pylori cells following the TUNEL (terminal deoxynucleotidyl transferase dUTP nick end labeling) assay protocol. The data are presented as a density plot of fluorescence intensity versus the cell counts. The presented data represent the compilation of three independent experiments. (D) Changes in the ATP production rate and the presented data represent eight replicates of a single experiment. (E) Oxygen consumption rate (OCR) of each sample (with six replicates) at 60 min was related to the basal OCR and compared with the same ratio obtained with the sole DMSO (as the untreated reference sample). Values are the means of the replicates ± standard deviation (SD).
Figure 6—figure supplement 1
Alteration in solubility of flavodoxin in the Proteome Integral Solubility Alteration (PISA) assay associated with different compounds at two different concentrations.
Figure 6—figure supplement 2
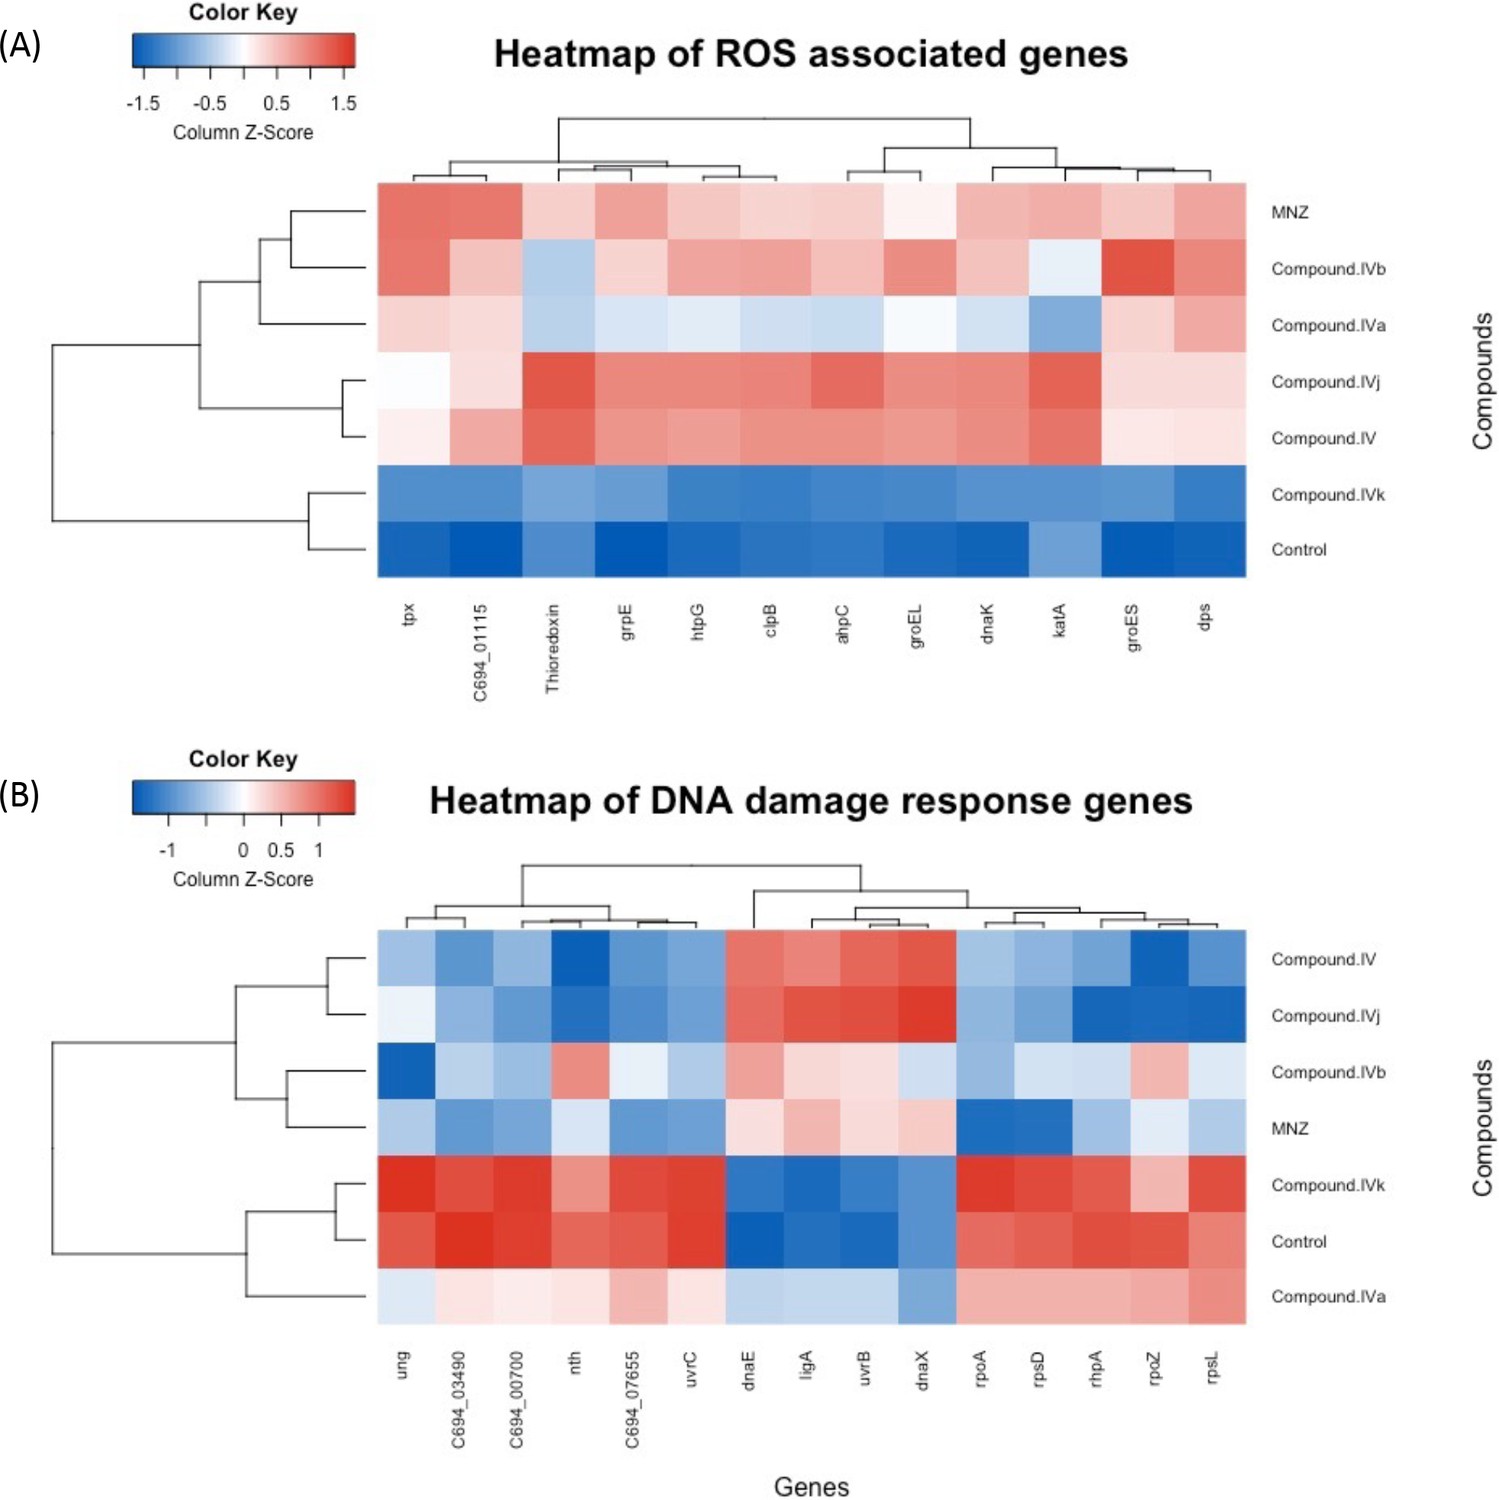
Expression of gene associated with oxidative stress and DNA damage.
Heatmap of the differential gene expression associated with (A) generation of reactive oxygen species (ROS) and (B) DNA damage response genes.
Tables
Table 1
Proteins with highest solubility alteration from the Proteome Integral Solubility Alteration (PISA) assay.
| Compound | Proteins with highest solubility alteration | |||||||||
|---|---|---|---|---|---|---|---|---|---|---|
| IV | cagA | carA | ftsA | HP_0542 | HP_0706 | HP_0853 | HP_1142 | panD | rpsA | ig |
| IVa | cagA | carA | dnaJ | HP_0486 | HP_0542 | HP_1236 | bg | rpsA | tig | ychF |
| IVb | cagA | dnaJ | ftsA | HP_0486 | HP_0542 | HP_0543 | HP_0706 | rpsA | tig | ychF |
| IVj | arsR | cagA | dnaJ | ftsA | HP_0543 | HP_0853 | ligA | rpsA | rpsE | tig |
| IVk | amiF | HP_0750 | HP_0803 | HP_0922 | HP_0993 | HP_1091 | HP_1163 | HP_1276 | HP_1390 | rnhA |
Additional files
Download links
A two-part list of links to download the article, or parts of the article, in various formats.
Downloads (link to download the article as PDF)
Open citations (links to open the citations from this article in various online reference manager services)
Cite this article (links to download the citations from this article in formats compatible with various reference manager tools)
Merging multi-omics with proteome integral solubility alteration unveils antibiotic mode of action
eLife 13:RP96343.
https://doi.org/10.7554/eLife.96343.3


