Selective recruitment of the cerebellum evidenced by task-dependent gating of inputs
- Western Institute for Neuroscience, Western University, London, Canada
- Cognitive, Linguistics, & Psychological Science, Brown University, United States
- McGovern Institute, Massachusetts Institute of Technology, United Kingdom
- Department of Psychology, University of California, Berkeley, United States
- Helen Wills Neuroscience Institute, University of California Berkeley, United States
- Department of Statistical and Actuarial Sciences, Western University London, Canada
- Department of Computer Science, Western University, London, Canada
Figures
Figure 1

Timeline of events in the alternating finger tapping task.
The height of the target force area indicated the target force, the number of white squares the target number of taps. During the press interval, the participant alternatively tapped the middle and ring finger. After each tap, the next box turned green. Reward feedback (e.g.,+4) was based on their performance.
Figure 2
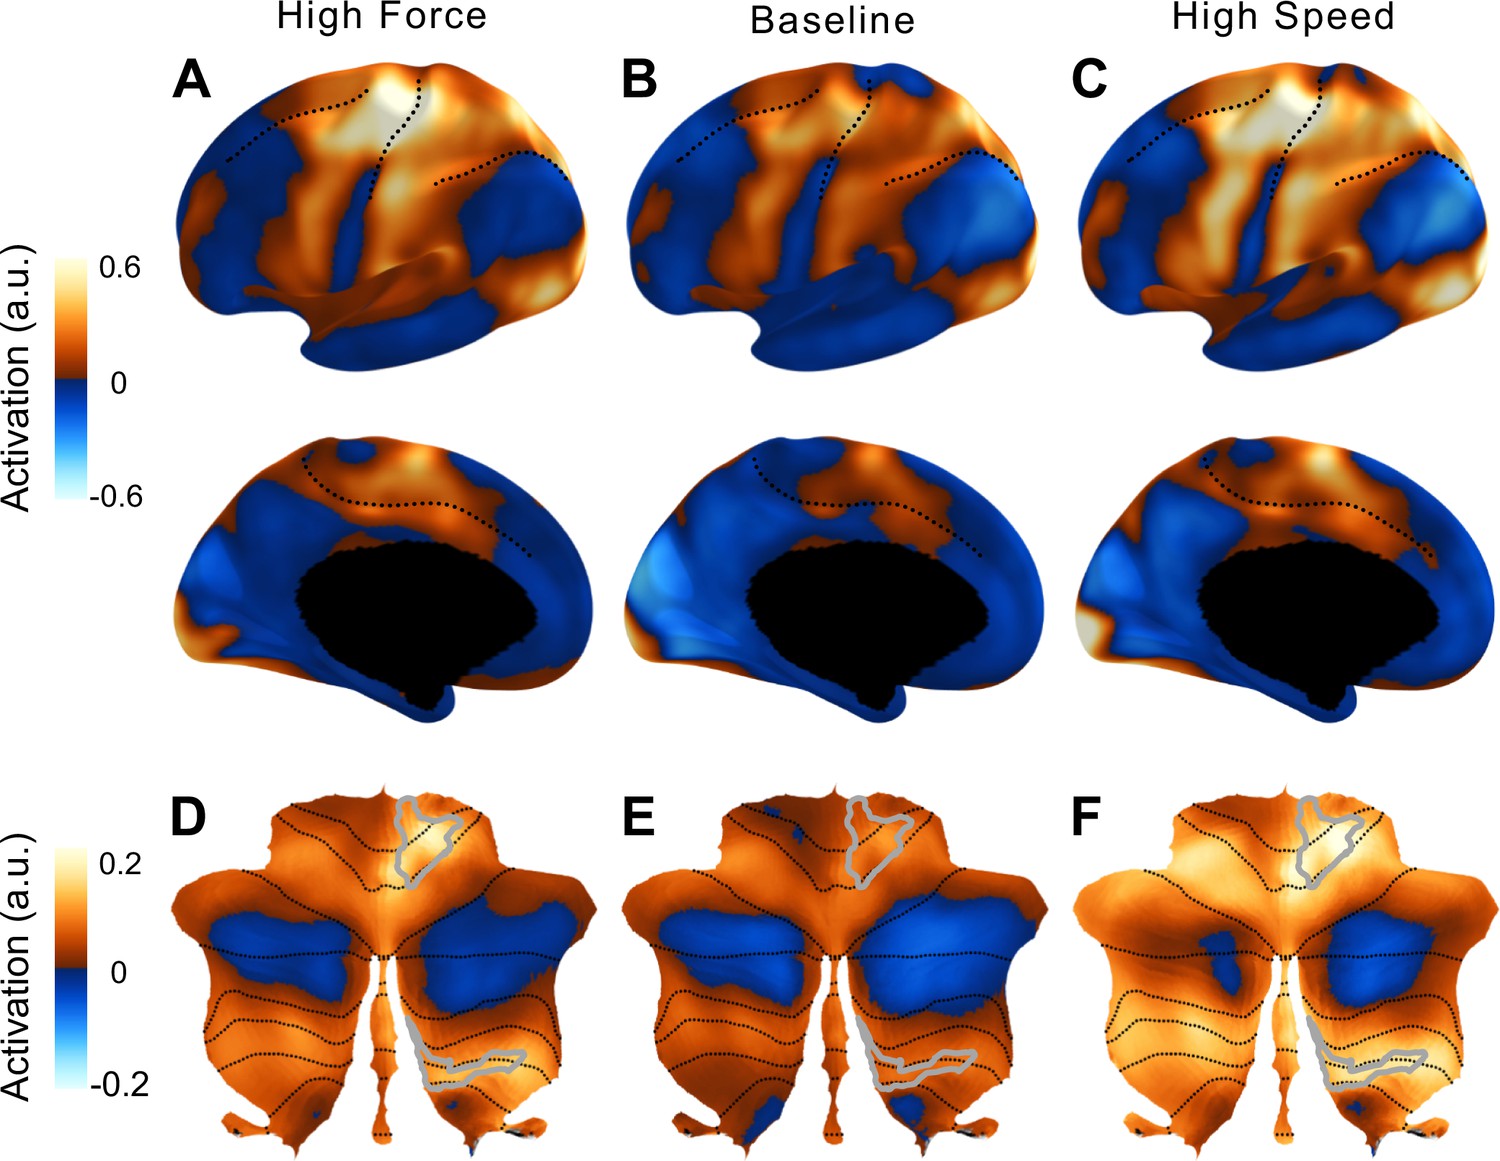
Activation in the cortico-cerebellar motor network compared to rest.
Activity maps for high-force (left), baseline (middle), and high-speed (right) conditions. High levels of force and speed were chosen to show the spatial distribution of activity. Medium level of force and speed resulted in similar maps with activity levels between the baseline and high conditions. (A–C) Lateral and medial surface of the left hemisphere. Dotted lines indicate the superior frontal, central, intra-parietal, and cingulate sulcus. (D–F) Flat map of the cerebellum (Diedrichsen and Zotow, 2015) with lobular boundaries indicated in dotted line. The right anterior and posterior hand motor area (M3R, gray outline) was defined by a new functional atlas of the cerebellum (Nettekoven et al., 2024b).
Figure 3 with 1 supplement
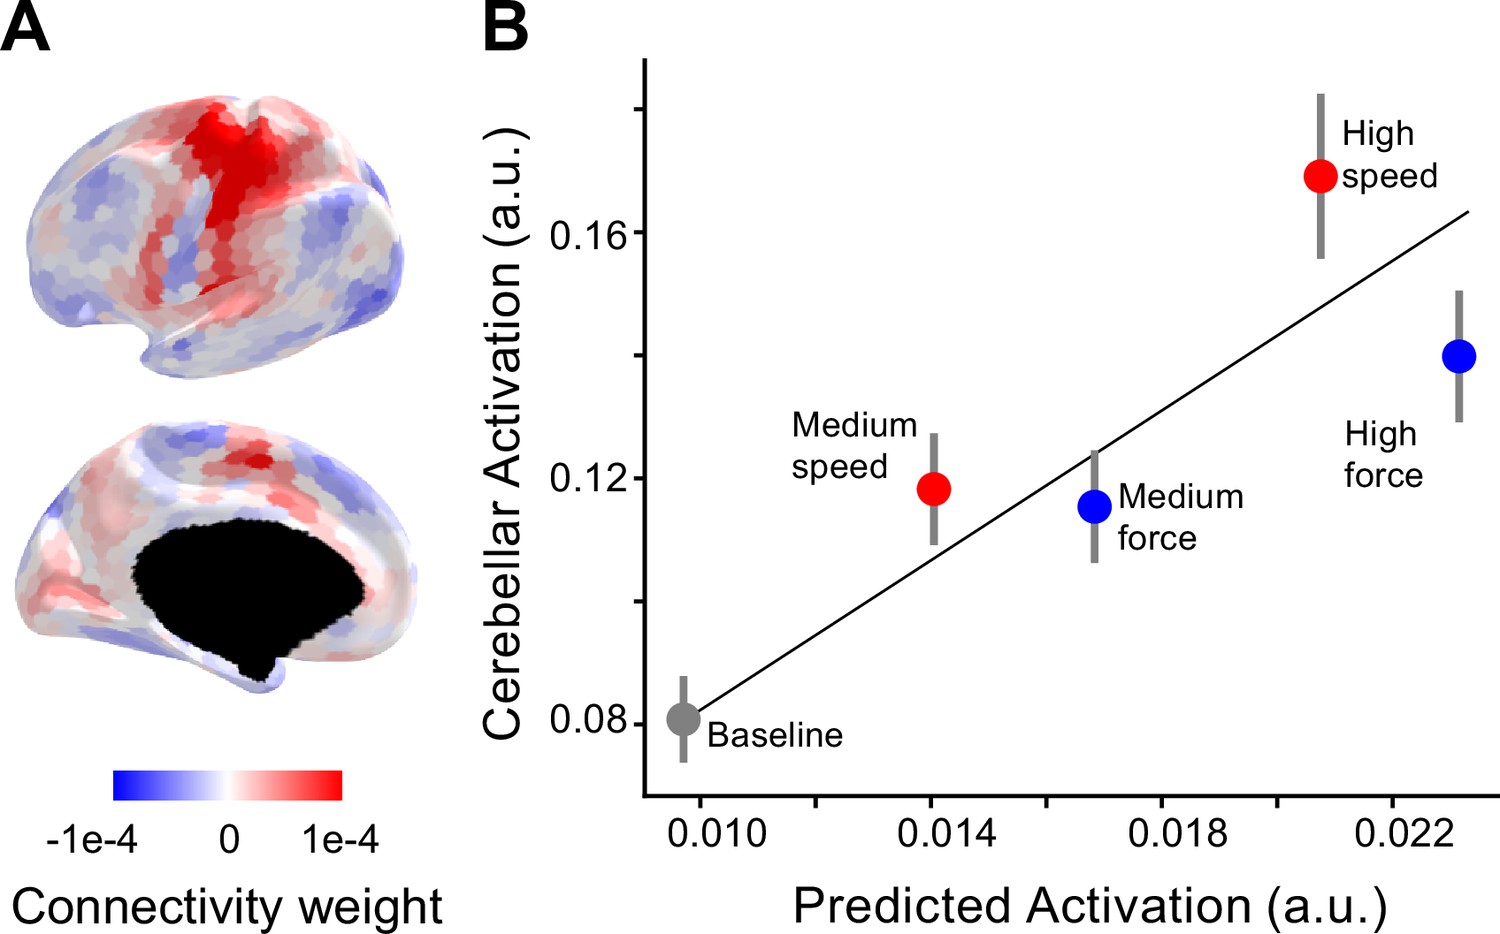
Selective recruitment of cerebellum for fast alternating finger movements.
(A) Average connectivity weights from a group-level connectivity model (Ridge regression, multi-domain task battery [MDTB], task set A) for the cerebellar right-hand area shown on inflated surface of the left hemisphere. For evaluation of alternative connectivity models see Figure 3—figure supplement 1. (B) Average observed cerebellar activation (y-axis) plotted against average prediction from the connectivity model (x-axis). Resting baseline (located at 0,0) is not shown explicitly but included in the regression. The error bars indicate the standard error of the mean of the signed residuals.
Figure 3—figure supplement 1

Connectivity models evaluation.
The connectivity model used in the main analysis was trained on task set A of the multi-domain task battery (MDTB) dataset using Ridge regression (King et al., 2023). As alternative connectivity models, we used Lasso regression on the same training set and a ridge regression model trained on five task-based datasets including MDTB (Nettekoven et al., 2024b). Predictive accuracy was calculated as the cosine similarity between observed and predicted activity patterns of all the task conditions used in this paper. Error bars indicate the standard error of predictive accuracy of the evaluated models.
Figure 4
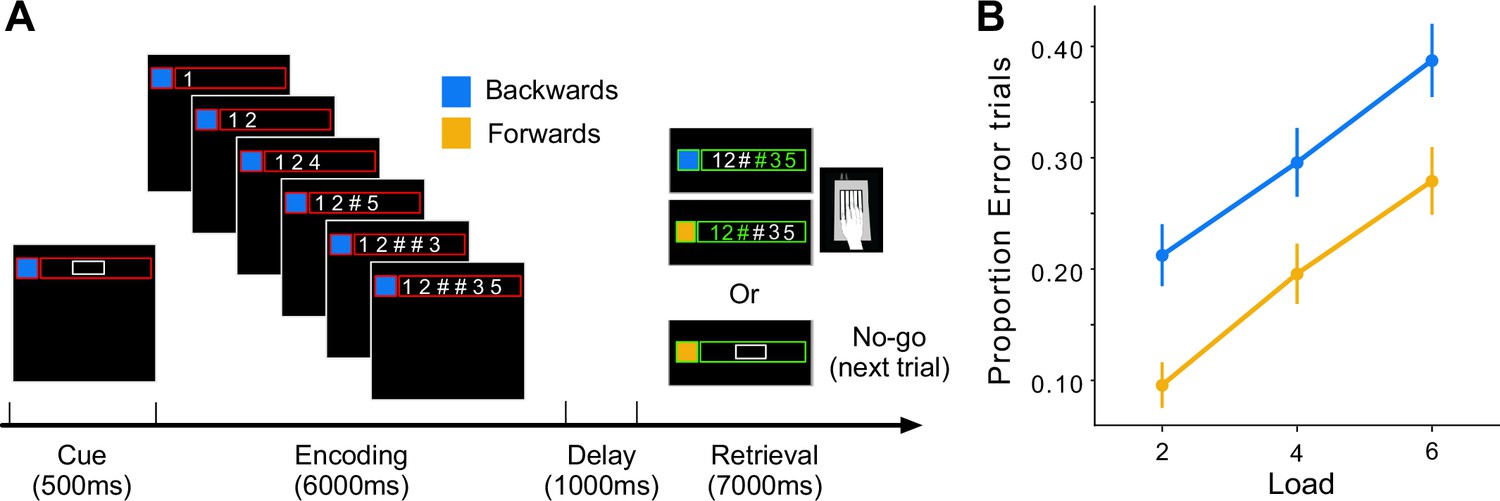
The digit span task and behavioral performance.
(A) Timeline of trial events. The cue signaled the recall direction (blue for backward and yellow for forward) and memory load (size of the white box indicated the number of memory digits) of the upcoming trial. During encoding, a new digit appeared every second and was replaced by the # symbol if it was a memory digit. After a 1-s delay, the task progressed to either the retrieval phase (Go trial) or skipped directly to the next trial (No-Go trials). (B) Proportion of error trials. Error bars indicate standard error of the mean across participants.
Figure 5
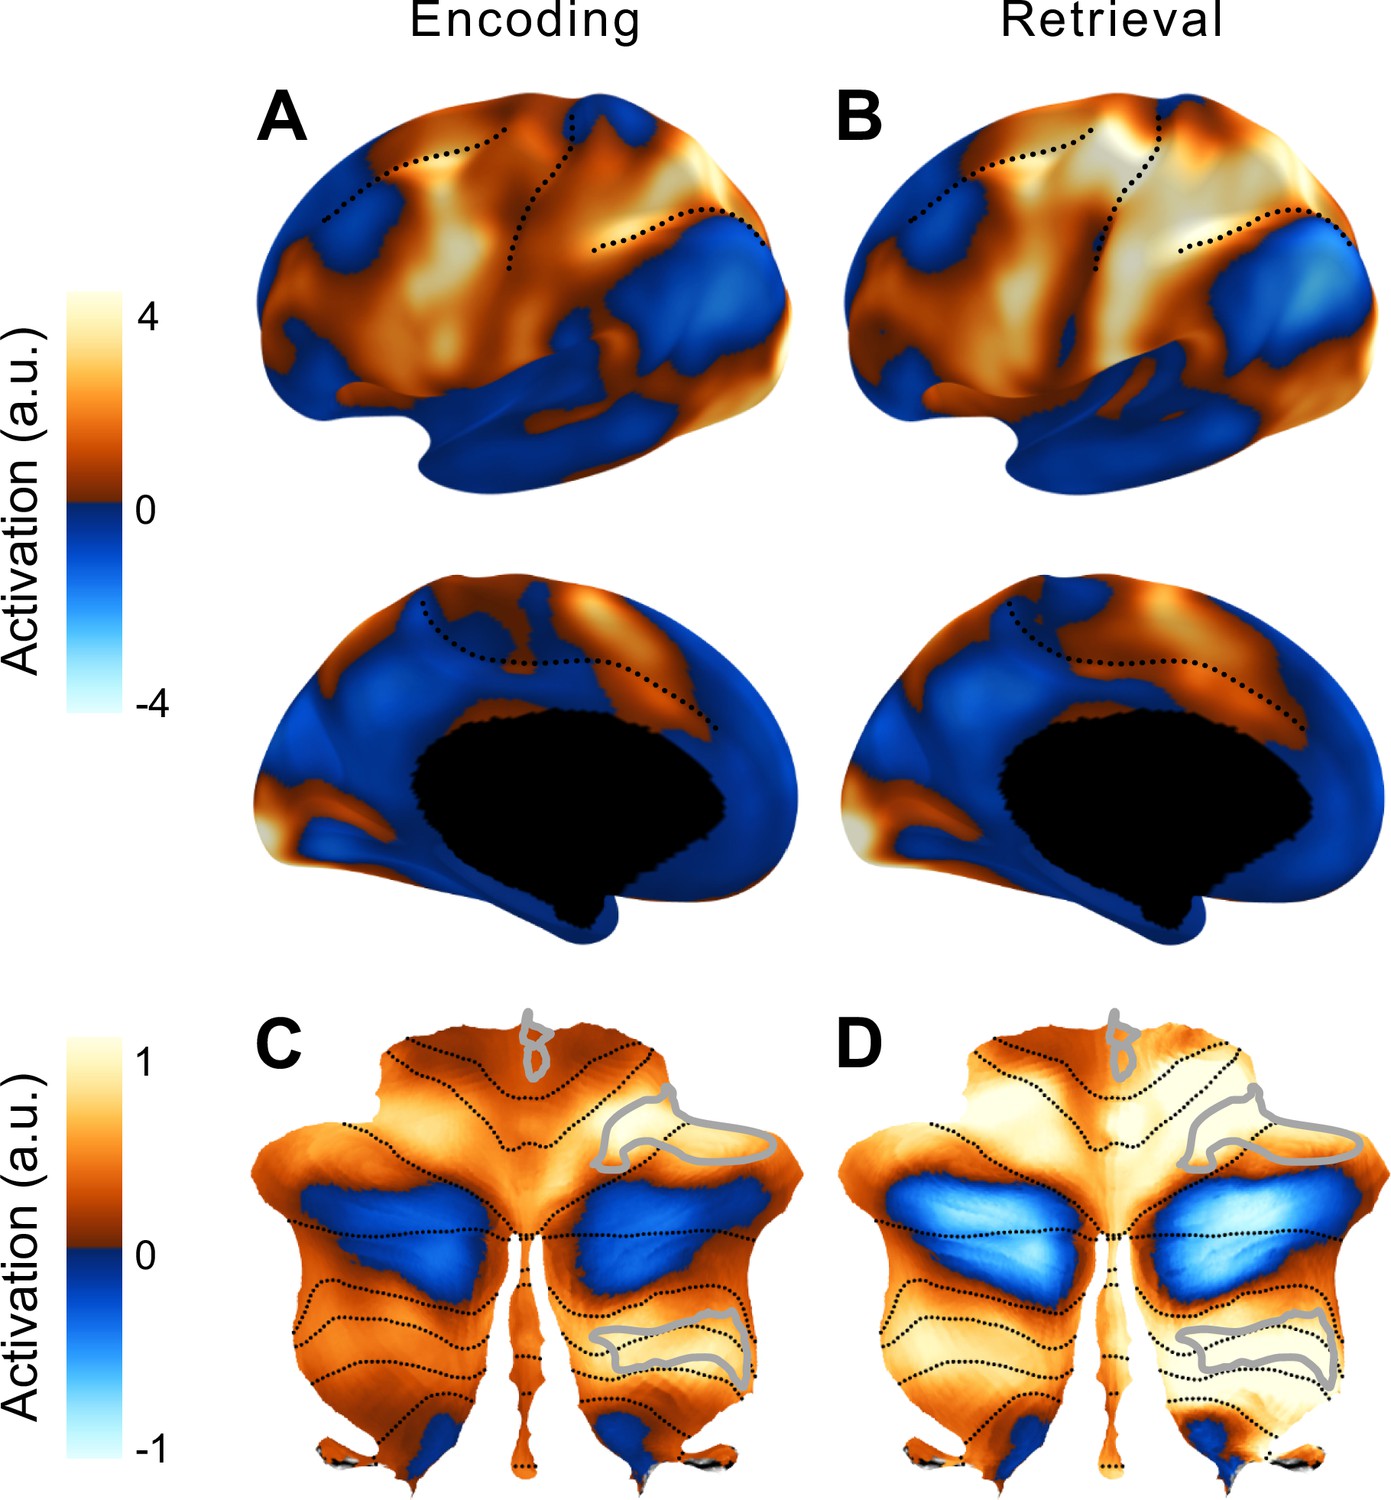
Average activation in the cortico-cerebellar network for working memory.
Group-averaged activation during the encoding (A) and retrieval (B) phases on an inflated representation of the left cerebral hemisphere (as in Figure 2). (C, D) Group average activity during the two phases in the cerebellum. The D3R subregion of the multi-demand network in the right cerebellar hemisphere was used in the main analysis (outlined in light gray).
Figure 6

Selective recruitment of cerebellum in digit span task.
(A) Average connectivity weights from a group-level connectivity model for the cerebellar D3R region of interest. (B) Average observed cerebellar activation (y-axis) plotted against average prediction from the connectivity model (x-axis). Line shows the best linear relationship between predicted and observed activity with an intercept of zero. Error bars show standard error of the mean (SEM) of the signed residuals for each condition across subjects.
Tables
Table 1
Mean and between-subject standard deviation (±) of force, speed, and error rate for each condition across subjects.
| Condition | Target force (N) | Target # taps in 6 s | Average force (N) | Average # taps in 6 s | Error rate (%) |
|---|---|---|---|---|---|
| High speed | 2.5 | 18 | 2.93 ± 0.48 | 17.72 ± 0.84 | 5 ± 0.21 |
| Medium speed | 2.5 | 10 | 2.84 ± 0.45 | 10.12 ± 0.44 | 1 ± 0.12 |
| Baseline | 2.5 | 6 | 2.80 ± 0.41 | 6.32 ± 0.8 | 15 ± 0.36 |
| Medium force | 6 | 6 | 6.10 ± 0.49 | 6.04 ± 0.2 | 4 ± 0.18 |
| High force | 10 | 6 | 9.73 ± 0.66 | 6.04 ± 0.2 | 2 ± 0.13 |
Additional files
Download links
A two-part list of links to download the article, or parts of the article, in various formats.
Downloads (link to download the article as PDF)
Open citations (links to open the citations from this article in various online reference manager services)
Cite this article (links to download the citations from this article in formats compatible with various reference manager tools)
Selective recruitment of the cerebellum evidenced by task-dependent gating of inputs
eLife 13:RP96386.
https://doi.org/10.7554/eLife.96386.3


