The human cytomegalovirus-encoded pUS28 antagonizes CD4+ T cell recognition by targeting CIITA
- Institute for Virology, University Hospital Essen, University of Duisburg-Essen, Germany
- Institute for Experimental Cellular Therapy, University Hospital Essen, University of Duisburg-Essen, Germany
- Institute for the Research on HIV and AIDS‐associated Diseases, University Hospital Essen, University of Duisburg-Essen, Germany
- Medizinisches Proteom Center, Ruhr University Bochum, Germany
- Department of Anesthesia, Intensive Care Medicine and Pain Therapy, University Hospital Knappschaftskrankenhaus Bochum, Germany
- Department of Molecular Genetics, University of Toronto, Canada
- German Cancer Consortium (DKTK), partner site Essen/Düsseldorf, Germany
Figures
Figure 1 with 1 supplement
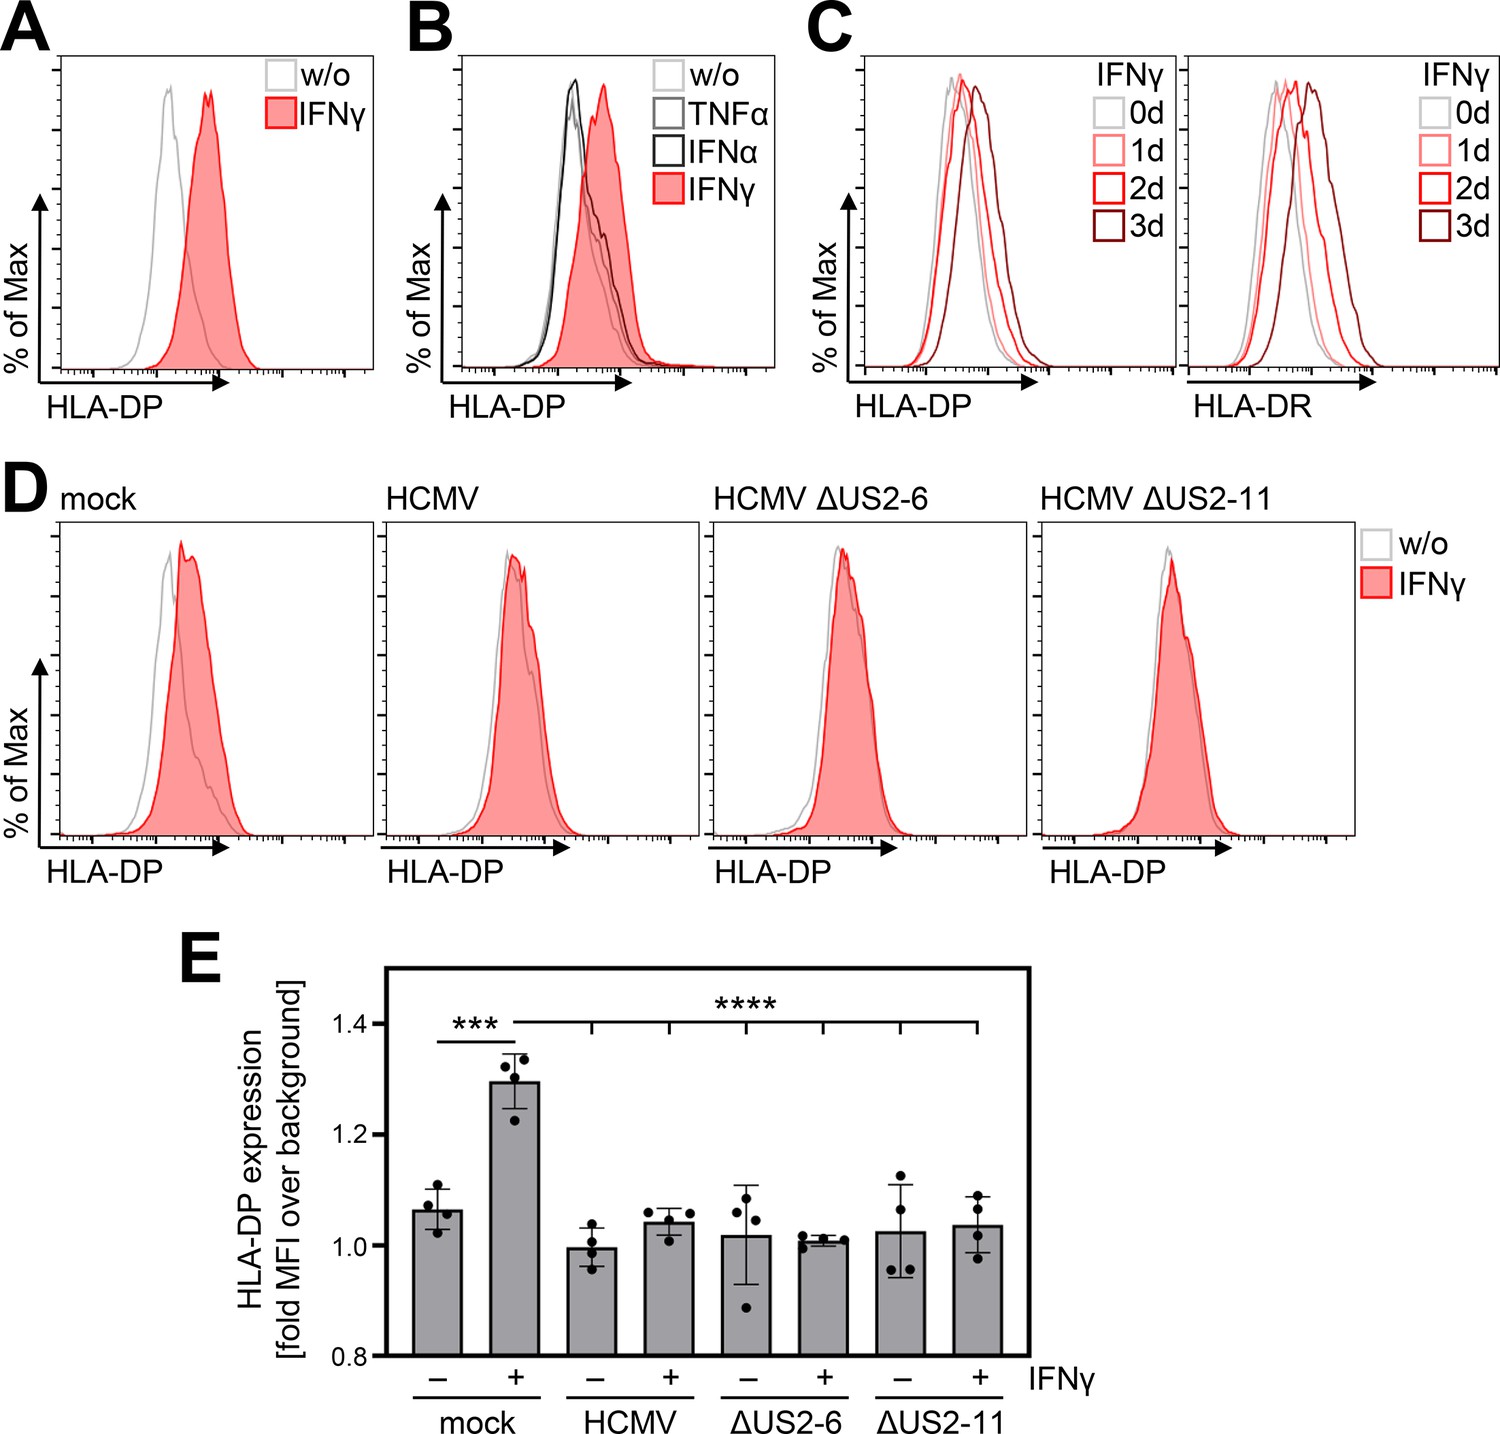
IFNγ-induced human leukocyte antigen (HLA)-DP expression is abrogated in Human cytomegalovirus (HCMV)-infected fibroblasts.
(A) MRC-5 fibroblasts were either left untreated or were treated with 200 U/ml IFNγ. At 72 hr post-treatment, cells were stained with anti-HLA-DP antibody and analyzed by flow cytometry. w/o, untreated. (B) MRC-5 fibroblasts were either left untreated or were treated with 200 U/ml IFNγ, 200 U/ml IFNα, or 20 ng/ml TNFα. At 48 hr post-treatment, cells were stained with anti-HLA-DP antibody and analyzed by flow cytometry. w/o, untreated. (C) MRC-5 fibroblasts were either left untreated or were treated with 200 U/ml IFNγ for 1, 2, or 3 d. Cells were stained with anti-HLA-DP or anti-HLA-DR antibodies and analyzed by flow cytometry. (D) MRC-5 fibroblasts were either mock infected or were infected (MOI 3) with AD169 (HCMV), AD169-BAC2 (HCMVΔUS2-6), or AD169-BAC2ΔUS2-11 (HCMVΔUS2-11). At 4 hr post-infection, cells were treated with 200 U/ml IFNγ. After 48 hr of treatment, cells were stained with anti-HLA-DP antibody and analyzed by flow cytometry. w/o, untreated. (E) The mean fluorescence intensity (MFI) values of HLA-DP expression of untreated or IFNγ-treated MRC-5 cells, mock-treated or infected (as in D) (n=4). Significance was calculated by two-way ANOVA test. Comparisons are shown when statistically significant.
Figure 1—figure supplement 1
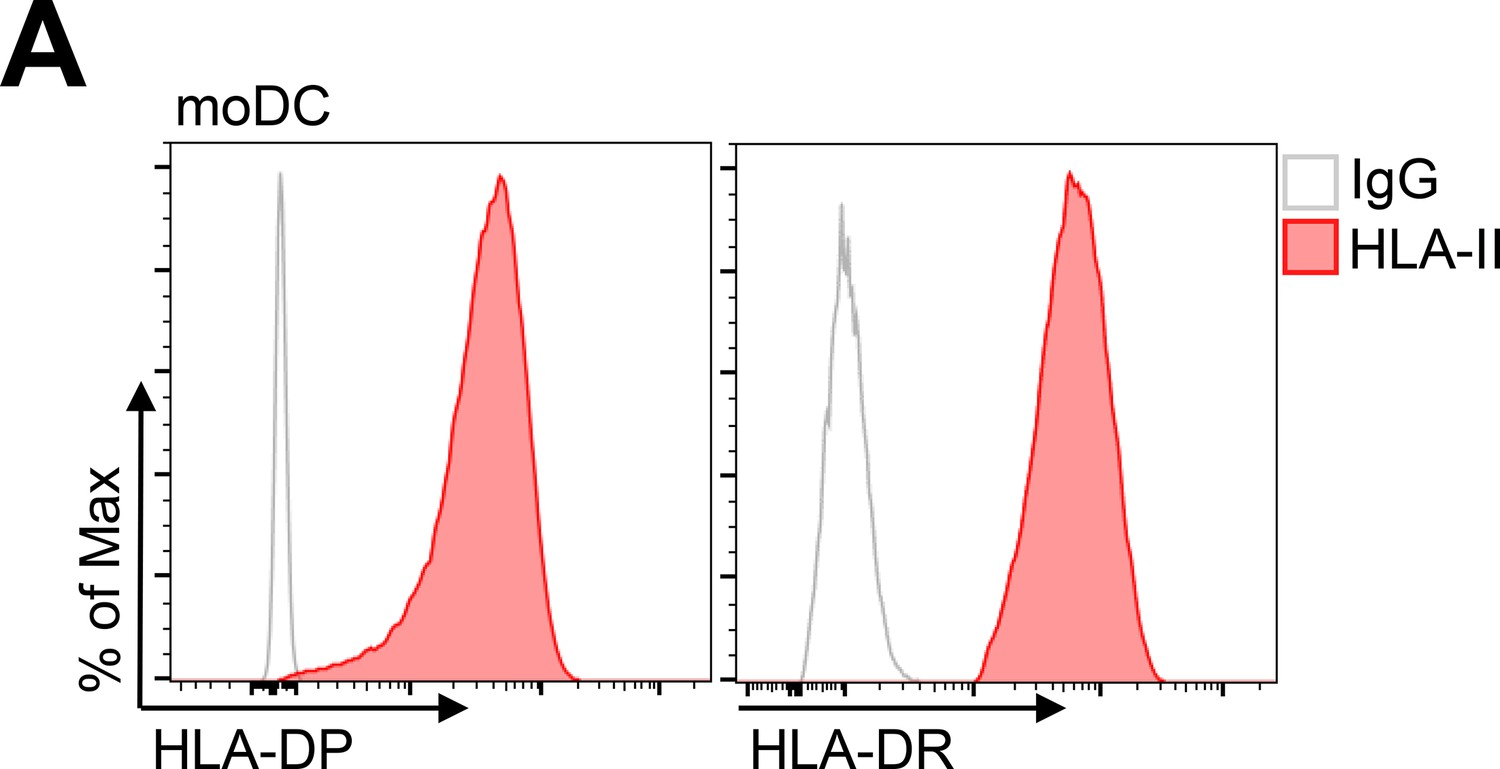
Human leukocyte antigen (HLA)-DP expression of dendritic cells.
(A) Dendritic cells were obtained from maturation of monocytes. Cells were stained with anti-HLA-DP or HLA-DR antibodies and analyzed by flow cytometry.
Figure 2
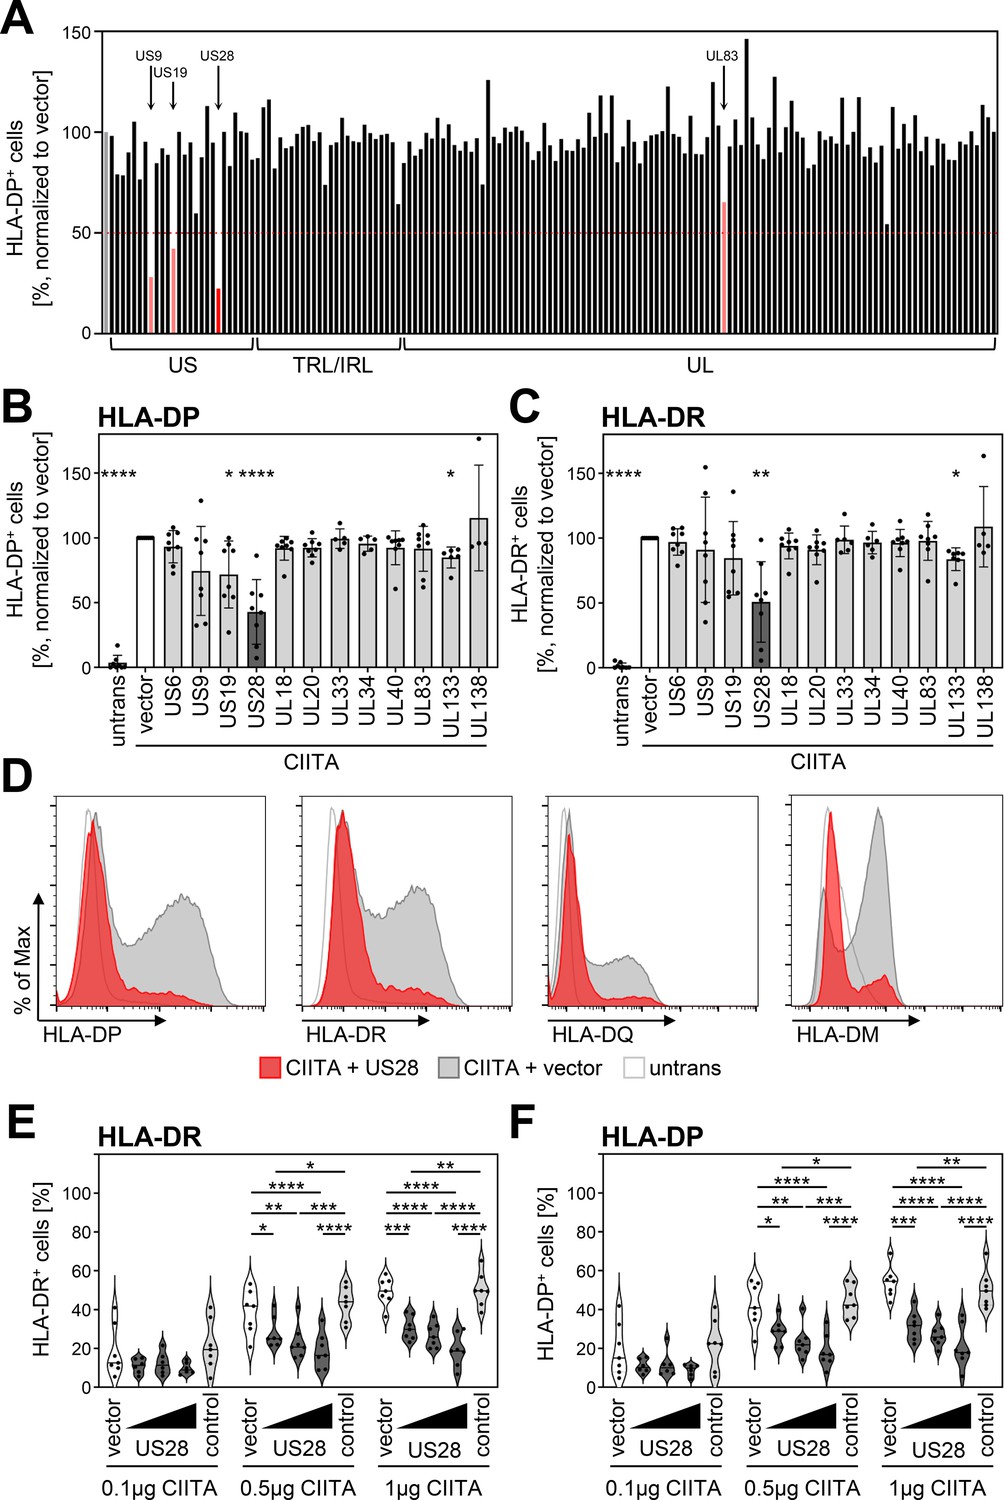
Human cytomegalovirus (HCMV)-pUS28 functions as an antagonist of the class II transactivator (CIITA)-induced human leukocyte antigen (HLA) class II upregulation.
(A) HeLa cells were co-transfected with a CIITA expression construct and a library of single HCMV gene-encoding plasmids or empty vector. At 48 hr post-transfection, cells were stained with anti-HLA-DP antibody and analyzed by flow cytometry. Cell surface expression of HLA-DP was normalized to cells transfected with CIITA expression construct and empty vector. The percentage of HLA-DP-positive cells is shown. (B/C) HeLa cells were co-transfected with a CIITA expression construct and indicated plasmids or empty vector. At 48 hr post-transfection, cells were stained with anti-HLA-DP (B) or anti-HLA-DR (C) antibody and analyzed by flow cytometry. Cell surface expression of HLA class II was normalized to cells transfected with CIITA expression construct and empty vector. The percentage of HLA-DP- or HLA-DR-positive cells is shown (mean values ± SD, n=4–8). Significance was calculated by the Kruskal-Wallis test compared to empty vector control. Comparisons are shown when statistically significant. Untrans, untransfected. Vector, empty vector control. (D) HeLa cells were either left untreated or were co-transfected with a CIITA expression construct and pcDNA:US28-HA or empty vector. At 48 hr post-transfection, cells were stained with anti-HLA-DP, anti-HLA-DR, or anti-HLA-DQ antibody or intracytoplasmic stained with anti-HLA-DM antibody and analyzed by flow cytometry. (E/F) HeLa cells were co-transfected with indicated amounts of CIITA expression construct and increasing doses of pcDNA:US28-HA, a control plasmid (pcDNA:US29-HA), or empty vector. The total DNA amount of each transfection was adjusted to the same level by adding the respective amount of empty vector. At 48 hr post-transfection, cells were stained with anti-HLA-DR (E) and anti-HLA-DP (F) antibodies and analyzed by flow cytometry. The percentage of HLA-DR- and HLA-DP-positive cells is shown (n=5–8). Significance was calculated by two-way ANOVA test. Comparisons are shown when statistically significant. Vector, empty vector control. Control, control plasmid.
Figure 3
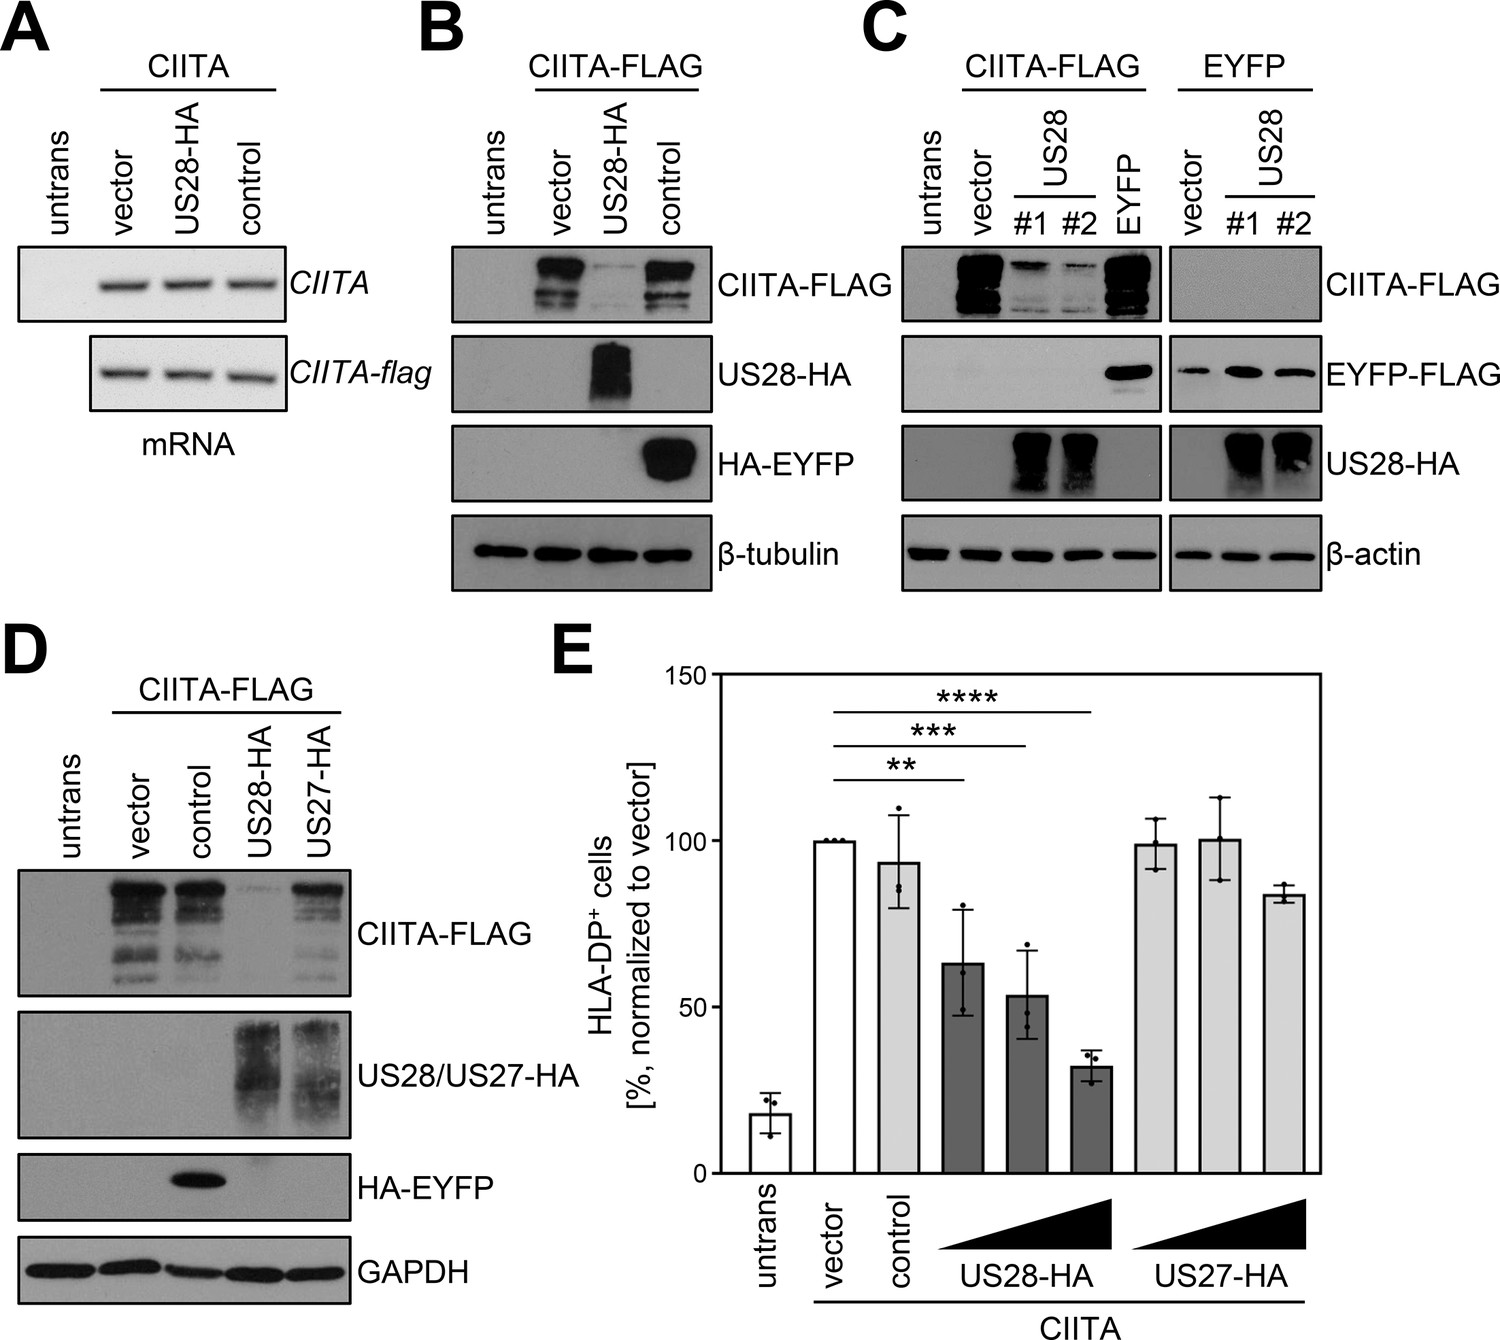
pUS28 downregulates class II transactivator (CIITA) post-transcriptionally.
(A/B) HeLa cells were either left untreated or were co-transfected with CIITA or CIITA-3xFLAG expression constructs and pcDNA:US28-HA, pIRESNeo-FLAG/HA-EYFP (control) or empty vector. At 24 hr post-transfection, cells were harvested and split for preparation of total RNA and protein lysate. RNA samples were used for semi-quantitative RT-PCR with indicated gene-specific primers (A) and protein lysates were analyzed by immunoblot using antibodies detecting the indicated proteins or the respective epitope tags (B). (C) HeLa cells were either left untreated or were co-transfected with the indicated plasmids. At 24 hr post-transfection, protein lysates were generated and analyzed by immunoblot using antibodies detecting the indicated proteins or the respective epitope tags. #1, #2, different plasmid preparations. (D) HeLa cells were either left untreated or were co-transfected with CIITA-3xFLAG expression construct and pcDNA:US28-HA, pcDNA:US27-HA, pIRESNeo-FLAG/HA-EYFP (control) or empty vector. At 24 hr post-transfection, protein lysates were generated and analyzed by immunoblot using antibodies detecting the indicated proteins or the respective epitope tags. (E) HeLa cells were co-transfected with CIITA expression construct and increasing doses of pcDNA:US28-HA or pcDNA:US27-HA, pIRESNeo-FLAG/HA-EYFP (control) or empty vector. The total DNA amount of each transfection was adjusted to the same level by adding the respective amount of empty vector. At 48 hr post-transfection, cells were stained with anti-human leukocyte antigen (HLA)-DP antibody and analyzed by flow cytometry. The percentage of HLA-DP-positive cells normalized to empty vector control is shown (n=3). The different transfection conditions were compared to the control condition (vector) by one-way ANOVA test. Comparisons are shown when statistically significant. Untrans, untransfected. Vector, empty vector control. Control, pIRESNeo-FLAG/HA-EYFP.
-
Figure 3—source data 1
PDF files containing original western blots for Figure 3A-D, indicating the relevant bands and treatments.
- https://cdn.elifesciences.org/articles/96414/elife-96414-fig3-data1-v1.zip
-
Figure 3—source data 2
Original files for western blot analysis displayed in Figure 3A-D.
- https://cdn.elifesciences.org/articles/96414/elife-96414-fig3-data2-v1.zip
Figure 4 with 1 supplement
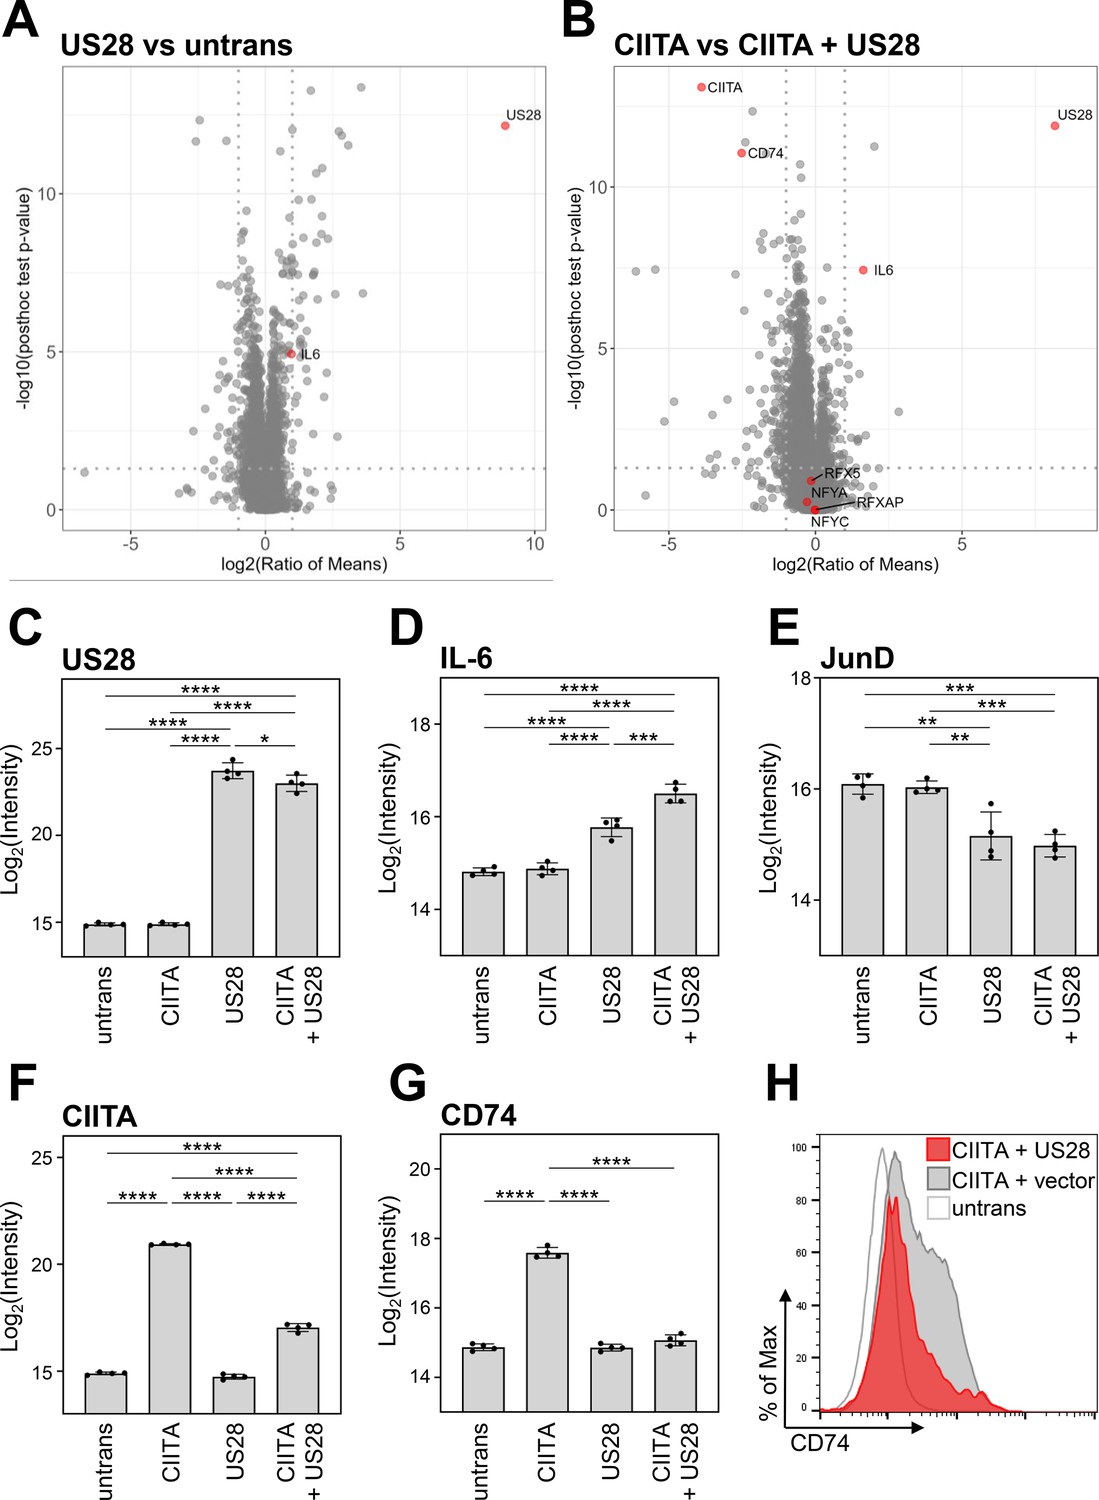
Global proteome analysis revealed that pUS28 targets class II transactivator (CIITA) and affects the CIITA-regulated protein CD74.
(A/B) HeLa cells were either left untreated or were transfected with CIITA-3xFLAG expression construct, pcDNA:US28-HA, or both. At 24 hr post-transfection, whole cell lysates were generated and subjected to mass spectrometric analysis of protein abundance. Volcano plots showing log2 (ratio of means) (x-axis) versus significance (y-axis) of the comparison of untreated and pUS28-expressing cells (A) or cells expressing CIITA in the presence or absence of pUS28 (B). Proteins are indicated as gray dots, highlighted in red are IL-6 (known to be upregulated by pUS28), co-factors of HLA-II transcription and signaling, CIITA, and pUS28. (C–G) Changes in the abundance of selected proteins detected by MS: (C) pUS28, (D) IL-6, (E) JunD, (F) CIITA, (G) CD74. Depicted are log2 (intensity) values of untreated cells, cells expressing either CIITA, pUS28, or both (n=4). Significance was calculated by one-way ANOVA test. Comparisons are shown when statistically significant. (H) HeLa cells were either left untreated or were co-transfected with a CIITA expression construct and pcDNA:US28-HA or empty vector. At 48 hr post-transfection, cells were stained with anti-CD74 antibody and analyzed by flow cytometry. Untrans, untransfected. Vector, empty vector control.
Figure 4—figure supplement 1
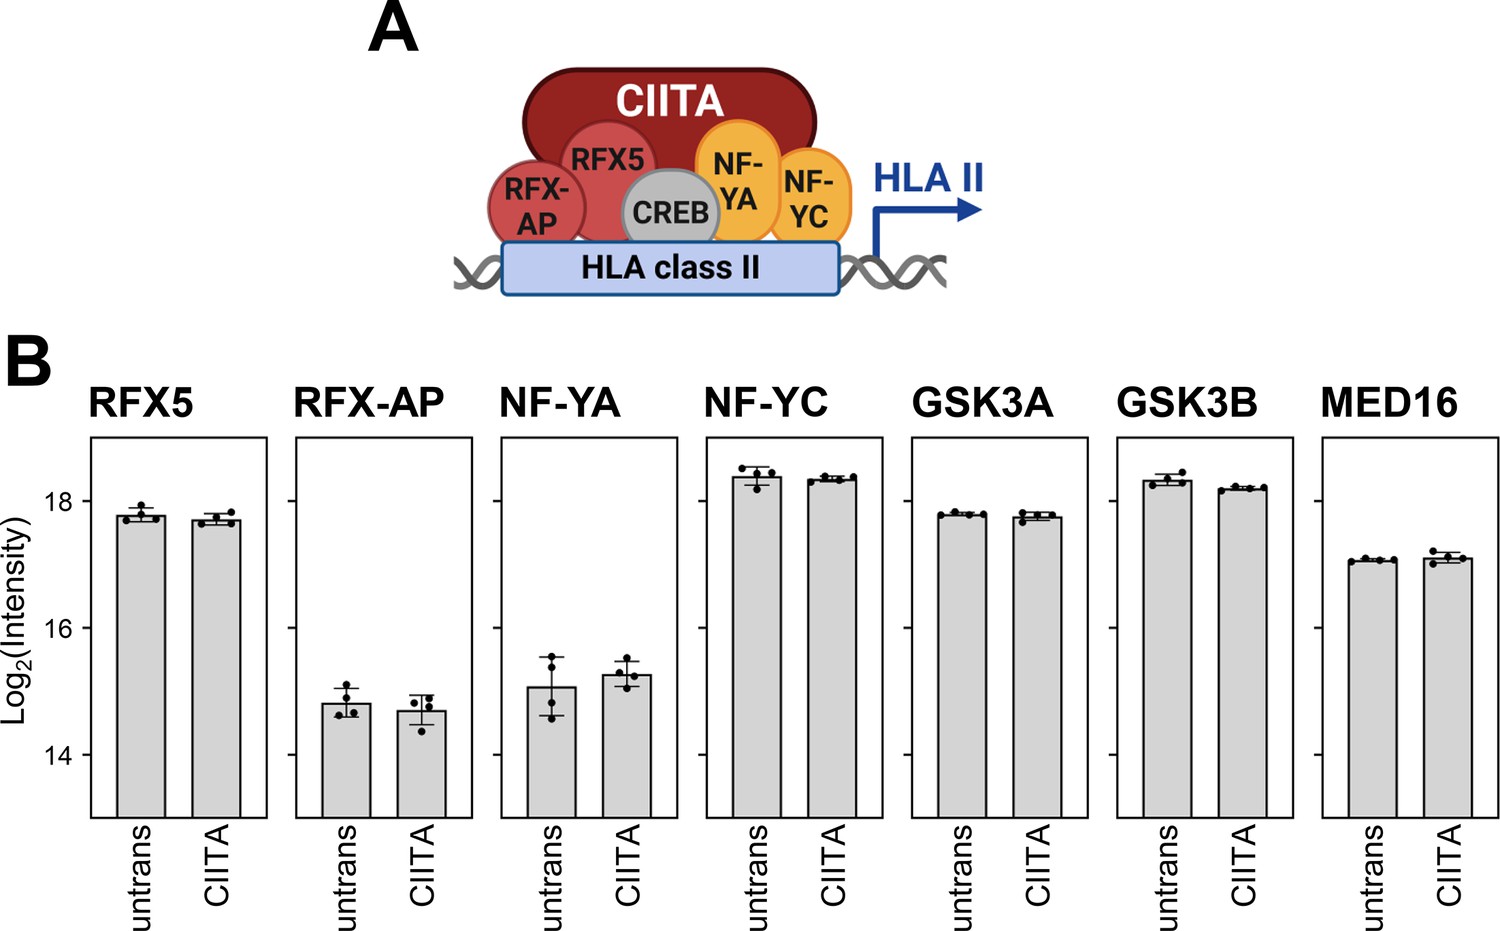
Global proteome analysis showed that the other components of the CIITA enhanceosome and recently described regulators of HLA-II transcription are constitutively expressed.
(A) Simplified schema of the CIITA enhanceosome. This panel was created using BioRender.com. (B) Changes in the abundance of selected proteins measured by MS: RFX5, RFX-AP, NF-YA, NF-YC, GSK3A, GSK3B, MED16 as log2 (intensity) values of untreated cells or cells expressing CIITA (n=4). Significance was calculated by one-way ANOVA test. Comparisons are shown when statistically significant.
Figure 5
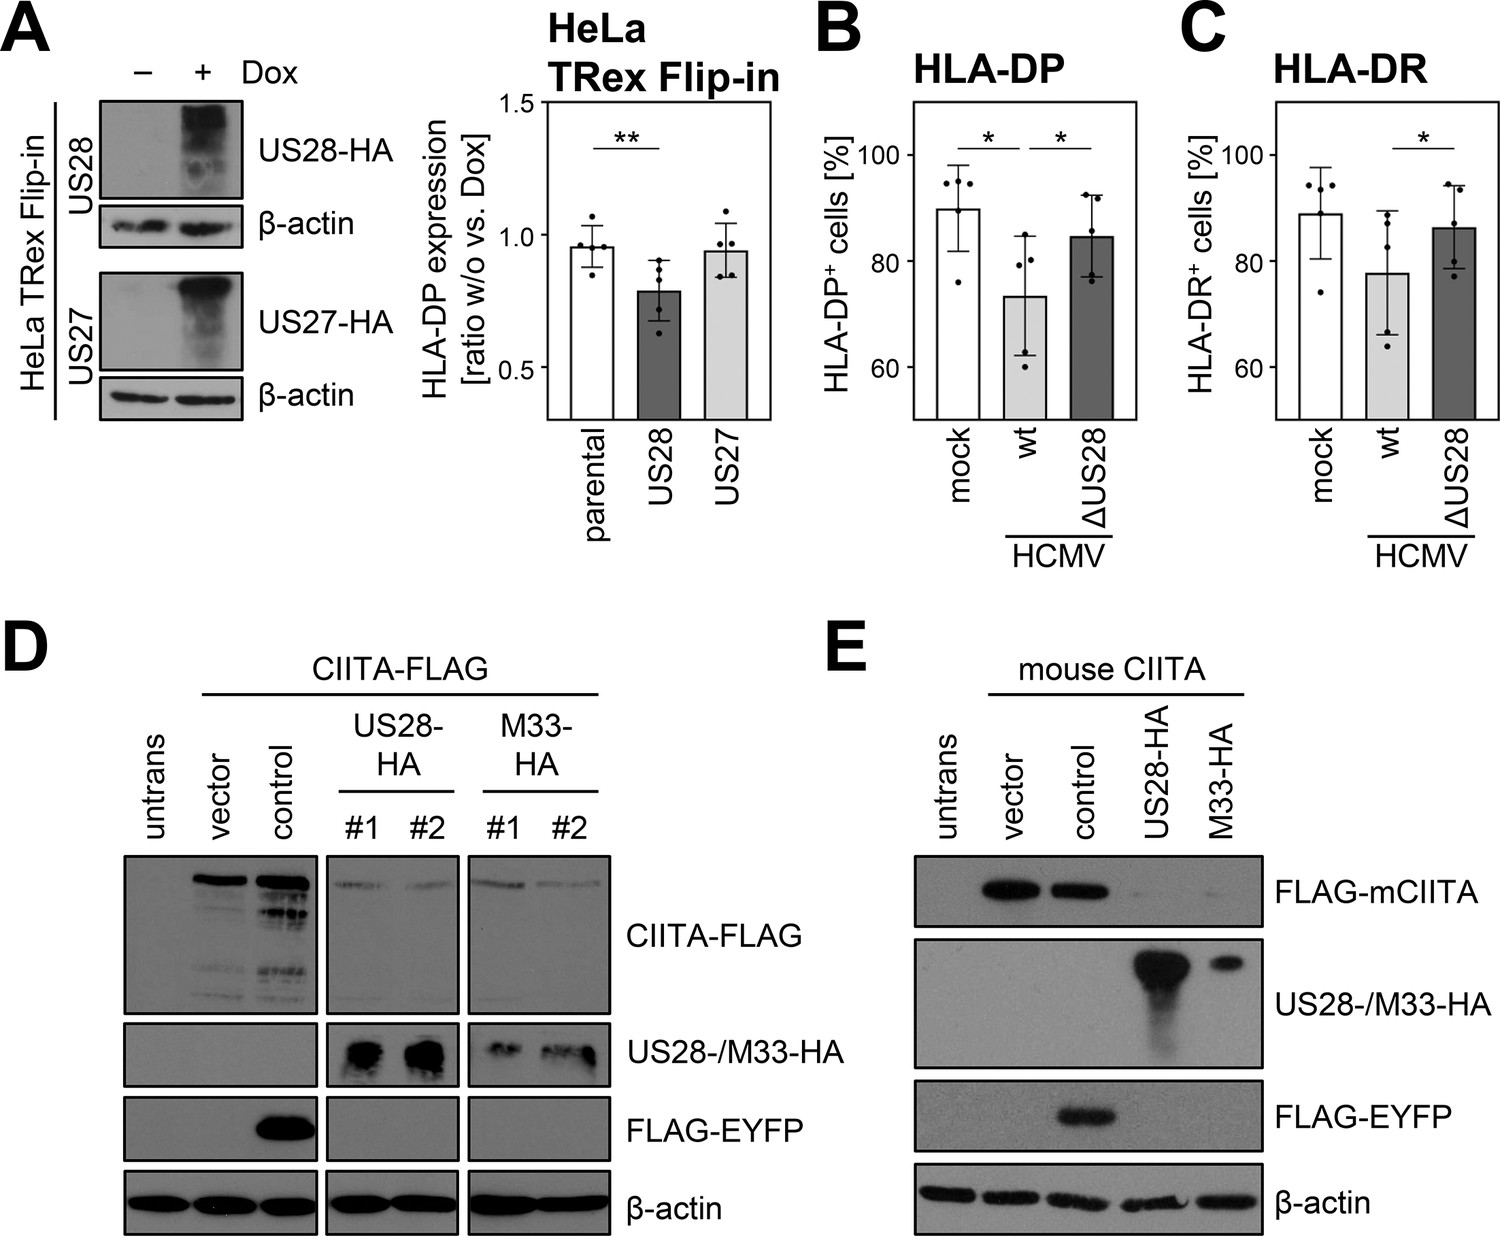
The ability of pUS28 to decrease human leukocyte antigen (HLA) class II expression is evolutionary conserved and evident in loss-of-function as well as gain-of-function experiments.
(A) HeLa TRex Flip-in:US28HA (US28) and HeLa TRex Flip-in:US27HA (US27) cells were either treated with 200 µg/ml doxycycline or left untreated. At 24 hr after treatment, protein lysates were generated and analyzed by immunoblot using antibodies detecting the indicated proteins or the respective epitope tags. Furthermore, HeLa TRex Flip-in (parental), HeLa TRex Flip-in:US28HA (US28), and HeLa TRex Flip-in:US27HA (US27) were either treated with 200 U/ml IFNγ or a combination of 200 µg/ml doxycycline and 200 U/ml IFNγ. After 48 hr of treatment, cells were stained with anti-HLA-DP antibody and analyzed by flow cytometry. The fold induction of the mean fluorescence intensity (MFI) values of HLA-DP expression of cells in presence compared to absence of doxycycline treatment (taking the change over background into account) are shown (n=5). Significance was calculated by one-way ANOVA test. Comparisons are shown when statistically significant. (B/C) UoC-B6 cells were either mock infected or were infected (MOI 3) with AD169-BAC2-UL131rep (wt) or AD169-BAC2-UL131repΔUS28 (ΔUS28). At 2 hr post-infection, medium change was performed. At 3 d post-infection, cells were stained with anti-HLA-DP and anti-HLA-DR antibodies and analyzed by flow cytometry. The percentage of HLA-DP- (B) and HLA-DR-positive (C) cells is shown (n=5). Significance was calculated by RM one-way ANOVA test. Comparisons are shown when statistically significant. (D) HeLa cells were either left untreated or were co-transfected with CIITA-3xFLAG expression construct and pcDNA:US28-HA, pcDNA:M33-HA, pIRESNeo-FLAG/HA-EYFP (control) or empty vector pcDNA3.1. At 24 hr post-transfection, protein lysates were generated and analyzed by immunoblot using antibodies detecting the indicated proteins or the respective epitope tags. #1, #2, different plasmid preparations. (E) HeLa cells were either left untreated or were co-transfected with 3xFLAG-mouseCIITA expression construct and pcDNA:US28-HA, pcDNA:M33-HA, pIRESNeo-FLAG/HA-EYFP (control) or empty vector. At 24 hr post-transfection, protein lysates were prepared and analyzed by immunoblot using antibodies detecting the indicated proteins or the respective epitope tags.
-
Figure 5—source data 1
PDF files containing original western blots for Figure 5A, D and E, indicating the relevant bands and treatments.
- https://cdn.elifesciences.org/articles/96414/elife-96414-fig5-data1-v1.zip
-
Figure 5—source data 2
Original files for western blot analysis displayed in Figure 5A, D and E.
- https://cdn.elifesciences.org/articles/96414/elife-96414-fig5-data2-v1.zip
Figure 6 with 4 supplements
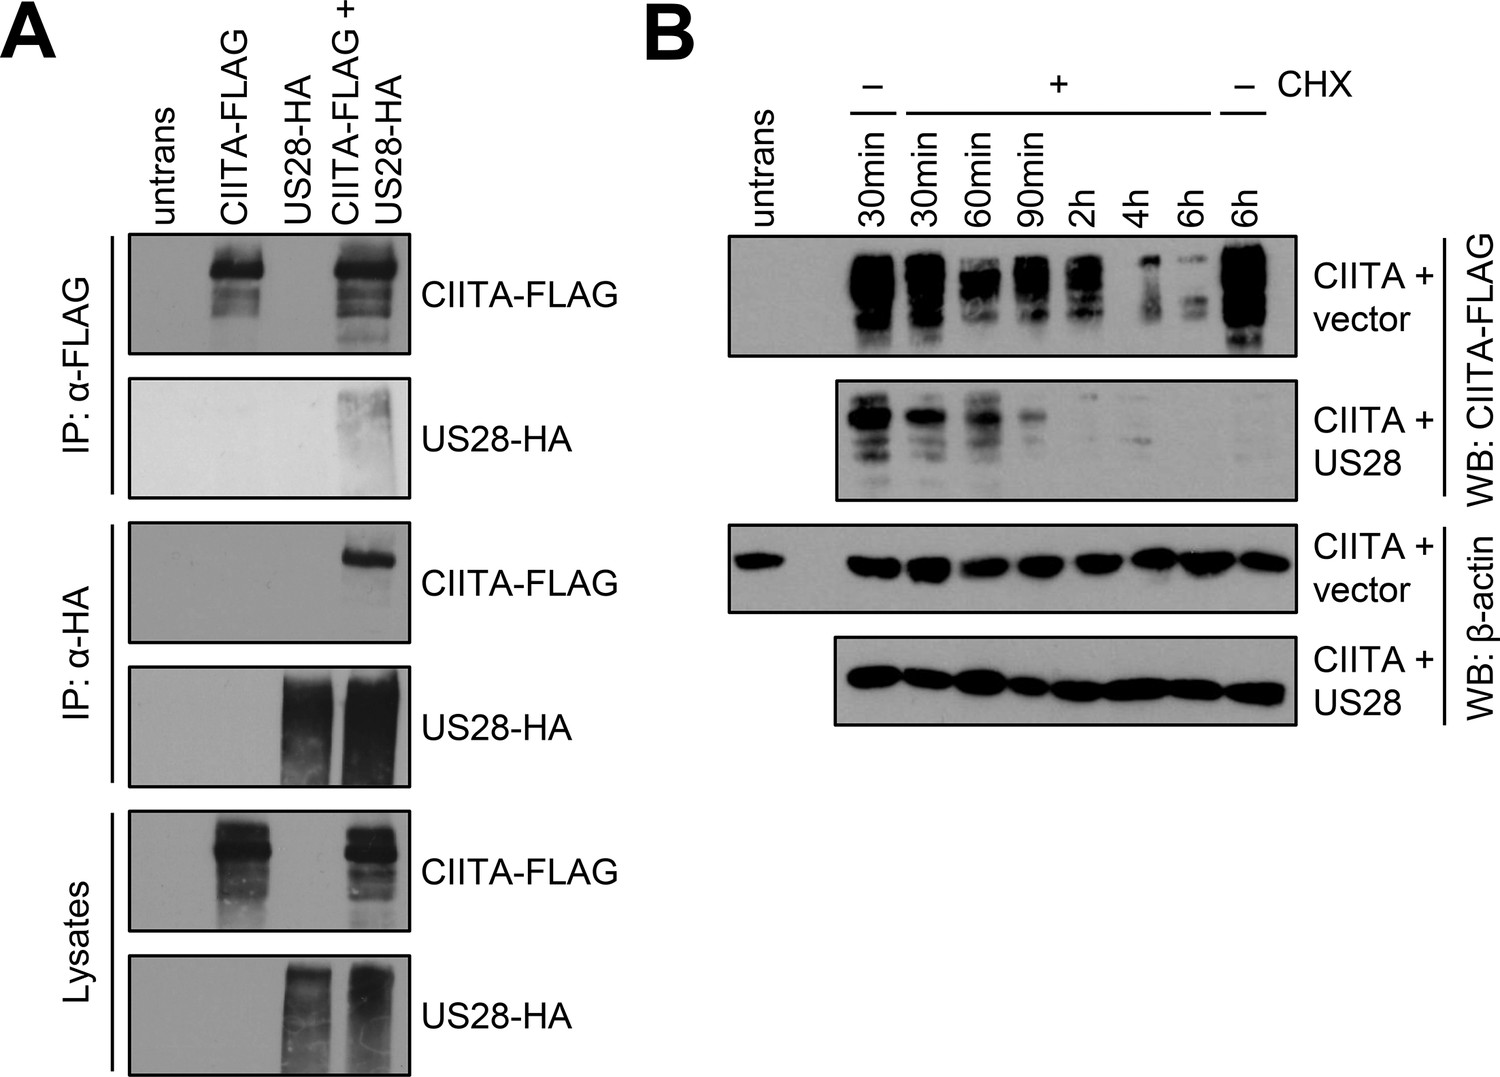
pUS28 physically interacts with class II transactivator (CIITA) and reduces its half-life.
(A) HeLa cells were either left untreated or were transfected with CIITA-3xFLAG expression construct or pcDNA:US28-HA. At 24 hr post-transfection, protein lysates were generated and an IP with HA- or FLAG-specific mouse monoclonal antibodies was performed either with unmodified samples or with mixed samples of CIITA- and US28-transfected cells. The lysates and IP samples were analyzed by immunoblot to test CIITA and pUS28 co-precipitation. (B) HeLa cells were co-transfected with CIITA-3xFLAG expression construct and pcDNA:US28-HA or empty vector. At 16 hr post-transfection, cells either were left untreated or were incubated with 50 µg/ml cycloheximide (CHX) for indicated periods. Protein lysates were generated and analyzed by immunoblot using antibodies detecting the indicated proteins or the respective epitope tags. All samples were run on one gel and detected on the same membrane (Figure 5). For better comparison, US28 samples were presented underneath the empty vector samples.
-
Figure 6—source data 1
PDF files containing original western blots for Figure 6A-B, indicating the relevant bands and treatments.
- https://cdn.elifesciences.org/articles/96414/elife-96414-fig6-data1-v1.zip
-
Figure 6—source data 2
Original files for western blot analysis displayed in Figure 6A-B.
- https://cdn.elifesciences.org/articles/96414/elife-96414-fig6-data2-v1.zip
Figure 6—figure supplement 1
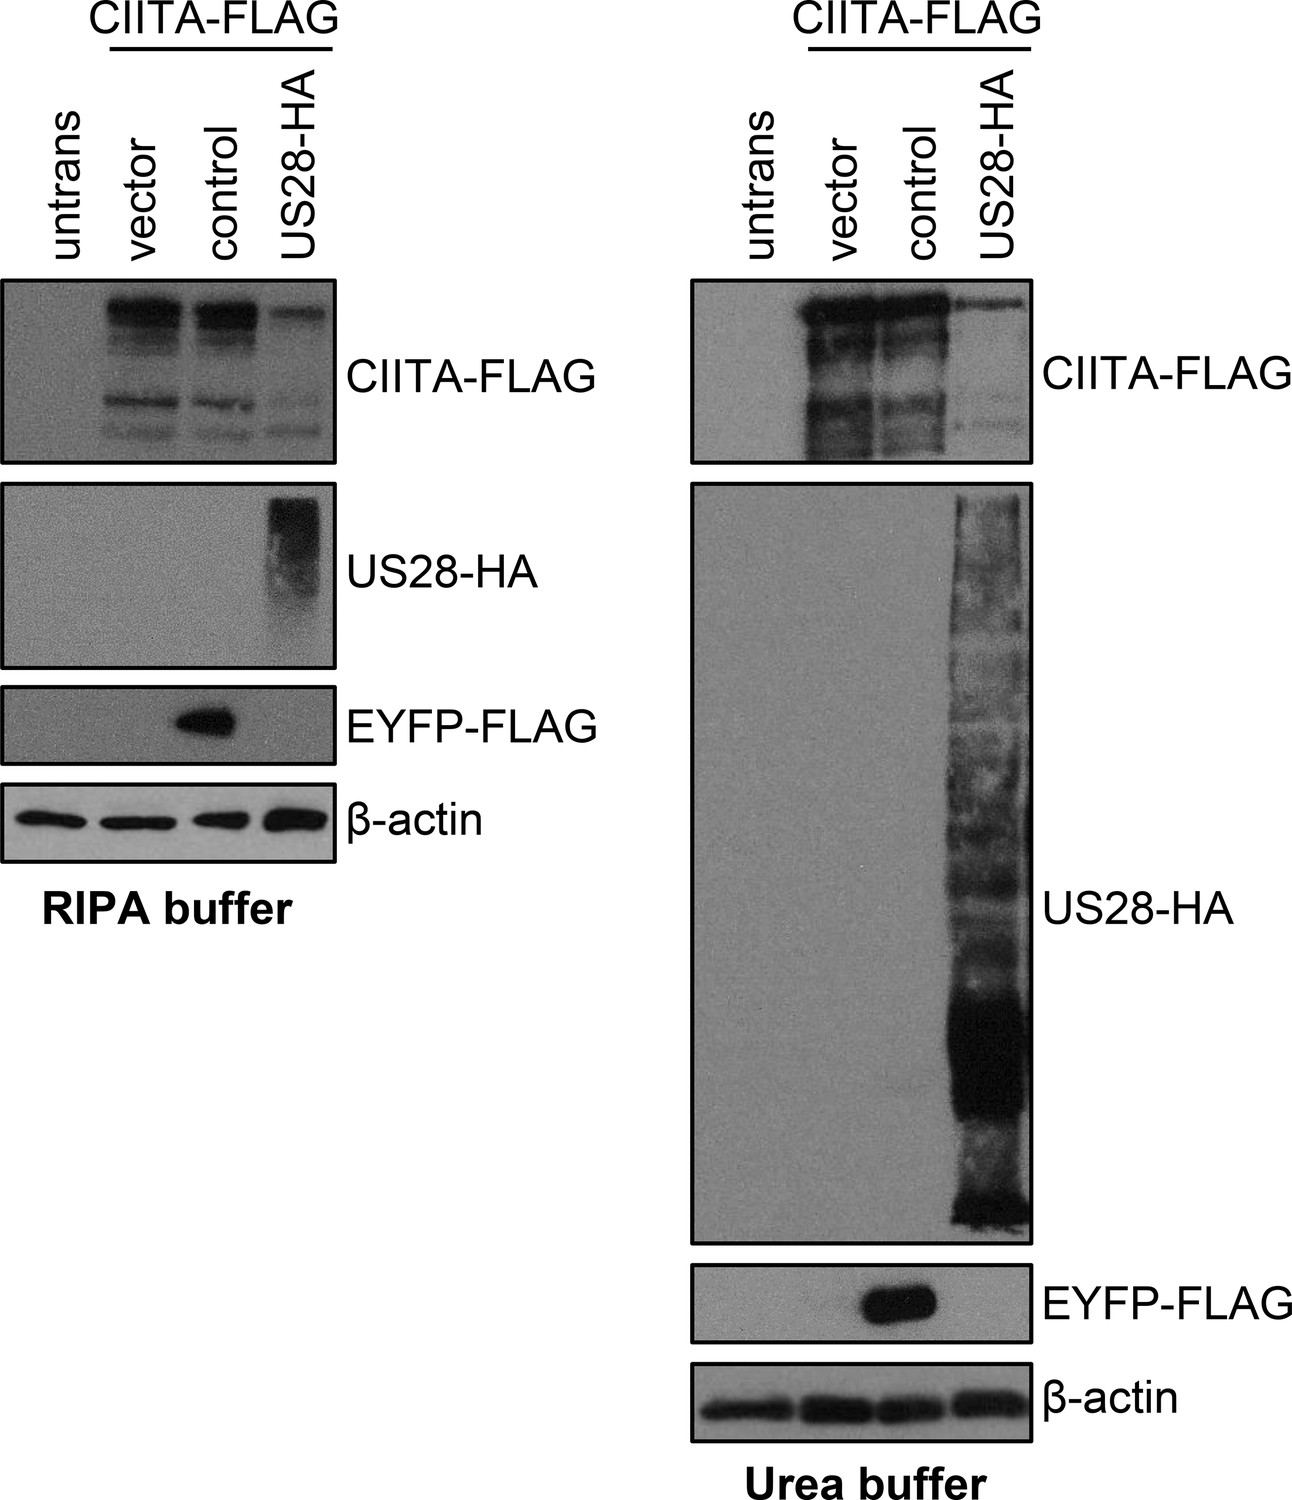
pUS28 diminishes class II transactivator (CIITA) protein levels also in denaturing lysis buffer.
HeLa cells were either left untreated or were co-transfected with CIITA-3xFLAG expression construct and pcDNA:US28-HA, pIRESNeo-FLAG/HA-EYFP (control) or empty vector. At 24 hr post-transfection, protein lysates were prepared in RIPA (A) or denaturing lysis buffer based on 5 M urea (B) and analyzed by immunoblot using antibodies detecting the indicated proteins or the respective epitope tags.
-
Figure 6—figure supplement 1—source data 1
PDF files containing original western blots for Figure 6—figure supplement 1, indicating the relevant bands and treatment.
- https://cdn.elifesciences.org/articles/96414/elife-96414-fig6-figsupp1-data1-v1.zip
-
Figure 6—figure supplement 1—source data 2
Original files for western blot analysis displayed in Figure 6—figure supplement 1.
- https://cdn.elifesciences.org/articles/96414/elife-96414-fig6-figsupp1-data2-v1.zip
Figure 6—figure supplement 2
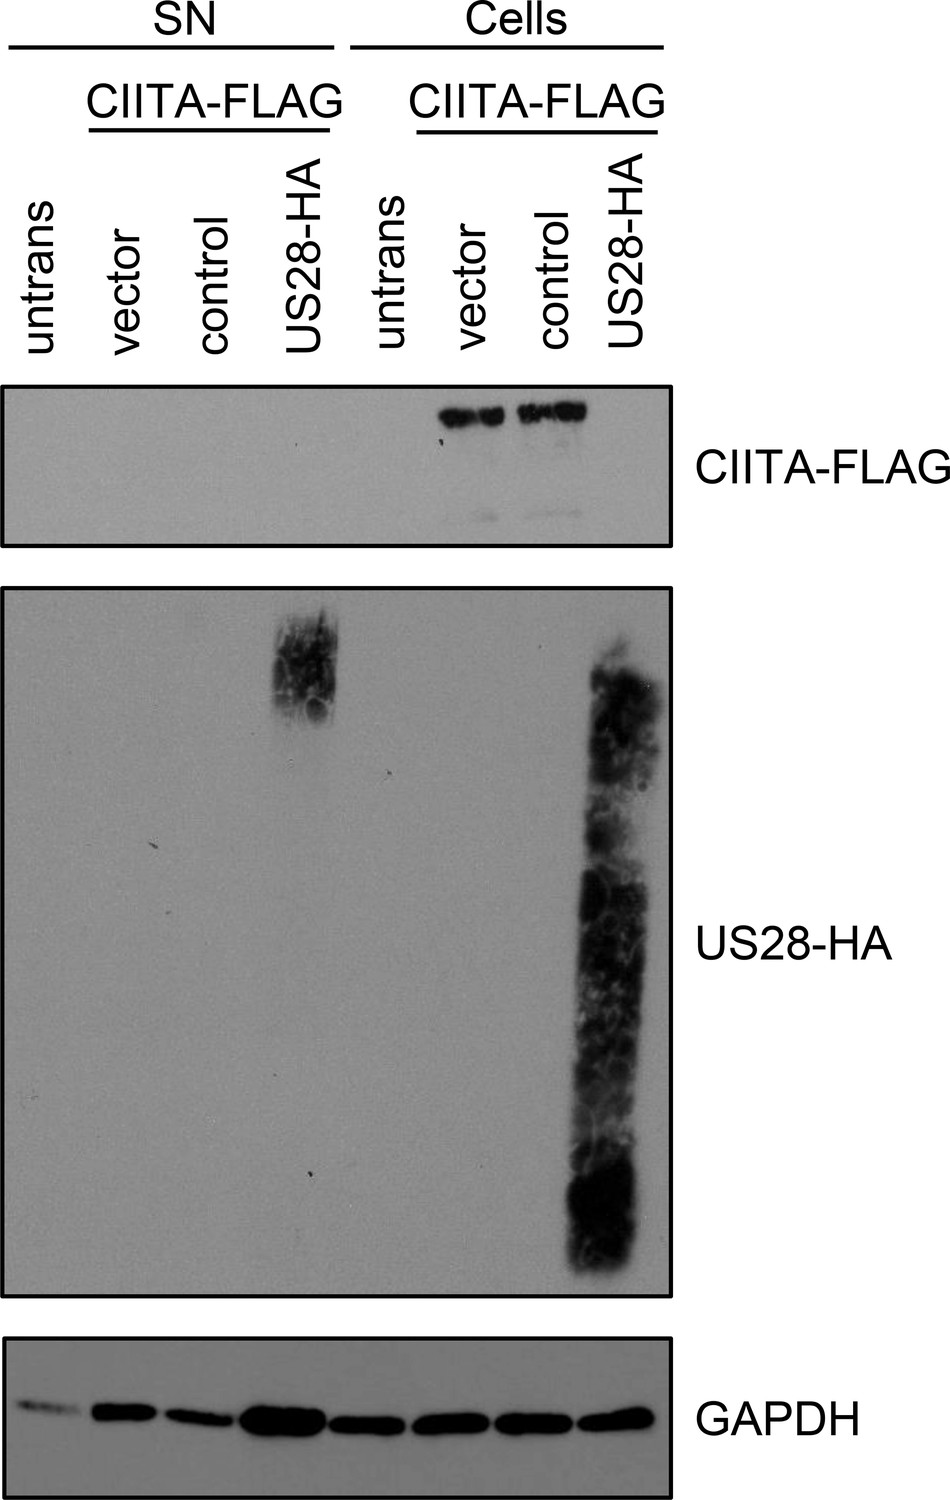
The loss of class II transactivator (CIITA) in pUS28-expressing cells is not caused by CIITA shedding as indicated by its absence in cell supernatants.
HeLa cells were either left untreated or were co-transfected with CIITA-3xFLAG expression construct and pcDNA:US28-HA, empty vector, or pIRESNeo-FLAG/HA-EYFP (control). At 24 hr post-transfection, protein lysates from transfected cells were prepared and proteins from the supernatant derived from aforementioned cells were precipitated. Protein amounts were analyzed by immunoblot using antibodies recognizing the indicated proteins or the respective epitope tags.
-
Figure 6—figure supplement 2—source data 1
PDF files containing original western blots for Figure 6—figure supplement 2, indicating the relevant bands and treatments.
- https://cdn.elifesciences.org/articles/96414/elife-96414-fig6-figsupp2-data1-v1.zip
-
Figure 6—figure supplement 2—source data 2
Original files for western blot analysis displayed in Figure 6—figure supplement 2.
- https://cdn.elifesciences.org/articles/96414/elife-96414-fig6-figsupp2-data2-v1.zip
Figure 6—figure supplement 3
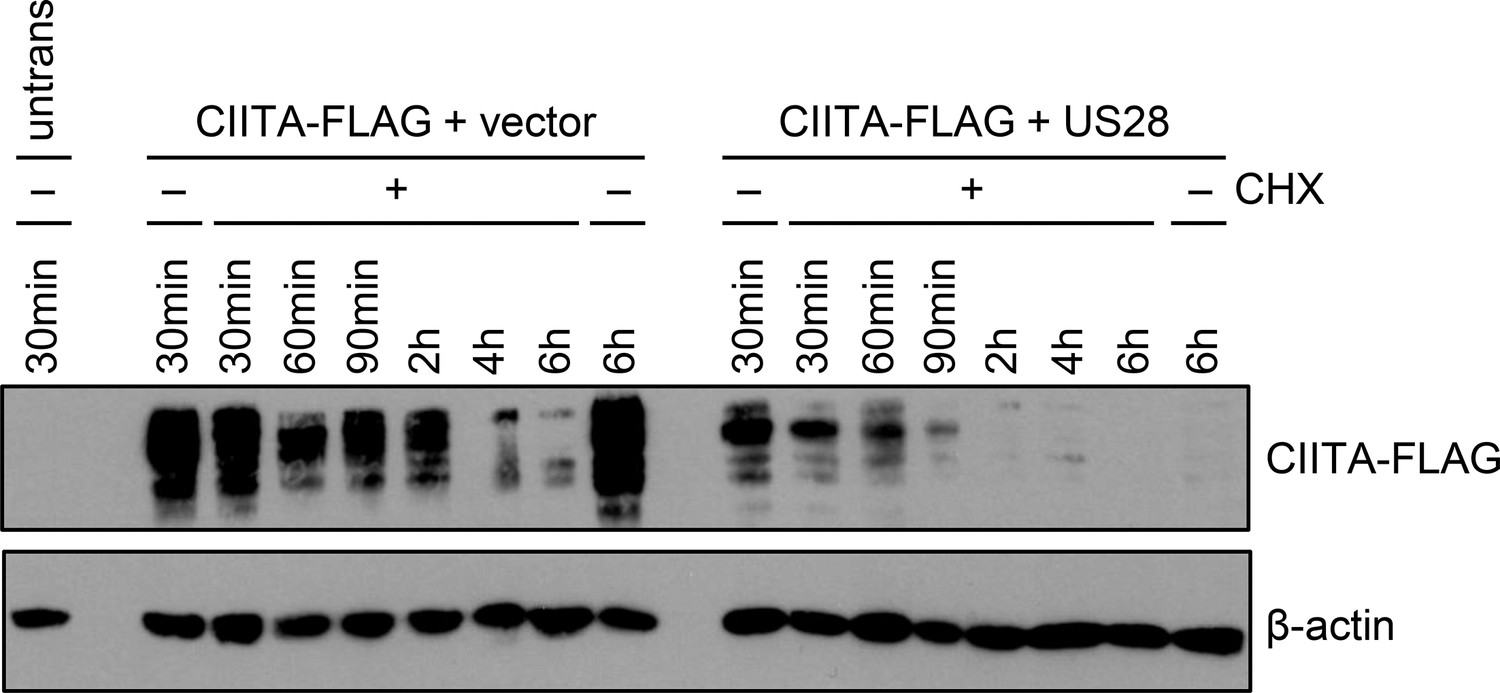
pUS28 reduces the half-life of class II transactivator (CIITA).
Related to Figure 6B, uncropped gel. HeLa cells were co-transfected with CIITA-3xFLAG expression construct and pcDNA:US28-HA or empty vector. At 16 hr post-transfection, cells either were left untreated or were incubated with 50 µg/ml cycloheximide (CHX) for indicated periods. Protein lysates were generated and analyzed by immunoblot using antibodies detecting the indicated proteins or the respective epitope tags.
Figure 6—figure supplement 4
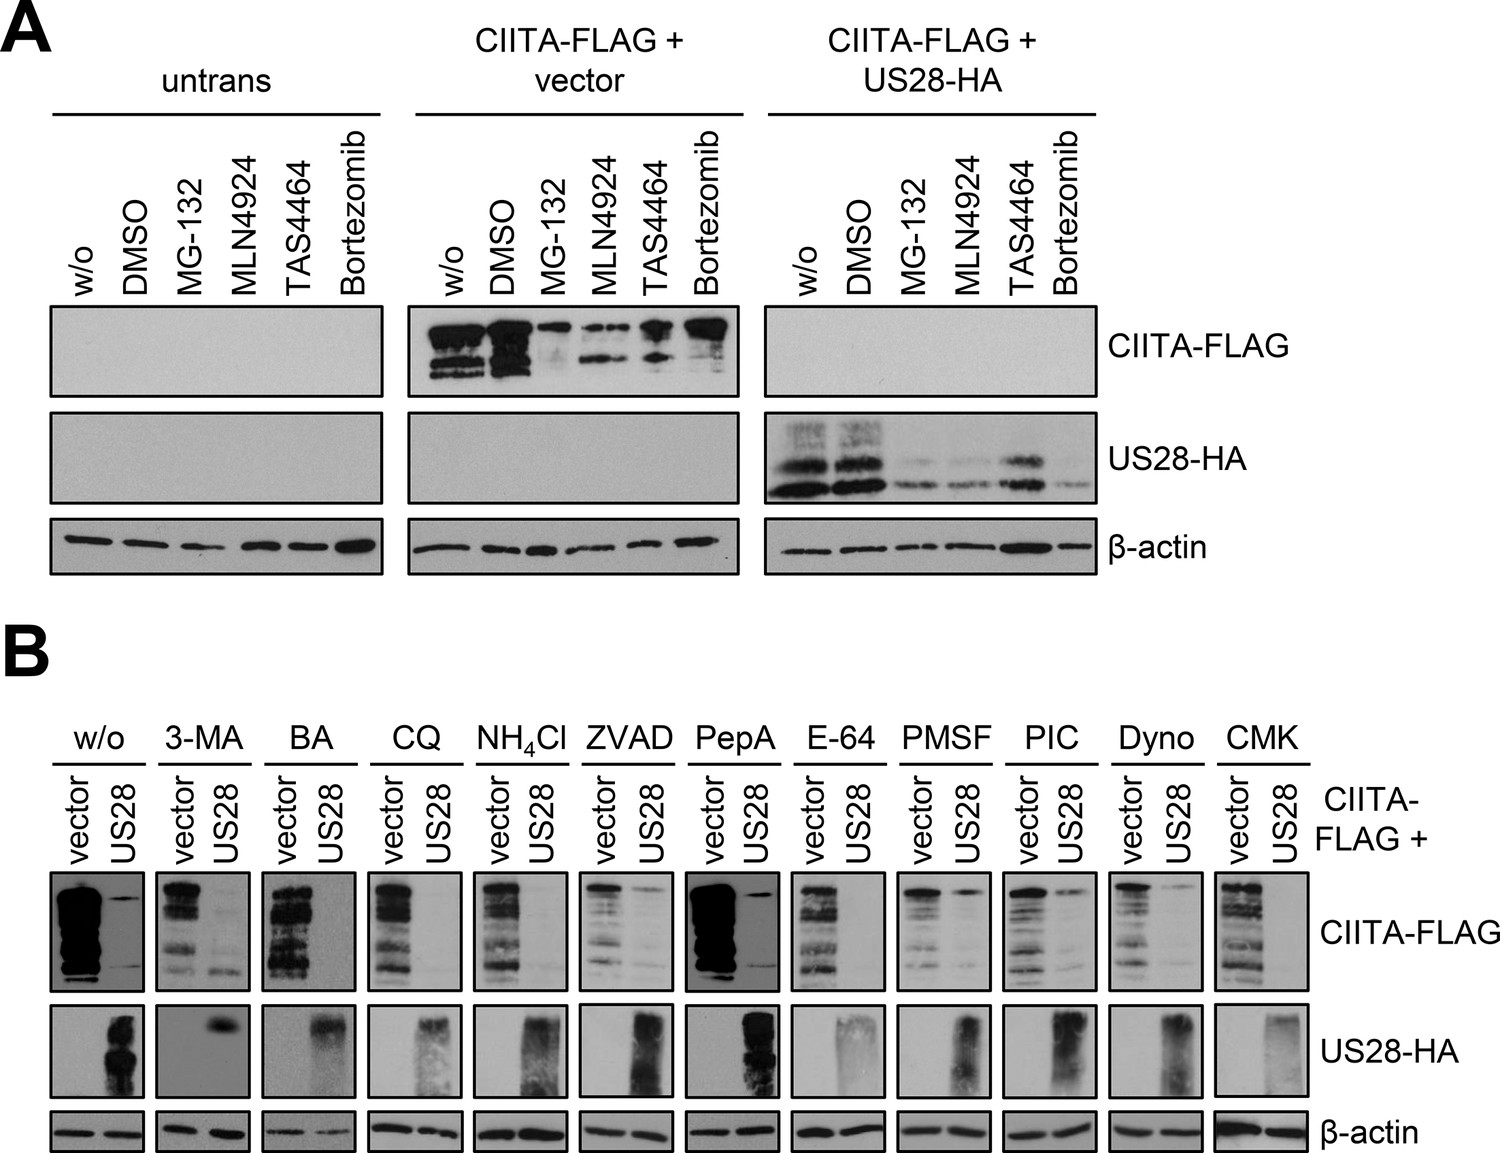
Inhibition of the usual protein degradation pathways does not restore class II transactivator (CIITA) protein levels in the presence of pUS28.
(A/B) Cells were either left untransfected or were co-transfected with CIITA-3xFLAG expression construct and pcDNA:US28-HA or empty vector. At 16 hr post-transfection, cells were either left untreated (w/o) or were treated with MG-132 (10 µM), MLN4924 (2.5 µM), TAS4464 (1 µM), Bortezomib (1 µM), 3-methyladenine (10 mM, 3-MA), Bafilomycin (1 µM, BA), Chloroquine (50 µM, CQ), ammonium chloride (5 mM, NH4Cl), Z-VAD-FMK (50 µM, ZVAD), Pepstatin A (10 µM, PepA), E-64 (5 µM), PMSF (1 mM), pan-protease inhibitor cocktail (1:200, PIC), Dynasore (100 µM, Dyno), or Decanoyl-RVKR-CMK (10 µM, CMK). At 6 hr post-treatment start, protein lysates were prepared and analyzed by immunoblot. Untrans, untransfected. Vector, empty vector control.
-
Figure 6—figure supplement 4—source data 1
PDF files containing original western blots for Figure 6—figure supplement 4, indicating the relevant bands and treatments.
- https://cdn.elifesciences.org/articles/96414/elife-96414-fig6-figsupp4-data1-v1.zip
-
Figure 6—figure supplement 4—source data 2
Original files for western blot analysis displayed in Figure 6—figure supplement 4.
- https://cdn.elifesciences.org/articles/96414/elife-96414-fig6-figsupp4-data2-v1.zip
Figure 7
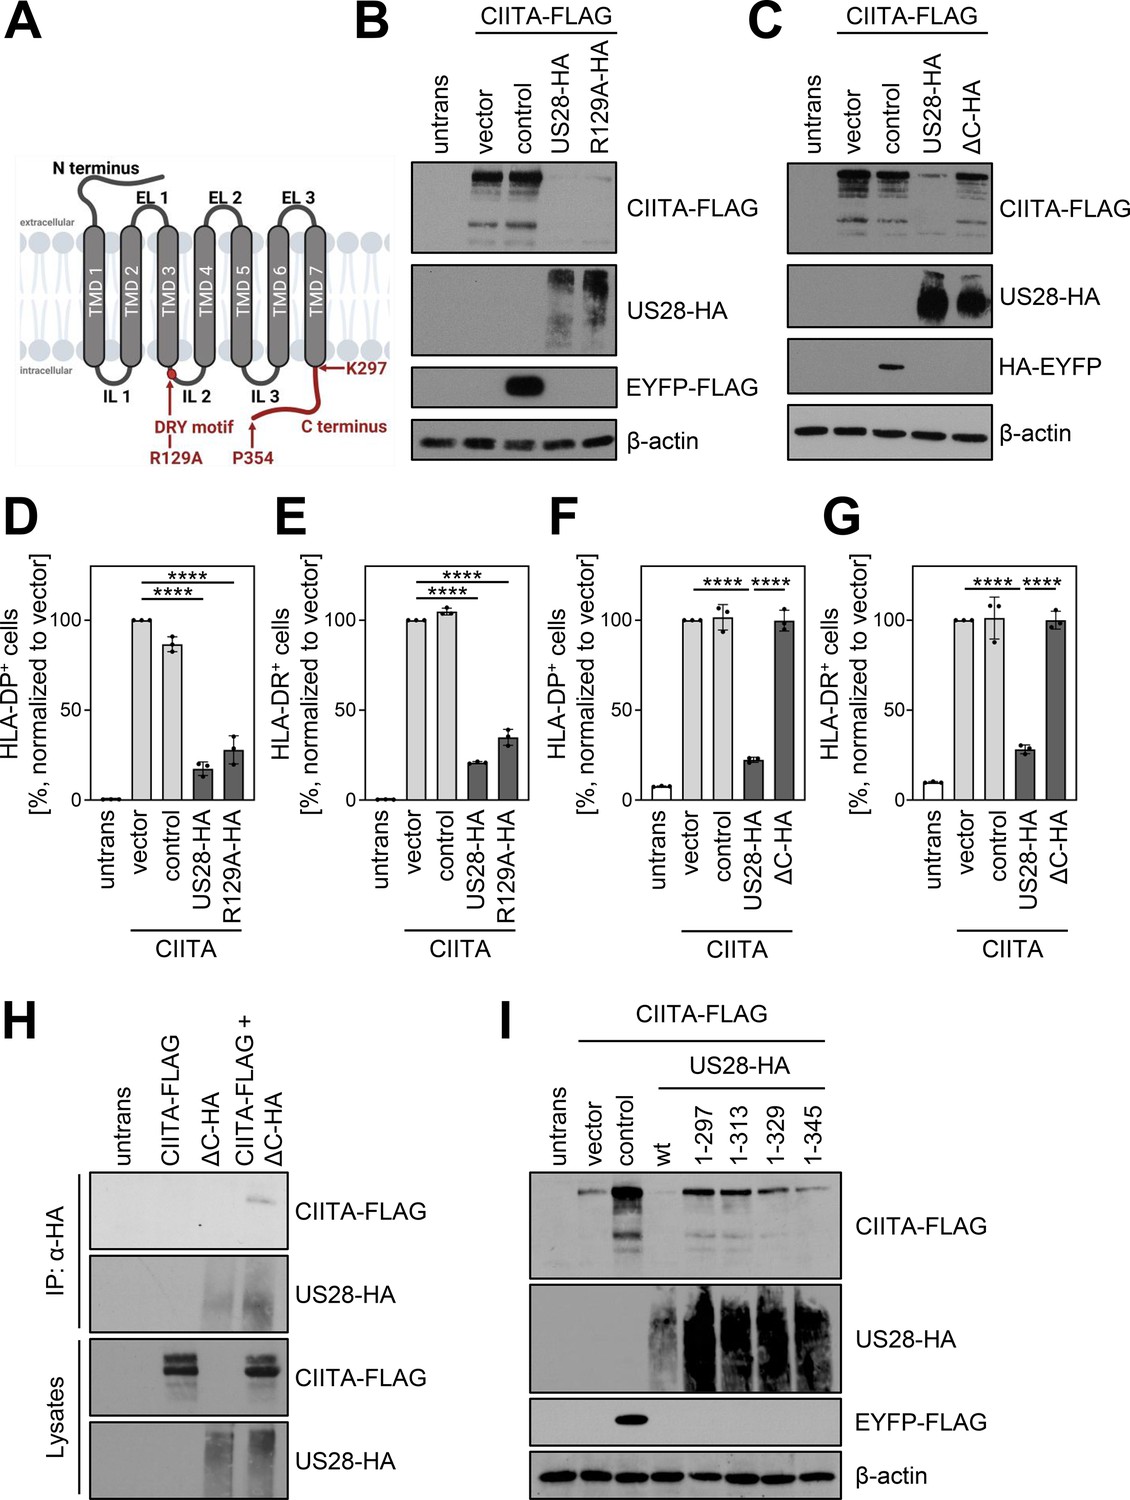
pUS28 targeting class II transactivator (CIITA) is independent of the G-protein coupling capacity but requires the C terminus of pUS28.
(A) Schematic overview of the structure of pUS28. All structural parts of the protein and the DRY motif are indicated. Mutation of the arginine in this motif to alanine (R129A) ablates G-protein coupling. This panel was created using BioRender.com. (B) HeLa cells were either left untreated or were co-transfected with CIITA-3xFLAG expression construct and pcDNA:US28-HA, pcDNA:US28-R129A-HA, pIRESNeo-FLAG/HA-EYFP, or empty vector. At 24 hr post-transfection, protein lysates were generated and analyzed by immunoblot using antibodies detecting the indicated proteins or the respective epitope tags. (C) HeLa cells were either left untreated or were co-transfected with CIITA-3xFLAG expression construct and pcDNA:US28-HA, pcDNA:US28-ΔC-HA, pIRESNeo-FLAG/HA-EYFP (control) or empty vector. At 24 hr post-transfection, protein lysates were generated and analyzed by immunoblot using antibodies detecting the indicated proteins or the respective epitope tags. (D/E) HeLa cells were either left untreated or were co-transfected with CIITA expression construct and pcDNA:US28-HA, pcDNA:US28-R129A-HA, pIRESNeo-FLAG/HA-EYFP (control) or empty vector. At 48 hr post-transfection, cells were stained with anti-HLA-DP (D) or anti-HLA-DR (E) antibodies and analyzed by flow cytometry. Cell surface expression of HLA-DP or HLA-DR was normalized to cells co-transfected with CIITA expression construct and empty vector. The percentage of HLA-DP- and HLA-DR-positive cells is shown (n=3). The different transfection conditions were compared to the control condition (vector) by one-way ANOVA test. Additionally, US28-R129A-HA was compared to US28-HA. Comparisons are shown when statistically significant. (F/G) HeLa cells were either left untreated or were co-transfected with CIITA-3xFLAG expression construct and pcDNA:US28-HA, pcDNA:US28-ΔC-HA, pIRESNeo-FLAG/HA-EYFP (control) or empty vector. At 48 hr post-transfection, cells were stained with anti-HLA-DP (F) or anti-HLA-DR (G) antibodies and analyzed by flow cytometry. Cell surface expression of HLA-DP or HLA-DR was normalized to cells transfected with CIITA expression construct and empty vector. The percentage of HLA-DP- and HLA-DR-positive cells is shown (n=3). The different transfection conditions were compared to the control condition (vector) by one-way ANOVA test. Additionally, US28-ΔC-HA was compared to US28-HA. Comparisons are shown when statistically significant. (H) HeLa cells were either left untreated or were transfected with CIITA-3xFLAG expression construct or pcDNA:US28-ΔC-HA. At 24 hr post-transfection, protein lysates were generated and an IP with HA-specific mouse monoclonal antibody was performed either with unmodified samples or with mixed samples of CIITA- and US28-transfected cells. The lysates and IP samples were analyzed by immunoblot to test CIITA and pUS28-ΔC co-precipitation. (I) HeLa cells were either left untreated or were co-transfected with CIITA-3xFLAG expression construct and pIRES:US28-HA, different pIRES:US28-ΔC-HA mutants, pIRESNeo-FLAG/HA-EYFP (control) or empty vector. At 24 hr post-transfection, protein lysates were generated and analyzed by immunoblot using antibodies detecting the indicated proteins or the respective epitope tags. Untrans, untransfected. Vector, empty vector control. ΔC (1-297), C-terminal (aa 298–354) deletion mutant of pUS28. 1–313, C-terminal (aa 314–354) deletion mutant of pUS28. 1–329, C-terminal (aa 330–354) deletion mutant of pUS28. 1–345, C-terminal (aa 346–354) deletion mutant of pUS28. R129A, point mutation mutant of pUS28. Control, pIRESNeo-FLAG/HA-EYFP.
-
Figure 7—source data 1
PDF files containing original western blots for Figure 7A-B and H-I, indicating the relevant bands and treatments.
- https://cdn.elifesciences.org/articles/96414/elife-96414-fig7-data1-v1.zip
-
Figure 7—source data 2
Original files for western blot analysis displayed in Figure 7A-B and H-I.
- https://cdn.elifesciences.org/articles/96414/elife-96414-fig7-data2-v1.zip
Figure 8 with 1 supplement
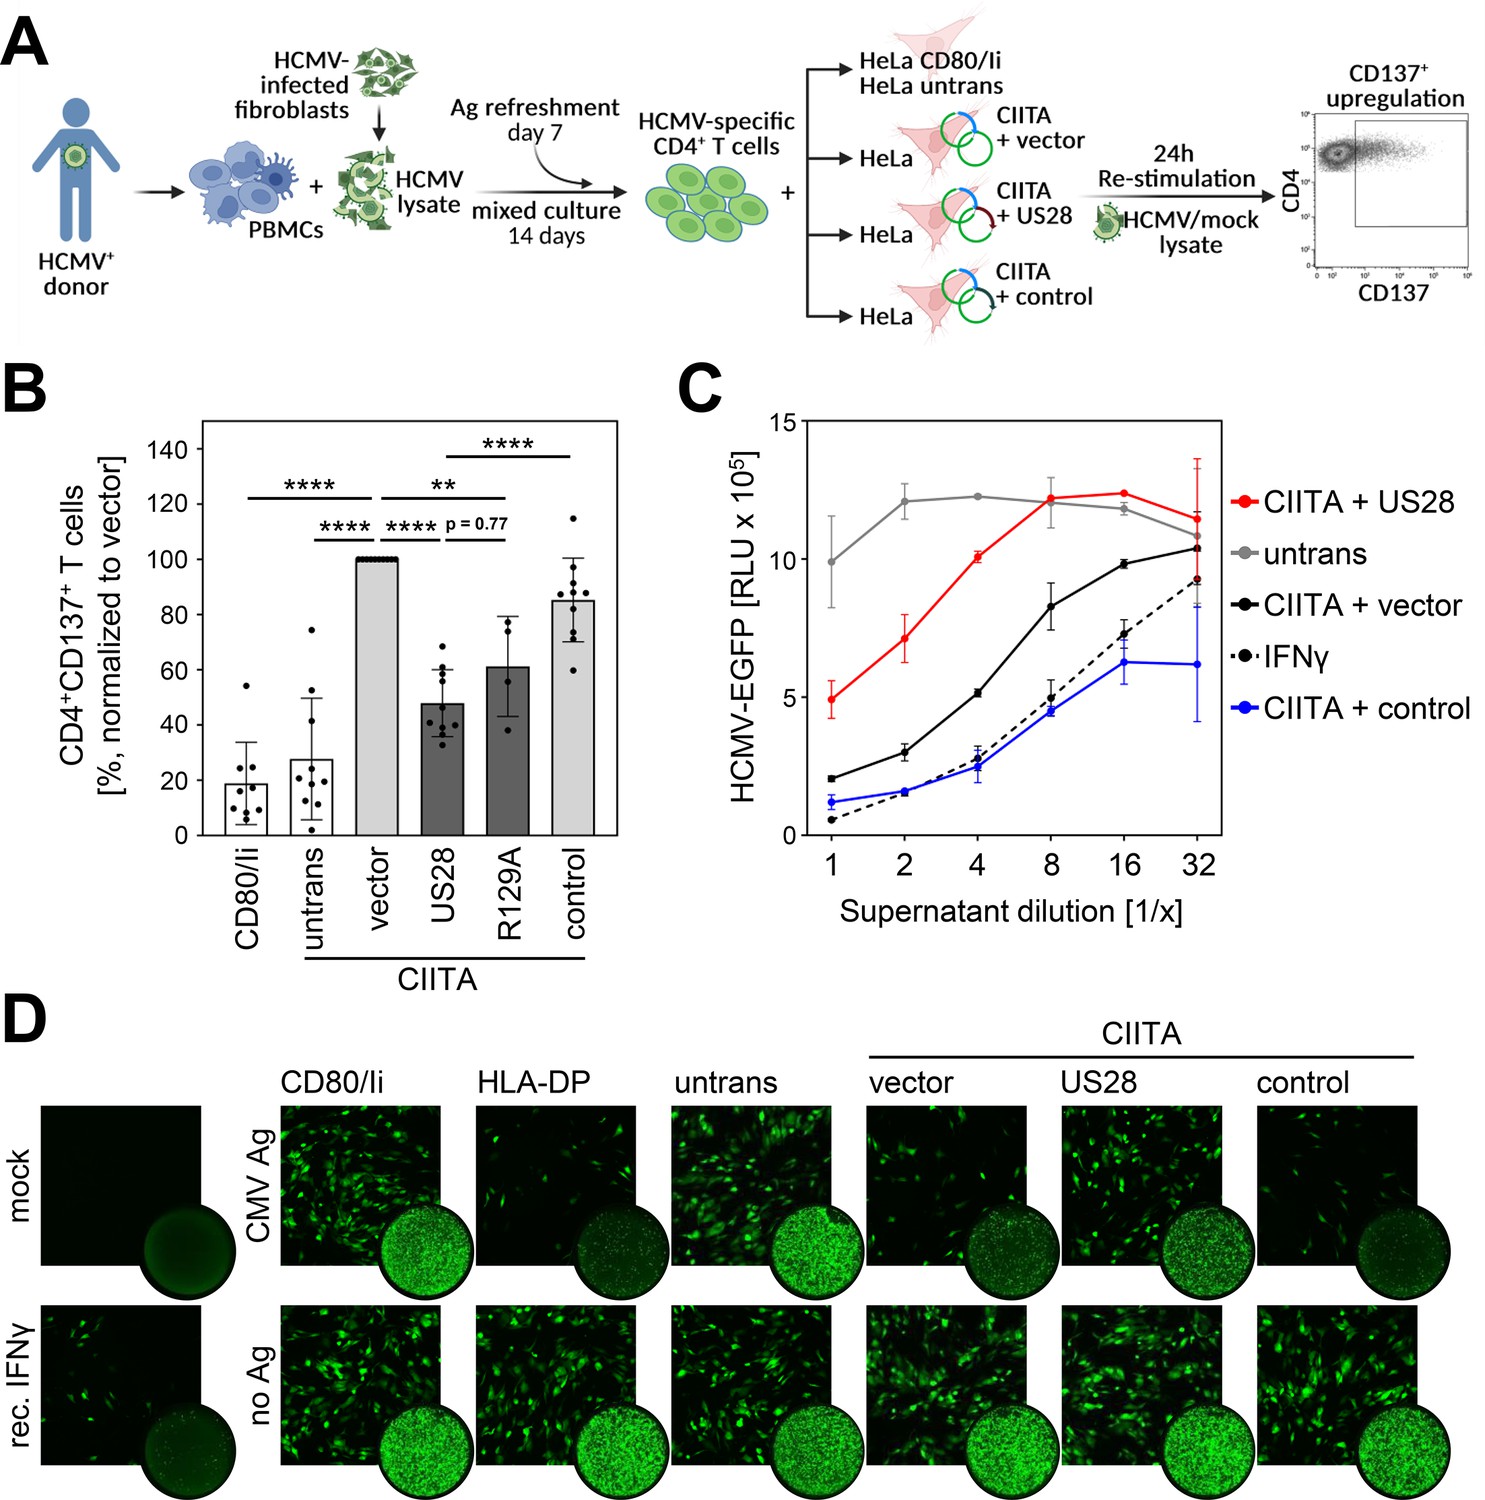
Activation of Human cytomegalovirus (HCMV)-specific CD4 + T cells is inhibited by pUS28.
(A) Schematic overview of the experimental setup. Peripheral blood mononuclear cells (PBMCs) of Human cytomegalovirus (HCMV)-seropositive healthy donors were isolated, pulsed with HCMV lysate, and incubated for 14 d, with an antigen refreshment step at day 7. Afterwards, cells were co-cultured with HeLa cells that were either left untreated or were co-transfected with class II transactivator (CIITA) expression construct and pcDNA:US28-HA, pcDNA:US28-R129A-HA, pIRESNeo-FLAG/HA-EYFP, or empty vector, 48 hr prior to co-culture, and were re-stimulated with mock or HCMV lysate. HeLa cells only expressing CD80 and the invariant chain (HeLa CD80/Ii) served as further negative control. After 24 hr of incubation, the specific T cell response was quantified by flow cytometry as percentage of gated CD4 + T cells expressing the activation marker CD137. This panel was created using BioRender.com. (B) Activation of HCMV-specific CD4 + T cells was measured as described in (A). Proportion of CD137-positive T cells was normalized to T cells activated by HeLa cells transfected with CIITA expression construct and empty vector, and pulsed with HCMV lysate. Mean values ± SD are depicted (n=4–10 different donors). Significance was calculated by one-way ANOVA test. Comparisons are shown when statistically significant. (C) MRC-5 cells were incubated with supernatants from HCMV-specific CD4 + T cells (B) or recombinant IFNγ in serial dilutions for 24 hr. Next, cells were infected with BAC20-EGFP at an MOI of 0.05 and HCMV-induced EGFP expression was measured at 5 d post-infection (n=2). (D) MRC-5 cells were incubated and infected as in (C) and infected cells were visualized by fluorescence microscopy after 4 d of infection (square pictures) or whole-well imaging at 6 d post-infection (circle pictures). Untrans, untransfected. Vector, empty vector control. R129A, point mutation mutant of pUS28. Control, pIRESNeo-FLAG/HA-EYFP. Mock, uninfected. CMV Ag, HCMV lysate-treated. No Ag, mock lysate-treated.
Figure 8—figure supplement 1
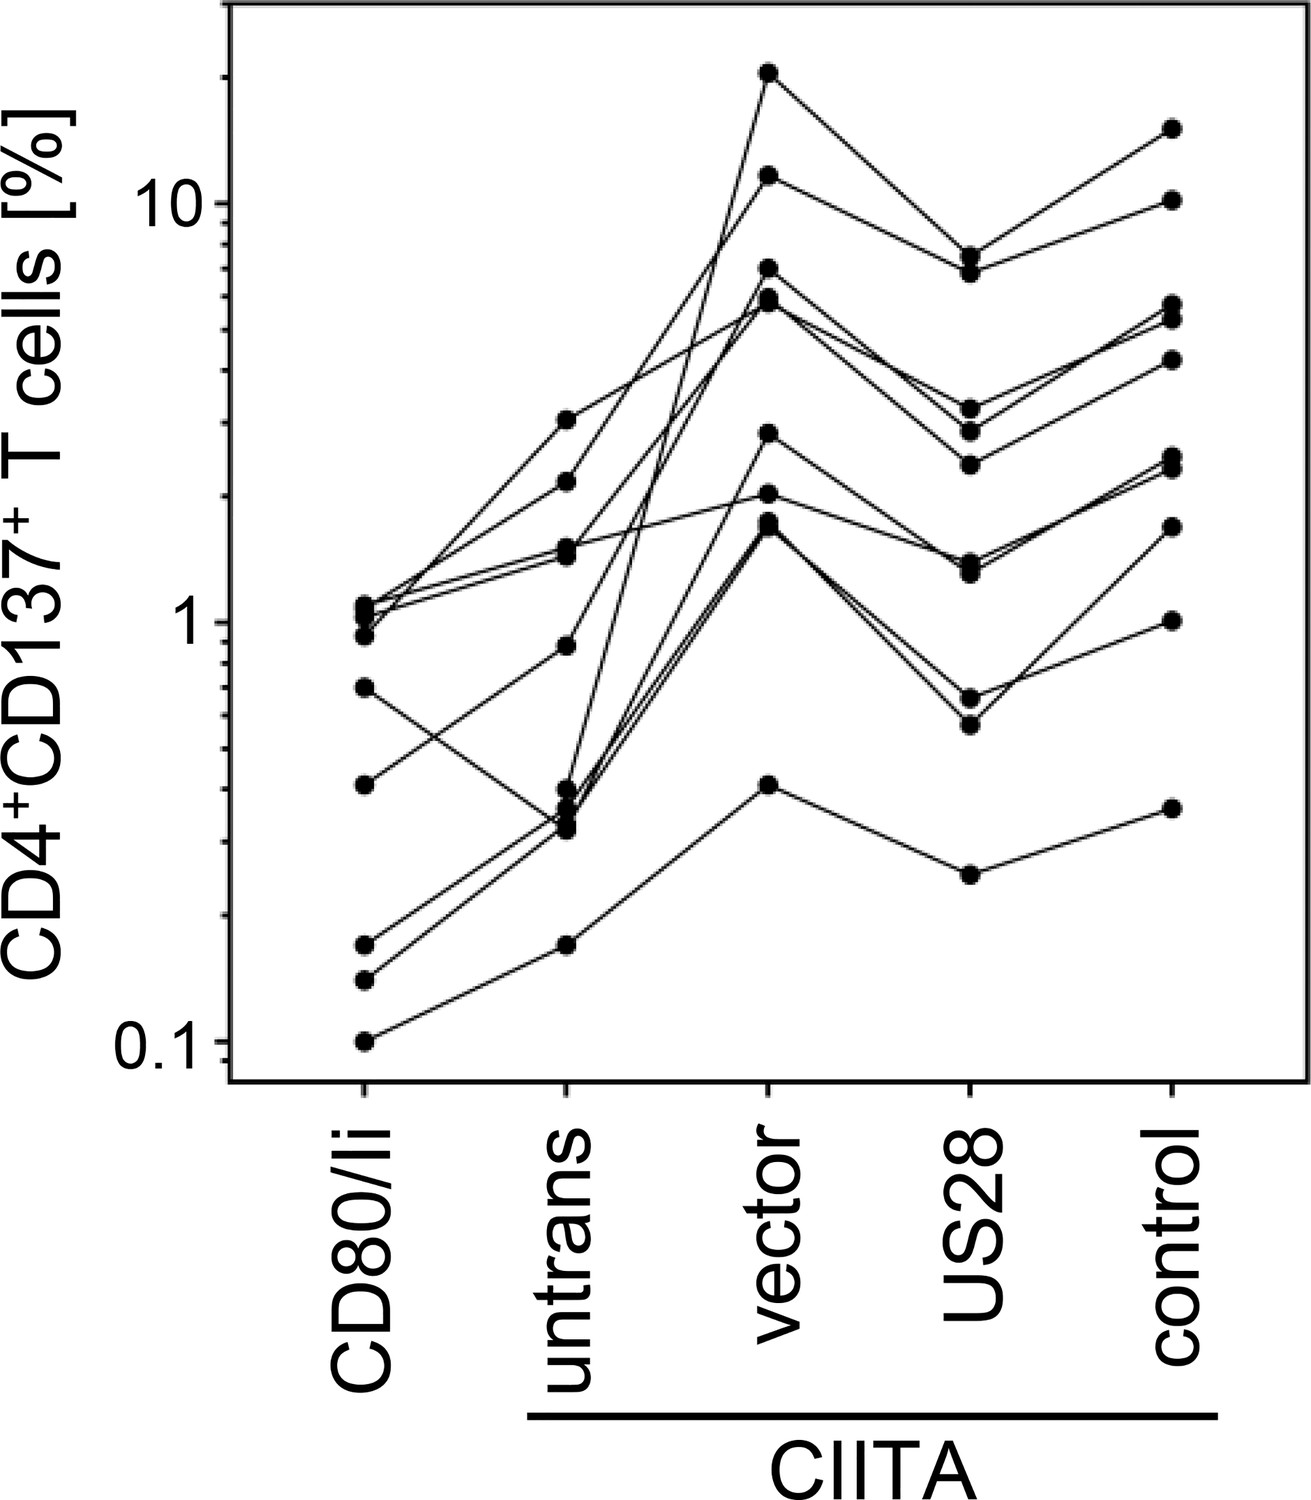
Activation of Human cytomegalovirus (HCMV)-specific CD4 + T cells is inhibited by pUS28.
Activation of HCMV-specific CD4+ T cells was detected by T cell activation assay. Proportion of CD4/CD137-positive T cells are depicted (n=10). Each line corresponds to one donor. Untrans, untransfected. Vector, empty vector control. Control, pIRESNeo-FLAG/HA-EYFP.
Figure 9
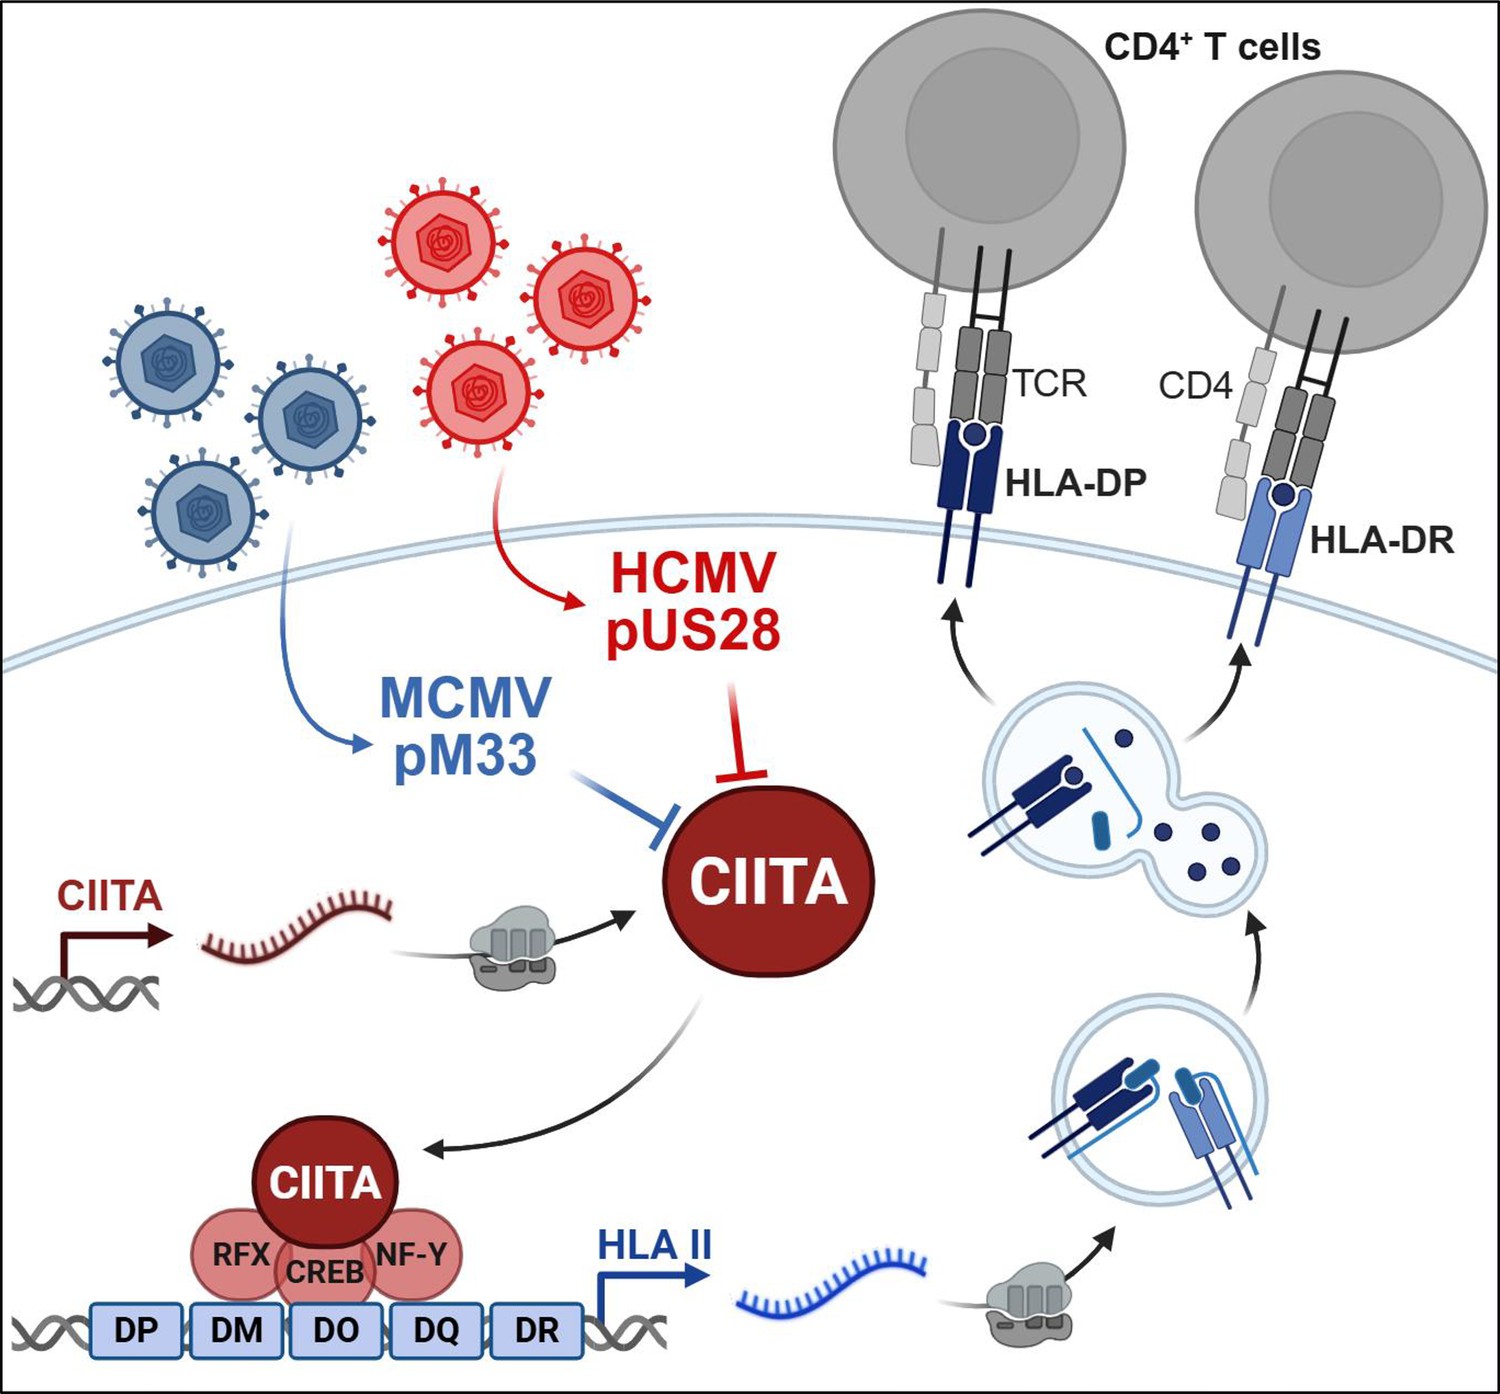
Model of the pUS28-mediated antagonism of class II transactivator (CIITA)-driven human leukocyte antigen (HLA)-II presentation and CD4 + T cell recognition.
The findings shown in this publication are consistent with the following model: pUS28 acts as Human cytomegalovirus (HCMV)-encoded antagonist of CIITA and CIITA-driven HLA class II expression. The pUS28-dependent CIITA degradation is sufficient to decrease antigen presentation by HLA-II molecules including HLA-DR and HLA-DP, and to reduce the activation of HCMV-specific CD4 + T cells. The CIITA antagonism is evolutionarily conserved in the mouse cytomegalovirus (MCMV)-encoded pM33. This figure was created using BioRender.com.
Author response image 1
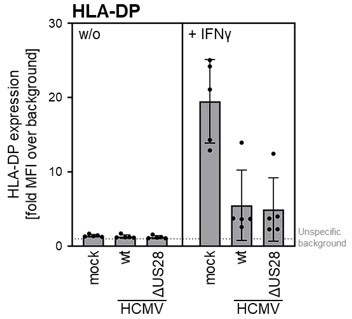
THP-I cells were either mock infected or were infected (MOI 3) with AD169-BAC2UL131rep (wt HCMV) or AD196-BAC-UL131repΔUS28 (HCMV ΔUS28).
cells were either pre-treated with 200 IU/ml IFNγ for 24 — 48 h (different experiments) or were treated at 2 h post-infection. At 24 – 72 h post-infection (different experiments), cells were stained with anti-HLA-DP antibodies and analyzed by flow cytometry. The mean fluorescence intensity (fold MFI over background) values of HLA-II expression are depicted (n = 4-5).
Tables
Table 1
Primer sequences.
| Forward | Reverse | |
|---|---|---|
| Cloning HCMV-US28HA | CGGCTAGCATGACACCGACGACGACGACC | CGCTCGAGTTAAGCGTAATCTGGAA CATCGTATGGGTACGGTATAATTTGTGA GACGCG |
| Cloning HCMV-US27HA | CGGCTAGCATGACCACCTCTACAAATAATC | CGCTCGAGTTAAGCGTAATCTGGAA CATCGTATGGGTACAACAGAAATTCC TCCTCCCC |
| Cloning HCMV-US29HA | CGGCTAGCATGCGGTGTTTCCGATGGTGG | CGGAATTCTTAAGCGTAATCTGGAA CATCGTATGGGTACTCGGAGGTGTCA ACAACCC |
| QuikChange US28-R129A | CACGGAGATTGCACTCGATGCCTACTACGCTATTGTTTAC | GTAAACAATAGCGTAGTAGGCATCG AGTGCAATCTCCGTG |
| QuikChange US28-ΔC (Δ298–354) | CGCTCGAGTTAAGCGTAATCTGGAACATCGTATGGGTACTTGGTGCCCACGA AGACG | CGTCTTCGTGGGCACCAAGTACCC ATACGATGTTCCAGATTACGCTTAAC TCGAGCG |
| QuikChange US28-Δ314–354 | CGCTCGAGTTAAGCGTAATCTGGAACATCGTATGGGTAGAGTCGCTGGCGAA ACTCG | CGAGTTTCGCCAGCGACTCTACCCA TACGATGTTCCAGATTACGCTTAAC TCGAGCG |
| QuikChange US28-Δ330–354 | CGCTCGAGTTAAGCGTAATCTGGAACATCGTATGGGTACCGACGCGAA AAGCTCATGC | GCATGAGCTTTTCGCGTCGGTACC CATACGATGTTCCAGATTACGCTTA ACTCGAGCG |
| QuikChange US28-Δ346–354 | CGCTCGAGTTAAGCGTAATCTGGAACATCGTATGGGTACTCGTCGGACAGCGTGTCG | CGACACGCTGTCCGACGAGTACCC ATACGATGTTCCAGATTACGCTTAAC TCGAGCG |
| AD169-BAC2-UL131rep-Kana | TGCGCCGTGGTGCTGGGTCAGTG CCAGCGGGAAACCGCGGAAAAAA ACGATTATTACCGAAGGATGACGA CGATAAGTAGGG | GCGTCCCAGTAATGCGGTACTCGGT AATAATCGTTTTTTTCCGCGGTTTCC CGCTGGCACCAACCAATTAACCAAT TCTGATTAG |
| ΔUS28-Kana | CAGTCTCTCGGTGCGTGGACCAGACGGCGTCCATGCACCGAGGGCA GAACTGGTGCTATCCCAGTGAATTC GAGCTCGGTAC | CACGGGGAAAAGAGGGGCGGACAC GGGGTTTGTATGAAAAGGCCGAGGTA GCGCTTTTTTGACCATGATTACGCCAA GCTCC |
| HLA-DPB1 (Meurer et al., 2018) | GCTTCCTGGAGAGATACATC | CAGCTCGTAGTTGTGTCTGC |
| HLA-DR (Morimoto et al., 2004) | GCCAACCTGGAAATCATGAC | AGGGCTGTTCGTGAGCACA |
| CIITA (Sandhu and Buchkovich, 2020) | AGCCTTTCAAAGCCAAGTCC | TTGTTCTCACTCAGCGCATC |
Additional files
-
Supplementary file 1
Global proteome analysis data.
- https://cdn.elifesciences.org/articles/96414/elife-96414-supp1-v1.xlsx
-
MDAR checklist
- https://cdn.elifesciences.org/articles/96414/elife-96414-mdarchecklist1-v1.docx
Download links
A two-part list of links to download the article, or parts of the article, in various formats.
Downloads (link to download the article as PDF)
Open citations (links to open the citations from this article in various online reference manager services)
Cite this article (links to download the citations from this article in formats compatible with various reference manager tools)
The human cytomegalovirus-encoded pUS28 antagonizes CD4+ T cell recognition by targeting CIITA
eLife 14:e96414.
https://doi.org/10.7554/eLife.96414


