Exposure to live saprophytic Leptospira before challenge with a pathogenic serovar prevents severe leptospirosis and promotes kidney homeostasis
- Department of Microbiology, Immunology and Biochemistry, University of Tennessee Health Science Center, United States
Figures
Figure 1 with 1 supplement
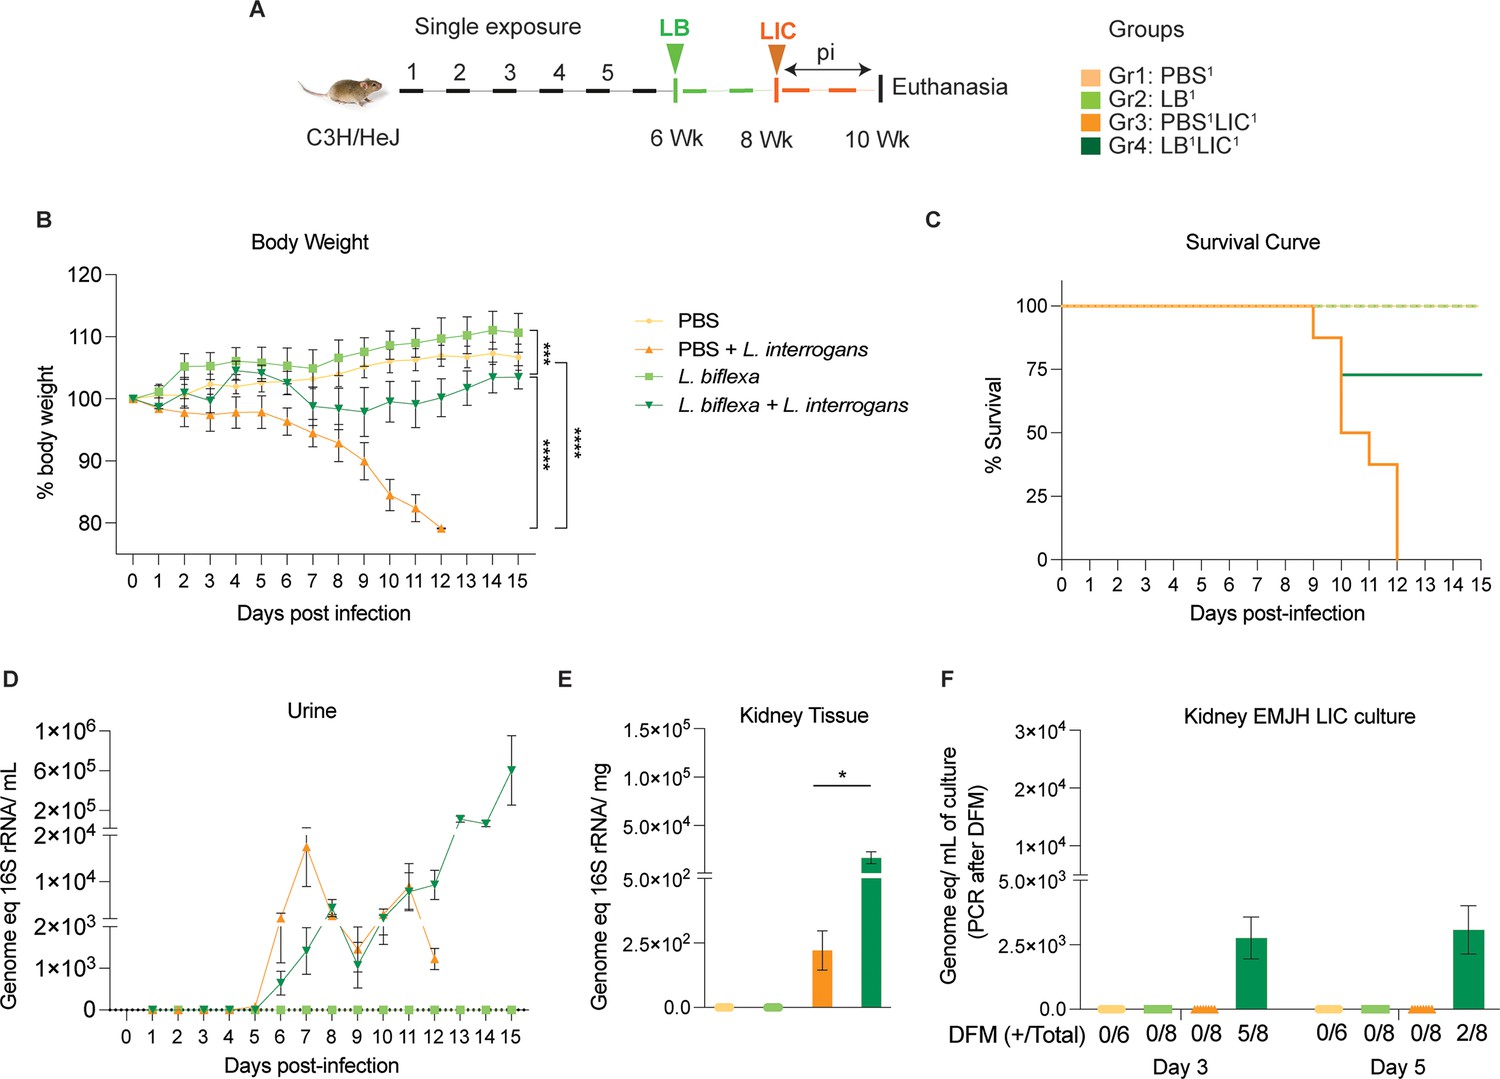
Weight loss, kidney colonization, shedding in urine, and survival to challenge with L. interrogans following a single exposure to L. biflexa.
Male C3H/HeJ mice were inoculated once with 108 L. biflexa (LB) at 6 weeks and they were challenged with 108 L. interrogans serovar Copenhageni FioCruz (LIC) at 8 weeks. (A) Experimental layout; (B) body weight measurements (%) acquired for 15 days post challenge with LIC; (C) mouse survival within the 15 days post challenge with LIC; (D) 16S rRNA qPCR quantification of live LIC in urine; (E) 16S rRNA qPCR quantification of Leptospira burden in kidney tissue harvested on d15 post challenge with LIC and (F) 16S rRNA qPCR from kidney EMJH cultures containing live Leptospira previously observed by dark-field microscopy (DFM). DFM positive culture from the total data is represented in numbers under the graph. Statistical analysis was performed by ordinary one-way ANOVA followed by Tukey’s multiple comparison correction between challenged groups and their respective controls, *p<0.05, **p<0.01, ***p<0.001, and ****p<0.0001, N=6–8 mice per group. Data represents two independent experiments.
-
Figure 1—source data 1
Excel file containing the source data used to make Figure 1.
- https://cdn.elifesciences.org/articles/96470/elife-96470-fig1-data1-v1.xlsx
Figure 1—figure supplement 1
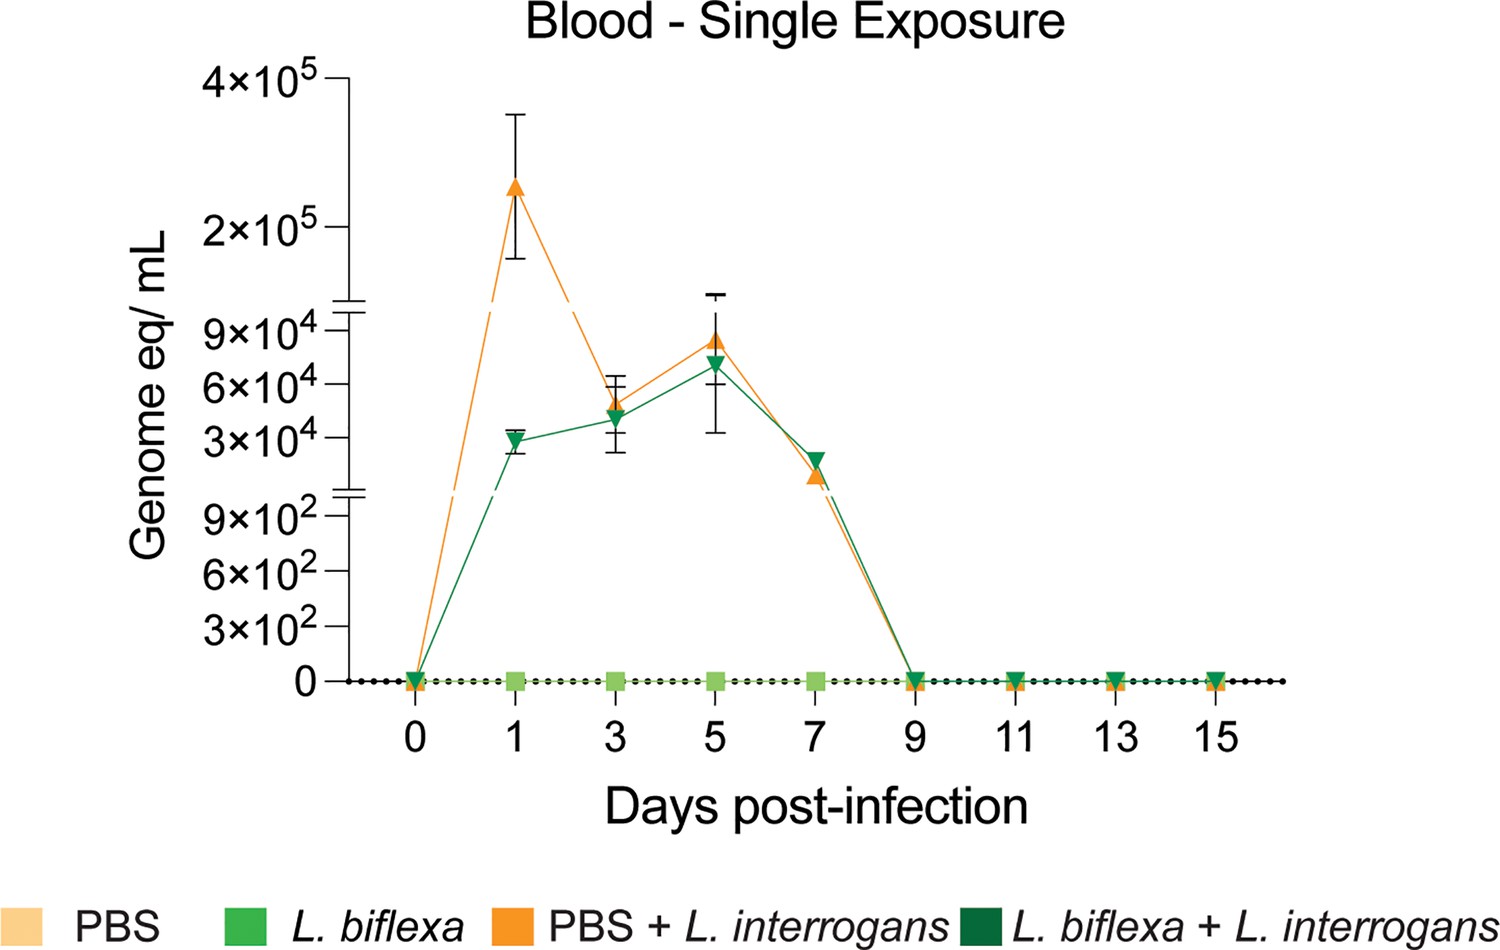
qPCR to quantify L. interrogans load in blood of mice using 16S rRNA Leptospira-specific primers and probes from the single L. biflexa exposure experiment.
Data represents two experiments.
-
Figure 1—figure supplement 1—source data 1
Excel file containing the data used to make Figure 1—figure supplement 1.
- https://cdn.elifesciences.org/articles/96470/elife-96470-fig1-figsupp1-data1-v1.xlsx
Figure 2 with 1 supplement
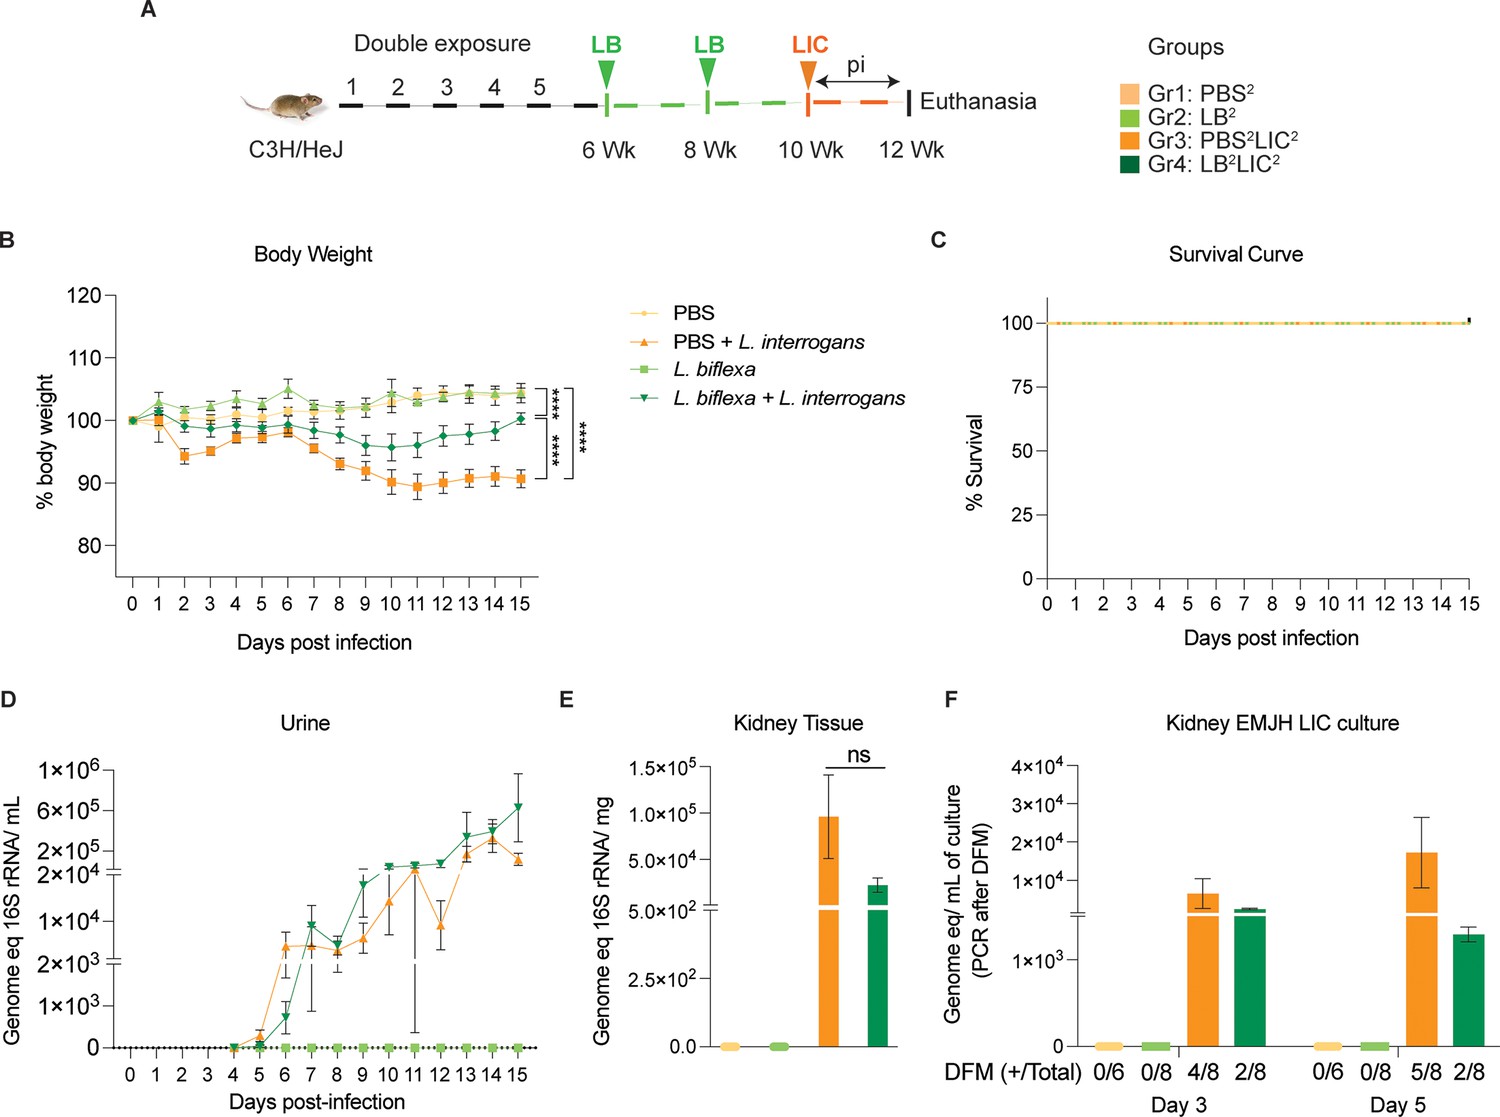
Weight loss, kidney colonization, shedding in urine, and survival to challenge with L. interrogans following a double exposure to L. biflexa.
Male C3H/HeJ mice were inoculated twice with 108 L. biflexa at 6 and 8 weeks, and at 10 weeks they were challenged with 108 L. interrogans ser Copenhageni FioCruz (LIC). (A) Experimental layout; (B) body weight measurements (%) acquired for 15 days post challenge with LIC; (C) mouse survival within the 15 days post challenge with LIC; (D) 16S rRNA qPCR quantification of live LIC in urine; (E) 16S rRNA qPCR quantification of Leptospira burden in kidney tissue harvested on d15 post challenge with LIC and (F) 16S rRNA qPCR from kidney EMJH cultures containing live Leptospira previously observed by dark-field microscopy (DFM). DFM positive culture from the total data is represented in numbers under the graph. Statistical analysis was performed by ordinary one-way ANOVA followed by Tukey’s multiple comparison correction between challenged groups and their respective controls, *p<0.05, **p<0.01, ***p<0.001, and ****p<0.0001. N=6–8 mice per group. Data represents two independent experiments.
-
Figure 2—source data 1
Excel file containing the data used to make Figure 2.
- https://cdn.elifesciences.org/articles/96470/elife-96470-fig2-data1-v1.xlsx
Figure 2—figure supplement 1
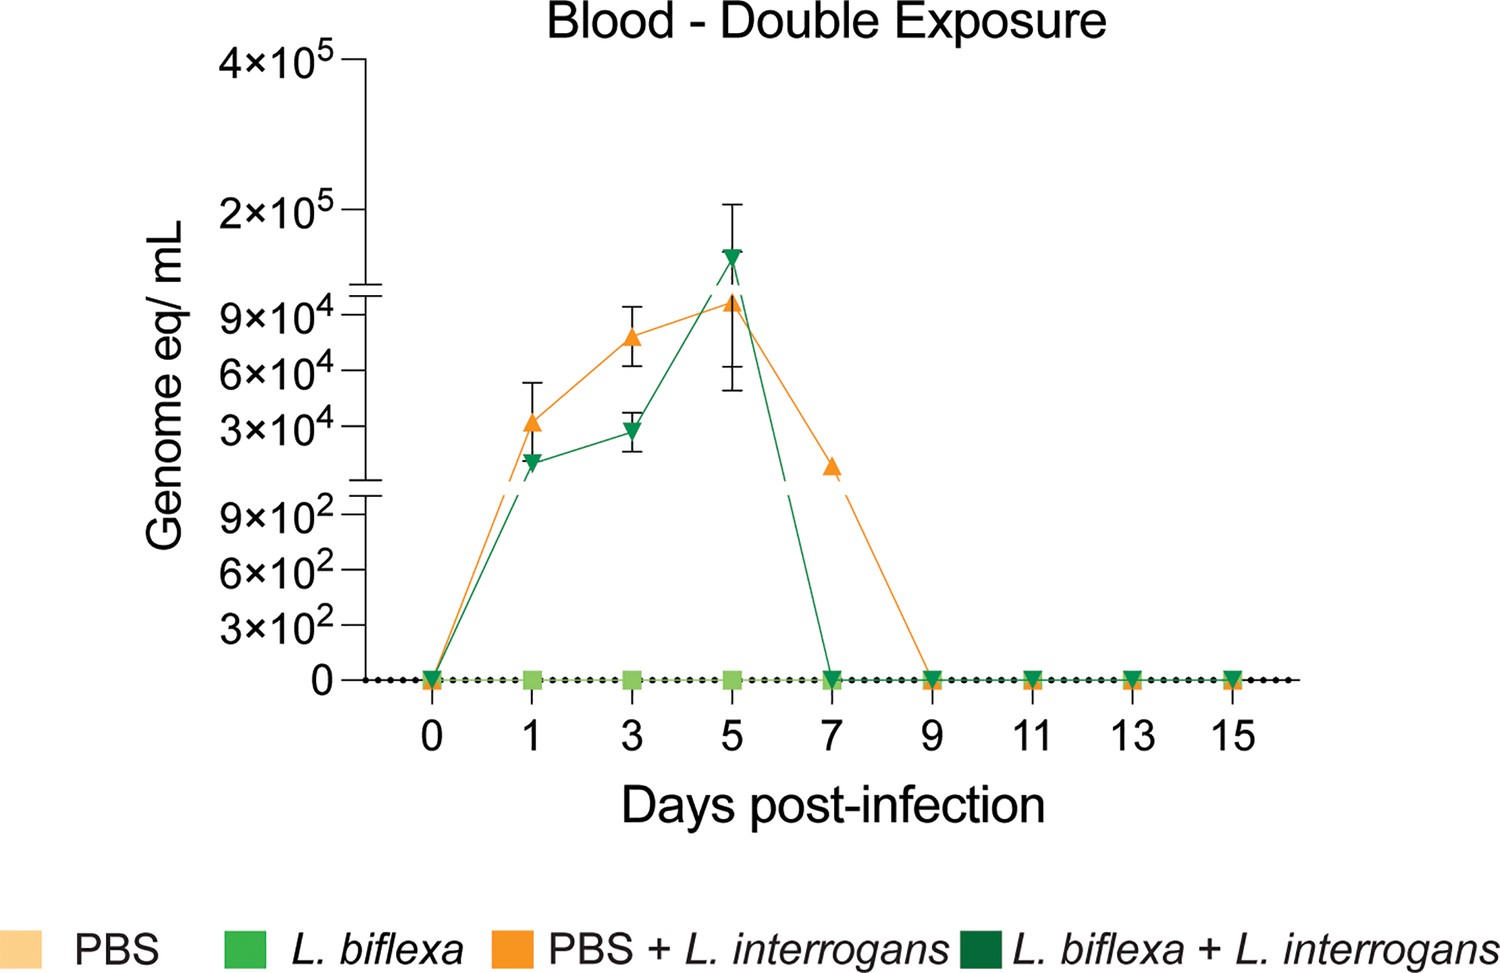
qPCR to quantify L. interrogans load in blood of mice using 16S rRNA Leptospira-specific primers and probes from the double L. biflexa exposure experiment. Data represents two experiments.
-
Figure 2—figure supplement 1—source data 1
Excel file containing the data used to make Figure 2—figure supplement 1.
- https://cdn.elifesciences.org/articles/96470/elife-96470-fig2-figsupp1-data1-v1.xlsx
Figure 3 with 1 supplement
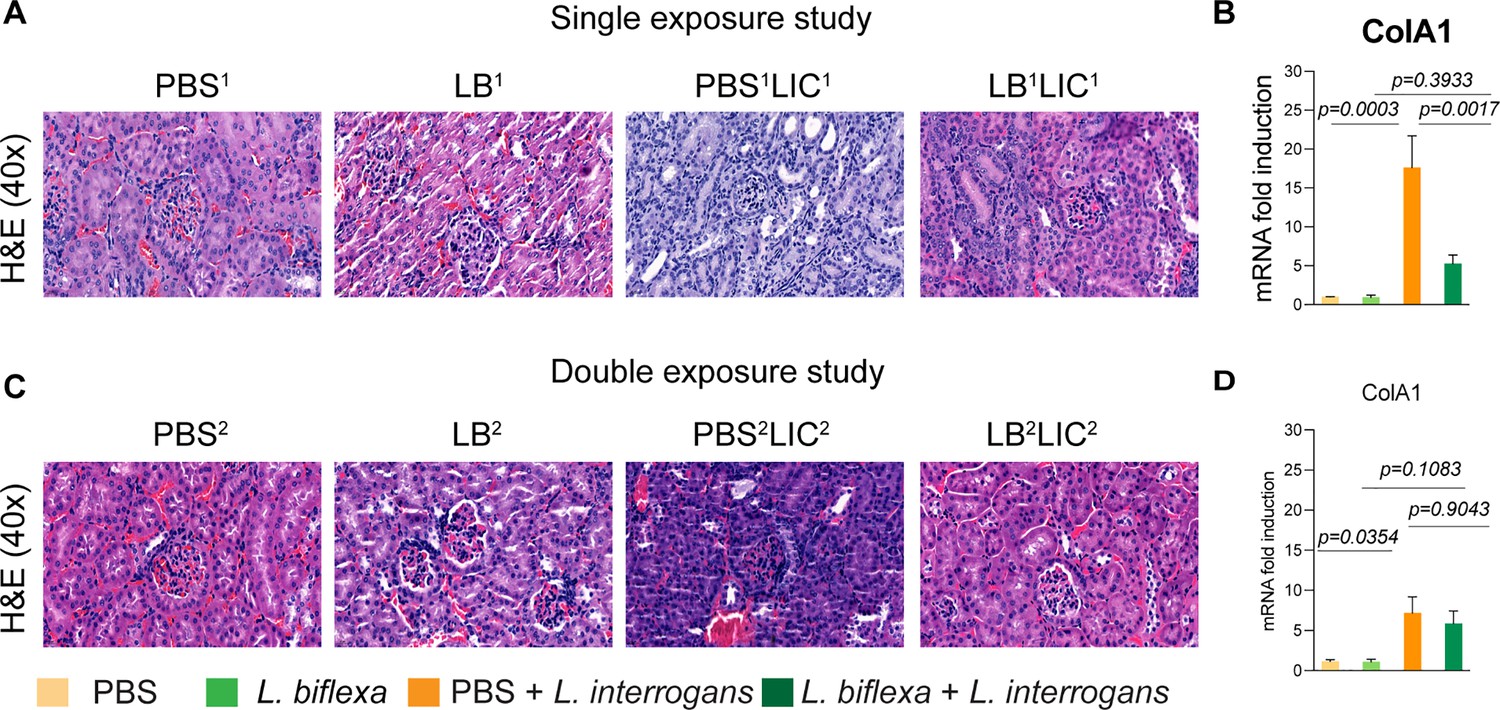
Kidney histopathology and quantification of renal fibrosis.
Representative hematoxylin and eosin (H&E)-stained kidney tissue sections from both single and double exposure studies are included in (A) and (C), respectively. The images were captured at ×40 magnification. (B) and (D) represent the mRNA expression of kidney fibrosis marker ColA1 by qPCR normalized to endogenous β-actin expression. Data was analyzed by ordinary one-way ANOVA followed by Tukey’s multiple comparison correction between challenged groups with their respective controls; *p-values are included in the graphs. Data represents one of two independent experiments.
-
Figure 3—source data 1
Excel file containing the data used to make Figure 3.
- https://cdn.elifesciences.org/articles/96470/elife-96470-fig3-data1-v1.xlsx
Figure 3—figure supplement 1

Morphometric analysis of kidney of mice from the double L. biflexa exposure experiment. Data represents one experiment.
Figure 4
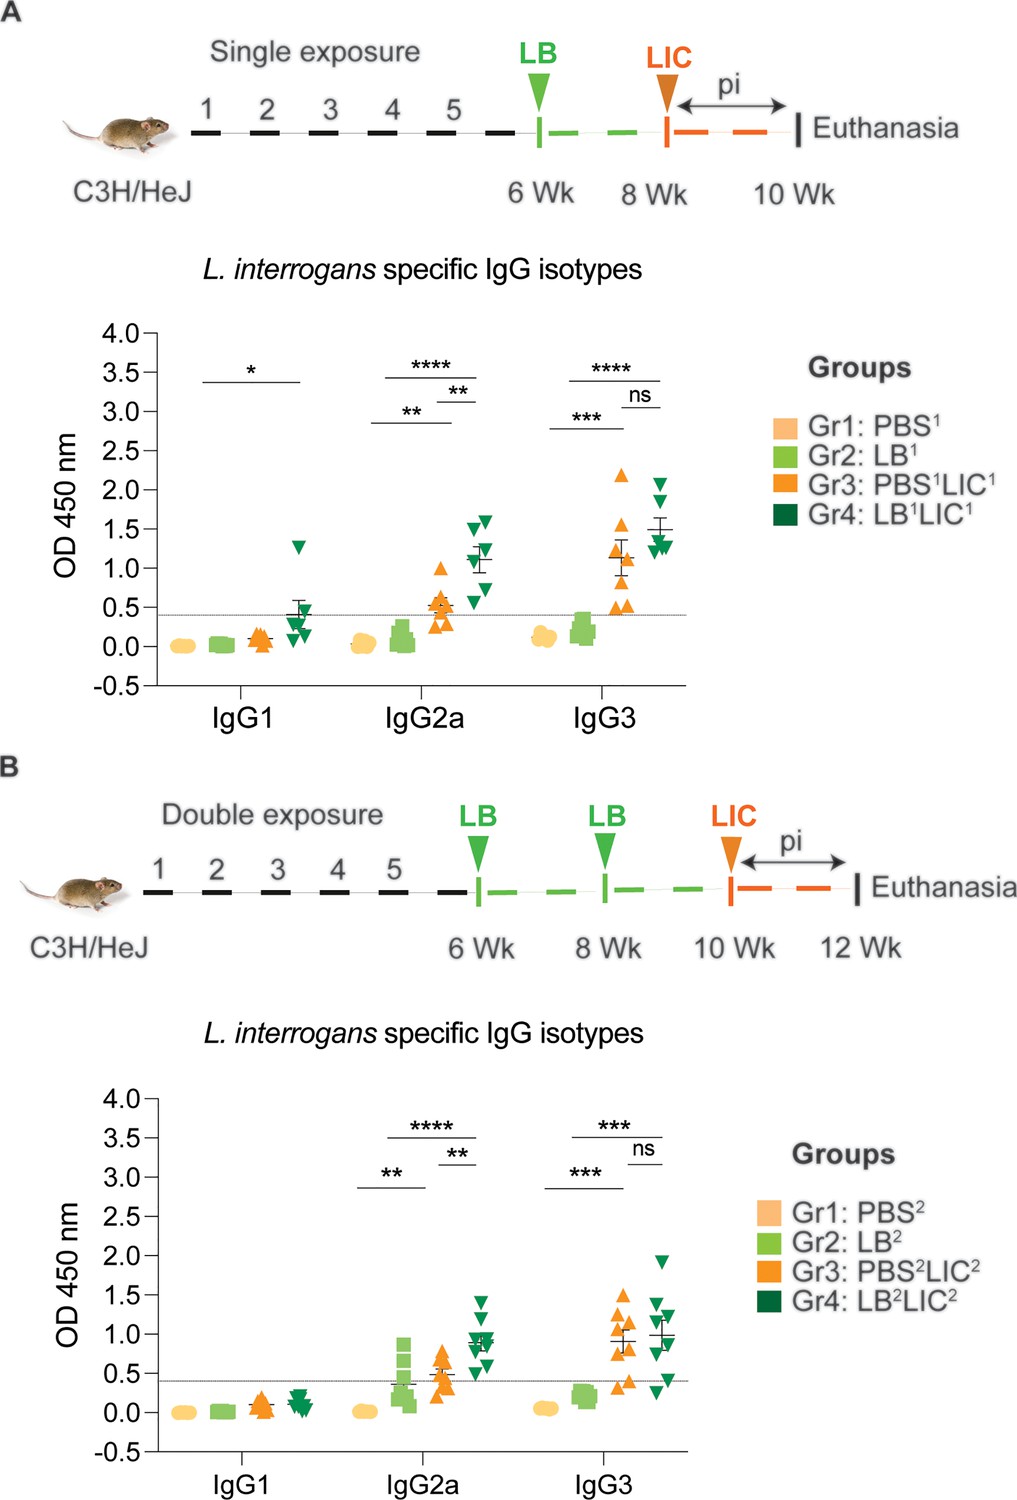
Detection of IgG1, IgG2a, and IgG3 specific to L. interrogans in serum from experimental mice.
(A) represents IgG isotypes specific to L. interrogans in 10-week serum of mice exposed once to L. biflexa before L. interrogans challenge. (B) represents IgG isotypes specific to L. interrogans in 12-week serum of mice exposed twice to L. biflexa before L. interrogans challenge. Ordinary one-way ANOVA followed by Tukey’s multiple comparison correction test was used to compare between challenged groups with their respective controls; *p<0.05, **p<0.01, ***p<0.001, ****p<0.0001, and ns = not significant; N=6–8 mice per group. Data represents two independent experiments.
-
Figure 4—source data 1
Excel file containing the raw data points used to make Figure 4.
- https://cdn.elifesciences.org/articles/96470/elife-96470-fig4-data1-v1.xlsx
Figure 5 with 1 supplement
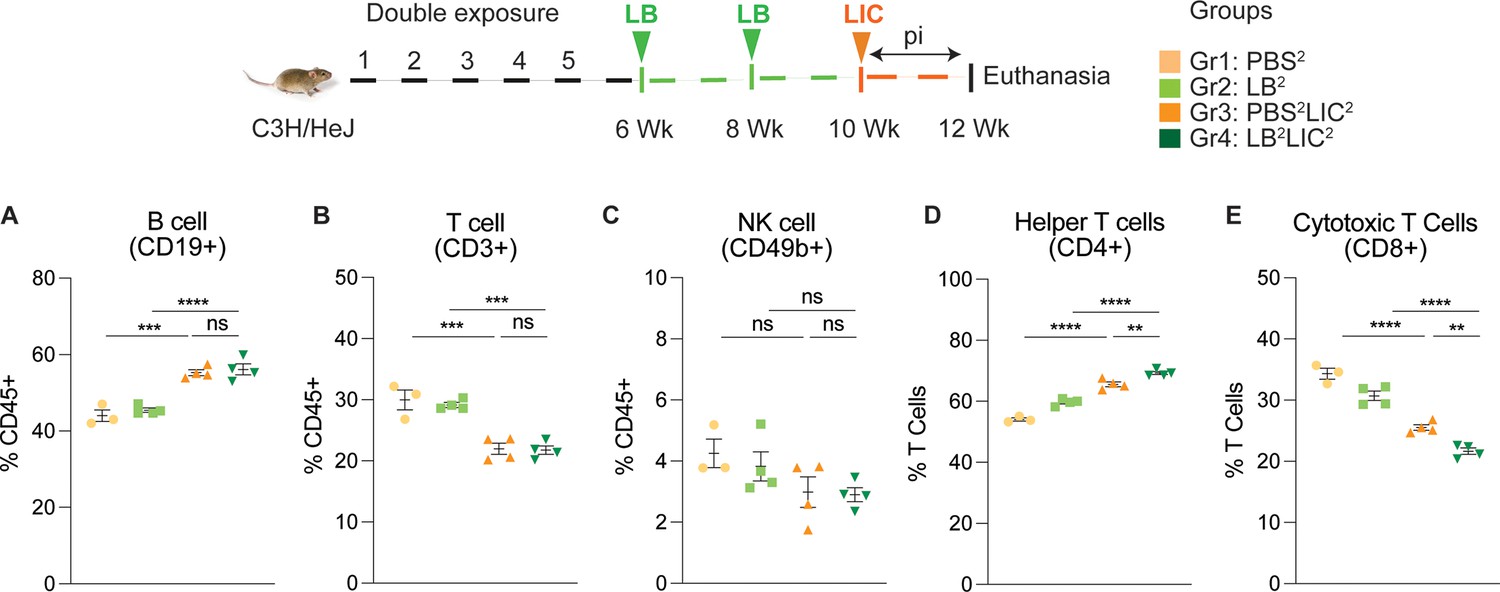
Frequency of lymphocytes in spleen of mice subjected to a double exposure of L. biflexa before challenge with L. interrogans.
(A–E) show B cell (CD19+), T cell (CD3+), NK cell (CD49b+), helper T cell (CD4+), and cytotoxic T cell (CD8+) frequencies in groups of experimental mice. Ordinary one-way ANOVA followed by Tukey’s multiple comparison correction test was used to compare between challenged groups and their respective controls; **p<0.01, ***p<0.001, ****p<0.0001, and ns = not significant; N=3–4 mice per group. Data represents one of two independent experiments.
-
Figure 5—source data 1
Excel file containing data points used to generate Figure 5.
- https://cdn.elifesciences.org/articles/96470/elife-96470-fig5-data1-v1.xlsx
Figure 5—figure supplement 1

Flow cytometry gating strategy.
The outlined gating strategy was used to immune phenotype spleen immune cells acquired in the double L. biflexa exposure experiment. Black arrows represent gating events to analyze different immune cell populations derived from their parent populations in the spleen. X and Y axis represents specific cell surface markers to distinguish a specific cell type.
Figure 6
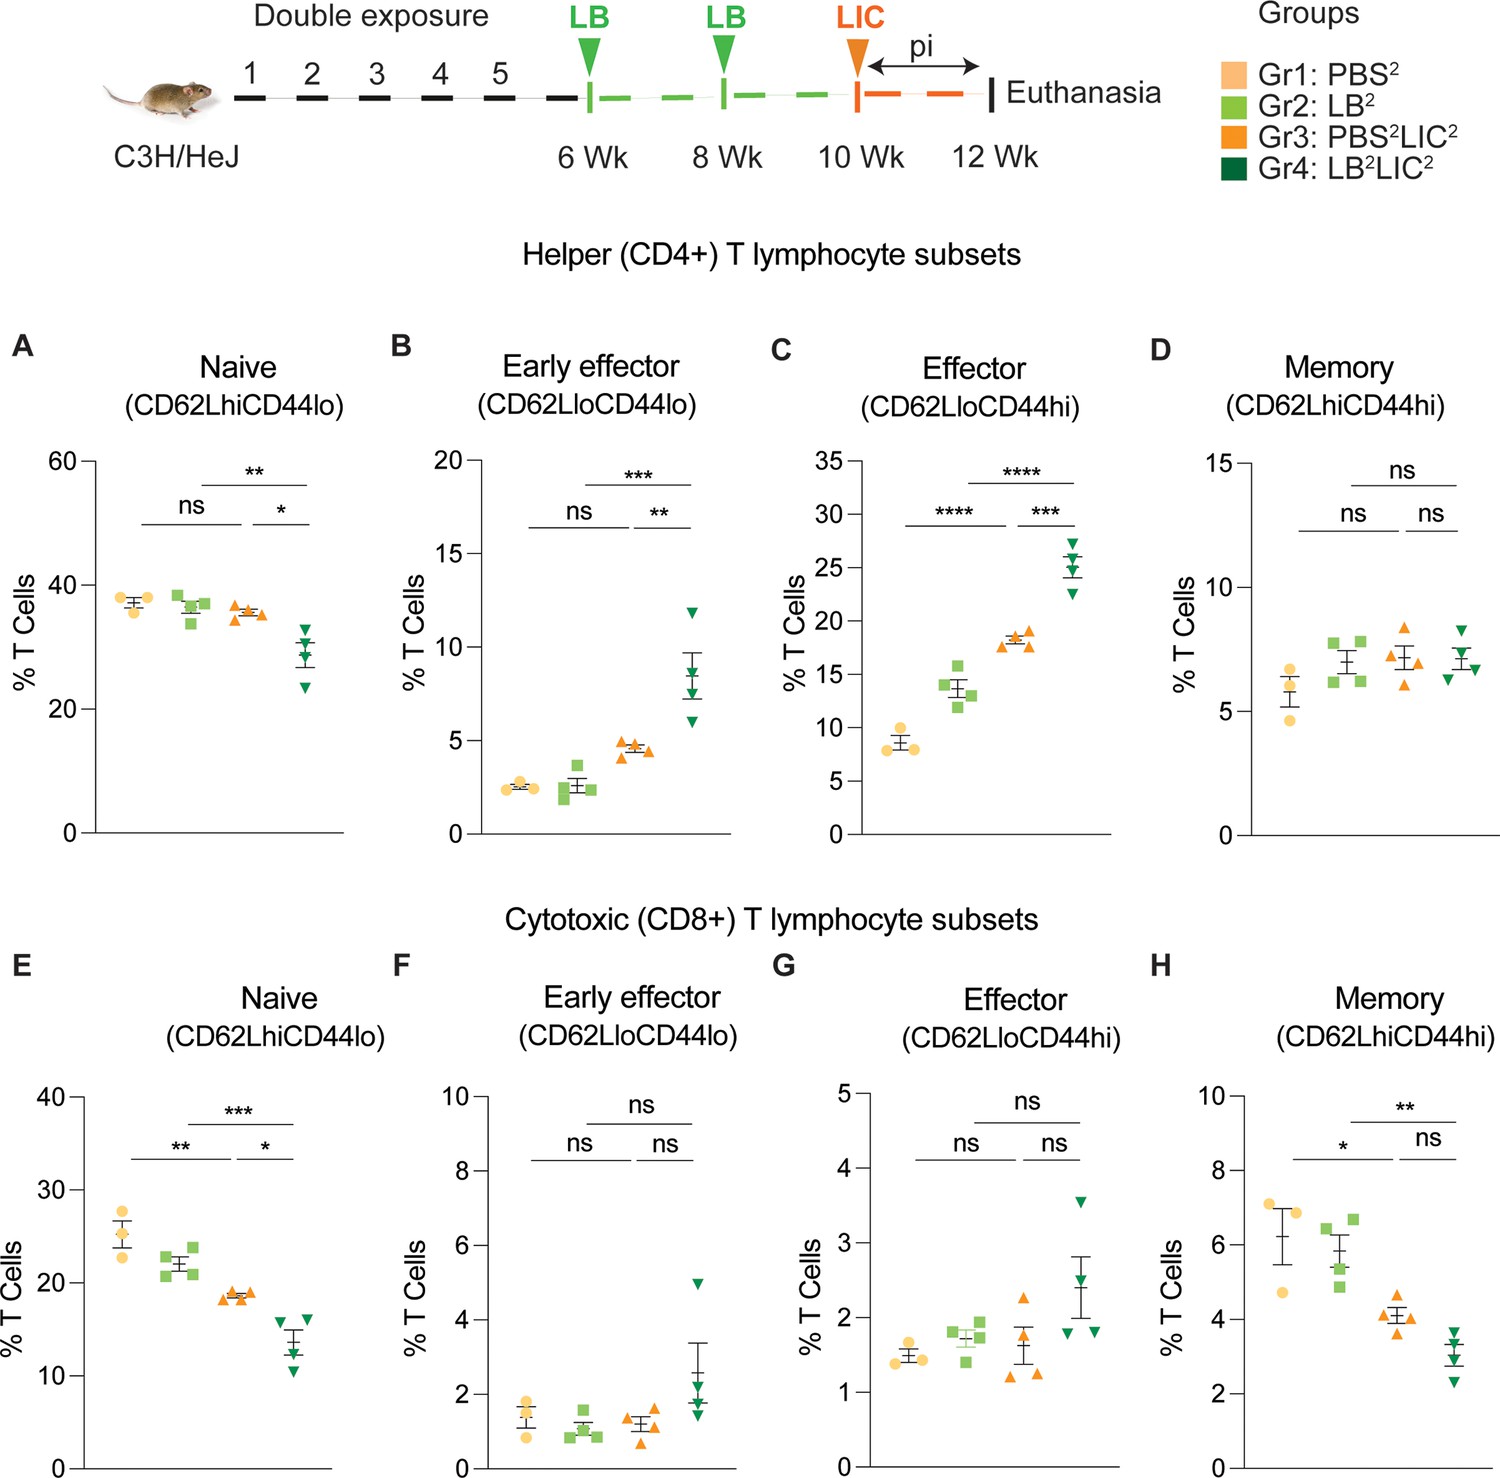
Frequency of T cell subsets (CD62L/CD44) in spleen of mice subjected to a double exposure of L. biflexa before challenge with L. interrogans.
(A–D) represent naïve, early effector, effector, and memory subsets of CD4+ helper T lymphocytes, respectively. (E–H) represent naive, early effector, effector, and memory subsets of CD8+ cytotoxic T lymphocytes, respectively. Ordinary one-way ANOVA followed by Tukey’s multiple comparison correction test was used to compare between challenged groups and their respective controls; *p<0.05, **p<0.01, ***p<0.001, ****p<0.0001, and ns = not significant; N=3–4 mice per group. Data represents one of two independent experiments.
-
Figure 6—source data 1
Excel file containing the source data used to generate Figure 6.
- https://cdn.elifesciences.org/articles/96470/elife-96470-fig6-data1-v1.xlsx
Additional files
-
Supplementary file 1
Table includes the list of primary fluorochrome-conjugated antibodies used in flow cytometry staining for spleen immune phenotyping.
- https://cdn.elifesciences.org/articles/96470/elife-96470-supp1-v1.docx
-
Supplementary file 2
Table includes the p-values from all the figures for the different experimental groups analyzed by one-way ANOVA and compared with Tukey’s multiple comparison test.
- https://cdn.elifesciences.org/articles/96470/elife-96470-supp2-v1.xlsx
-
MDAR checklist
- https://cdn.elifesciences.org/articles/96470/elife-96470-mdarchecklist1-v1.pdf
Download links
A two-part list of links to download the article, or parts of the article, in various formats.
Downloads (link to download the article as PDF)
Open citations (links to open the citations from this article in various online reference manager services)
Cite this article (links to download the citations from this article in formats compatible with various reference manager tools)
Exposure to live saprophytic Leptospira before challenge with a pathogenic serovar prevents severe leptospirosis and promotes kidney homeostasis
eLife 13:RP96470.
https://doi.org/10.7554/eLife.96470.3


