Differences in HIV-1 reservoir size, landscape characteristics, and decay dynamics in acute and chronic treated HIV-1 Clade C infection
- Africa Health Research Institute, South Africa
- Weill Cornell Medical College, United States
- University of KwaZulu-Natal, South Africa
- University College London, United Kingdom
- London School of Hygiene and Tropical Medicine, United Kingdom
- Ragon Institute of MGH, MIT and Harvard, United States
- HIV Pathogenesis Programme (HPP), The Doris Duke Medical Research Institute, University of KwaZulu-Natal, South Africa
- Harvard Medical School, United States
- Brigham and Women's Hospital, United States
Figures
Figure 1
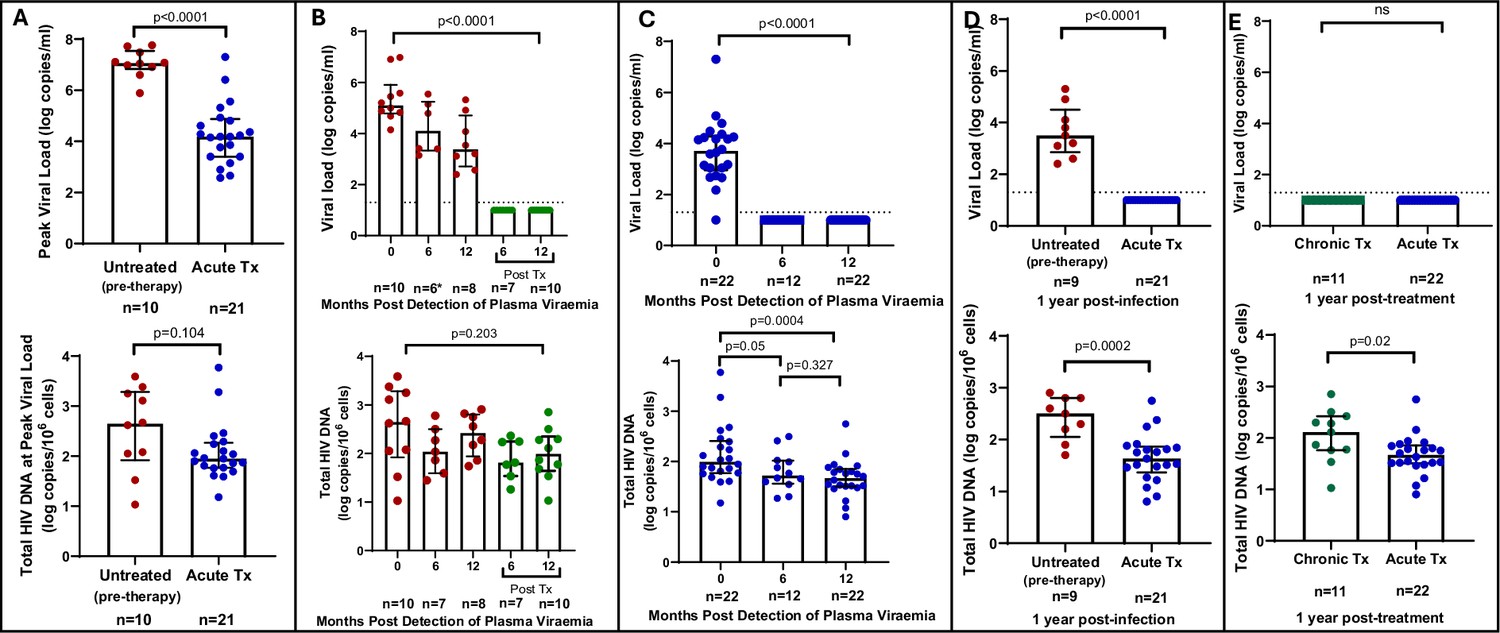
Plasma viral load and total HIV DNA in acute treated and chronic treated individuals.
(A) Peak viral load (parametric t-test) and total HIV DNA (non-parametric t-test) measured at peak viral load in untreated (pre-therapy) and acute treated individuals. (B) Longitudinal viral load (Kruskal-Wallis ANOVA) (*1 viral load measurement was unavailable) and total HIV DNA (Kruskal-Wallis ANOVA) in untreated acute infection and after 6 and 12 months of treatment. (C) Longitudinal viral load (Kruskal-Wallis ANOVA) and total HIV DNA (non-parametric t-tests) in acute treated individuals. (D) Viral load and total HIV DNA (parametric t-test) after 1 year of treatment in chronic and acute treated individuals. Median and interquartile range (error bars) are represented.
-
Figure 1—source data 1
Droplet digital PCR (ddPCR) numerical data used to generate Figure 1.
- https://cdn.elifesciences.org/articles/96617/elife-96617-fig1-data1-v1.xlsx
Figure 2 with 1 supplement
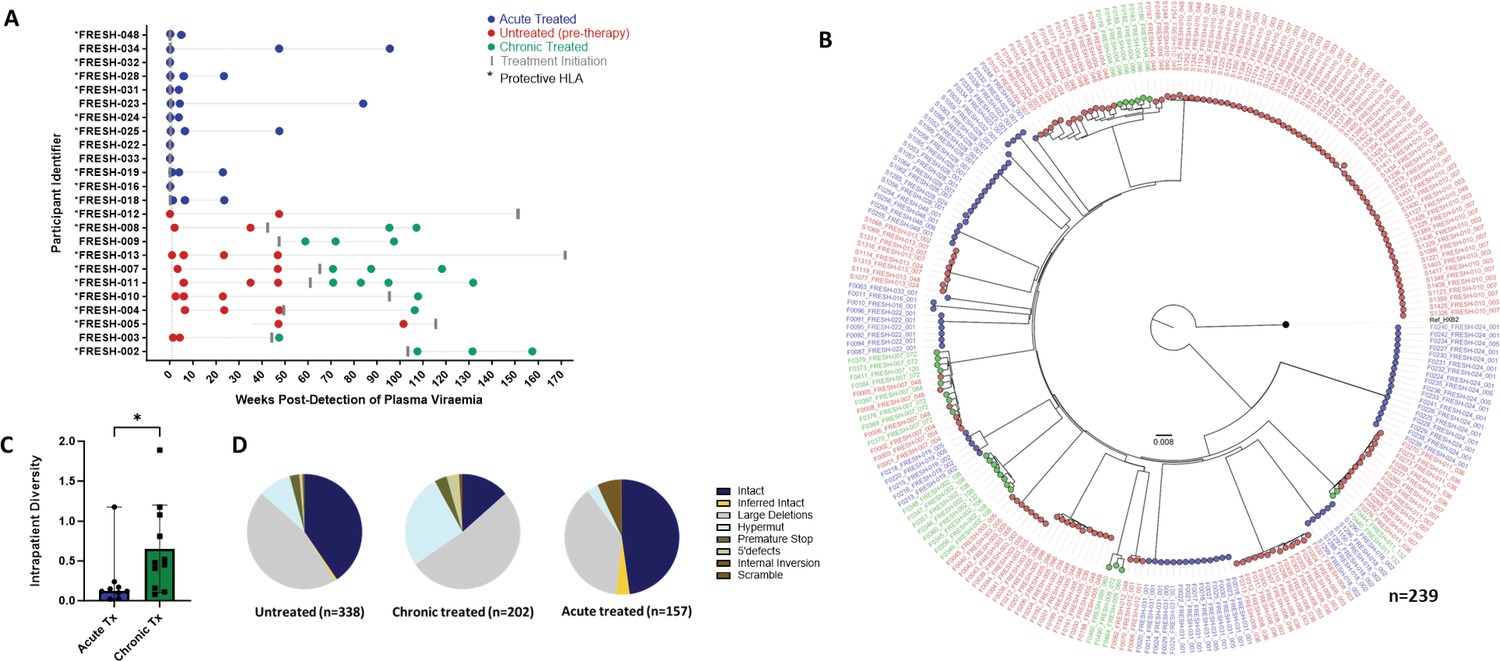
Genotypic characterisation of HIV-DNA sequences.
(A) Peripheral blood mononuclear cell (PBMC) sequencing time points in untreated (red), chronic treated (green), and early treated (blue) study participants where each dot represents a sampling time point. Time of treatment initiation is shown by the vertical grey bar. (B) Approximately maximum-likelihood phylogenetic tree of intact HIV-1 DNA genomes constructed using FastTree2. This method was chosen to resolve full-viral-genome sequences with extreme homology; branch lengths were likely inflated. Viral genomes derived from acute treated participants are marked with (*). (C) Comparison of intraparticipant mean pairwise distances between early and late treated participants. (D) Spectrum of HIV genome sequences detected during untreated acute infection, late treated chronic infection, and acute treated infection.
Figure 2—figure supplement 1

In this cohort of HIV-1 subtype C, genome deletions were most frequently observed between integrase and envelope relative to Gag (p<0.0001–0.001).
Figure 3 with 1 supplement
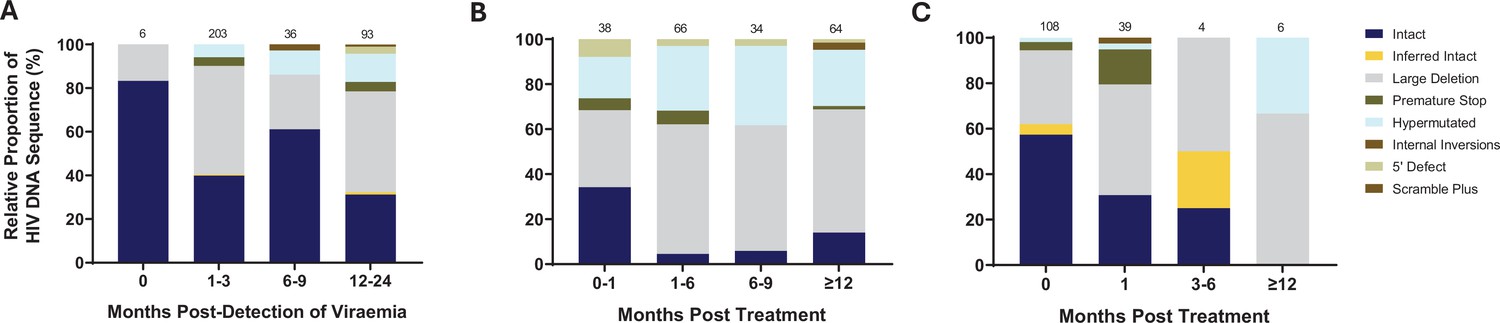
Evolution of the proviral genetic landscape.
Relative proportions of intact and defective viral genomes measured longitudinally in (A) untreated acute infection for 2 years, (B) late (chronic) treated infection for 1 year, and (C) early (acute) treated infection for 1 year. The number of genomes sampled at each time point is indicated above each vertical bar.
Figure 3—figure supplement 1
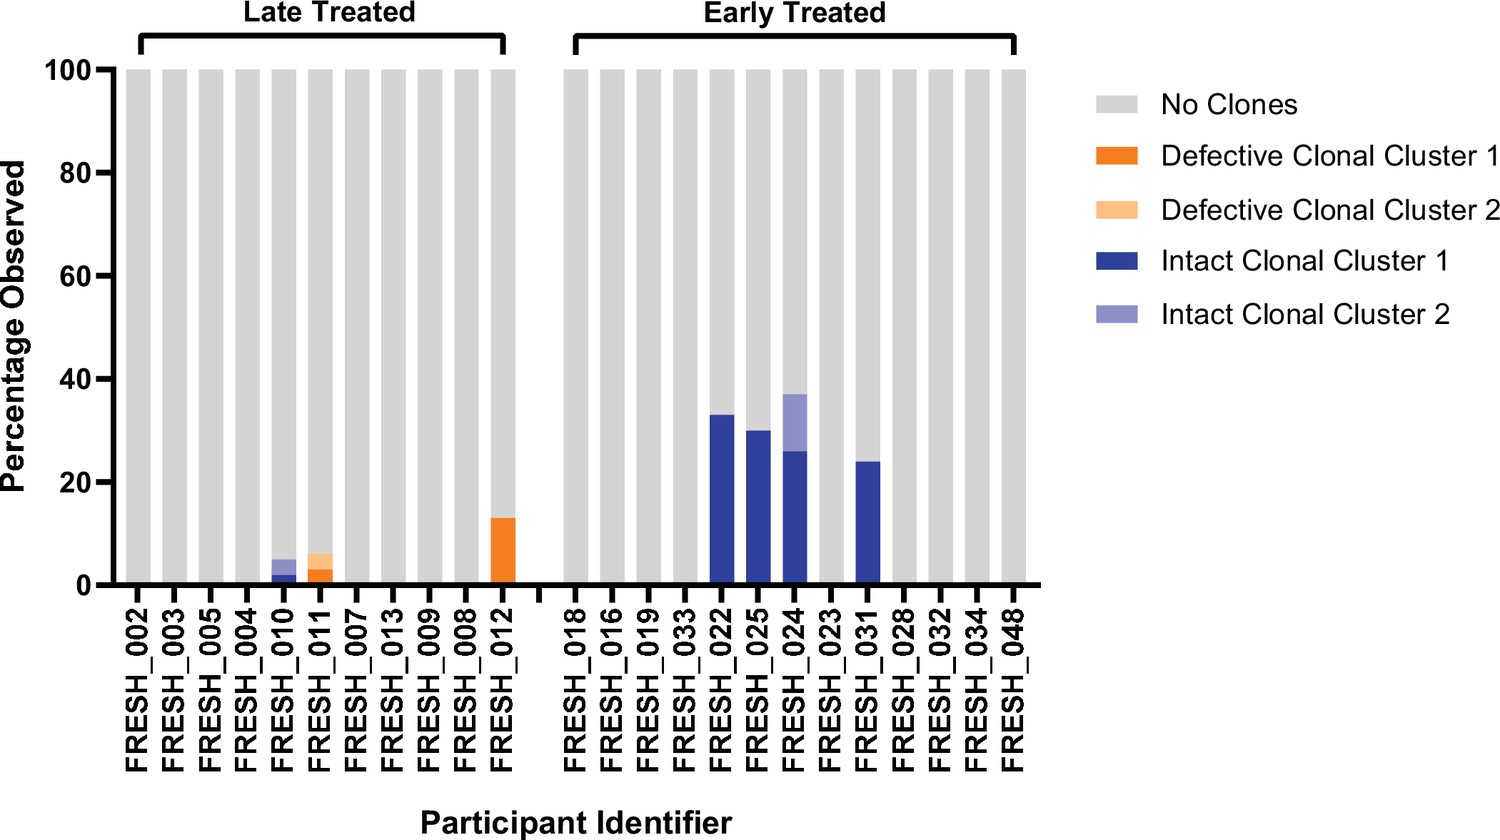
Clonal expansion of infected cells was detected in both defective (orange) and intact (blue) genomes in late and early treated study participants.
This analysis was performed with all sequences available for each participant at all time points.
Figure 4
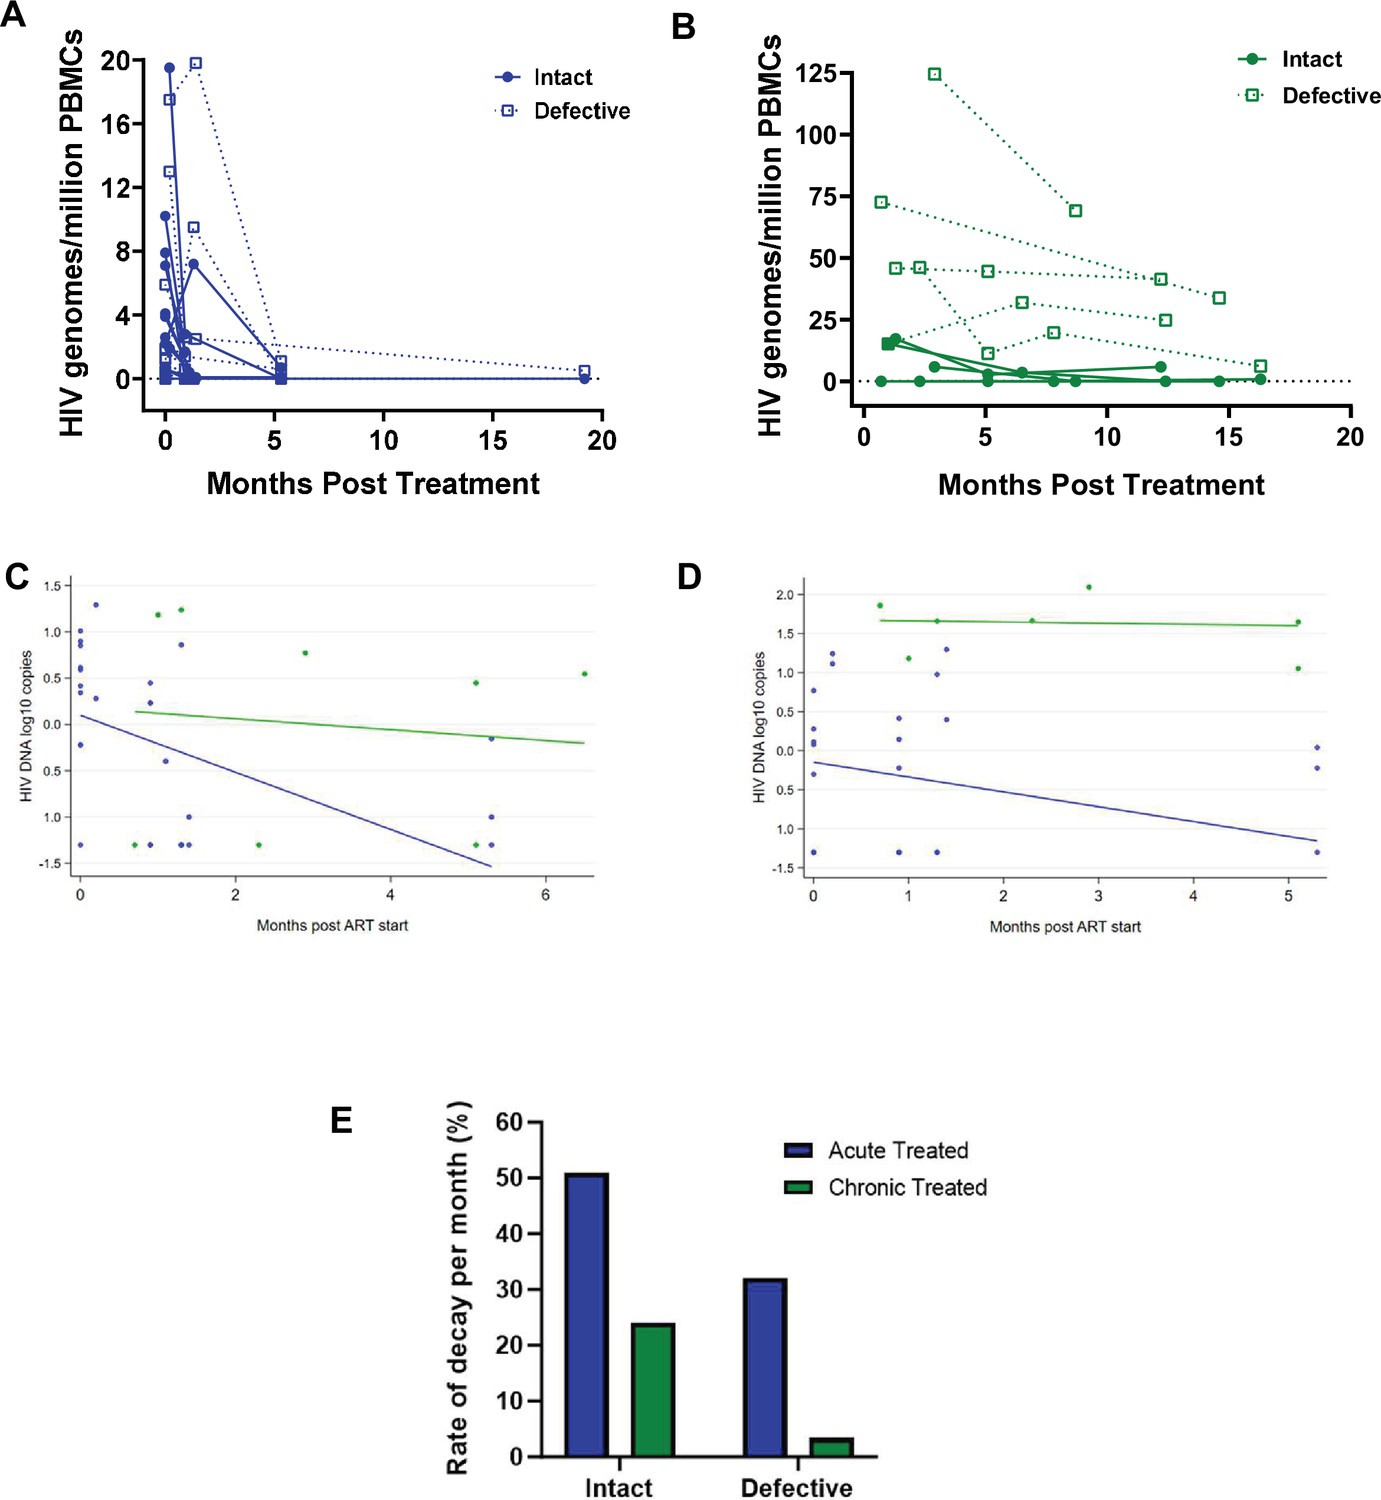
Decay kinetics of intact and defective proviruses.
Absolute frequencies of intact and defective HIV-1 DNA sequences per million peripheral blood mononuclear cells (PBMCs) during the first year of infection following treatment during (A) acute infection and (B) chronic infection. Longitudinal analysis of the change in (C) intact and (D) defective provirus copies in the 6 months after antiretroviral therapy (ART) initiation, comparing the acute treated (blue) and chronic treated (green) groups. Dots represent a measurement from a given participant; solid lines are slopes estimated from linear mixed effect model. (E) Comparison of the monthly rate of decay of intact and defective proviruses in acute and chronic treated infection.
Figure 5
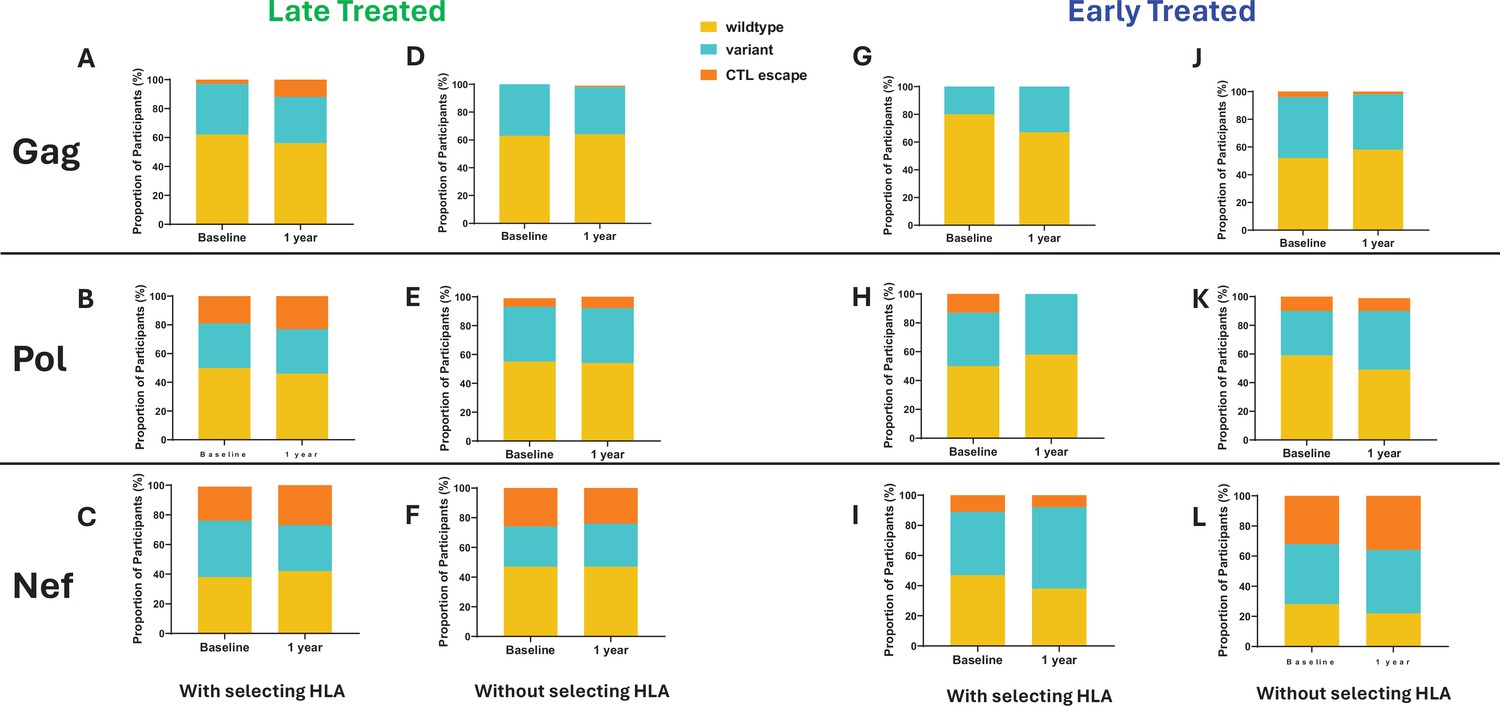
Comparison of cytotoxic T lymphocytes (CTL) epitope diversity in late compared to early treated participants.
Proportion of participants with wildtype, variant, and CTL escape at baseline (within 1 month of infection) and up to 1 year of infection in Gag (A, D, G, J), Pol (B, E, H, K), and Nef (C, F, I, L) epitopes in participants with protective human leukocyte antigen (HLA) genotypes (A, B, C, G, H, I) and without protective HLA genotypes (D, E, F, J, K, L).
Tables
Table 1
Characteristics of study participants.
| Characteristics | Chronic treated (n=11) | Acute treated (n=24) |
|---|---|---|
| Age (years) | 21 (19–24) | 21 (18–24) |
| Sex | ||
| Female, n (%) | 11 (100%) | 24 (100%) |
| Male, n (%) | 0 (0%) | 0 (0%) |
| Race/ethnicity, n (%) | ||
| Black | 11 (100%) | 24 (100%) |
| Fiebig stage I at detection, n (%) | 10 (91%) | 21 (88%) |
| Treatment initiation (DPOV) | 456 (297–1203) | 1 (1-3) |
| Time to suppression (days) | 104 (30–215) | 16 (6–116) |
| CD4 nadir (cells/µl) | 383 (204–502) | 561 (258–859) |
| CD4 pre-infection (cells/µl) | 991 (395–1377) | 872 (573–1612) |
| CD4 at study enrollment (baseline) (cells/µl) | 716 (204–1377) | 863 (421–2075) |
| Peak plasma viral load (log copies/ml) | 7.04 (5.89–7.80) | 4.21 (2–7.30) |
| *Protective HLA allele, n (%) | 6 (55%) | 11 (46%) |
| Treatment regimen containing, n (%) | ||
| FDC | 11 (100%) | 24 (100%) |
| Raltegravir | 0 (0%) | 16 (67%) |
-
*
HLA-B74:01, HLA-B57:02, HLA-B57:03, HLA-B58:01, HLA-B81:01.
Table 2
Multivariate analysis of factors that predict total HIV-1 proviral DNA load after 1 year of treatment.
| Stage at treatment initiation | Variables | Co-efficient | Standard error | t | p-Value | p-Value summary | 95% confidence interval |
|---|---|---|---|---|---|---|---|
| Acute infection | Nadir CD4 | –0.0007424 | 0.00102 | 0.7277 | 0.4773 | ns | –0.002905–0.001420 |
| Pre-infection CD4 | –0.0001861 | 0.0004233 | 0.4395 | 0.6661 | ns | –0.001083–0.0007113 | |
| Baseline* CD4 | 0.0002574 | 0.0003727 | 0.6906 | 0.4997 | ns | –0.0005326–0.001047 | |
| Peak VL | 0.1972 | 0.07938 | 2.485 | 0.0244 | * | 0.02895–0.3655 | |
| Chronic infection | Nadir CD4 | –0.006633 | 0.0007088 | 9.358 | <0.0001 | **** | –0.008367 to –0.004898 |
| Pre-infection CD4 | 0.0002514 | 0.0003896 | 0.6454 | 0.5425 | ns | –0.0007019–0.001205 | |
| Baseline* CD4 | 0.001501 | 0.0002905 | 5.166 | 0.0021 | ** | 0.0007899–0.002211 | |
| Peak VL | 0.2658 | 0.09698 | 2.741 | 0.0337 | * | 0.02848–0.5031 |
-
*
At study enrolment.
Key resources table
| Reagent type (species) or resource | Designation | Source or reference | Identifiers | Additional information |
|---|---|---|---|---|
| Cell line (Homo sapiens, human) | 8E5 LAV cell line (CEM) | NIH HIV Reagent Program | CAT #95, RRID:CVCL_3484 | Served as a positive control for viral genome sequencing |
| Biological sample (Homo sapiens, human) | Human PBMCs | Dong et al., 2018 | FRESH Cohort | Ethics Approval Reference Numbers: BF131/11 and 2012-P001812 |
| Sequence-based reagent | LTR-gag Forward primer | Lee et al., 2019 | ddPCR Primer | TCTCGACGCAGGACTCG |
| Sequence-based reagent | LTR-gag Reverse primer | Lee et al., 2019 | ddPCR Primer | TACTGA CGCTCTCGCACC |
| Sequence-based reagent | LTR-gag probe | Lee et al., 2019 | ddPCR Probe | /56- FAM/CTCTCTCCT/ZEN/TCTAGCCTC/ 31ABkFQ/ |
| Sequence-based reagent | RPP30 forward primer | Lee et al., 2019 | ddPCR Primer | GATTTGGACCTGC GAGCG |
| Sequence-based reagent | RPP30 reverse primer | Lee et al., 2019 | ddPCR Primer | GCGGCTGTCTCCACAAGT |
| Sequence-based reagent | RPP30 probe | Lee et al., 2019 | ddPCR Probe | /56- FAM/ CTGACCTGA/ZEN/AGGCTCT/31ABkFQ/ |
| Sequence-based reagent | U5-623F1 | Lee et al., 2019 | PCR Primer | AAATCTCTAGCAGTGGCGCCCGAACAG |
| Sequence-based reagent | U5-638F2 | Lee et al., 2019 | PCR Primer | GCGCCCGAACAGGGACYTGAAARCGAAAG |
| Sequence-based reagent | U5-547R2 | Lee et al., 2019 | PCR Primer | GCACTCAAGGCAAGCTTTATTGAGGCTTA |
| Sequence-based reagent | U5-601R1 | Lee et al., 2019 | PCR Primer | TGAGGGATCTCTAGTTACCAGAGTC |
| Commercial assay or kit | ddPCR supermix No dTUPs | Bio-Rad | SCR_026079 CAT #1863023 | |
| Commercial assay or kit | ddPCR droplet generator oil | Bio-Rad | SCR_026081 CAT #BBRD1863004 | |
| Commercial assay or kit | ddPCR droplet reader oil | Bio-Rad | SCR_026084 CAT #BBRD1864110 | |
| Commercial assay or kit | DNeasy Blood and Tissue extraction kit | QIAGEN | SCR_026085 CAT #69506 | |
| Commercial assay or kit | Bio-Rad QX200 AutoDG Droplet Digital PCR System | Bio-Rad | RRID:SCR_019714 | |
| Commercial assay or kit | ddPCR supermix No dTUPs | Bio-Rad | SCR_026079 CAT #1863023 | |
| Commercial assay or kit | Platinum Taq DNA Polymerase High Fidelity | Invitrogen | CAT # 11304102 | |
| Software, algorithm | QX Manager Standard edition version 1.2 | Bio-Rad | SCR_026078 | |
| Software, algorithm | HIVSeqinR v2.7.1 | Lee et al., 2019 | Bioinformatics Pipeline | |
| Software, algorithm | GraphPad Prism v10 | GraphPad Software Inc | Graphs and Statistics |
Additional files
-
Supplementary file 1
Clinical and biological characteristics of 35 study participants.
*Deleterious human leukocyte antigen (HLA) class I alleles (red), **protective HLA class I alleles (green).
- https://cdn.elifesciences.org/articles/96617/elife-96617-supp1-v1.xlsx
-
MDAR checklist
- https://cdn.elifesciences.org/articles/96617/elife-96617-mdarchecklist1-v1.pdf
Download links
A two-part list of links to download the article, or parts of the article, in various formats.
Downloads (link to download the article as PDF)
Open citations (links to open the citations from this article in various online reference manager services)
Cite this article (links to download the citations from this article in formats compatible with various reference manager tools)
Differences in HIV-1 reservoir size, landscape characteristics, and decay dynamics in acute and chronic treated HIV-1 Clade C infection
eLife 13:RP96617.
https://doi.org/10.7554/eLife.96617.4


