Released bacterial ATP shapes local and systemic inflammation during abdominal sepsis
- Department of Visceral Surgery and Medicine, Inselspital, Bern University Hospital, University Hospital of Bern, Switzerland
- Department for BioMedical Research, Visceral Surgery and Medicine, University Hospital of Bern, Switzerland
Figures
Figure 1 with 1 supplement
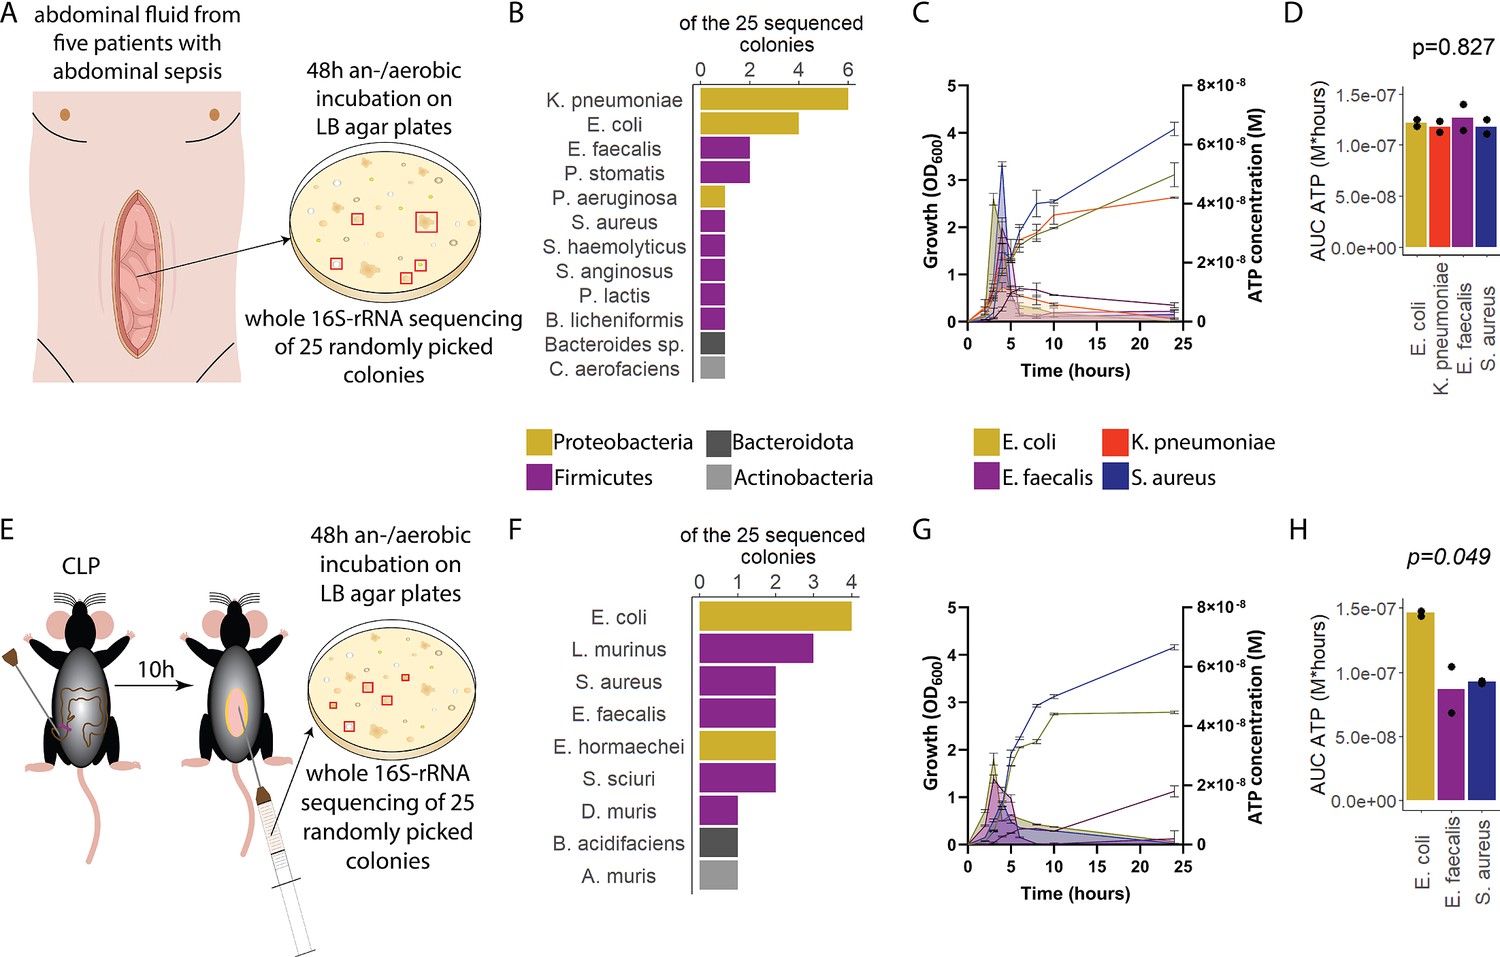
Sepsis-associated bacteria release adenosine triphosphate (ATP) in a growth-dependent manner.
(A) Experimental approach to isolate and cultivate sepsis-associated bacteria from abdominal fluid of patients with abdominal sepsis. (B) Bacterial species identified by whole 16S-rRNA Sanger sequencing from abdominal fluid of patients with abdominal sepsis. Three colonies out of 25 could not be identified. (C) Measurement of released ATP (M) and growth (OD600) over time (hours) from the four sepsis-associated bacteria E. coli, K. pneumoniae, E. faecalis, and S. aureus isolated from patients. N=2 independent bacteria cultures. Means and standard deviations are shown. (D) Area under the curve (AUC) of released ATP over time (M*hours) of the previously assessed bacteria (cumulative ATP). One-way ANOVA, N=2 independent bacteria cultures. Means and individual values are shown. (E) Experimental approach to isolate and cultivate sepsis-associated bacteria from abdominal fluid of mice with abdominal sepsis. (F) Bacterial species identified by whole 16S-rRNA Sanger sequencing from abdominal fluid of mice with abdominal sepsis. Seven colonies out of 25 could not be identified. (G) Measurement of released ATP (M) and growth (OD600) over time (hours) from the three sepsis-associated bacteria E. coli, E. faecalis, and S. aureus isolated from mice. N=2 independent bacteria cultures. Means and standard deviations are shown. (H) AUC of released ATP over time (M*hours) of the previously assessed bacteria (cumulative ATP). One-way ANOVA, N=2 independent bacteria cultures. Means and individual values are shown.
Figure 1—figure supplement 1
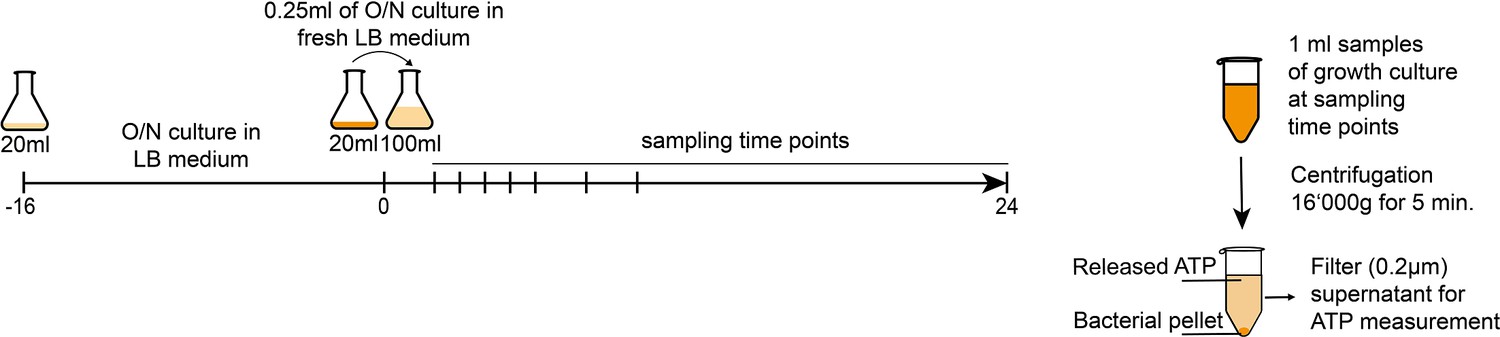
Experimental approach to measure released bacterial adenosine triphosphate (ATP) and growth over time.
Figure 2 with 1 supplement
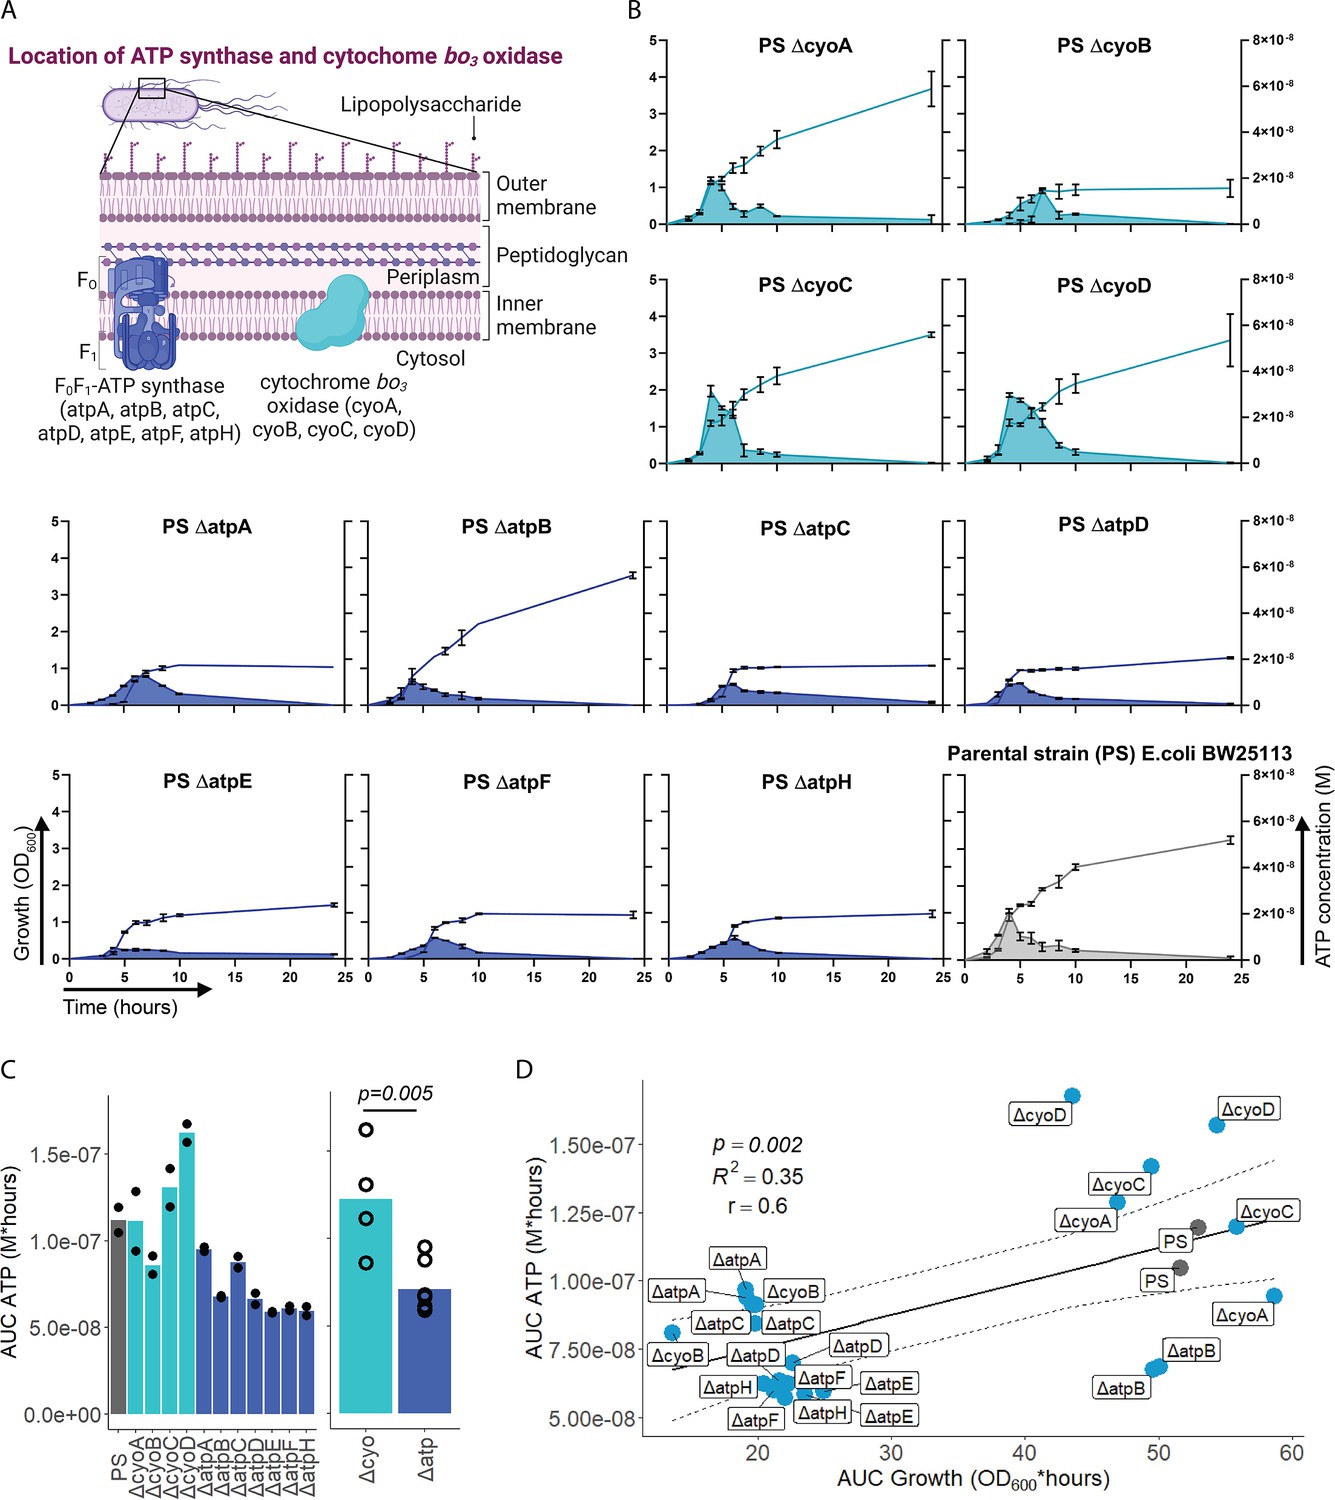
Adenosine triphosphate (ATP) release is dependent on ATP synthesis.
(A) Illustration depicting the location of ATP synthase and cytochrome bo3 oxidase in gramneg bacteria. (B) Measurement of released ATP (M) and growth (OD600) over time (hours) from cytochrome bo3 oxidase (cyo) and ATP synthase (atp) mutants. The parental strain (PS) was added as a control. N=2 independent bacteria cultures. Means and standard deviations are shown. (C) Area under the curve (AUC) of released ATP over time (M*hours) of the previously assessed bacteria (cumulative ATP) is shown individually in the left panel. N=2 independent bacteria cultures. Means and individual values are shown. Means of grouped cyo and atp mutants are compared in the right panel. t-Test. Means and individual values are shown. (D) Cumulative ATP (M*hours) and cumulative growth (OD600*hours) of all assessed cyo and atp mutants and the PS were plotted against each other. Pearson’s correlation (r) and coefficient of determination (R2) of the applied linear model are depicted. 95% confidence level is shown by the black dashed lines.
© 2024, BioRender Inc. Figure 2A was created using BioRender, and is published under a CC BY-NC-ND 4.0. Further reproductions must adhere to the terms of this license
Figure 2—figure supplement 1
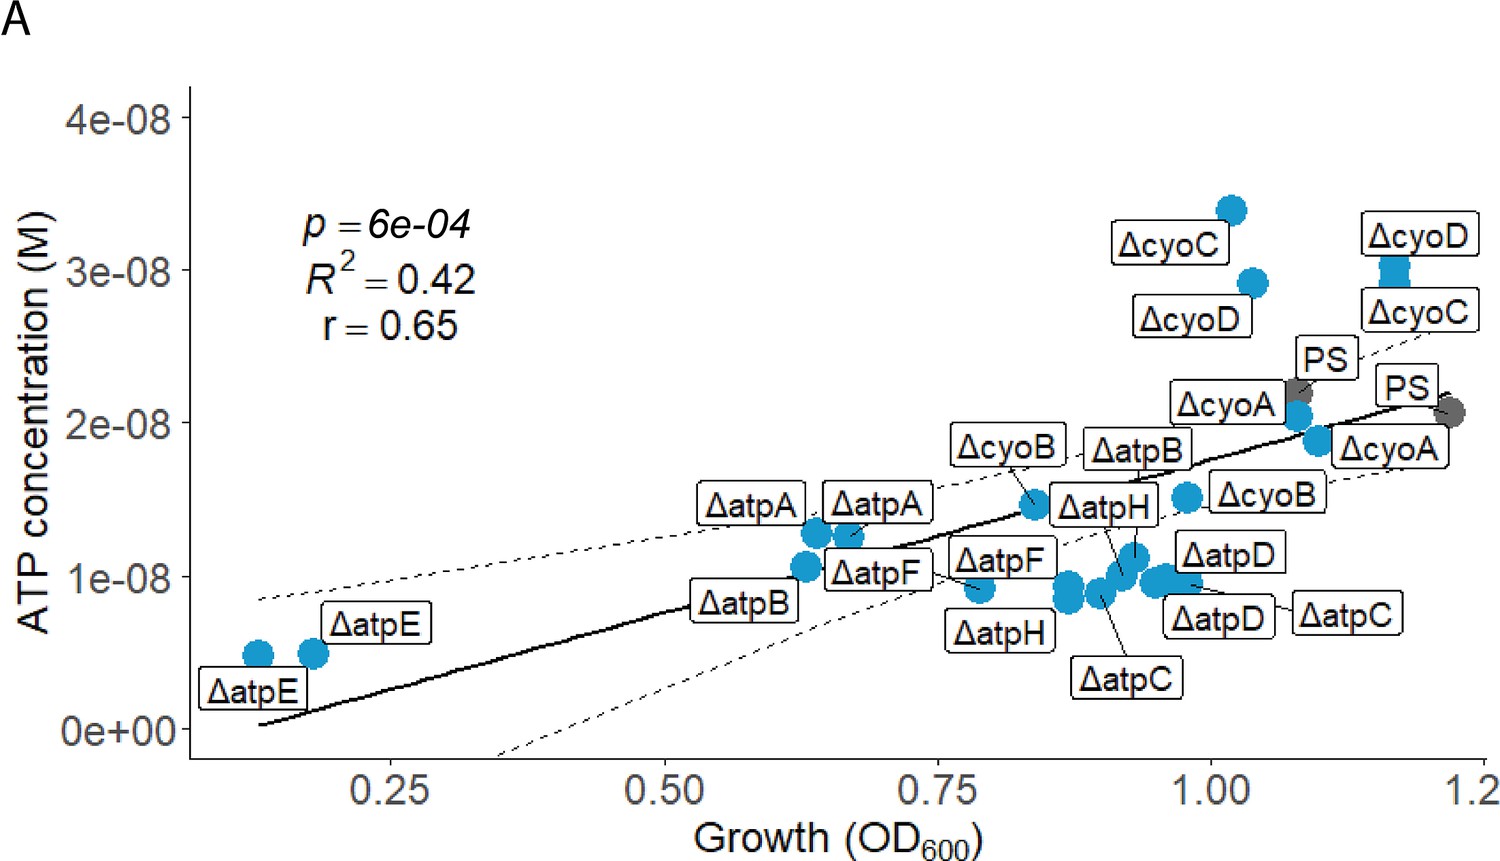
Peak ATP (M) and peak growth (OD600*hours) of all assessed cyo and atp mutants and the PS were plotted against each other.
Pearson’s correlation (r) and coefficient of determination (R2) of the applied linear model are depicted. 95% confidence level is shown by the black dashed lines.
Figure 3
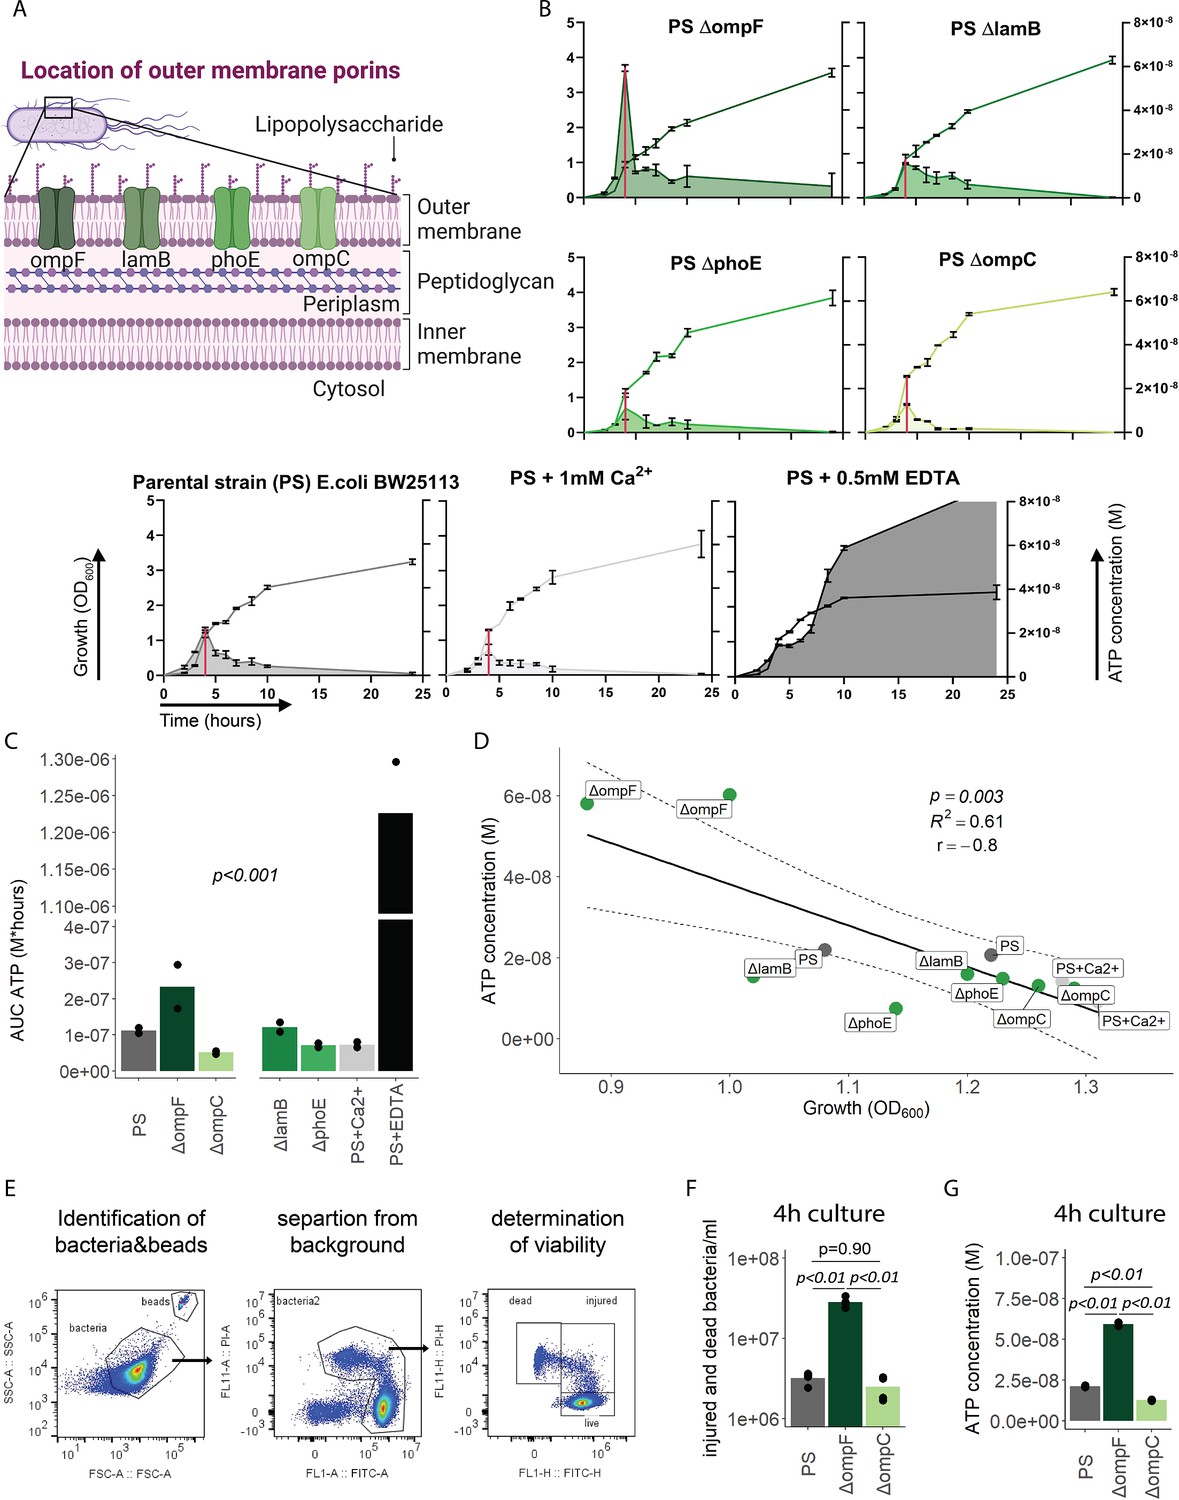
Outer membrane integrity and bacterial death determine bacterial adenosine triphosphate (ATP) release during growth.
(A) Illustration depicting the location of outer membrane porins in gramneg bacteria. (B) Measurement of released ATP (M) and growth (OD600) over time (hours) from outer membrane porin mutants. The parental strain (PS) and the PS supplemented with either 1 mM Ca2+ or 0.5 mM EDTA were added as controls. N=2 independent bacteria cultures. Means and standard deviations are shown. The red line marks the individual peak of ATP release and growth (OD600) at that time point. (C) Area under the curve (AUC) of released ATP over time (M*hours) of the previously assessed bacteria (cumulative ATP). One-way ANOVA, N=2 independent bacteria cultures. Means and individual values are shown. (D) ATP concentration (M) and growth (OD600) at the individual peak of ATP release of all assessed outer membrane porin mutants, the PS, and the PS+Ca2+ (no peak for the EDTA control) were plotted against each other. Pearson’s correlation (r) and coefficient of determination (R2) of the applied linear model are depicted. 95% confidence level is shown by the black dashed lines. (E) Gating strategy to identify added counting beads, live, injured, and dead bacteria. (F) Quantitative assessment of injured and dead bacteria, as identified by flow cytometry after 4 hr of culturing (ATP peak) of the PS, ΔompF and ΔompC. One-way ANOVA followed by Tukey post hoc test, N=4 independent bacteria cultures. Means and individual values are shown. (G) ATP concentration (M) after 4 hr of culturing (ATP peak) of the PS, ΔompF and ΔompC. One-way ANOVA followed by Tukey post hoc test, N=2 independent bacteria cultures. Means and individual values are shown.
© 2024, BioRender Inc. Figure 3A was created using BioRender, and is published under a CC BY-NC-ND 4.0. Further reproductions must adhere to the terms of this license
Figure 4 with 1 supplement
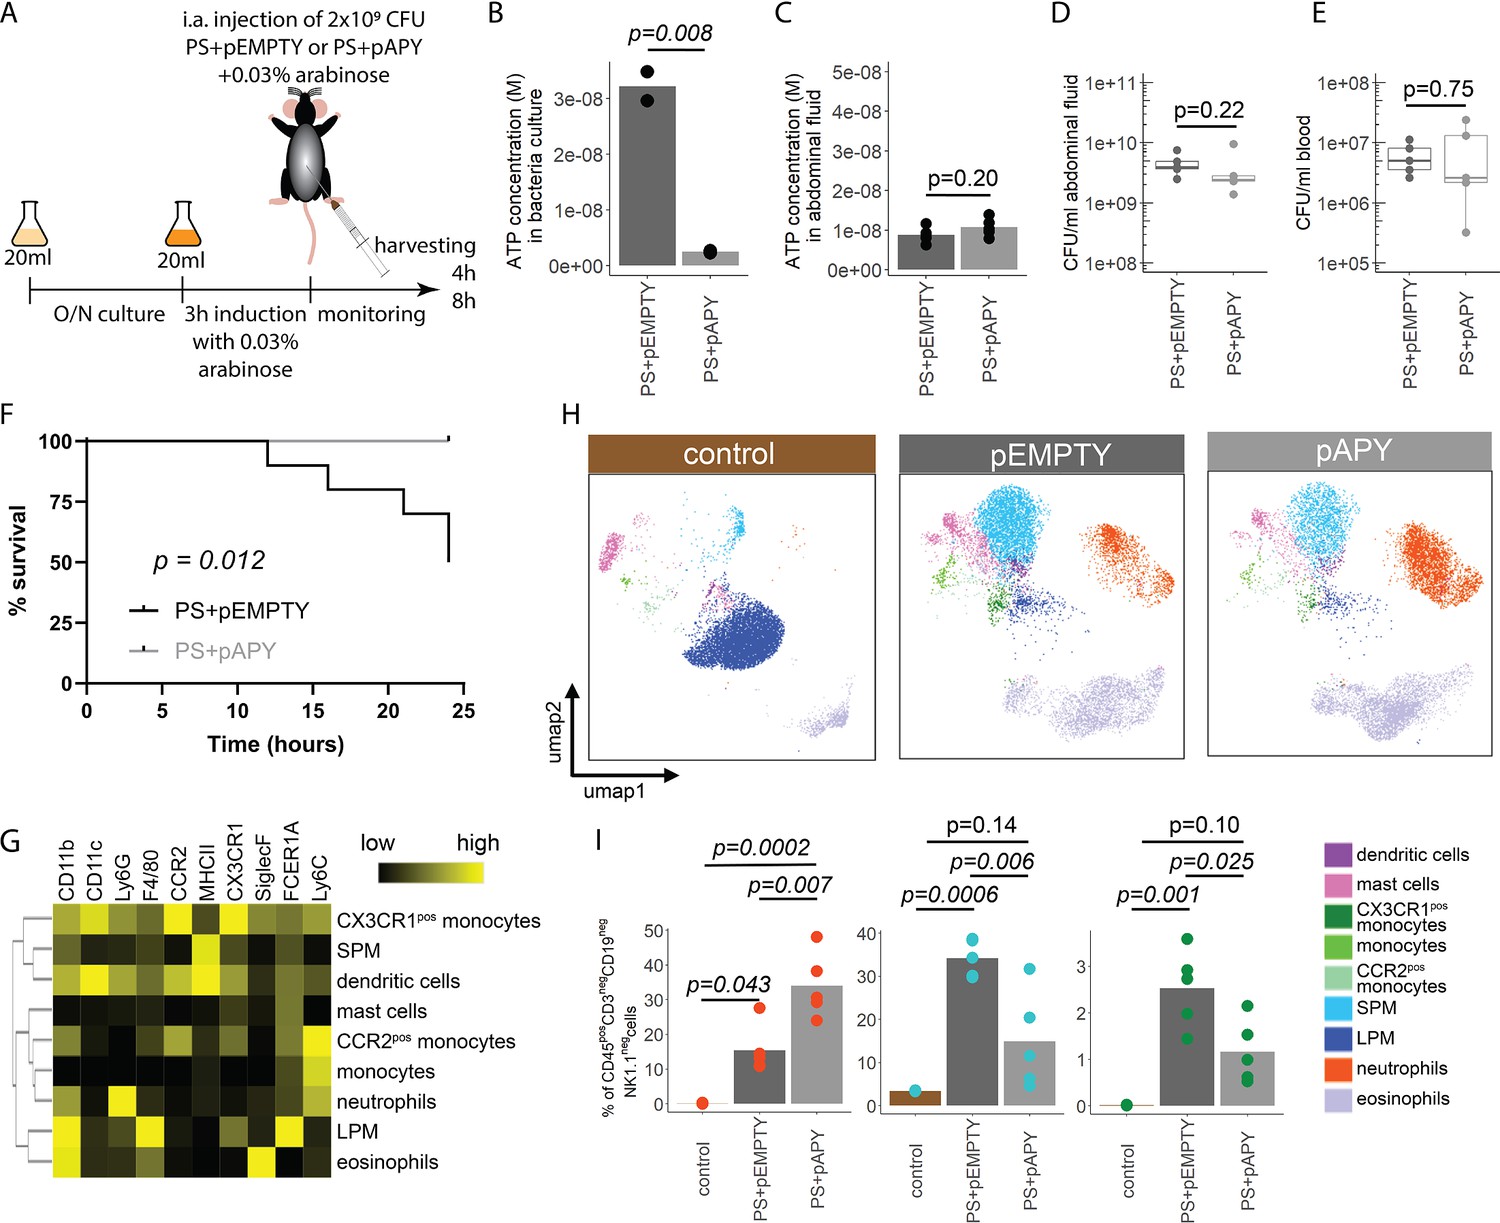
Bacterial adenosine triphosphate (ATP) reduces neutrophil counts and impairs sepsis outcome in vivo.
(A) Experimental approach to determine the local role of bacterial ATP in vivo, intraabdominal (i.a.) injecting parental strain (PS)+pEMPTY or PS+pAPY. (B) Measurement of released ATP (M) in bacteria culture supernatant immediately before bacteria were i.a. injected. t-Test, N=2 independent bacteria cultures. Means and individual values are shown. (C) Measurement of ATP (M) in abdominal fluid from mice 4 hr after i.a. injection of bacteria. t-Test, n=5 animals per group of N=2 independent experiments. Means and individual values are shown. (D) Quantitative assessment of colony forming units in abdominal fluid and (E) blood from mice 4 hr after i.a. injection of bacteria. Wilcoxon rank-sum test, n=5 animals per group of N=2 independent experiments. Means and individual values are shown. No growth for controls was detected. (F) Kaplan-Meier curves of mice after i.a. injection of bacteria. Log-rank test, n=10 animals per group. (G) Heatmap showing surface marker expression (x-axis), which was used to characterize the different immune cell populations (y-axis). (H) Concatenated (n=5 animals for each treatment group, n=3 animals for control group of N=2 independent experiments) and down-sampled images of immune cell populations characterized in the abdominal cavity 4 hr after sham treatment or i.a. injection of bacteria. (I) Abundance of neutrophils, small peritoneal macrophages (SPM), and CX3CR1pos monocytes in abdominal fluid from mice 4 hr after sham treatment or i.a. injection of bacteria. One-way ANOVA followed by Tukey post hoc test, n=5 animals for each treatment group, n=3 animals for control group of N=2 independent experiments. Means and individual values are shown.
Figure 4—figure supplement 1
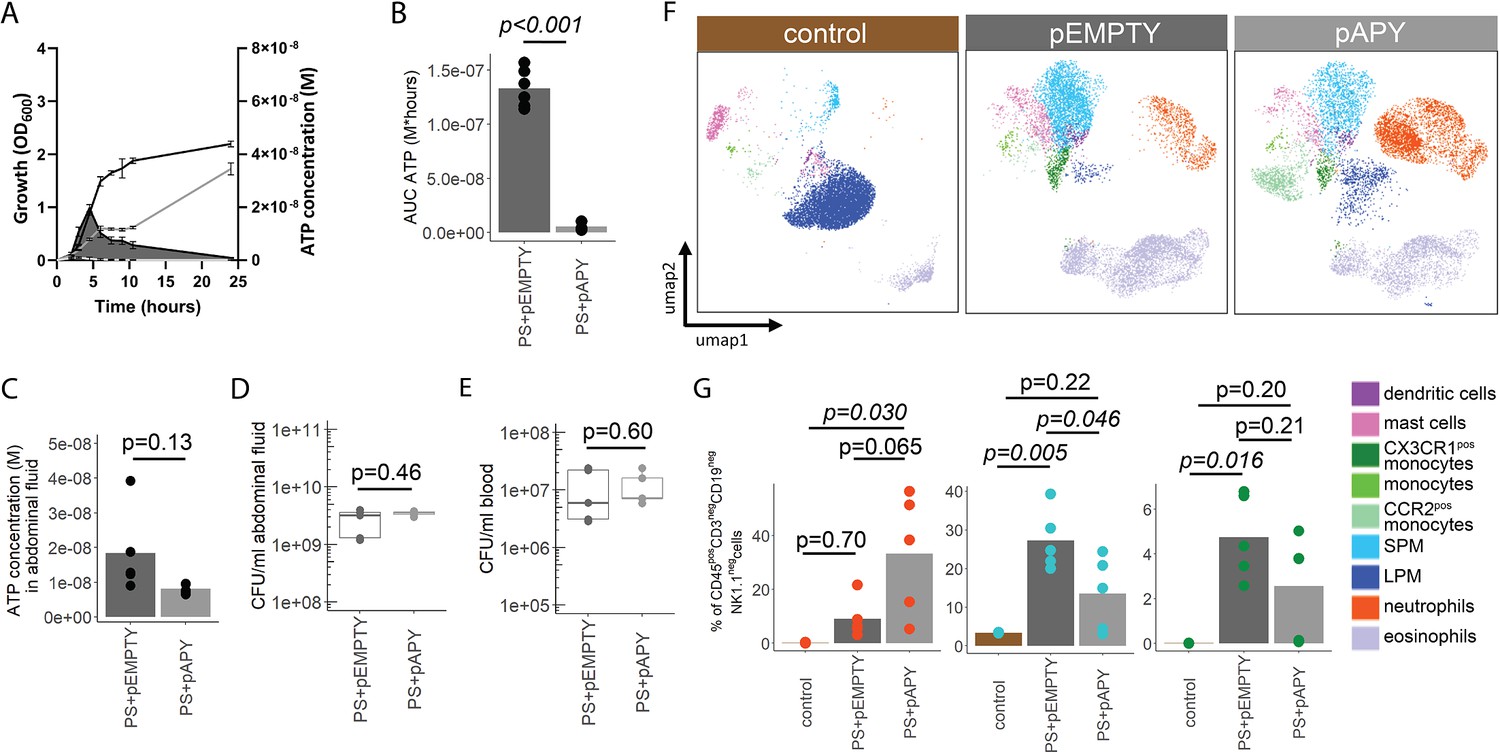
Immune cell characterization 8 hr after intraabdominal (i.a.) injection of bacteria.
(A) Measurement of released adenosine triphosphate (ATP) (M) and growth (OD600) over time (hours) from parental strain (PS)+pEMPTY and PS+pAPY. n=2 measurements of N=3 independent bacteria cultures. Means and standard deviations are shown. (B) Area under the curve (AUC) of released ATP over time (M*hours) of the previously assessed bacteria (cumulative ATP). t-Test, n=2 measurements of N=3 independent bacteria cultures. Means and individual values are shown. (C) Measurement of ATP (M) in abdominal fluid from mice 8 hr after i.a. injection of bacteria. t-Test, n=5 animals per group of N=2 independent experiments. Means and individual values are shown. (D) Quantitative assessment of colony forming units in abdominal fluid and (E) blood from mice 8 hr after i.a. injection of bacteria. Wilcoxon rank-sum test, n=5 animals per group of N=2 independent experiments. Means and individual values are shown. No growth for controls was detected. (F) Concatenated (n=5 animals for each treatment group, n=3 animals for control group of N=2 independent experiments) and down-sampled images of immune cell populations characterized in the abdominal cavity 8 hr after sham treatment or i.a. injection of bacteria. (G) Abundance of neutrophils, small peritoneal macrophages (SPM), and CX3CR1pos monocytes in abdominal fluid from mice 8 hr after sham treatment or i.a. injection of bacteria. One-way ANOVA followed by Tukey post hoc test, n=5 animals for each treatment group, n=3 animals for control group of N=2 independent experiments. Means and individual values are shown.
Figure 5 with 1 supplement
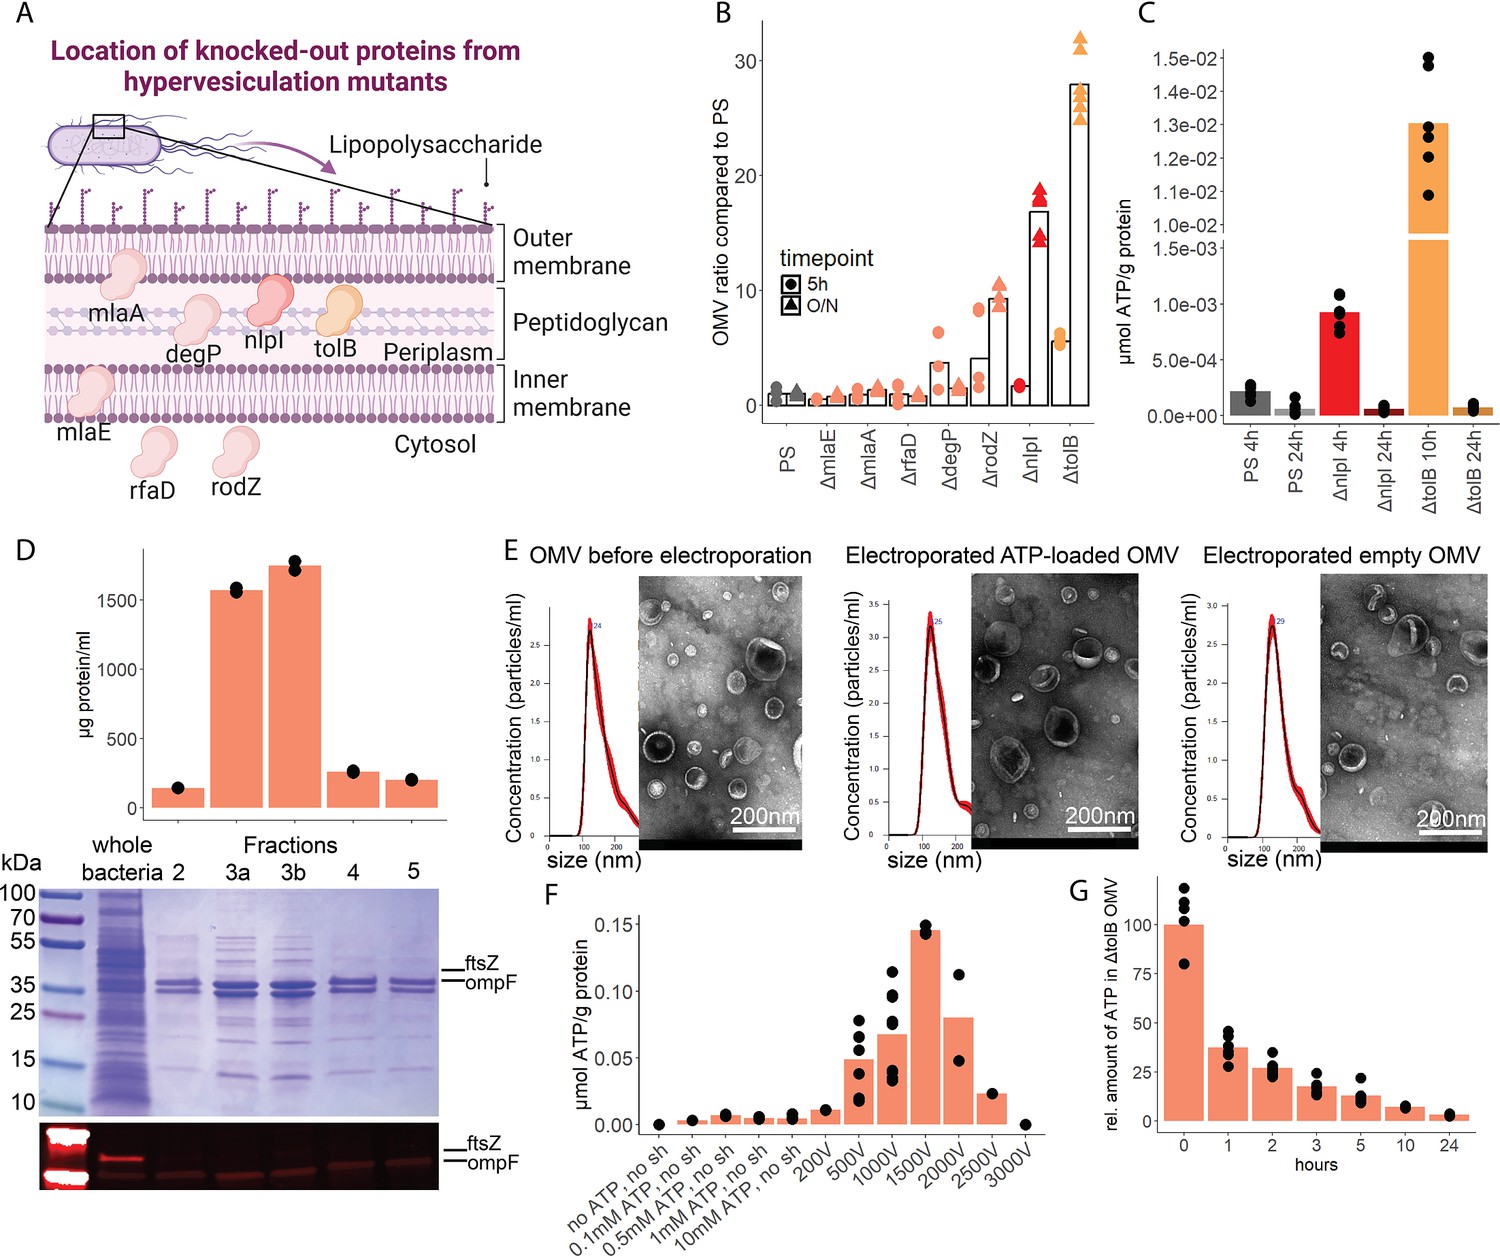
Outer membrane vesicles (OMV) contain adenosine triphosphate (ATP) and can be exploited as a model to assess the systemic relevance of bacterial ATP.
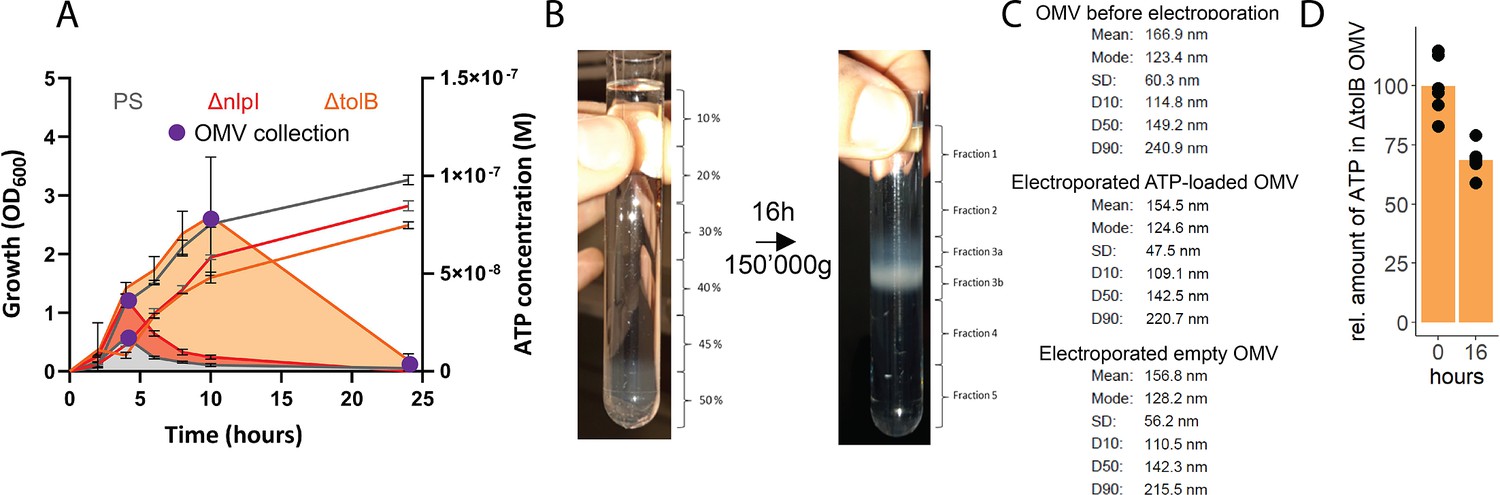
(A) Illustration depicting the location of assessed proteins that lead to a hypervesiculation phenotype if knocked out in the gramneg bacterium E. coli. (B) Relative amount of OMV compared to the parental strain (PS) isolated from growth cultures of the assessed hypervesiculation mutants after 5 hr (exponential growth phase) and O/N (stationary phase). n=2 measurements of N=3 independent bacteria cultures. Means and individual values are shown. (C) Absolute quantification of ATP in OMV isolated from growth cultures of the PS, ΔnlpI and ΔtolB at their individual peak of ATP release and after 24 hr. n=2 measurements of N=3 independent bacteria cultures. Means and individual values are shown. (D) Amount of protein (BCA assay) detected in different fractions after density gradient ultracentrifugation. n=2 measurements of the different fractions. 20 µl of E. coli growth culture and 20 µl of each fraction were then characterized by Coomassie blue staining and specific detection of outer membrane ompF and cytoplasmic ftsZ. (E) Characterization of OMV by nanoparticle tracking analysis (n=5 measurements per sample) and electron microscopy (representative image) before and after electroporation. (F) Absolute quantification of ATP in OMV, which were loaded using different strategies. Columns 2–5: different concentrations of ATP incubated for 1 hr at 37°C (passive filling). Columns 6–12: different voltages with fixed settings for resistance (100 Ω) and capacitance (50 µF). N=2–9 independent experiments. Means and standard deviations are shown. (G) Relative quantification of ATP in OMV over 24 hr at 37°C after electroporation (0 hr=100%). n=2 measurements of N=3 independent experiments. Means and individual values are shown.
© 2024, BioRender Inc. Figure 5A was created using BioRender, and is published under a CC BY-NC-ND 4.0. Further reproductions must adhere to the terms of this license
Figure 5—figure supplement 1
Adenosine triphosphate (ATP) measurement of the parental strain (PS), ΔnlpI as well as ΔtolB and outer membrane vesicle (OMV) collection and characterization.
(A) Measurement of released ATP (M) and growth (OD600) over time (hours) from PS, ΔnlpI and ΔtolB. OMV collection time points are marked in purple. n=2 measurements of N=3 independent bacteria cultures. Means and standard deviations are shown. (B) OMV before and after density gradient ultracentrifugation for 16 hr at 150,000×g. (C) Statistical parameters of OMV before electroporation as well as ATP-loaded and empty OMV after electroporation. (D) Relative quantification of ATP in OMV 16 hr at 4°C after electroporation (0 hr=100%). n=2 measurements of N=3 independent experiments. Means and individual values are shown.
Figure 6 with 5 supplements
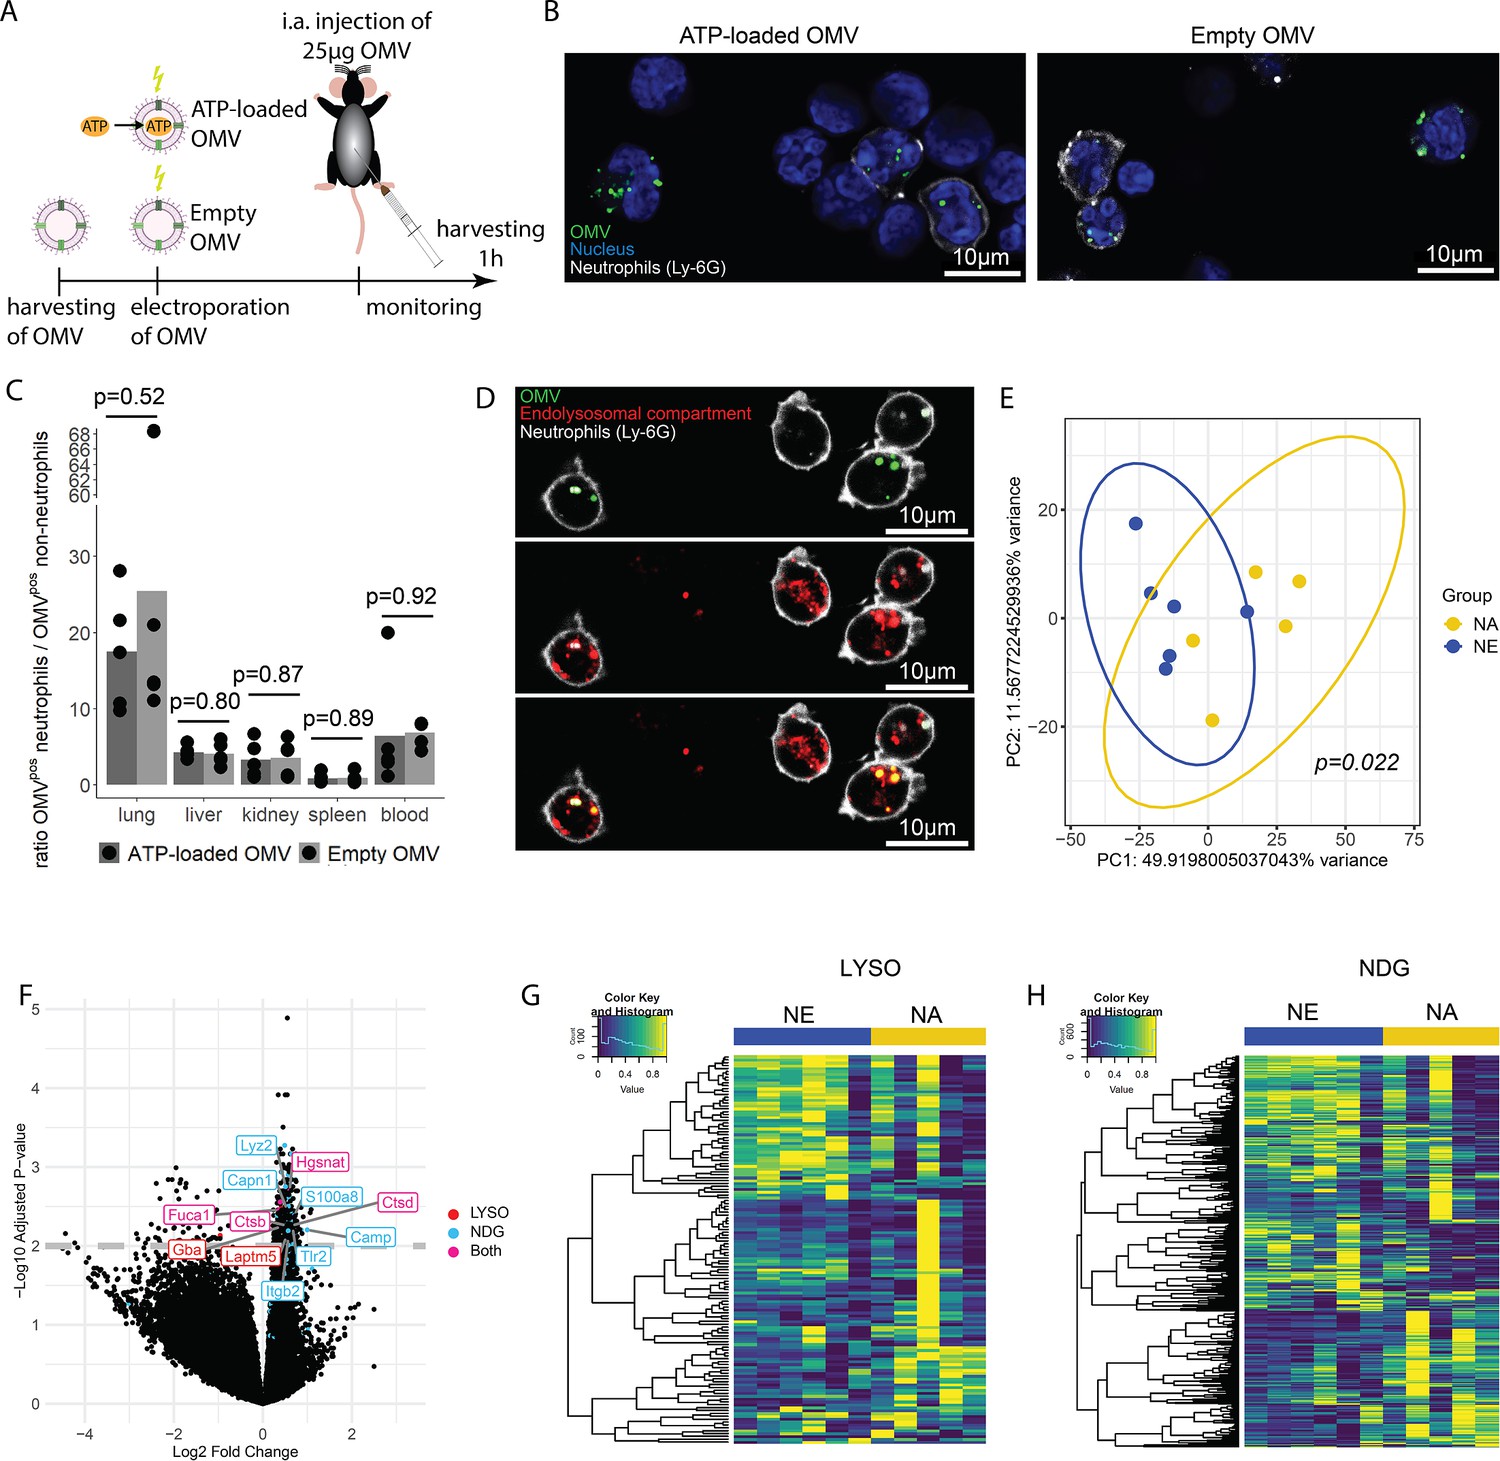
Bacterial adenosine triphosphate (ATP) within outer membrane vesicles (OMV) upregulates lysosome-related pathways and degranulation processes in neutrophils.
(A) Experimental approach to determine the systemic role of bacterial ATP in vivo, intraabdominal (i.a.) injecting ATP-loaded or empty OMV. (B) Representative microscopic images of cells from the abdominal cavity 1 hr after i.a. injection of either ATP-loaded or empty OMV. OMV: DiI, Nucleus: DAPI, Neutrophils: Ly-6G-FITC. (C) Cells from remote organs were isolated 1 hr after i.a. injection of either ATP-loaded or empty OMV. OMV were mainly taken up by neutrophils (except in the spleen, ratio ≈ 1). t-Test with Benjamini-Hochberg correction, n=5 animals per group of N=2 independent experiments. Means and individual values are shown. (D) Representative microscopic image of pulmonary neutrophils 1 hr after i.a. injection of either ATP-loaded or empty OMV. OMV co-localize with the endolysosomal compartment. OMV: DiI, Endolysosomal system: LysoTracker Deep Red, Neutrophils: Ly-6G-FITC. (E) Pulmonary neutrophils were isolated 1 hr after i.a. injection of ATPγs-loaded or empty OMV, bead-sorted, and RNA sequencing was done. Principal component analysis shows significantly different clustering between neutrophils that took up ATPγs-loaded (NA) or empty OMV (NE). PERMANOVA, n=6 animals in the NE group, n=5 animals in the NA group. Ellipses represent 95% confidence level. (F) Volcano plot of RNA sequencing results shows an upregulation of genes mainly in the NA group. Genes classified in either lysosome (LYSO) or neutrophil degranulation pathways (NDG) or both, which were mentioned in the text, were highlighted. (G) Heatmap of the lysosome pathway (LYSO) showing the gene expression per sample. (H) Heatmap of the neutrophil degranulation pathway (NDG) showing the gene expression per sample.
Figure 6—figure supplement 1
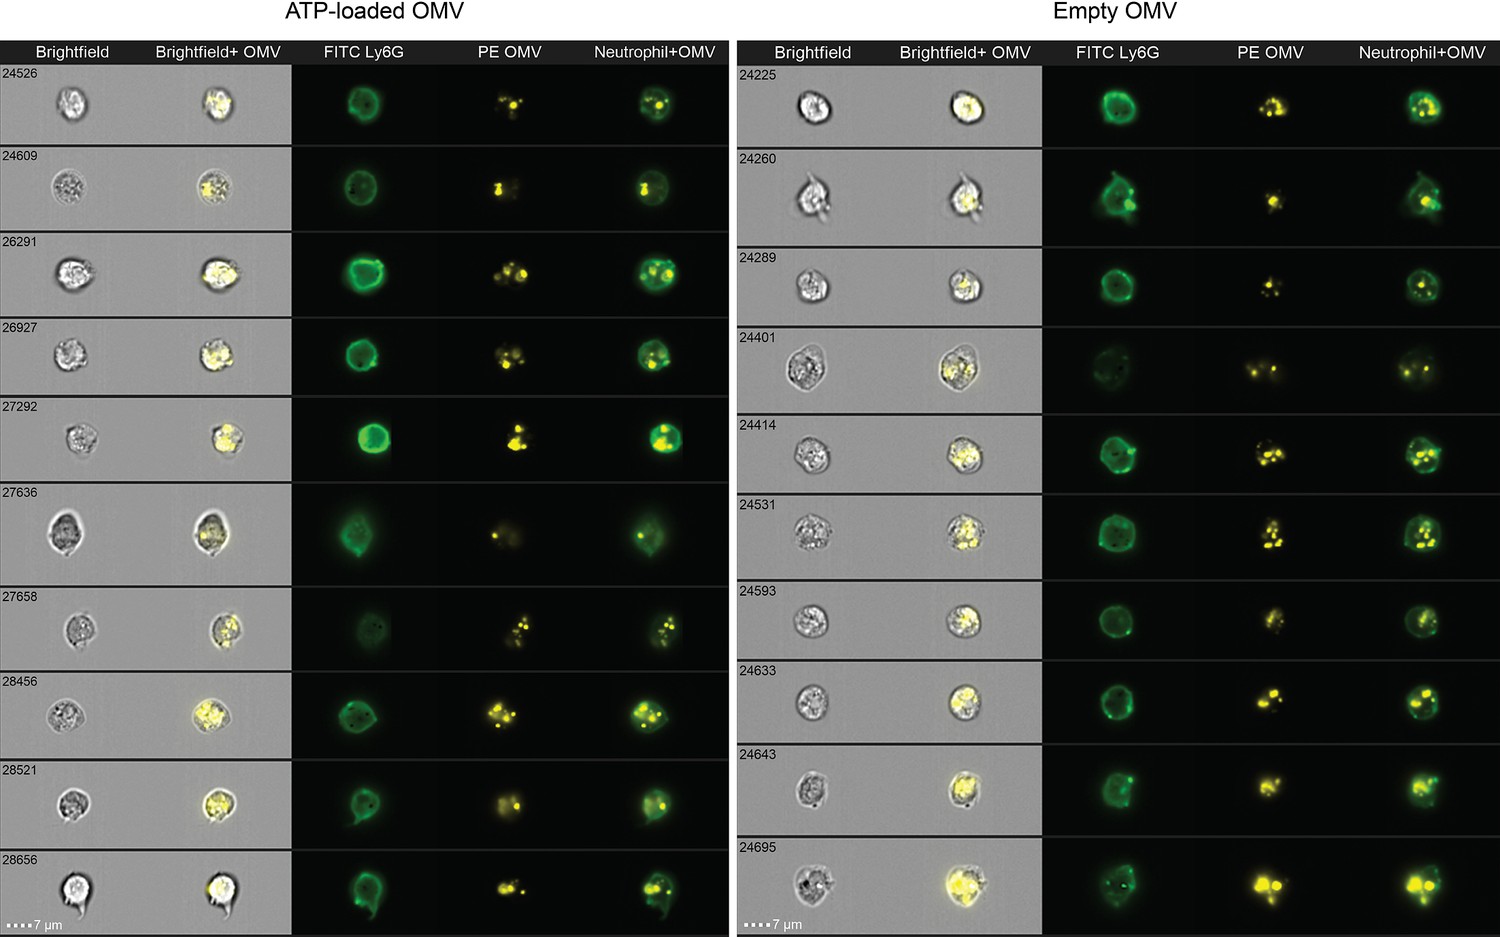
Uptake of outer membrane vesicles (OMV) by neutrophils.
Representative images of OMV uptake by neutrophils in the abdominal cavity 1 hr after intraabdominal (i.a.) injection additionally assessed using flow cytometry (ImageStream).
Figure 6—figure supplement 2
Characterization of local immune response in the abdominal cavity.
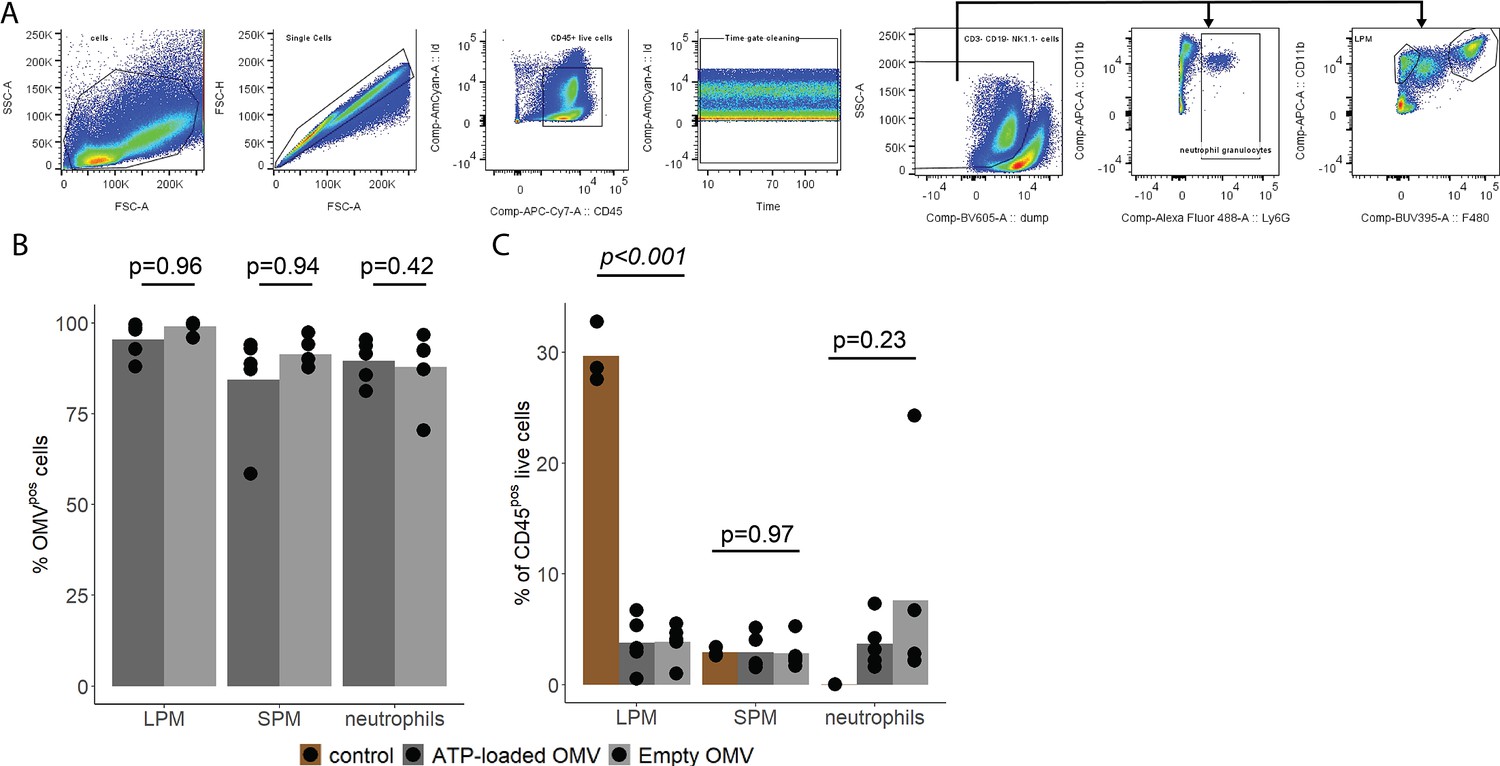
(A) Gating strategy to identify large peritoneal macrophages (LPM), small peritoneal macrophages (SPM), and neutrophils in abdominal fluid. (B) Abundance of OMVpos/(OMVpos+OMVneg) LPM, SPM, and neutrophils 1 hr after intraabdominal (i.a.) injection of adenosine triphosphate (ATP)-loaded or empty OMV. t-Test with Benjamini-Hochberg correction, n=5 animals per group of N=2 independent experiments. Means and individual values are shown. (C) Abundance of LPM, SPM, and neutrophils 1 hr after sham treatment or i.a. injection of either ATP-loaded or empty OMV. One-way ANOVA, n=5 animals for each treatment group, n=3 animals for control group of N=2 independent experiments. Means and individual values are shown.
Figure 6—figure supplement 3
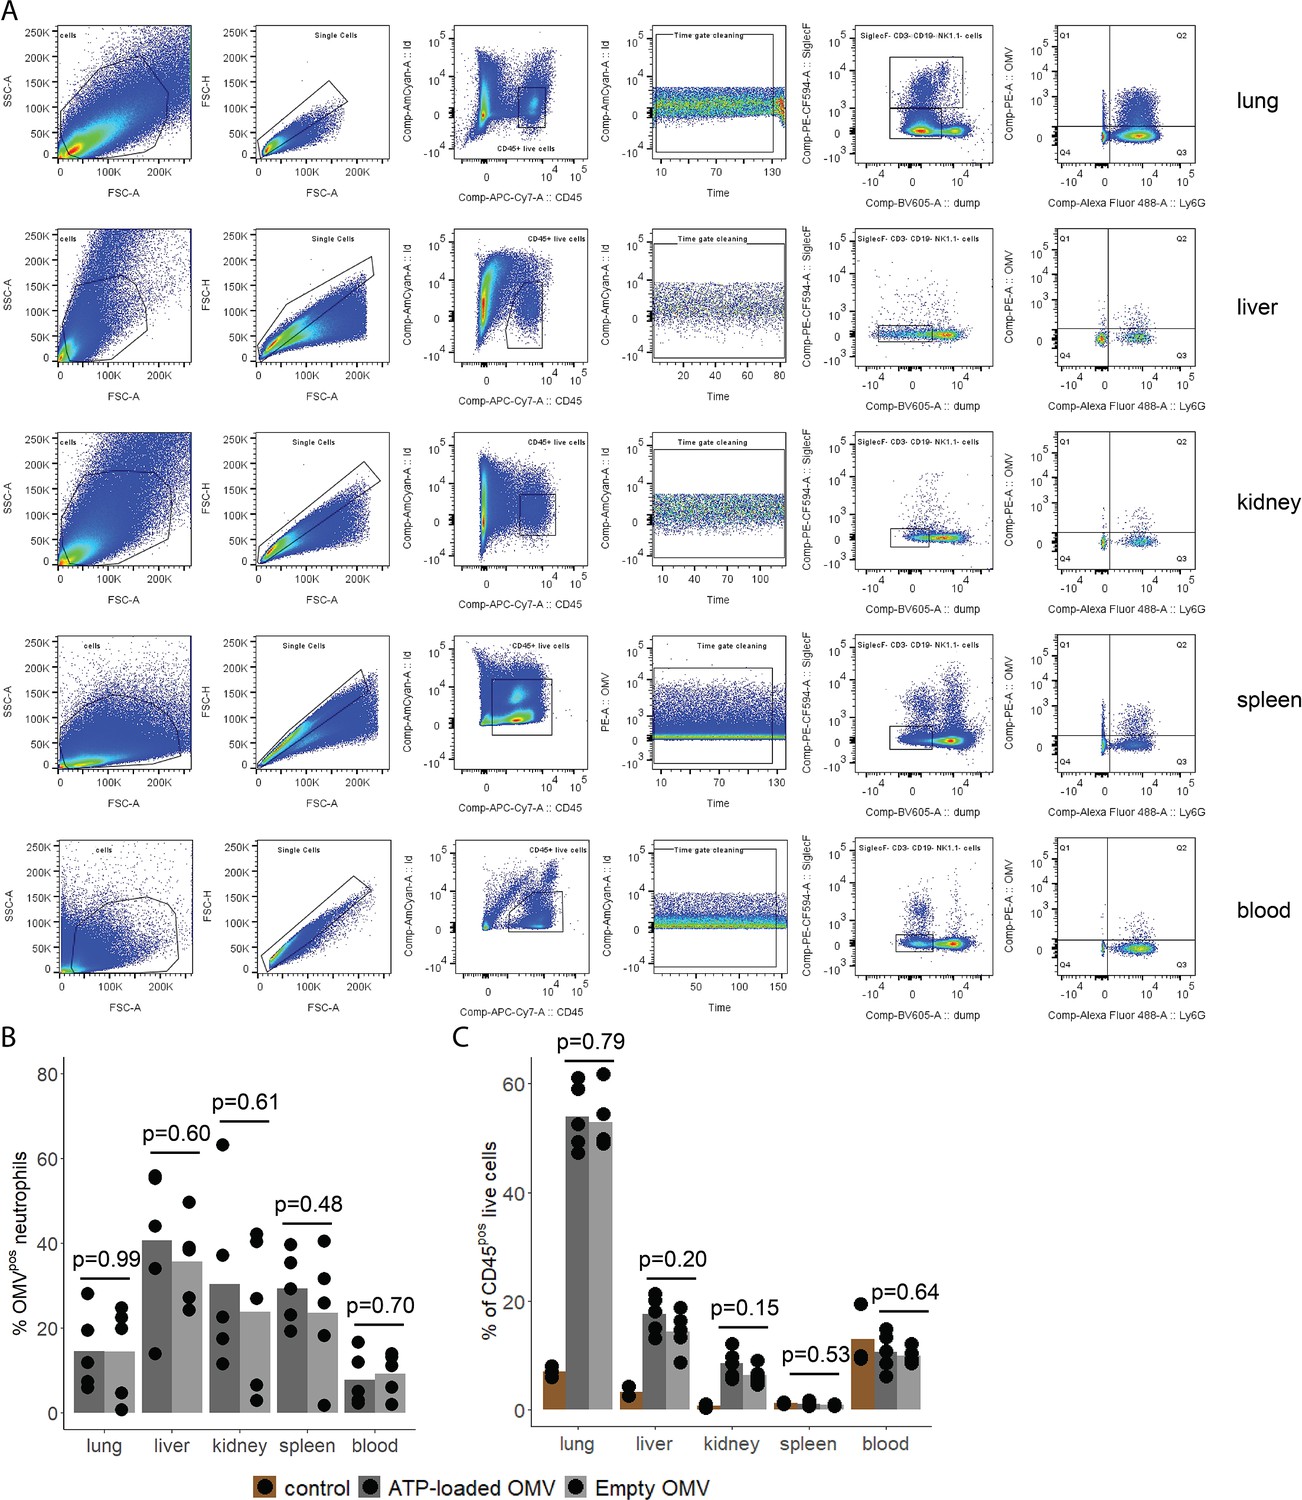
Assessment of outer membrane vesicle (OMV) uptake by immune cells in remote organs.
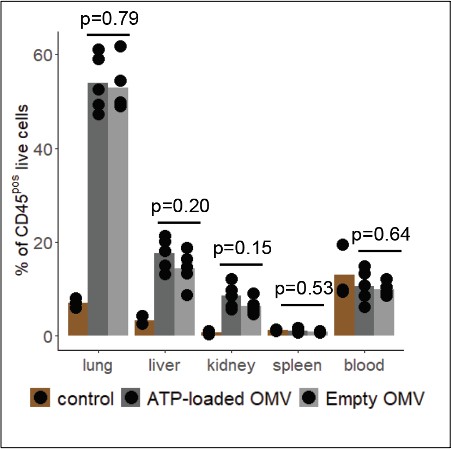
(A) Gating strategy to identify total OMVpos cells and specifically OMVpos neutrophils in blood and remote organs (lung, liver, kidney, and spleen). (B) Fraction of OMVpos/(OMVpos+OMVneg) neutrophils 1 hr after intraabdominal (i.a.) injection of adenosine triphosphate (ATP)-loaded or empty OMV. t-Test, n=5 animals per group of N=2 independent experiments. Means and individual values are shown. (C) Fraction of % of CD45poslive cells 1 hr after intraabdominal (i.a.) injection of adenosine triphosphate (ATP)-loaded or empty OMV including control without OMV injection. t-Test, n=5 animals per group of N=2 independent experiments. Means and individual values are shown.
Figure 6—figure supplement 4
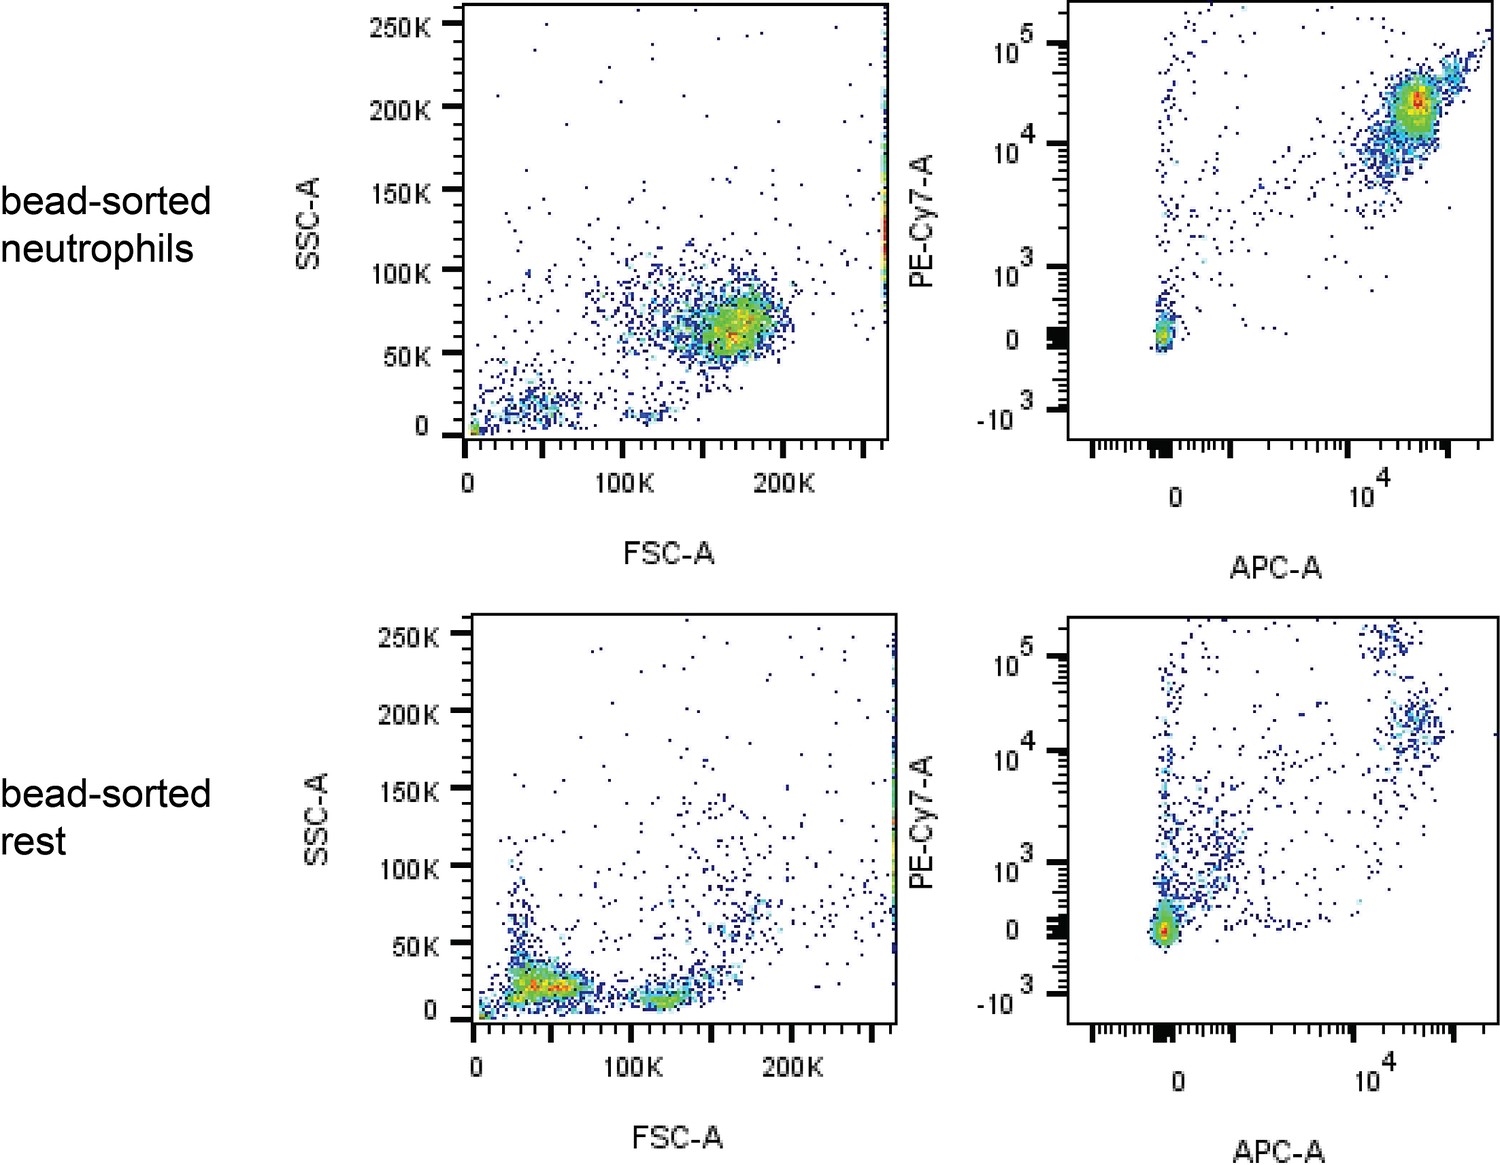
Assessment of the purity of bead-sorted pulmonary neutrophils.
Pulmonary neutrophils were isolated 1 hr after i.a. injection of ATPγs-loaded or empty outer membrane vesicle (OMV), bead-sorted and assessed for purity by flow cytometry. A representative image is shown.
Figure 6—figure supplement 5
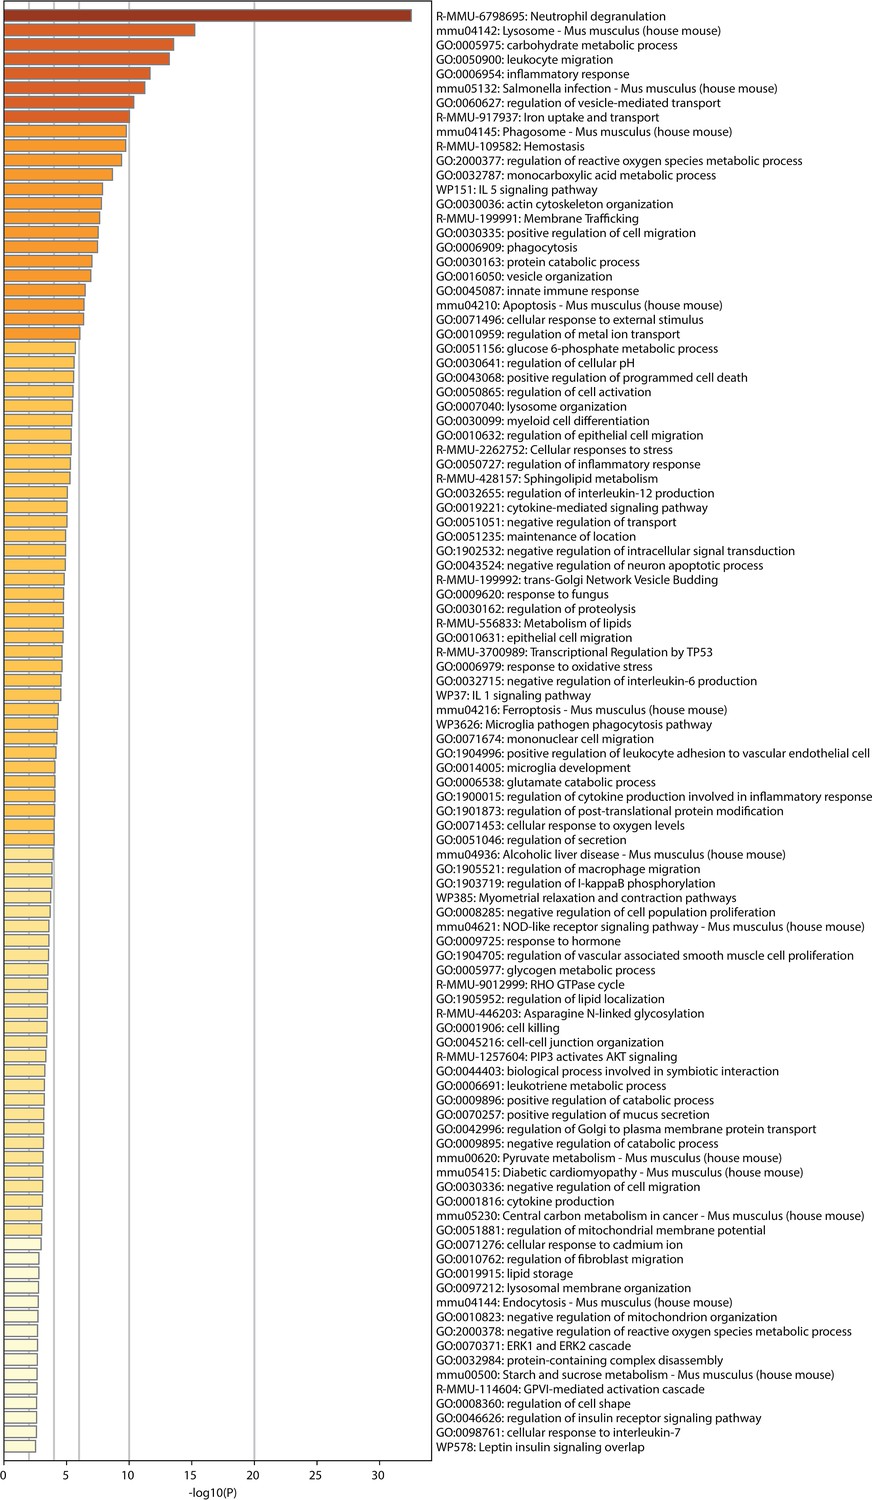
List of significantly different pathways after enrichment analysis of RNA sequencing results.
Pulmonary neutrophils were isolated 1 hr after intraabdominal (i.a.) injection of ATPγs-loaded or empty outer membrane vesicle (OMV), bead-sorted, and RNA sequencing was done. This resulted in these significantly different pathways between the groups after enrichment analysis. DESeq, n=6 animals in the NE group, n=5 animals in the NA group.
Author response image 1
Author response image 2

Tables
Appendix 1—key resources table
| Reagent type (species) or resource | Designation | Source or reference | Identifiers | Additional information |
|---|---|---|---|---|
| Strain, strain background (Mus musculus, female) | Wild-type mice | Inotiv, the Netherlands | C57Bl/6JRccHsd | |
| Strain, strain background (Enterococcus faecalis) | Iso1 | This paper | NA | See Materials and methods: Human data |
| Strain, strain background (Escherichia coli) | Iso2 | This paper | NA | See Materials and methods: Human data |
| Strain, strain background (Klebsiella pneumoniae) | Iso3 | This paper | NA | See Materials and methods: Human data |
| Strain, strain background (Staphylococcus aureus) | Iso4 | This paper | NA | See Materials and methods: Human data |
| Strain, strain background (E. faecalis) | Iso5 | This paper | NA | See Materials and methods: CLP sepsis model |
| Strain, strain background (E. coli) | Iso6 | This paper | NA | See Materials and methods: CLP sepsis model |
| Strain, strain background (S. aureus) | Iso7 | This paper | NA | See Materials and methods: CLP sepsis model |
| Strain, strain background (E. coli) | Parental strain (PS) | Keio collection; Baba et al., 2006 | BW25113 | |
| Strain, strain background (E. coli) | ΔcyoA | Keio collection; Baba et al., 2006 | JW0422-1 | See Figure 2 |
| Strain, strain background (E. coli) | ΔcyoB | Keio collection; Baba et al., 2006 | JW0421-1 | See Figure 2 |
| Strain, strain background (E. coli) | ΔcyoC | Keio collection; Baba et al., 2006 | JW0420-1 | See Figure 2 |
| Strain, strain background (E. coli) | ΔcyoD | Keio collection; Baba et al., 2006 | JW0419-1 | See Figure 2 |
| Strain, strain background (E. coli) | ΔatpA | Keio collection; Baba et al., 2006 | JW3712-1 | See Figure 2 |
| Strain, strain background (E. coli) | ΔatpB | Keio collection; Baba et al., 2006 | JW3716-1 | See Figure 2 |
| Strain, strain background (E. coli) | ΔatpC | Keio collection; Baba et al., 2006 | JW3709-2 | See Figure 2 |
| Strain, strain background (E. coli) | ΔatpD | Keio collection; Baba et al., 2006 | JW3710-1 | See Figure 2 |
| Strain, strain background (E. coli) | ΔatpE | Keio collection; Baba et al., 2006 | JW3715-1 | See Figure 2 |
| Strain, strain background (E. coli) | ΔatpF | Keio collection; Baba et al., 2006 | JW3714-2 | See Figure 2 |
| Strain, strain background (E. coli) | ΔatpH | Keio collection; Baba et al., 2006 | JW3713-1 | See Figure 2 |
| Strain, strain background (E. coli) | ΔompF | Keio collection; Baba et al., 2006 | JW0912-1 | See Figure 3 |
| Strain, strain background (E. coli) | ΔompC | Keio collection; Baba et al., 2006 | JW2203-1 | See Figure 3 |
| Strain, strain background (E. coli) | ΔlamB | Keio collection; Baba et al., 2006 | JW3996-1 | See Figure 3 |
| Strain, strain background (E. coli) | ΔphoE | Keio collection; Baba et al., 2006 | JW0231-1 | See Figure 3 |
| Strain, strain background (E. coli) | ΔmlaA | Keio collection; Baba et al., 2006 | JW2343-1 | See Figure 5 |
| Strain, strain background (E. coli) | ΔmlaE | Keio collection; Baba et al., 2006 | JW3161-1 | See Figure 5 |
| Strain, strain background (E. coli) | ΔnlpI | Keio collection; Baba et al., 2006 | JW3132-1 | See Figure 5 |
| Strain, strain background (E. coli) | ΔtolB | Keio collection; Baba et al., 2006 | JW5100-1 | See Figure 5 |
| Strain, strain background (E. coli) | ΔdegP | Keio collection; Baba et al., 2006 | JW0157-1 | See Figure 5 |
| Strain, strain background (E. coli) | ΔrfaD | Keio collection; Baba et al., 2006 | JW3594-1 | See Figure 5 |
| Strain, strain background (E. coli) | ΔrodZ | Keio collection; Baba et al., 2006 | JW2500-1 | See Figure 5 |
| Antibody | Purified anti-Ms CD16/32, monoclonal | BioLegend | Cat# 101302; clone 93; Lot# B298973; RRID: AB_312801 | (1:200) |
| Antibody | Rat anti-Ms Ly-6G (FITC), monoclonal | BD Biosciences | Cat# 551460; clone 1A8; Lot# 9068981; RRID: AB_394207 | (1:100) |
| Antibody | Rat anti-Ms Ly-6C (PerCP-Cyanine5.5), monoclonal | Thermo Fisher Scientific | Cat# 45-5932-82; clone HK1.4; Lot# 2309273; RRID: AB_2723343 | (1:100) |
| Antibody | Rat anti-Ms/Hs CD11b (APC), monoclonal | BioLegend | Cat# 101212; clone M1/70; Lot# B312600; RRID: AB_312795 | (1:800) |
| Antibody | Rat anti-Ms CD206 (AF700), monoclonal | BioLegend | Cat# 141733; clone C068C2; Lot# B278058; RRID: AB_2629636 | (1:300) |
| Antibody | Armenian hamster anti-Ms CD11c (APC-eFluor780), monoclonal | Thermo Fisher Scientific | Cat# 47-0114-80; clone N418; Lot# 2133269; RRID: AB_1548652 | (1:300) |
| Antibody | Rat anti-Ms CD45 (efluor450), monoclonal | Thermo Fisher Scientific | Cat# 48-0451-82; clone 30-F11; Lot# 2005853 RRID: AB_1518806 | (1:600) |
| Antibody | Rat anti-Ms CD19 (Super Bright 600), monoclonal | Thermo Fisher Scientific | Cat# 63-0193-82; clone eBio1D3; Lot# 2366423; RRID: AB_2637308 | (1:150) |
| Antibody | Rat anti-Ms CD3 (BV 605), monoclonal | BioLegend | Cat# 100237; clone 17A2; Lot# B389899; RRID: AB_2562039 | (1:100) |
| Antibody | Mouse anti-Ms NK1.1 (BV605), monoclonal | BioLegend | Cat# 108739; clone PK-136; Lot# B389899; RRID: AB_2562273 | (1:150) |
| Antibody | Rat anti-Ms CCR2 (BV650), monoclonal | BioLegend | Cat# 150613; clone SA203G11; Lot# B294599; RRID: AB_2721553 | (1:100) |
| Antibody | Rat anti-Ms I-A/I-E (BV711), monoclonal | BioLegend | Cat# 107643; clone M5/114.15.2; Lot# B299330; RRID: AB_2565976 | (1:600) |
| Antibody | Mouse anti-Ms CX3CR1 (BV785), monoclonal | BioLegend | Cat# 149029; clone SA011F11; Lot# B304744; RRID: AB_2565938 | (1:300) |
| Antibody | Rat anti-Ms Siglec F (PE), monoclonal | Thermo Fisher Scientific | Cat# 12-1702-80; clone 1RNM44N; Lot# 2252684; RRID: AB_2637129 | (1:300) |
| Antibody | Armenian hamster anti-Ms FcεR1α (PE/Dazzle 594), monoclonal | BioLegend | Cat# 134331; clone MAR-1; Lot# B280348; RRID: AB_2687240 | (1:300) |
| Antibody | Rat anti-Ms CD115 (PE-Cy7), monoclonal | BioLegend | Cat# 135523; clone AFS98; Lot# B268547; RRID: AB_2566459 | (1:600) |
| Antibody | Rat anti-Ms F4/80 (BUV395), monoclonal | BD Biosciences | Cat# 565614; clone T45-2342; Lot# 1104580; RRID: AB_2739304 | (1:150) |
| Antibody | Rat anti-Ms CD45 (APC-Cy7), monoclonal | BioLegend | Cat# 103115; clone 30-F11; Lot# NA; RRID: AB_312980 | (1:150) |
| Antibody | Rat anti-Ms Ly-6C (PE-Cy7), monoclonal | BioLegend | Cat# 128017; clone HK1.4; Lot# B331355; RRID: AB_1732093 | (1:600) |
| Antibody | Rat anti-Ms Ly-6G (Biotin), monoclonal | BioLegend | Cat# 127604; clone 1A8; Lot# B314606; RRID: AB_1186108 | (1:600) |
| Antibody | Rabbit anti-E. coli ftsZ, polyclonal | Agrisera | Cat# AS10715; RRID: AB_10754647 | (1:200) |
| Antibody | Rabbit anti-E. coli ompF, polyclonal | Biorbyt | Cat# orb308741; RRID: NA | (1:500) |
| Antibody | Goat anti-rabbit, polyclonal | LI-COR Biosciences | Cat# 925-68021; RRID: AB_2713919 | (1:10,000) |
| Recombinant DNA reagent | pBAD28==pEMPTY (plasmid) | Proietti et al., 2019; Santapaola et al., 2006; Scribano et al., 2014 | Ampicillin resistance | |
| Recombinant DNA reagent | pHND10==pAPY (plasmid) | Proietti et al., 2019; Santapaola et al., 2006; Scribano et al., 2014 | Ampicillin resistance | |
| Sequence-based reagent | fD1 | Weisburg et al., 1991 | PCR primers | 5’-AGA-GTT-TGA-TCC-TGG-CTC-AG-3’ |
| Sequence-based reagent | fD2 | Weisburg et al., 1991 | PCR primers | 5’-AGA-GTT-TGA-TCA-TGG-CTC-AG-3’ |
| Sequence-based reagent | rP1 | Weisburg et al., 1991 | PCR primers | 5’-ACG-GTT-ACC-TTG-TTA-CGA-CTT-3’ |
| Commercial assay or kit | QIAquick Gel Extraction Kit | QIAGEN | Cat# 28706 | |
| Commercial assay or kit | ATP Kit SL | BioThema | Cat# 144-041 | |
| Commercial assay or kit | Cell Viability Kit with BD Liquid Counting Beads | BD Biosciences | Cat# 349480 | |
| Commercial assay or kit | Microbial ATP Kit HS | BioThema | Cat# 266-112 | |
| Commercial assay or kit | Intracellular ATP Kit HS | BioThema | Cat# 266-111 | |
| Commercial assay or kit | ReliaPrep RNA Cell Miniprep System | Promega | Cat# Z6011 | |
| Chemical compound, drug | Bacto Yeast Extract | Gibco | Cat# 212750 | |
| Chemical compound, drug | Bacto Tryptone | Gibco | Cat# 211699 | |
| Chemical compound, drug | Agar | Sigma-Aldrich | Cat# 05039-500G | |
| Chemical compound, drug | GoTaq G2 Green Master Mix | Promega | Cat# M782A | |
| Chemical compound, drug | Collagenase I (Col I) | Sigma-Aldrich | Cat# C0130-100MG | |
| Chemical compound, drug | Collagenase IV (Col IV) | Worthington | Cat# LS004189 | |
| Chemical compound, drug | Collagenase D (Col D) | Roche | Cat# 11088858001 | |
| Chemical compound, drug | DNAse I | Roche | Cat# 63792800 | |
| Chemical compound, drug | Adenosine 5′-triphosphate disodium salt hydrate (ATP) | Sigma-Aldrich | Cat# 2383-1G | |
| Chemical compound, drug | Adenosine-5'-(γ-thio)-triphosphate, Tetralithium salt (ATPγs) | Jena Bioscience | Cat# NU-406-50 | |
| Software, algorithm | GraphPad Prism v9.5.1 | Prism GraphPad software | https://www.graphpad.com/ | |
| Software, algorithm | FlowJo v10.8.1 | FlowJo software | https://www.flowjo.com | |
| Software, algorithm | fastqc v0.11.9 | Babraham Bioinformatics, 2024 | http://www.bioinformatics.babraham.ac.uk/projects/fastqc/ | |
| Software, algorithm | fastp v0.19.5 | Chen et al., 2018 | https://github.com/OpenGene/fastp RRID:SCR_016962 | |
| Software, algorithm | STAR v2.7.10a_alpha_220818 | Dobin et al., 2013 | https://github.com/alexdobin/STAR RRID:SCR_004463 | |
| Software, algorithm | subread v2.0.1 | Liao et al., 2014 | https://github.com/ShiLab-Bioinformatics/subread RRID:SCR_009803 | |
| Software, algorithm | R v4.2.2 | The R Project for Statistical Computing | https://cran.r-project.org | |
| Software, algorithm | RStudio v2022.07.2 | RStudio Desktop | https://www.rstudio.com | |
| Software, algorithm | R package ggplot2 v3.4.3 | Wickham, 2016 | https://ggplot2.tidyverse.org | |
| Software, algorithm | R package readxl v1.4.3 | Wickham and Bryan, 2023a | https://CRAN.R-project.org/package=readxl | |
| Software, algorithm | R package ggbreak v0.1.2 | Xu et al., 2021 | https://github.com/YuLab-SMU/ggbreak RRID:SCR_014601 | |
| Software, algorithm | R package rstatix v0.7.2 | Kassambara, 2023 | https://CRAN.R-project.org/package=rstatix | |
| Software, algorithm | R package dplyr v1.0.10 | Wickham et al., 2023b | https://CRAN.R-project.org/package=dplyr | |
| Software, algorithm | R package DESeq2 v1.38.3 | Love et al., 2014 | https://github.com/mikelove/DESeq2 RRID:SCR_015687 | |
| Software, algorithm | R package ggrepel v0.9.3 | Slowikowski et al., 2023 | https://CRAN.R-project.org/package=ggrepel | |
| Software, algorithm | R package vegan v2.6–4 | Oksanen et al., 2022 | https://github.com/vegandevs/vegan RRID:SCR_011950 | |
| Software, algorithm | R package pairwiseAdonis v0.4 | Arbizu, 2023 | https://github.com/pmartinezarbizu/pairwiseAdonis RRID:SCR_001905 | |
| Software, algorithm | R package gprofiler2 v0.2.2 | Kolberg and Raudvere, 2023 | https://cran.r-project.org/web/packages/gprofiler2/index.html | |
| Software, algorithm | R package gplots v3.1.3 | Warnes et al., 2022 | https://CRAN.R-project.org/package=gplots | |
| Software, algorithm | R package viridis v0.6.3 | Ross et al., 2021 | https://sjmgarnier.github.io/viridis/ RRID:SCR_016696 | |
| Other | Fixable Viability Dye eFluor506 | Thermo Fisher Scientific | Cat# 65-0866-18 | (1:600) |
| Other | Nalgene Rapid-Flow PES Filter Units | Thermo Scientific | Cat# 168-0045, 165-0045, 124-0045PK | |
| Other | Vybrant DiI Cell-Labeling Solution | Invitrogen | Cat# V22885 | (1:100) |
| Other | DAPI | Sigma-Aldrich | Cat# D9542-5MG | (1:5000) |
| Other | Hoechst 33342 | Thermo Fisher Scientific | Cat# H3570 | (1:1000) |
| Other | LysoTracker | Invitrogen | Cat# L12492 | (1:1000) |
Additional files
Download links
A two-part list of links to download the article, or parts of the article, in various formats.
Downloads (link to download the article as PDF)
Open citations (links to open the citations from this article in various online reference manager services)
Cite this article (links to download the citations from this article in formats compatible with various reference manager tools)
Released bacterial ATP shapes local and systemic inflammation during abdominal sepsis
eLife 13:RP96678.
https://doi.org/10.7554/eLife.96678.3


