Genetic stability of Mycobacterium smegmatis under the stress of first-line antitubercular agents
- Institute of Molecular Life Sciences, HUN-REN Research Centre for Natural Sciences, Hungary
- Doctoral School of Biology and Institute of Biology, ELTE Eötvös Loránd University, Hungary
- Department of Applied Biotechnology and Food Science, Budapest University of Technology and Economics, Hungary
Figures
Figure 1 with 2 supplements
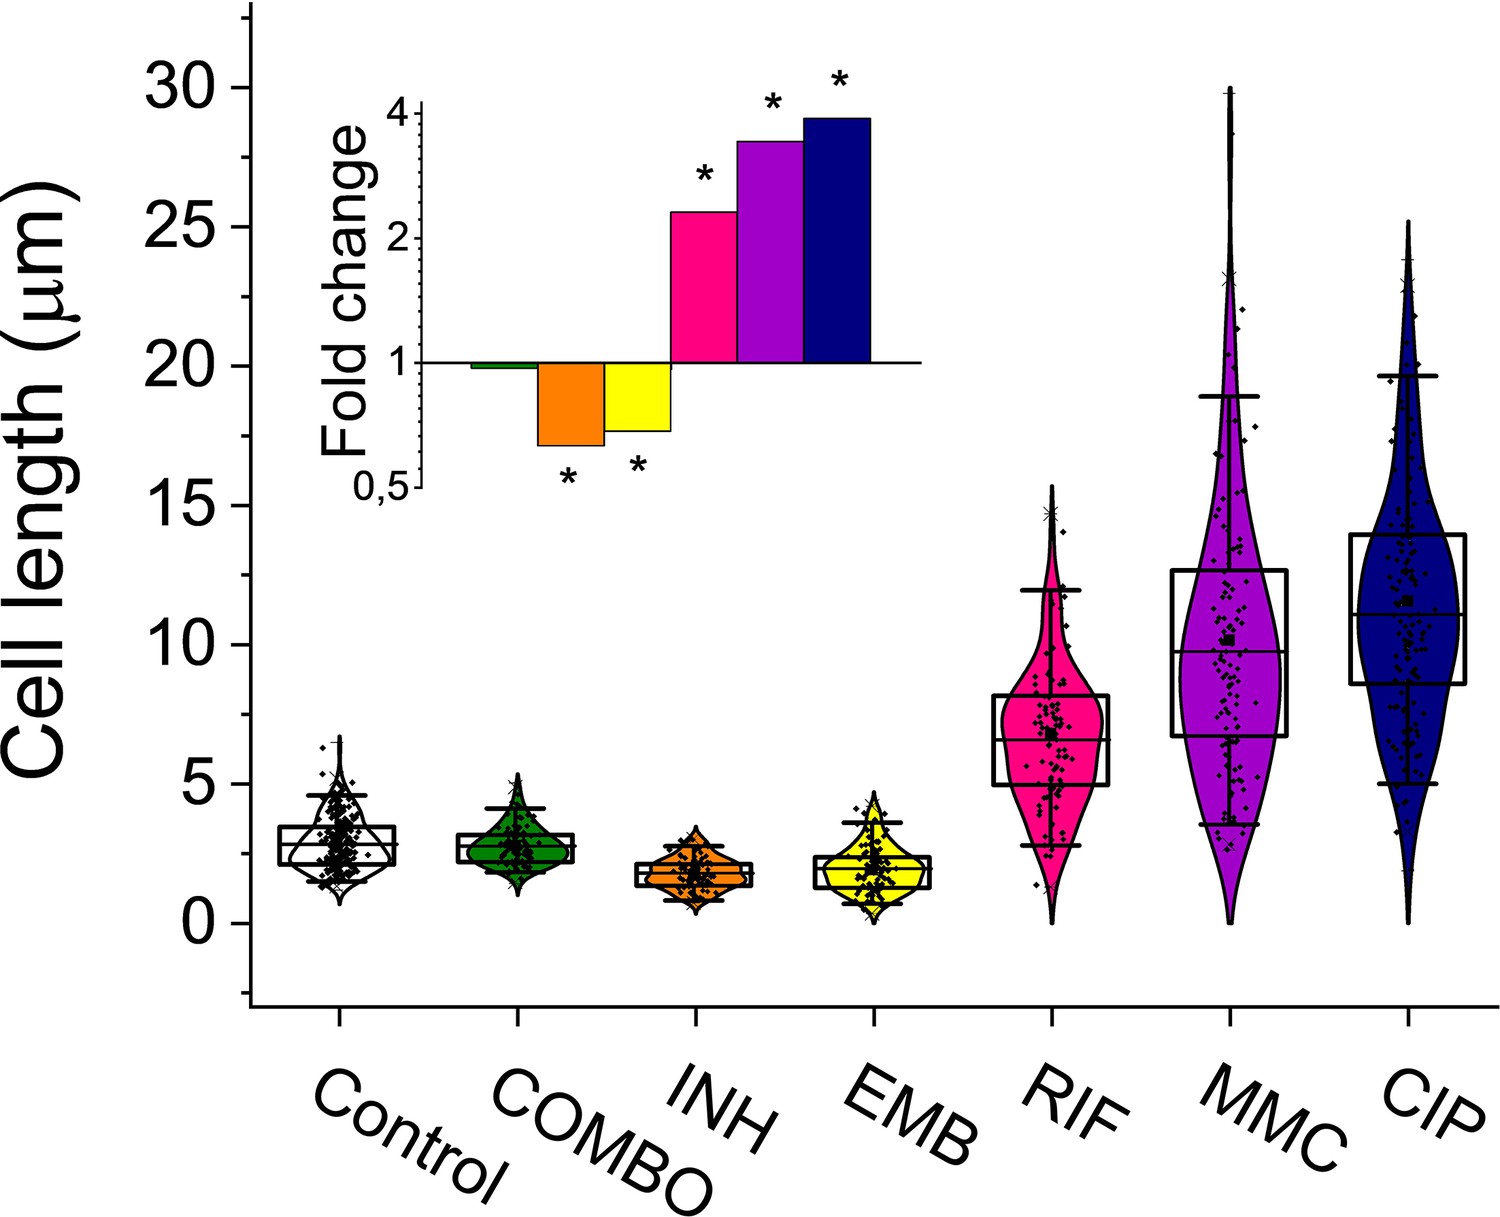
Cell length distribution of M.smegmatis cells treated with different drugs.
Horizontal lines represent the mean of the plotted data points (n=84–212). The inset shows the fold changes in cell length compared to the untreated control on a log2 axis, highlighting the phenotypic effect of each treatment. * indicates data significantly different from the control at p=0.0001. Numerical values and additional statistical parameters are provided in Figure 1—source data 1.
-
Figure 1—source data 1
Cell dimensions of M. smegmatis treated with different drugs.
- https://cdn.elifesciences.org/articles/96695/elife-96695-fig1-data1-v1.docx
Figure 1—figure supplement 1
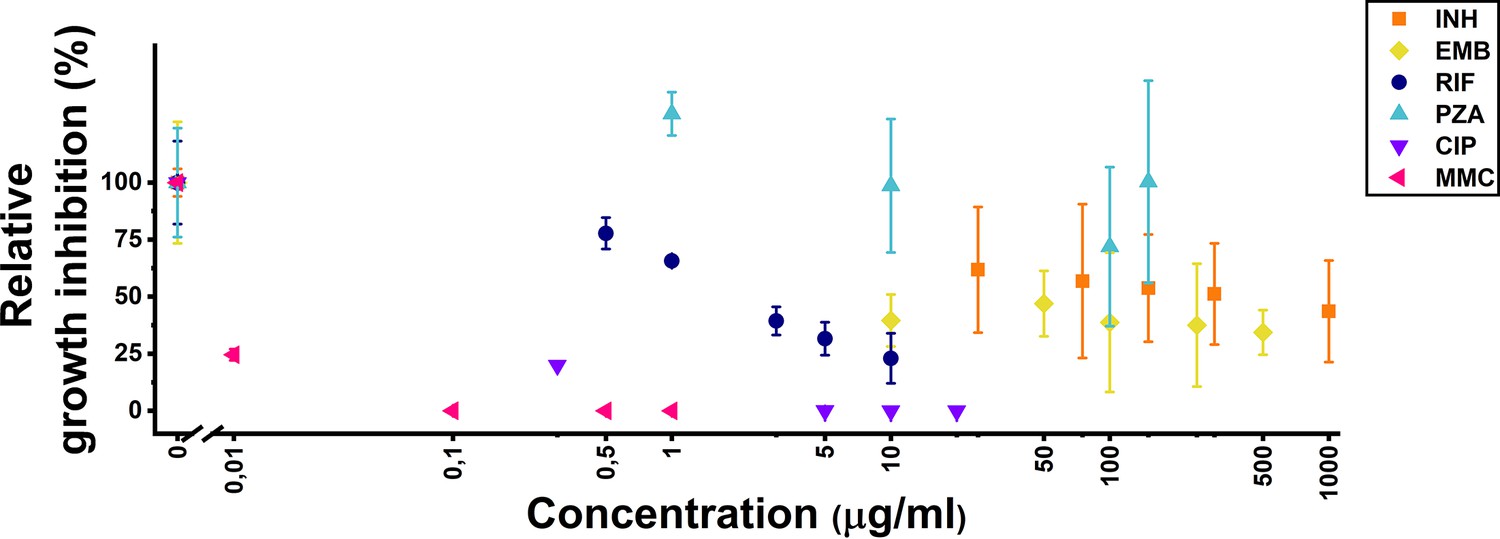
Treatment optimization in liquid culture.
Effects of treatment on Mycobacterium smegmatis mc2-155 wild-type liquid cultures during the exponential growth phase. Relative growth inhibition is expressed as the % OD600 ratio between treated and control liquid cultures for isoniazid (INH), ethambutol (EMB), ethambutol (RIF), and pyrazinamide (PZA) (latter grown in pH 5.5 acidic media). For ciprofloxacin (CIP) and mitomycinC (MMC), it is represented as the % ratio of colony-forming units (CFUs) following an 8 hr treatment.
Figure 1—figure supplement 2
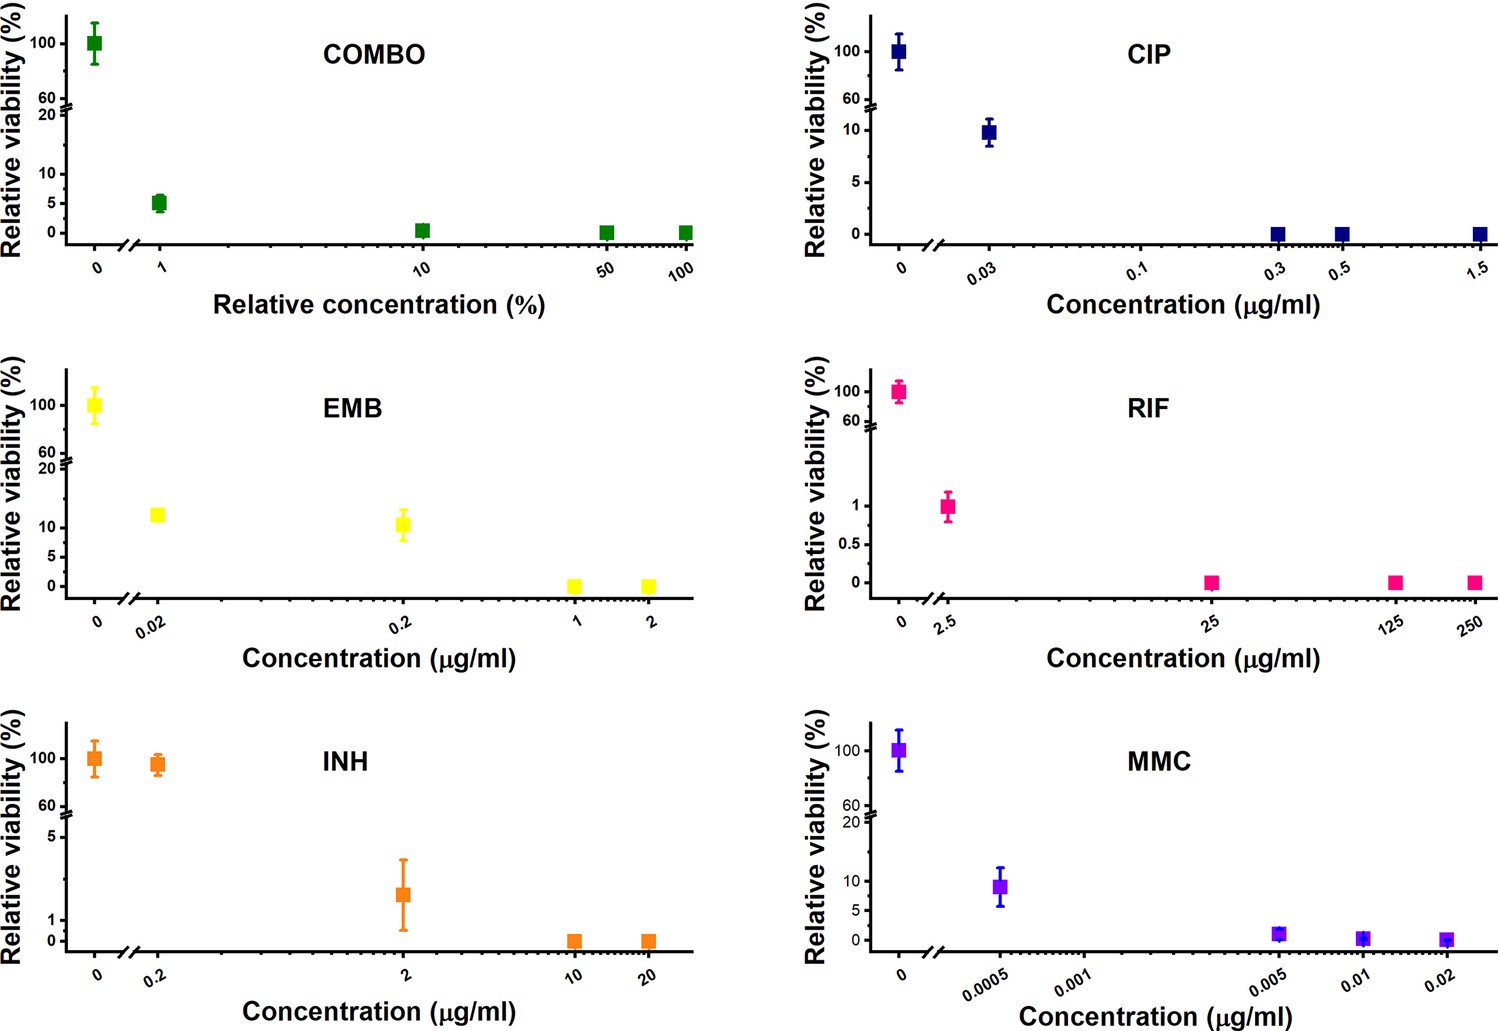
Treatment optimization on agar plates.
Relative viability is calculated based on the colony-forming unit (CFU) counting of exponentially growing wild-type M. smegmatis cultures on control and selective plates containing the corresponding antibiotic at different concentrations. Incubation: 60 hr at 37°C.
Figure 2
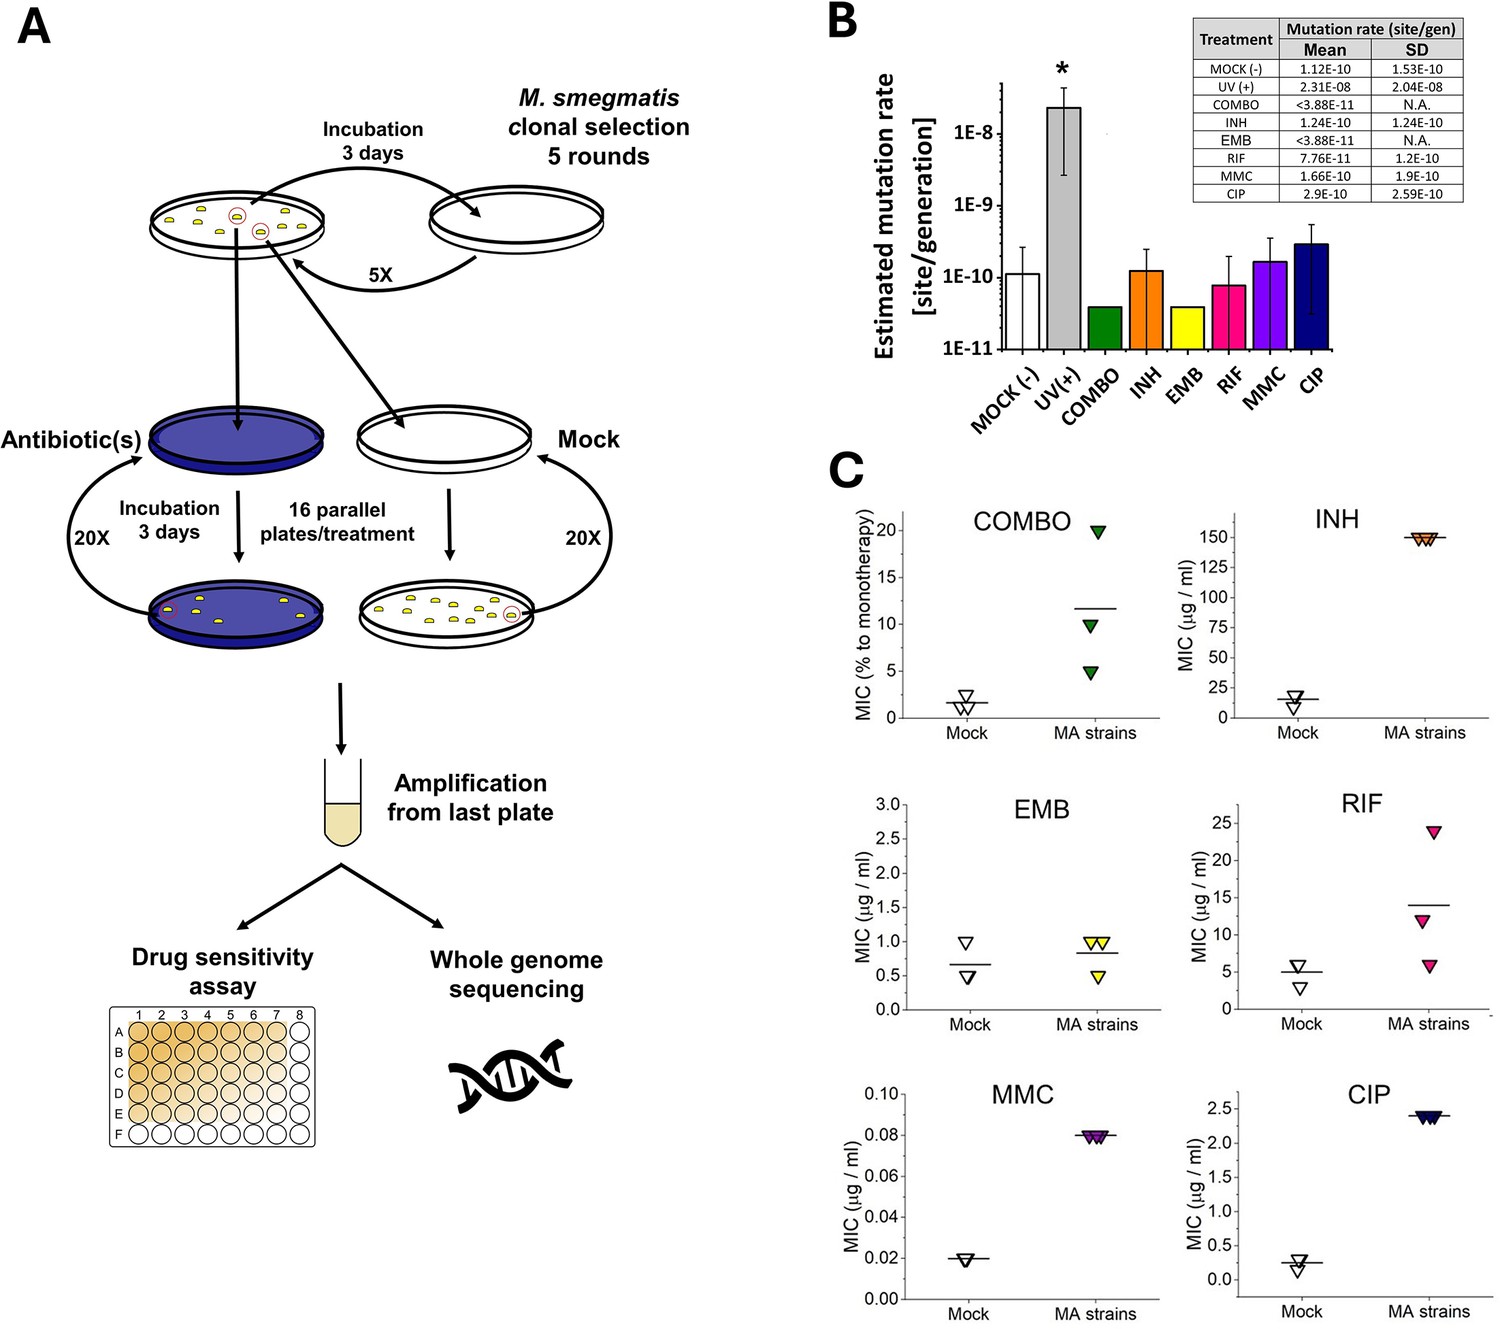
Mutation accumulation (MA) experiment and the resulting genotypic and phenotypic changes in wild-type M.
smegmatis mc2155 strains under antibiotic pressure. (A) Experimental design. (B) Mutation rates determined through genome sequencing of the drug-treated cells as an output of the MA process. UV(+) serves as a control reference for DNA damage. Columns represent averages, and error bars indicate the standard deviations of three individually sequenced samples. Statistical significance is marked by an asterisk (*), with a p-value of 0.05. For numerical data see Figure 2—source data 1. (C) Phenotypic drug sensitivity in drug-treated strains. Three individual minimal inhibitory concentration (MIC) determinations are presented, with the mean indicated by a horizontal line. For numerical data see Figure 2—source data 2.
-
Figure 2—source data 1
Numerical data for mutation rates of wild-type M. smegmatis mc2155 strains under antibiotic pressure.
- https://cdn.elifesciences.org/articles/96695/elife-96695-fig2-data1-v1.docx
-
Figure 2—source data 2
Phenotypic drug sensitivity (MIC) in drug- treated strains.
- https://cdn.elifesciences.org/articles/96695/elife-96695-fig2-data2-v1.xlsx
Figure 3 with 3 supplements
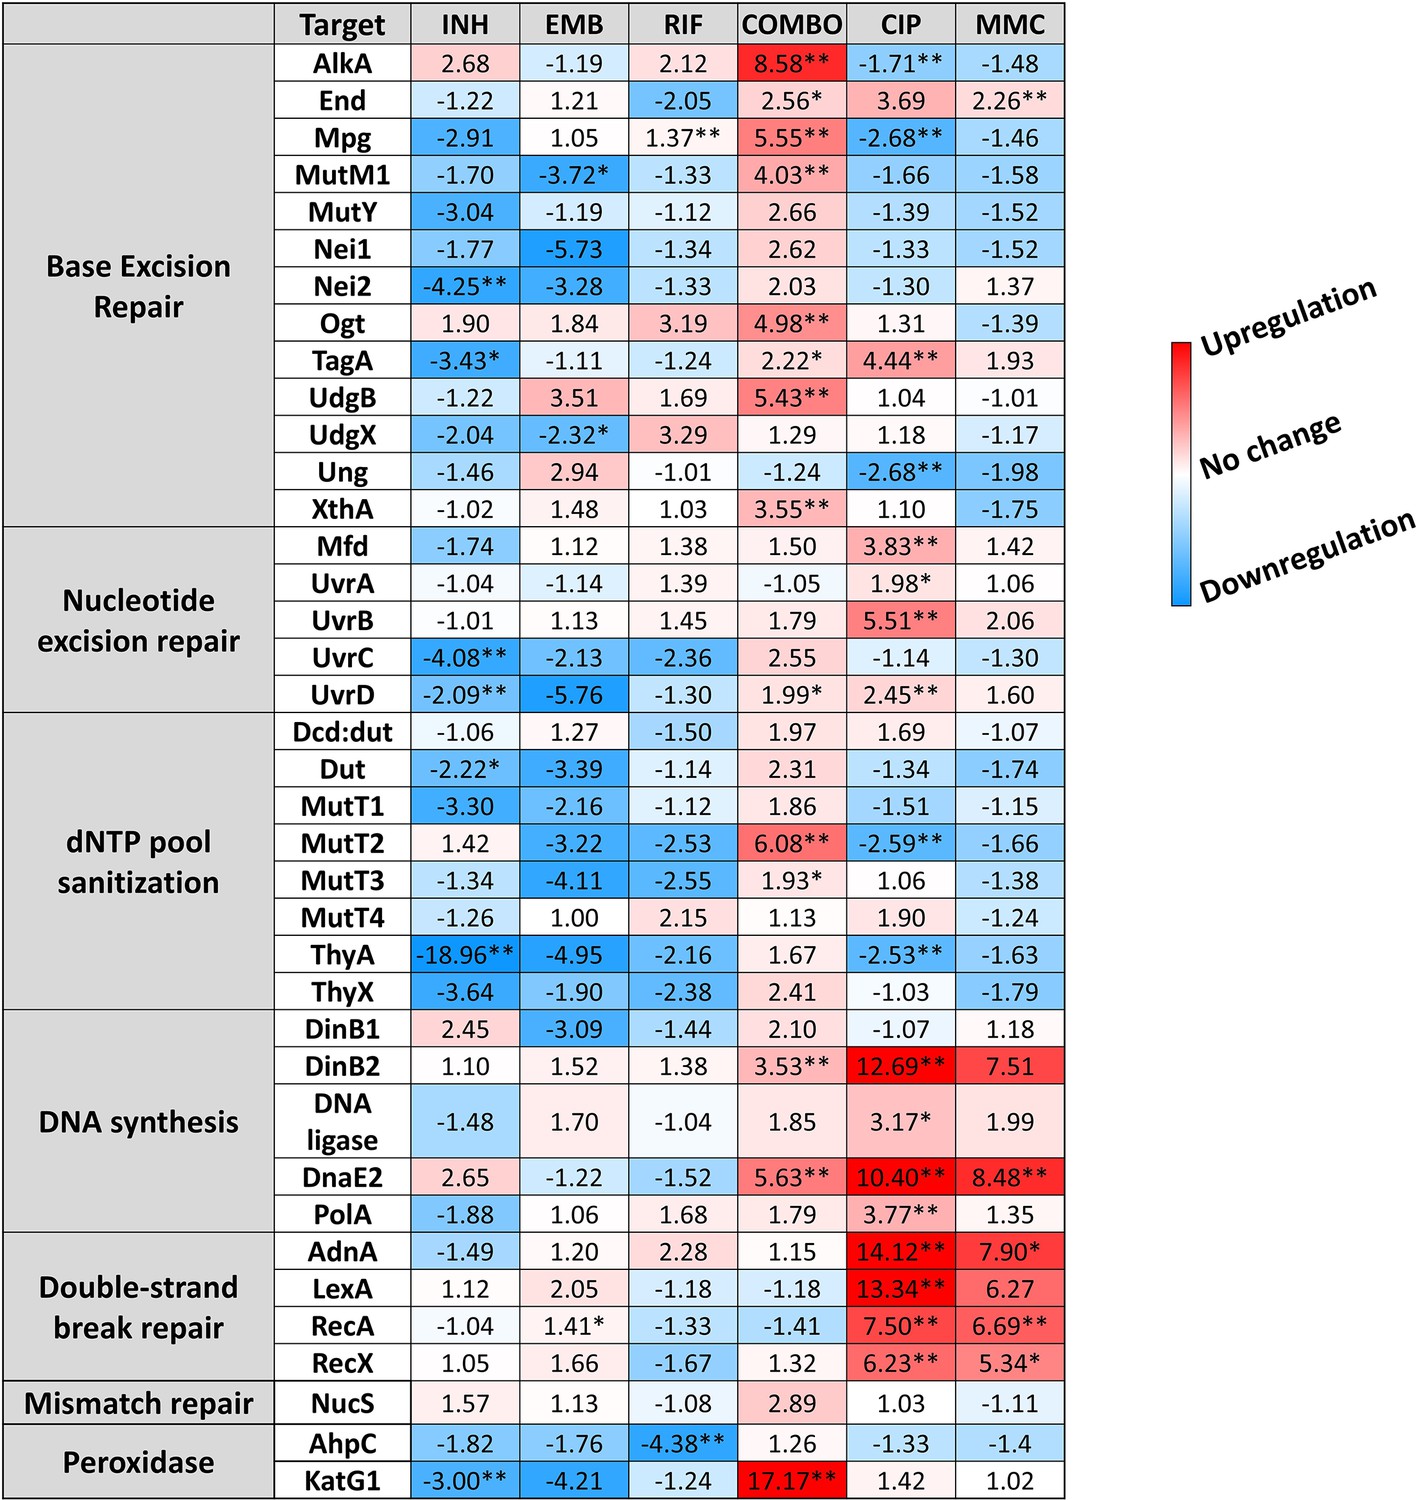
Changes in the expression of DNA repair genes upon stress treatments.
Gene expression changes are normalized to the mock-treated control using the SigA and Ffh reference genes. Upregulation is numerically interpreted as fold change; downregulation is interpreted as –1/ (fold change) in the heatmap. *p<0.1; **p<0.05. For raw data see Figure 3—source data 1.
-
Figure 3—source data 1
Numerical qPCR results.
- https://cdn.elifesciences.org/articles/96695/elife-96695-fig3-data1-v1.docx
Figure 3—figure supplement 1
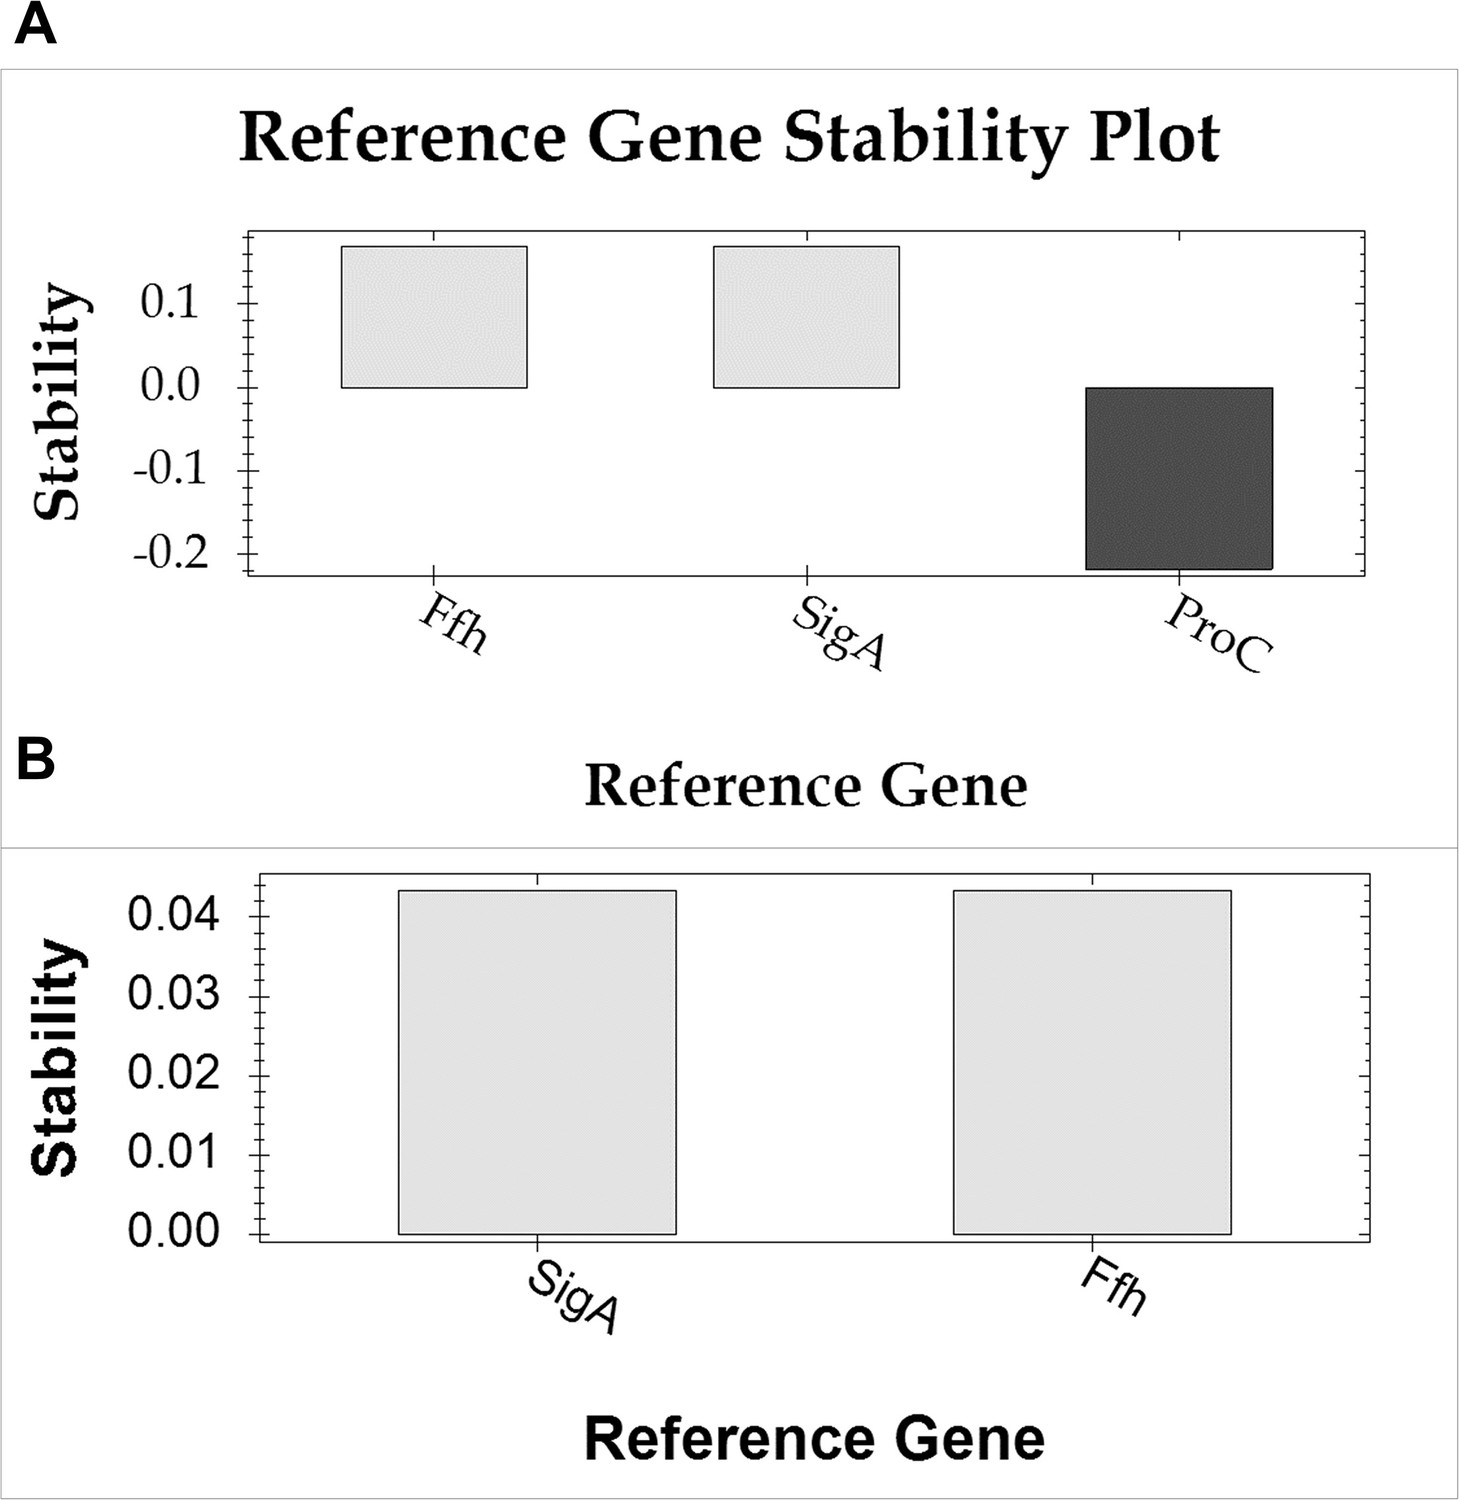
Stability analysis of reference genes using the geNorm algorithm.
(A) Stability, denoted as 1/ln(M), where M represents the average pair-wise variation among the tested reference genes across all samples (including six treatments and controls, with three biological and three technical replicates each). M values were computed using the BioRad CFX Maestro software. Reference gene stability is considered acceptable within the 0–1 stability range and deemed unstable below 0, as determined by the software. ProC was excluded from the study due to its demonstrated instability. (B) Pairwise comparison of the two accepted reference genes.
Figure 3—figure supplement 2
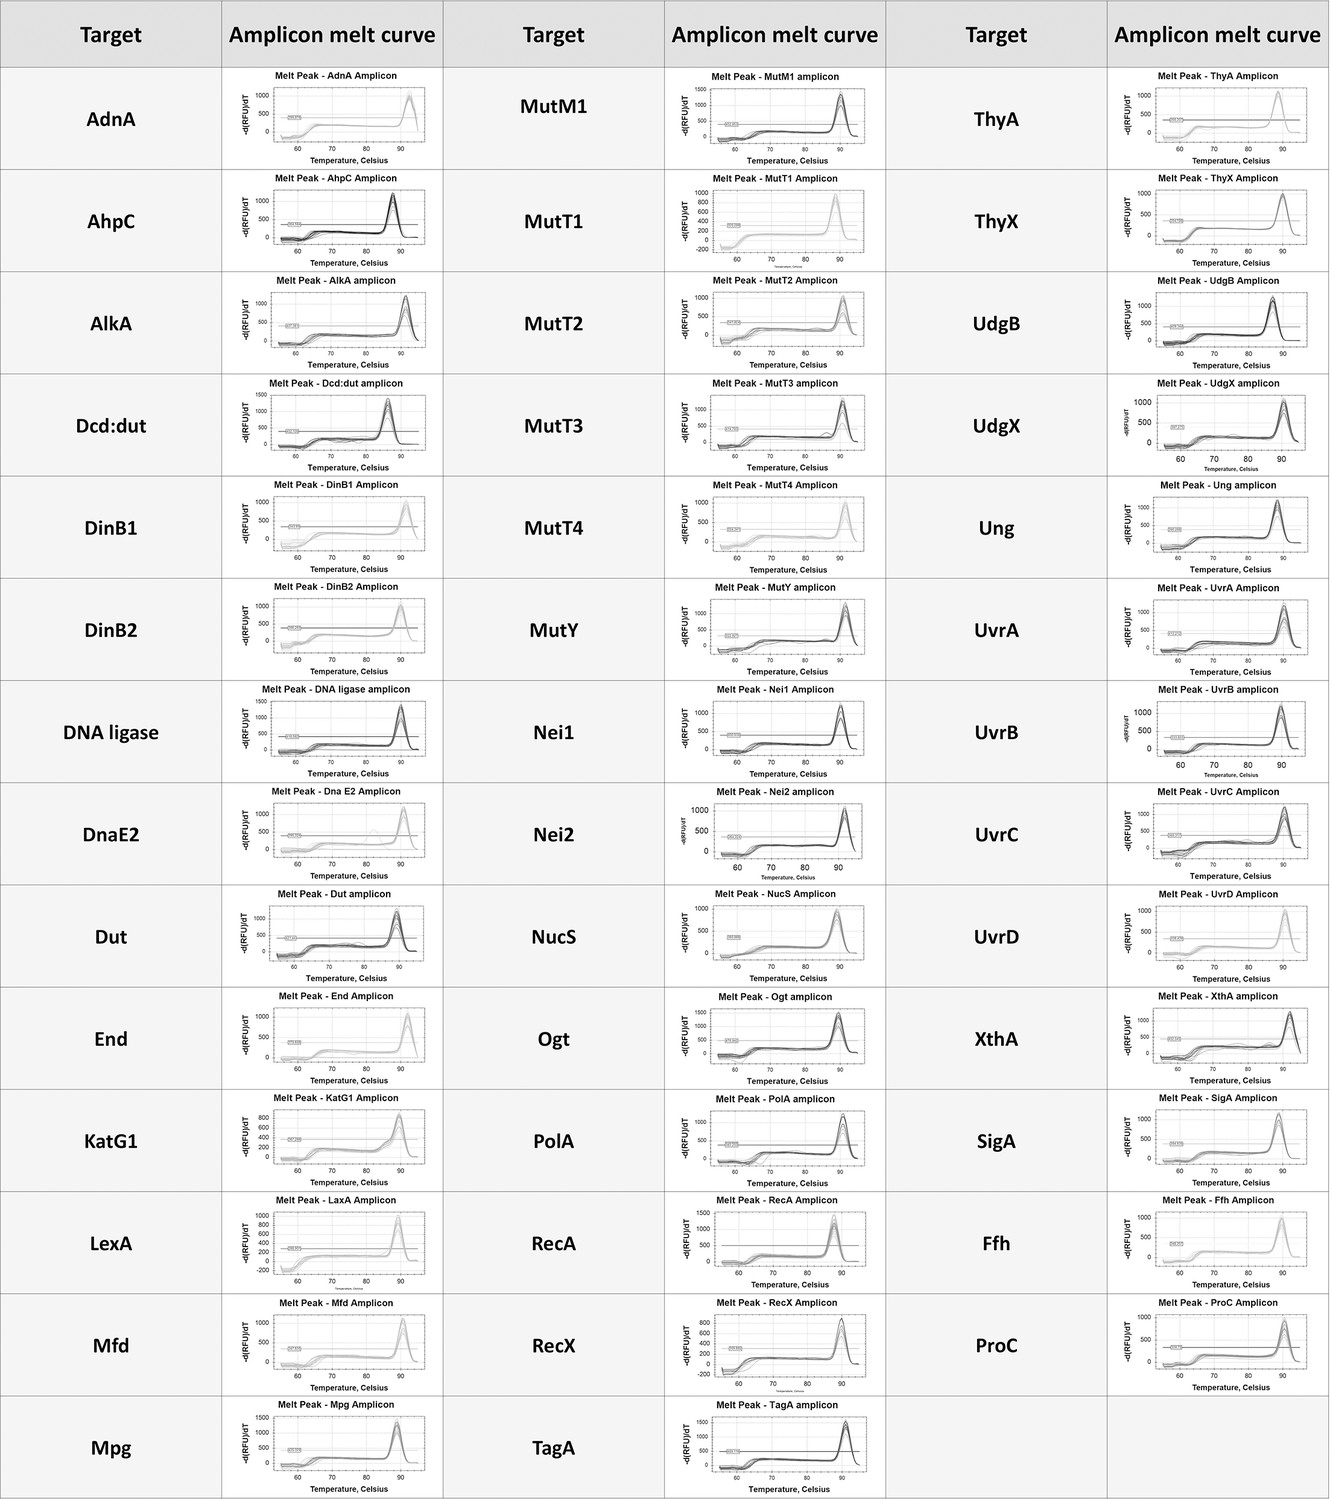
Specificity assessment of the employed primers.
Melt curve analysis of amplicons generated from target genes in the Mycobacterium smegmatis genome. The sequences of both forward and reverse primers are detailed in Supplementary file 1.
Figure 3—figure supplement 3
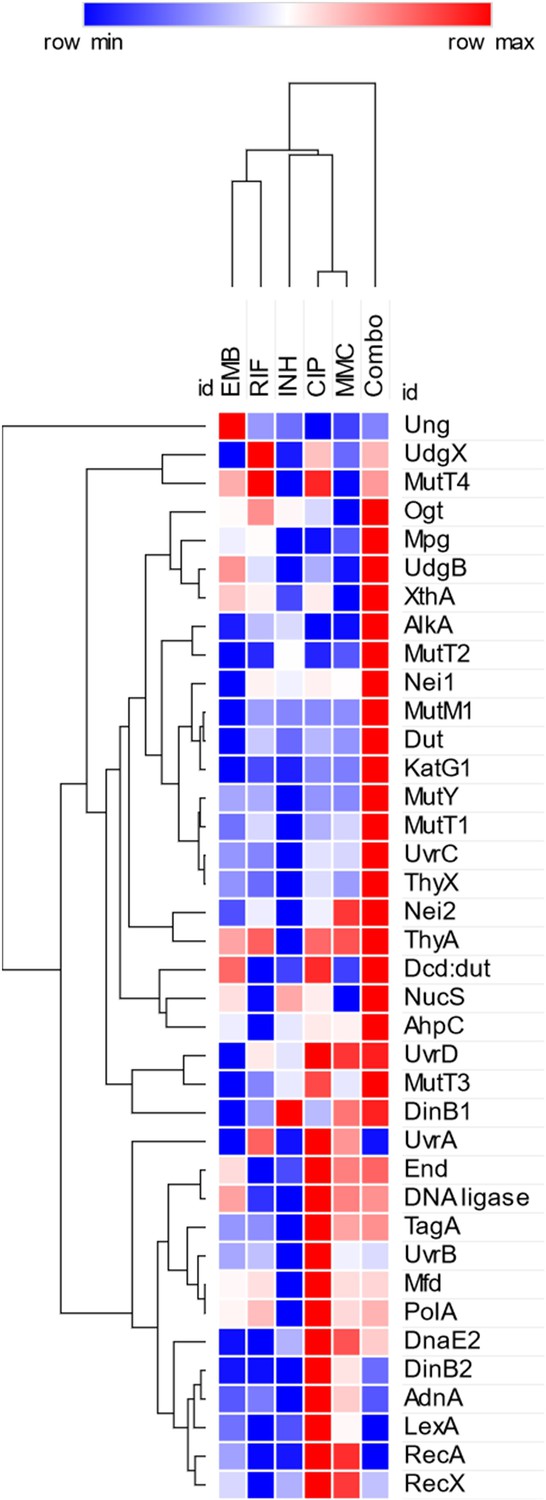
Heatmap with clustering for gene expression changes upon treatment.
The color scale is based on the mean relative gene expression changes compared to nontreated controls (fold change for upregulation and –1/fold change for downregulation). The color intensity in this heatmap is relative within each row and is not comparable to the color scale in Figure 3. Hierarchical clustering was performed using the one-minus Pearson correlation metric and the average linkage method. The figure was created using the Morpheus online heatmap generating tool (https://software.broadinstitute.org/morpheus/).
Figure 4
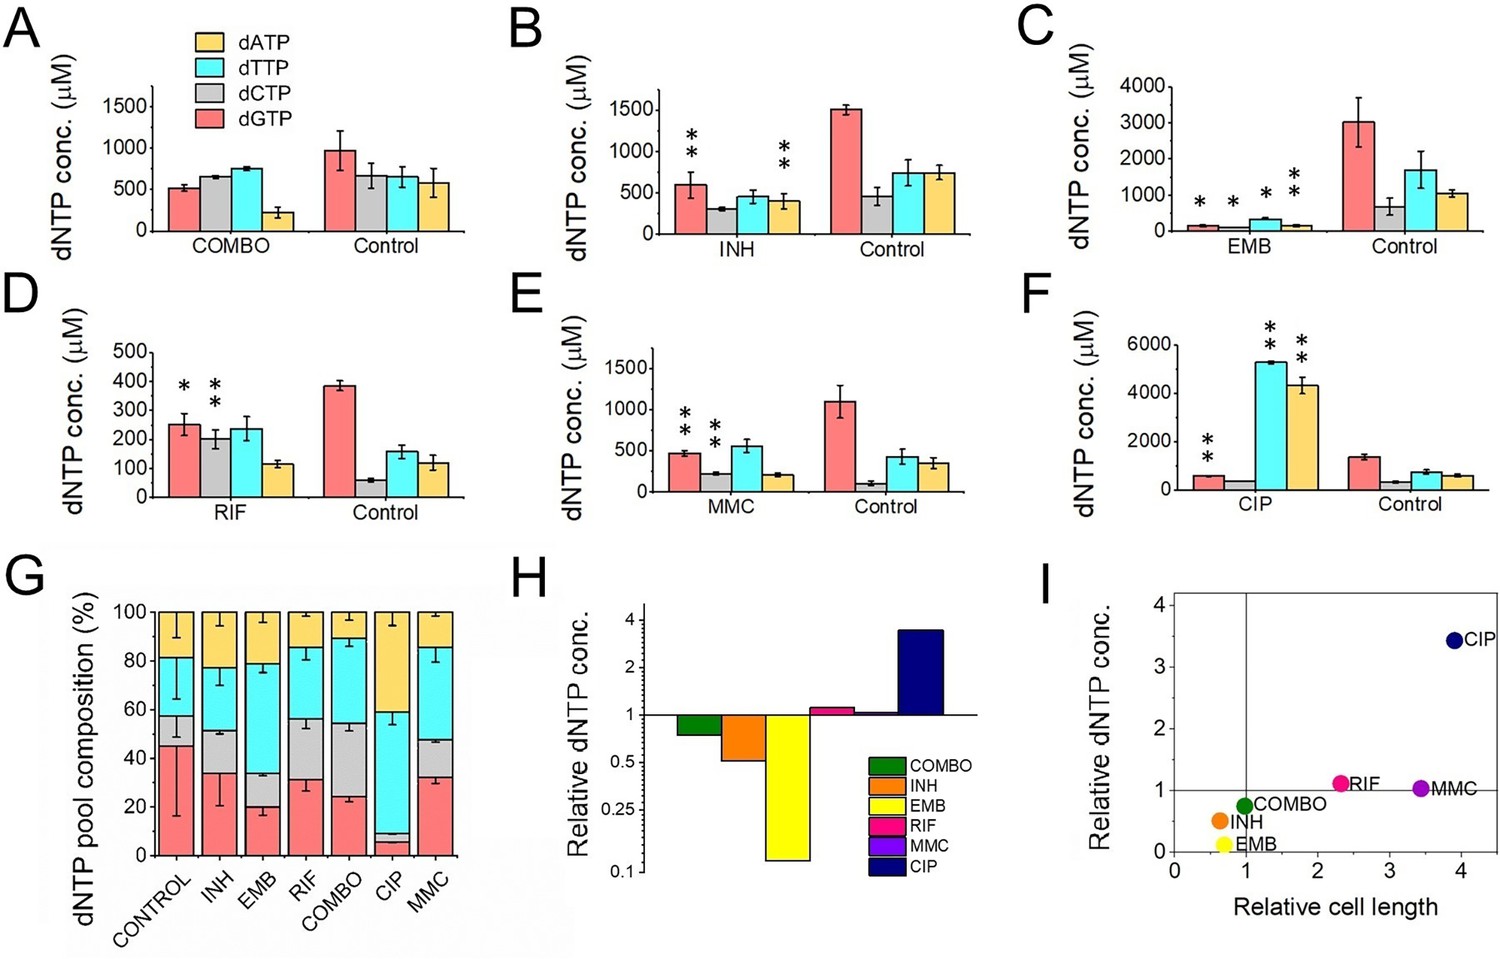
First-line antituberculotic treatments and DNA damaging agents alter dNTP concentrations in the cell.
(A–F) Cellular dNTP concentrations in drug-treated M. smegmatis. dNTP levels were measured in cellular extracts and normalized to the average cell volume for each treatment, yielding the concentrations shown. Each drug treatment and dNTP quantification included a corresponding control to account for potential fluctuations in growth and experimental conditions. Note the different scales on the y-axis. Data bars represent the averages of three biological replicates each carried out in three technical replicates; error bars represent SE. The p-values from the t-tests calculated for the measured differences are provided in Figure 1—source data 1, with significance indicated in the figure by asterisks as follows (**) for p<0.04 and (*) for p<0.07. (G) dNTP pool compositions of drug-treated bacteria. The large error bars in the control data arise from the combination of individual controls measured for each treatment. (H) Summed molar concentration of all four dNTPs compared to the control for each treatment. The y-axis is on a log2 scale to equally represent both increases and decreases. (I) Correlation of relative cell size (determined from cell lengths, compared to control cells) to relative total dNTP concentration for each treatment.
-
Figure 4—source data 1
dNTP concentrations in cellular extracts upon treatment with drugs.
- https://cdn.elifesciences.org/articles/96695/elife-96695-fig4-data1-v1.docx
Figure 5 with 1 supplement
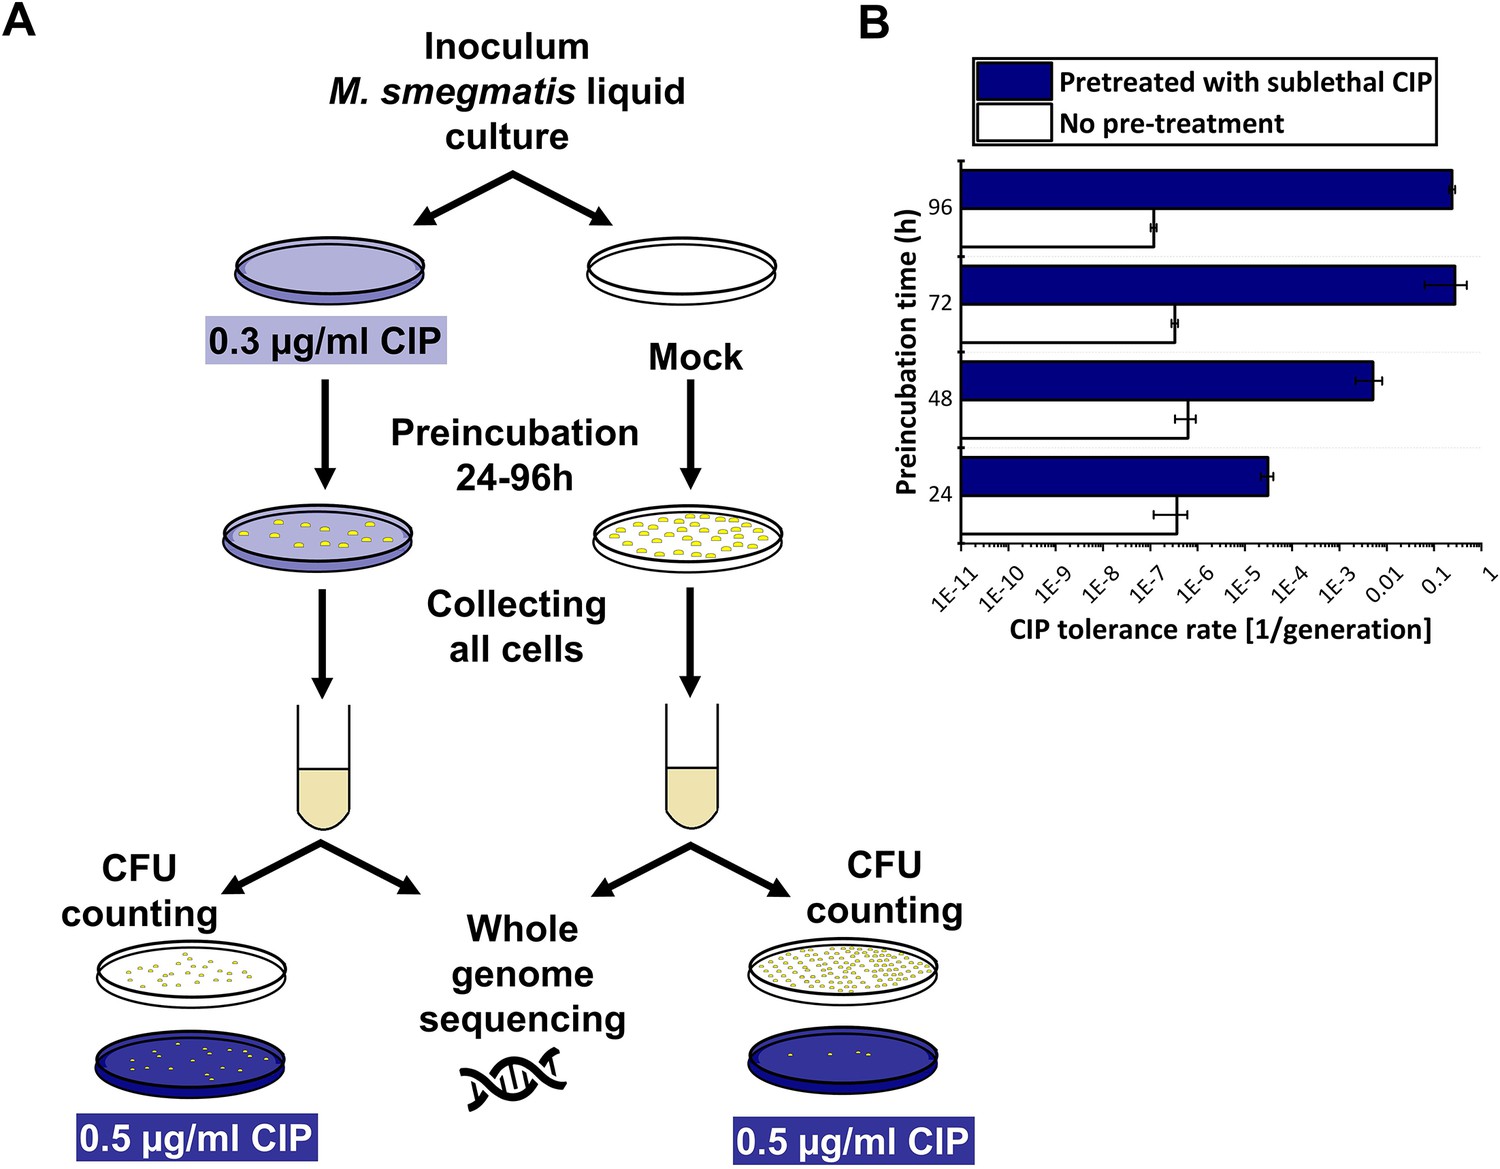
Phenotypic ciprofloxacin (CIP) tolerance assay.
(A) Scheme of the fluctuation test used in the study. (B) Development of phenotypic resistance to a selecting CIP concentration following preincubation with a sublethal CIP concentration for various time periods. Data bars represent the averages of three biological replicates each carried out in three technical replicates; error bars represent SE.
Figure 5—figure supplement 1
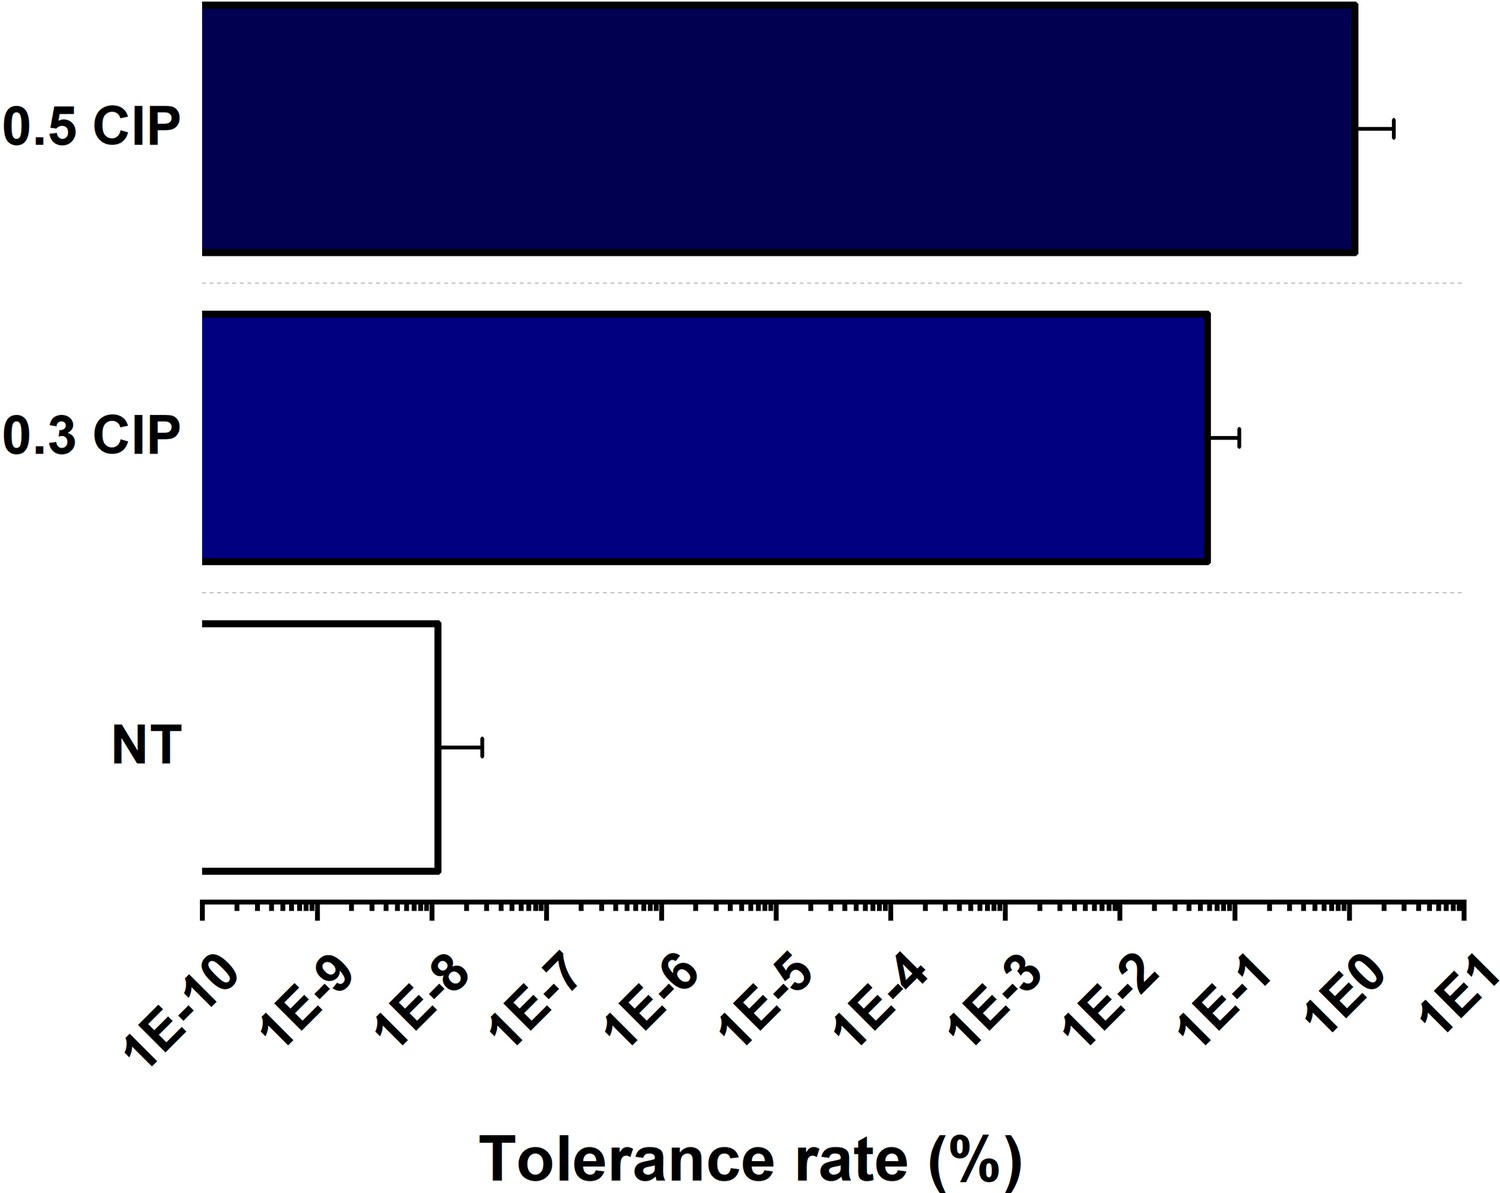
Ciprofloxacin (CIP) tolerance of M. smegmatis preincubated for 96 hr on CIP-containing plates sent for Whole Genome Sequencing (WGS).
Wild-type (WT) M. smegmatis colony was cultivated in LEMCO broth to reach OD = 0.4–0.5, then striked onto plates containing 0.5 µg/ml CIP; 0.3 µg/ml CIP or onto non-selecting plates and grown for 4 days at 37 °C. Data bars represent the averages of three biological replicates each carried out in three technical replicates; error bars represent SE.
Tables
Table 1
Summary of the applied drug treatments and their phenotypic consequences.
| Treatment | Liquid culture experiments | Agar plate experiments | |||||||
|---|---|---|---|---|---|---|---|---|---|
| Category | Long name | Abbreviation | Mechanism of action | Subinhinitory concentration | CFU compared to control | Cell length [μm] | Cell width [μm] | Subinhinitory concentration | CFU compared to control |
| First line antibiotics | Isoniazid | INH | Cell wall synthesis inhibitor | 150 μg/ml | 80% | 1.8±0.5 | 0.41±0.07 | 2 μg/ml | 2.2 % |
| Ethambutol | EMB | 100 μg/ml | 70% | 2.0±0.8 | 0.55±0.17 | 0.2 μg/ml | 10.5 % | ||
| Rifampicin | RIF | RNA synthesis inhibitor | 3 μg/ml | 60% | 6.6±2.4 | 0.68±0.09 | 25 μg/ml | 0.00052 % | |
| Combination treatment | COMBO | WHO first line therapy | 10 μg/ml PZA, 15 μg/mL INH, 10 μg/ml EMB, 0.3 μg/mL RIF | 6% | 2.8±0.7 | 0.47±005 | 1 μg/ml PZA, 0.2 μg/mL INH, 0.02 μg/ml EMB, 2.5 μg/mL RIF | 0.39 % | |
| Second line antibiotics | Ciprofloxacin | CIP | Gyrase inhibitor | 0.3 μg/ml | 20% | 11.1±4.0 | 0.59±0.1 | 0.3 μg/ml | 0.00018 % |
| DNA damage controls | Mitomycin-C | MMC | DNA alkylation | 0.01 μg/ml | 20% | 9.8±4.6 | 0.68±0.11 | 0.0005 μg/ml | 0.96 % |
| Ultraviolet radiation | UV | Pyr dimers, DSBs | ND | ND | ND | ND | 150 J/m2 | 11 % | |
| N/A | Non-treated | Mock | N/A | N/A | 100% | 2.8±0.9 | 0.44±0.08 | N/A | 100 % |
Table 2
Analysis of the genomic changes detected in the mutation accumulation experiment using whole genome sequencing.
| Chromosome position | Sample | Reference | Mutation | AA mutation | Gene code | UniProt protein name | Gene ontology (GO) | Experiment |
|---|---|---|---|---|---|---|---|---|
| 5214897 | cip_b | A | AG | Leu87 frameshift 148stop | MSMEG_5116 | Uncharacterized protein | N/A | Mutation accumulation (MA) |
| 3614832 | cip_b | C | T | Pro139Leu | MSMEG_3554 | N5,N10-methylene-tetrahydromethanopterin reductase | xidoreductase activity, acting on paired donors, with incorporation or reduction of molecular oxygen [GO:0016705] | |
| 2208516 | cip_b | G | GA | Leu282 frameshift 283stop | MSMEG_2133 | Uncharacterized protein | N/A | |
| 5861538 | cip_c | G | GC | Leu168 frameshift | MSMEG_5792 | UPF0678 fatty acid-binding protein-like protein MSMEG_5792/MSMEI_5639 | intracellular transport [GO:0046907] | |
| 3415264 | cip_c | T | TC | Leu206 frameshift 257stop | MSMEG_3338 | Oxidoreductase, FAD/FMN-binding | FMN binding [GO:0010181]; oxidoreductase activity [GO:0016491] | |
| 2033295 | cip_c | A | AG | Leu72 frameshift 258stop | MSMEG_1954 | ABC1 family protein | N/A | |
| 1988098 | cip_c | A | AG | N/A | Intergenic region | intergenic | N/A | |
| 1533730 | inh_b | C | CTCG | Asp201_INSERTION | MSMEG_1431 | Cytochrome P450-terp (EC 1.14.-.-) | heme binding [GO:0020037]; iron ion binding [GO:0005506]; monooxygenase activity [GO:0004497]; oxidoreductase activity, acting on paired donors, with incorporation or reduction of molecular oxygen [GO:0016705] | |
| 994997 | inh_C | G | A | N/A | intergenic | N/A | ||
| 5777585 | inh_C | C | T | Val99Met | MSMEG_5688 | Regulatory protein, MarR | GO:0003700 DNA-binding transcription factor activity; GO:0006355 regulation of DNA-templated transcription | |
| 1508883 | mmc_a | C | G | Ala300Ala (neutral) | MSMEG_1407 | N/A | N/A | |
| 4598387 | mmc_a | C | G | Ala371Arg | MSMEG_4513 | Polyketide synthase | transferase activity, transferring acyl groups [GO:0016746] | |
| 6786854 | mmc_a | G | A | Trp104stop | MSMEG_6740 | 1-aminocyclopropane-1-carboxylate deaminase (EC 3.5.99.7) | 1-aminocyclopropane-1-carboxylate deaminase activity [GO:0008660]; pyridoxal phosphate binding [GO:0030170]; amine catabolic process [GO:0009310] | |
| 5313643 | mmc_c | C | T | N/A | intergenic | N/A | N/A | |
| 1865825 | mock_b | G | GC | Ala351 frameshift | MSMEG_1780 | Natural resistance-associated macrophage protein | metal ion transmembrane transporter activity; metal ion transport; membrane; | |
| 3722101 | mock_b | A | C | Asn185Thr | MSMEG_3656 | ABC transporter, permease/ATP-binding protein | ||
| 58213 | mock_c | T | TC | N/A | MSMEG_0037 | tRNA-Leu | N/A | |
| 4104684 | mock_c | T | C | Val70Ala | MSMEG_4033 | TetR-family protein transcriptional regulator | GO:0006350, Sequence-specific dna binding transcription factor activity, Regulation of transcription, dna-dependent | |
| 5118524 | mock_c | C | CG | Asp89 frameshift 143stop | MSMEG_5021 | Alcohol dehydrogenase, zinc-containing | Oxidoreductase activity, Zinc ion binding, Oxidation-reduction process | |
| 5217666 | mock_g | G | A | Thr200Thr (neutral) | MSMEG_5119 | L-glutamate gamma-semialdehyde dehydrogenase | Mitochondrial matrix, Oxidation-reduction process, Proline biosynthetic process, 1-pyrroline-5-carboxylate dehydrogenase activity | |
| 2970975 | mock_i | T | C | Arg155Gly | MSMEG_2908 | 2-Keto-3-deoxy-gluconate kinase | kinase activity [GO:0016301] | |
| 2970982 | mock_i | C | T | Arg153Glu | MSMEG_2908 | 2-Keto-3-deoxy-gluconate kinase | kinase activity [GO:0016301] | |
| 3306164 | mock_i | G | A | Glu1151Glu (neutral) | MSMEG_3225 | Ferredoxin-dependent glutamate synthase 1 (EC 1.4.7.1) | 3 iron, 4 sulfur cluster binding [GO:0051538]; glutamate synthase (ferredoxin) activity [GO:0016041]; metal ion binding [GO:0046872]; glutamate biosynthetic process [GO:0006537]; glutamine metabolic process [GO:0006541] | Mutation accumulation (MA) |
| 5805844 | mock_i | C | T | Val237Val (neutral) | MSMEG_5721 | Acetyl-CoA acetyltransferase | transferase activity, transferring acyl groups other than amino-acyl groups [GO:0016747] | |
| 4987517 | mock_j | G | A | Leu30Leu (neutral) | MSMEG_4890 | Alkyl hydroperoxide reductase AhpD (EC 1.11.1.28) (Alkylhydroperoxidase AhpD) | alkyl hydroperoxide reductase activity [GO:0008785]; hydroperoxide reductase activity [GO:0032843]; peroxidase activity [GO:0004601]; peroxiredoxin activity [GO:0051920]; response to oxidative stress [GO:0006979] | |
| 6406902 | mock_j | T | TG | N/A | intergenic | N/A | N/A | |
| 491016 | mock_k | C | T | N/A | intergenic | N/A | N/A | |
| 2287781 | mock_k | G | A | Gly199Asp | MSMEG_2207 | Beta-ketothiolase | transferase activity, transferring acyl groups other than amino-acyl groups [GO:0016747] | |
| 3438752 | rif_a | A | AC | Arg17 frameshift 175stop | MSMEG_3366 | Isonitrile hydratase, putative | N/A | |
| 5773058 | rif_a | C | T | Glu67Lys | MSMEG_5682 | Uncharacterized protein | integral component of membrane [GO:0016021] | |
| 6220187 | CIPB0.3 | G | T | Trp53Cys | MSMEG_6151 | Alpha/beta hydrolase fold-1 | epoxide hydrolase activity [GO:0004301] | Fluctuation assay with CIP treatment |
Key resources table
| Reagent type (species) or resource | Designation | Source or reference | Identifiers | Additional information |
|---|---|---|---|---|
| Strain, strain background (Mycobacterium smegmatis) | mc2-155 | Snapper et al., 1990 | GenBank: NC_008596.1 | |
| Other | DAPI stain | Sigma | D9542 | 10 µg/ml |
| Chemical compound, drug | Isoniazid | Sigma | I3377 | |
| Chemical compound, drug | Ethambutol | Sigma | E4630 | |
| Chemical compound, drug | Rifampicin | Sigma | R3501 | |
| Chemical compound, drug | Pyrazinamide | Sigma | 40751 | |
| Chemical compound, drug | Ciprofloxacin | Sigma | 17850 | |
| Chemical compound, drug | Mytomicin-C | Sigma | 10107409001 | |
| Commercial assay or kit | phenol:chloroform:IAA (25:24:1) | Sigma | Sigma: 3803 | For genomic DNA extraction |
| Commercial assay or kit | Whole genome sequencing | Novogene Ltd., Beijing, China | Executed on Illumina 1.9 instruments with 600-basepair fragments as 2 × 150 bp paired-end sequencing | |
| Commercial assay or kit | RNeasy Mini kit | Qiagen | Qiagen: 74524 | Used with RNA protect bacteia reagent (Qiagen: 76506) and DNAse I (Qiagen: 79254) |
| Commercial assay or kit | High-Capacity cDNA Reverse Transcription Kit | Applied Biosystems | Applied Biosystems: 4374967 | 95–105 ng total RNA was used for each reaction |
| Other | Mytaq PCR premix | Bioline | Bioline: 25046 | For qPCR measurements |
| Other | EvaGreen | VWR | VWR: #31000 | For qPCR measurements |
| Software, algorithm | NucleoTIDY | Szabó et al., 2020; http://nucleotidy.enzim.ttk.mta.hu | V1.8 | |
| Other | TEMPase Hot Start DNA Polymerase | VWR | VWR: 733–1838 | For dNTP measurements |
| Other | methanol | Sigma | For dNTP isolation | |
| Sequence-based reagent | NDP-1 | Szabó et al., 2020 | Primer for dNTP measurement | CCGCCTCCACCGCC |
| Sequence-based reagent | FAM-dTTP | Szabó et al., 2020 | Probe for dTTP measurement | 6-FAM/ AGGACCGAG/ZEN/GCAAGAGCGAGCGA /IBFQ |
| Sequence-based reagent | FAM-dATP | Szabó et al., 2020 | Probe for dTATP measurement | 6-FAM/ TGGTCCGTG/ZEN/GCTTGTGCGTGCGT /IBFQ |
| Sequence-based reagent | FAM-dGTP | Szabó et al., 2020 | Probe for dTGTP measurement | 6-FAM/ ACCATTCAC/ZEN/CTCACACTCACTCC /IBFQ |
| Sequence-based reagent | FAM-dCTP | Szabó et al., 2020 | Probe for dTCTP measurement | 6-FAM/ AGGATTGAG/ZEN/GTAAGAGTGAGTGG /IBFQ |
| Sequence-based reagent | dTTP-DT1 | Szabó et al., 2020 | Template oligo for dTTP measurement | TCGCTCGCTCTTGCCTCGGTCCTTTATTTGGCGGTGGAGGCGG |
| Sequence-based reagent | dATP-DT1 | Szabó et al., 2020 | Template oligo for dATP measurement | ACGCACGCACAAGCCACGGACCAAATAAAGGCGGTGGAGGCGG |
| Sequence-based reagent | dCTP-DT1 template | Szabó et al., 2020 | Template oligo for dCTP measurement | CCACTCACTCTTACCTCAATCCTTTGTTTGGCGGTGGAGGCGG |
| Sequence-based reagent | dGTP-DT2 template | Szabó et al., 2020 | Template oligo for dATP measurement | GGAGTGAGTGTGAGGTGAATGGTTTCTTTCTTTGGCGGTGGAGGCGG |
| Software | FastQC | Babraham Bioinformatics https://www.bioinformatics.babraham.ac.uk/projects/fastqc/ | v.0.11.9 | |
| Software | Trimmomatic | Bolger et al., 2014; http://www.usadellab.org/cms/?page=trimmomatic | Trimmomatic-0.38 | |
| Software | Bowtie2 | Langmead and Salzberg, 2012; https://bowtie-bio.sourceforge.net/bowtie2/index.shtml | 2.5.4 | |
| Software | Samblaster | Faust and Hall, 2014; https://github.com/GregoryFaust/samblaster | 0.1.26 RRID:SCR_000468 | |
| Software | Samtools | Li et al., 2009; https://www.htslib.org/ | 1.20 | |
| Software | Picard | https://github.com/broadinstitute/picard | 2.23.3 RRID:SCR_006525 | |
| Software | GATK | McKenna et al., 2010; https://gatk.broadinstitute.org/hc/en-us | 4.1.8.1 |
Table 3
Oligonucleotides used for the dNTP measurements.
| Name | Sequence (5'→3') |
|---|---|
| NDP-1 primer | CCGCCTCCACCGCC |
| FAM-dTTP probe | 6-FAM/AGGACCGAG/ZEN/GCAAGAGCGAGCGA/IBFQ |
| FAM-dATP probe | 6-FAM/TGGTCCGTG/ZEN/GCTTGTGCGTGCGT/IBFQ |
| FAM-dGTP probe | 6-FAM/ACCATTCAC/ZEN/CTCACACTCACTCC/IBFQ |
| FAM-dCTP probe | 6-FAM/AGGATTGAG/ZEN/GTAAGAGTGAGTGG/IBFQ |
| dTTP-DT1 template | TCGCTCGCTCTTGCCTCGGTCCTTTATTTGGCGGTGGAGGCGG |
| dATP-DT1 template | ACGCACGCACAAGCCACGGACCAAATAAAGGCGGTGGAGGCGG |
| dCTP-DT1 template | CCACTCACTCTTACCTCAATCCTTTGTTTGGCGGTGGAGGCGG |
| dGTP-DT2 template | GGAGTGAGTGTGAGGTGAATGGTTTCTTTCTTTGGCGGTGGAGGCGG |
Additional files
-
Supplementary file 1
Nucleotide sequence and measured efficiency of primers used for the qPCR.
- https://cdn.elifesciences.org/articles/96695/elife-96695-supp1-v1.docx
-
Supplementary file 2
User guide for whole genome sequencing (WGS) data files deposited in the European nucleotide archive (ENA).
- https://cdn.elifesciences.org/articles/96695/elife-96695-supp2-v1.docx
-
MDAR checklist
- https://cdn.elifesciences.org/articles/96695/elife-96695-mdarchecklist1-v1.docx
Download links
A two-part list of links to download the article, or parts of the article, in various formats.
Downloads (link to download the article as PDF)
Open citations (links to open the citations from this article in various online reference manager services)
Cite this article (links to download the citations from this article in formats compatible with various reference manager tools)
Genetic stability of Mycobacterium smegmatis under the stress of first-line antitubercular agents
eLife 13:RP96695.
https://doi.org/10.7554/eLife.96695.3


