Treacle’s ability to form liquid-like phase condensates is essential for nucleolar fibrillar center assembly, efficient rRNA transcription and processing, and rRNA gene repair
- Department of Cellular Genomics, Institute of Gene Biology RAS, Russian Federation
- Center for Precision Genome Editing and Genetic Technologies for Biomedicine, Institute of Gene Biology RAS, Russian Federation
- Institute for Translational Medicine and Biotechnology, Sechenov First Moscow State Medical University, Russian Federation
- A.N. Belozersky Institute of Physico-Chemical Biology, Lomonosov Moscow State University, Russian Federation
- Biological Faculty, Lomonosov Moscow State University, Russian Federation
Figures
Figure 1 with 2 supplements
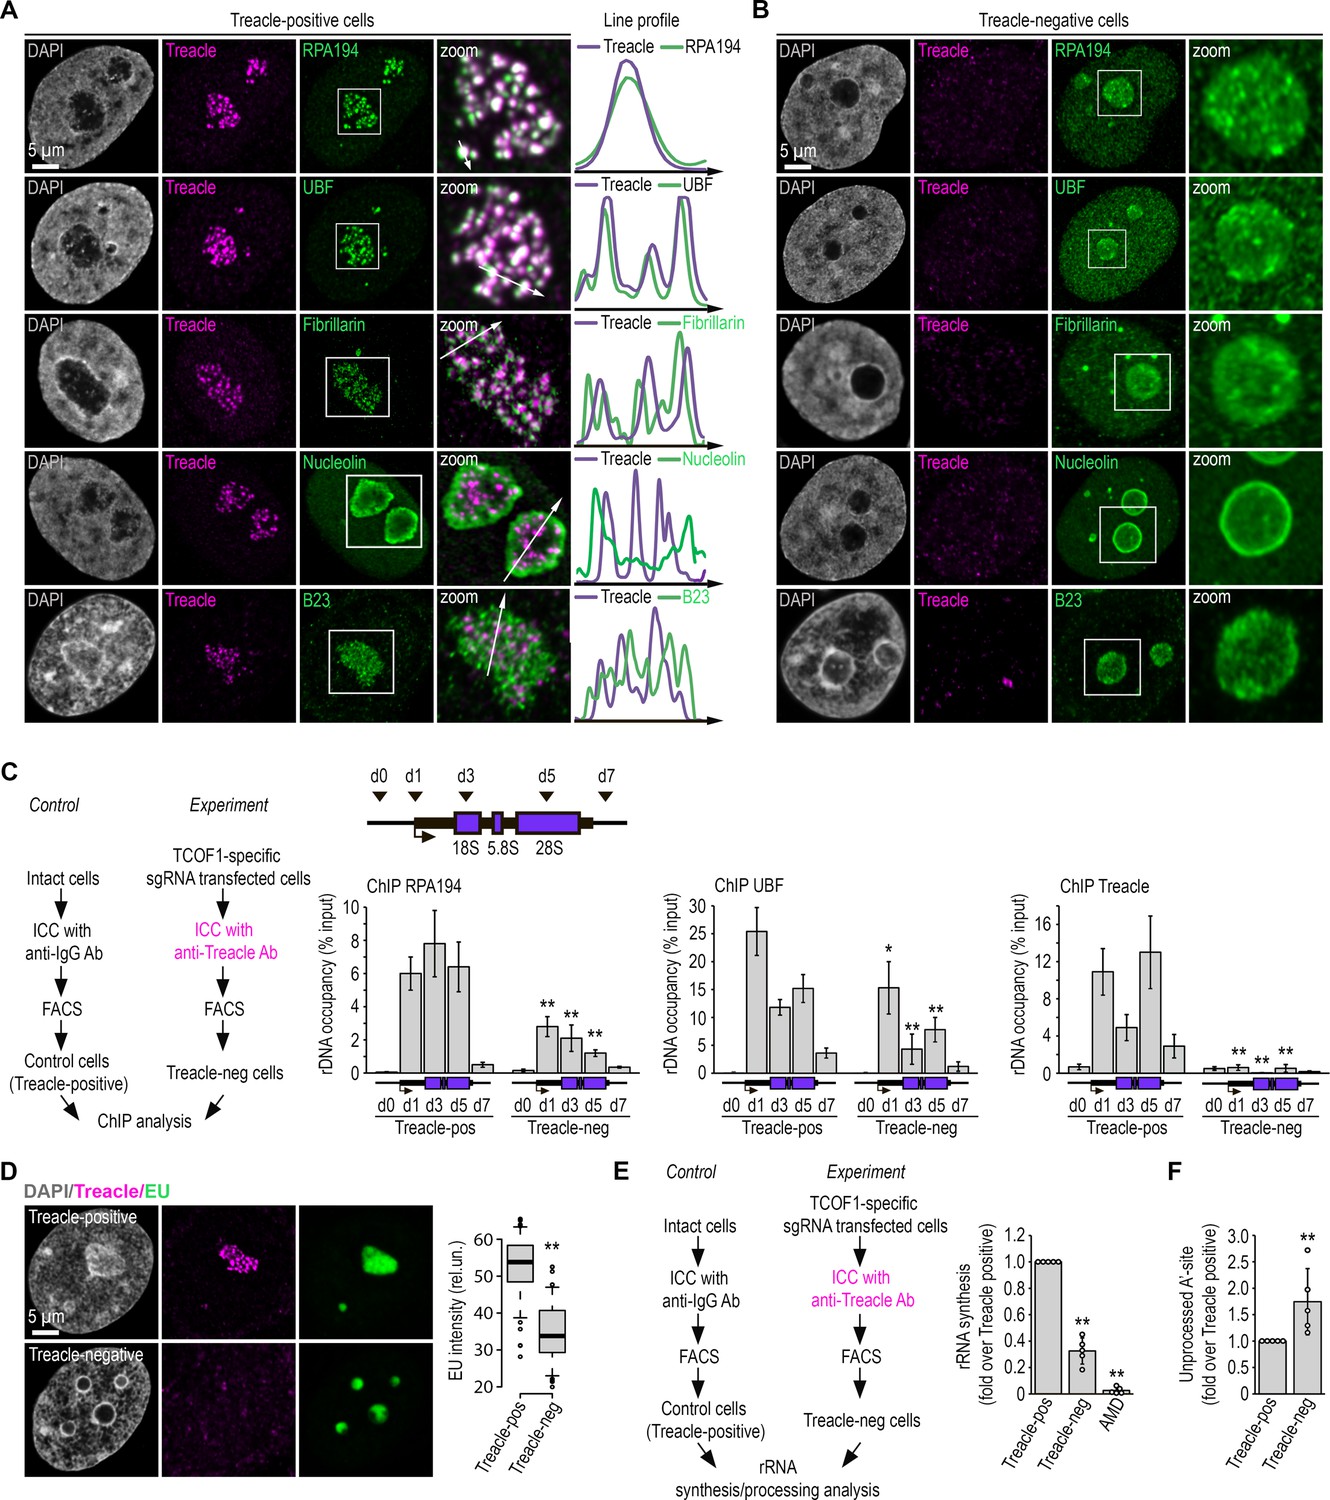
Treacle is a scaffold protein for nucleolar fibrillar centers (FCs) and dense fibrillar components (DFCs).
(A) Intact HeLa cells (Treacle-positive) were fixed and co-immunostained with Treacle and with either RPA194, UBF, fibrillarin, B23, or nucleolin antibodies. DNA was stained with DAPI (gray). Cells were analyzed by laser scanning confocal microscopy. Representative images of cells and nucleoli (magnified images) are shown. Co-localization analysis was performed on the merged images. Graphs illustrate quantification in arbitrary units of fluorescence distribution along the lines shown in the figures. (B) HeLa cells were transfected with a construct coding CRISPR/Cas9 and single guide RNA (sgRNA) to the TCOF1 gene. 7–10 days after transfection, the cells were fixed and co-immunostained with Treacle and either RPA194, UBF, fibrillarin, B23, or nucleolin antibodies. DNA was stained with DAPI (gray). Cells were analyzed by laser scanning confocal microscopy. Representative images of Treacle-negative cells and nucleoli (magnified images) are shown. (C) HeLa cells were transfected with a construct coding CRISPR/Cas9 and sgRNA to the TCOF1 gene (experiment). 7–10 days after transfection cell were fixed, immunostained with Treacle antibodies, and subjected to cell sorting in the fluorescent analysis mode to obtain Treacle-negative populations. Intact HeLa cells (control) were fixed, immunostained with IgG antibodies, passed through all FACS-related procedure in the light scattering analysis mode, and used as a control (Treacle-positive). The sorted cell fractions were used for chromatin immunoprecipitation (ChIP) analysis with either Treacle, RPA194, or UBF antibodies. ChIP was followed by quantitative polymerase chain reaction (qPCR) using the d0, d1, d3, d5, d7 primers to the ribosomal RNA (rRNA) gene (positioned as indicated on the scheme). Data are represented relative to the input. Values are means ± SD from at least three independent replicates (**, p<0.01; *, p<0.1; by unpaired t test). (D) HeLa cells were transfected with a construct coding CRISPR/Cas9 and sgRNA to the TCOF1 gene. 7–10 days after transfection the cells were pulsed with EU (100 μM for 2 hr), fixed and immunostained with Treacle antibodies. EU (green) was revealed by click chemistry. The DNA was stained with DAPI (gray). Representative images of Treacle-positive and Treacle-negative HeLa cells are shown. Quantification of EU fluorescence intensities in Treacle-positive and Treacle-negative HeLa cells are shown in the right panel (**, p<0.01 by unpaired t test; n>500). (E) HeLa cells were transfected with a construct coding CRISPR/Cas9 and sgRNA to the TCOF1 gene (experiment). 7–10 days after transfection the cells were fixed, immunostained with Treacle antibodies, and subjected to cell sorting in the fluorescent analysis mode to obtain Treacle-negative populations. Intact HeLa cells (control) were fixed, stained with IgG antibodies, passed through all FACS-related procedure in the light scattering analysis mode, and used as a control (Treacle-positive). The sorted cell fractions were used for RNA extraction. Reverse transcription-qPCR (RT-qPCR) was performed; it shows levels of 47S pre-rRNA normalized to GAPDH mRNA. Normalized pre-rRNA level in Treacle-positive cells is set to 1. Values are mean ± SD. The calculation is presented for five biological replicates (**, p<0.01 by unpaired t test). (F) HeLa cells were processed as described in (E). It shows levels of A′ site contained unprocessed rRNA normalized to GAPDH mRNA. Normalized unprocessed rRNA level in Treacle-positive cells is set to 1. Values are mean ± SD. The calculation is presented for five biological replicates (**, p<0.01 by unpaired t test).
Figure 1—figure supplement 1
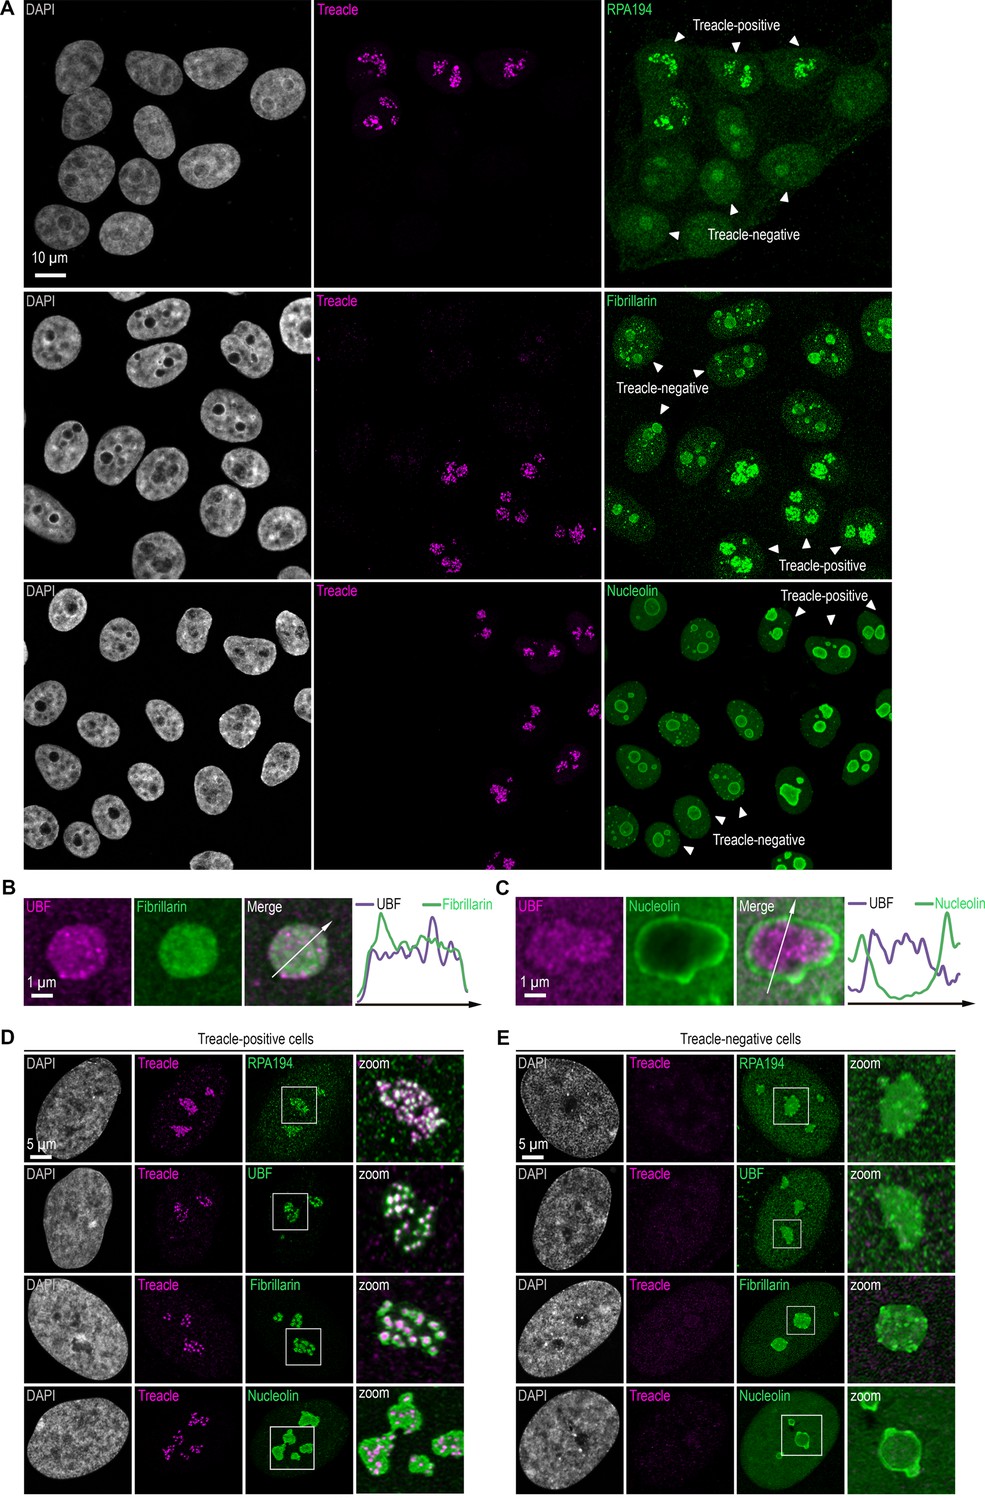
Treacle depletion induces dispersion and mixing of FC and DFC within nucleoli in both HeLa cells and normal fibroblasts.
(A) HeLa cells were transfected with a construct coding CRISPR/Cas9 and single guide RNA (sgRNA) to the TCOF1 gene. 7–10 days after transfection, the cells were fixed and co-immunostained with Treacle and either RPA194, fibrillarin, or nucleolin antibodies. The DNA was stained with DAPI (gray). Cells were analyzed by laser scanning confocal microscopy. Micrographs depicting representative cell fields are presented, with Treacle-positive and Treacle-negative cells denoted by white triangles. (B) HeLa cells were processed as described in (A) and co-immunostained with fibrillarin and UBF antibodies. Cells were analyzed by laser scanning confocal microscopy. Representative images of Treacle-negative nucleolus (magnified images) are shown. (C) HeLa cells were processed as described in (A) and co-immunostained with nucleolin and UBF antibodies. (D) Intact human skin fibroblasts (Treacle-positive) were fixed and co-immunostained with Treacle and with either RPA194, UBF, fibrillarin, or nucleolin antibodies. DNA was stained with DAPI (gray). Cells were analyzed by laser scanning confocal microscopy. Representative images of cells and nucleoli (magnified images) are shown. (E) Human skin fibroblasts cells were transfected with a construct coding CRISPR/Cas9 and sgRNA to the TCOF1 gene. 7–10 days after transfection, the cells were fixed and co-immunostained with Treacle and either RPA194, UBF, fibrillarin, or nucleolin antibodies. DNA was stained with DAPI (gray). Cells were analyzed by laser scanning confocal microscopy. Representative images of Treacle-negative cells and nucleoli (magnified images) are shown.
Figure 1—figure supplement 2
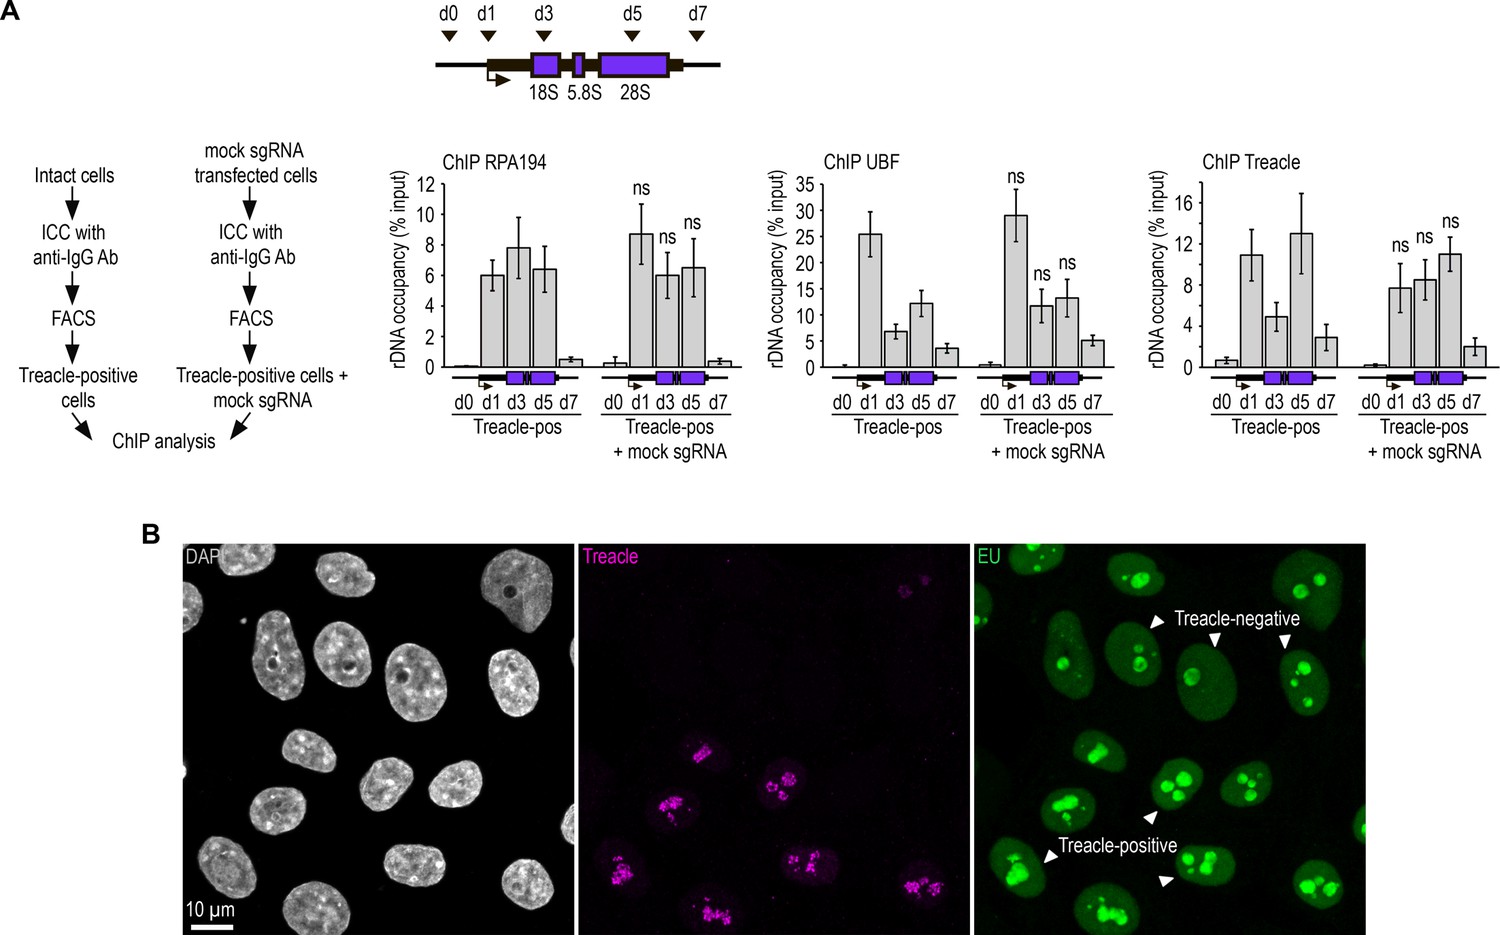
Depletion of Treacle impairs RNA polymerase I-mediated transcription within the nucleolus.
(A) HeLa cells were transfected with a construct encoding CRISPR/Cas9 and a mock single guide RNA (sgRNA). 7–10 days post-transfection, cells were fixed, immunostained with IgG antibodies, and processed through FACS-related procedure in light scattering analysis mode (Treacle-positive cells+mock sgRNA). Similarly, intact HeLa cells were fixed, immunostained with IgG antibodies, and processed through FACS-related procedure in light scattering analysis mode (Treacle-positive cells). The resulting cell populations were utilized for chromatin immunoprecipitation (ChIP) analysis. ChIP was followed by quantitative polymerase chain reaction (qPCR) using primers (d0, d1, d3, d5, d7) targeting specific regions of the ribosomal RNA (rRNA) gene, as indicated in the schematic. Data are presented relative to the input and expressed as means ± SD from at least three independent replicates. n.s., not significant by unpaired t test. (B) HeLa cells were transfected with a construct coding CRISPR/Cas9 and sgRNA to the TCOF1 gene. 7–10 days after transfection the cells were pulsed with EU (100 μM for 2 hr), fixed and immunostained with Treacle antibodies. EU (green) was revealed by click chemistry. The DNA was stained with DAPI (gray). Cells were analyzed by laser scanning confocal microscopy. Micrographs depicting representative cell fields are presented, with Treacle-positive and Treacle-negative cells denoted by white triangles.
Figure 2 with 9 supplements
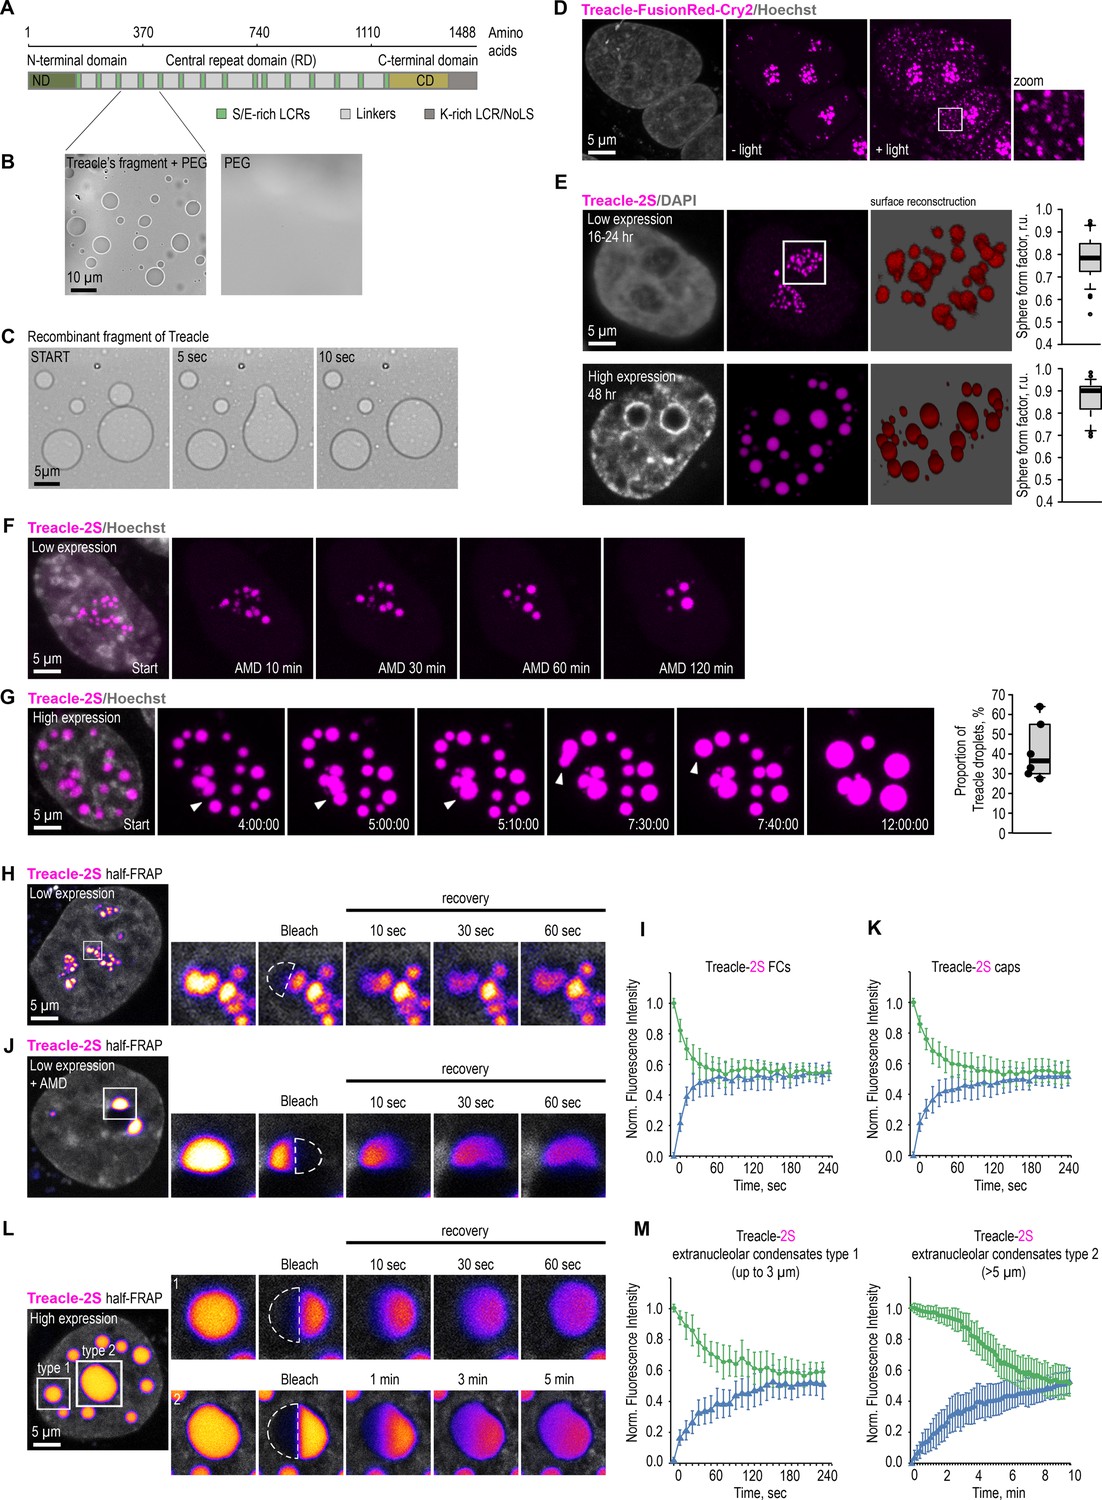
Treacle drives the formation of nuclear condensates.
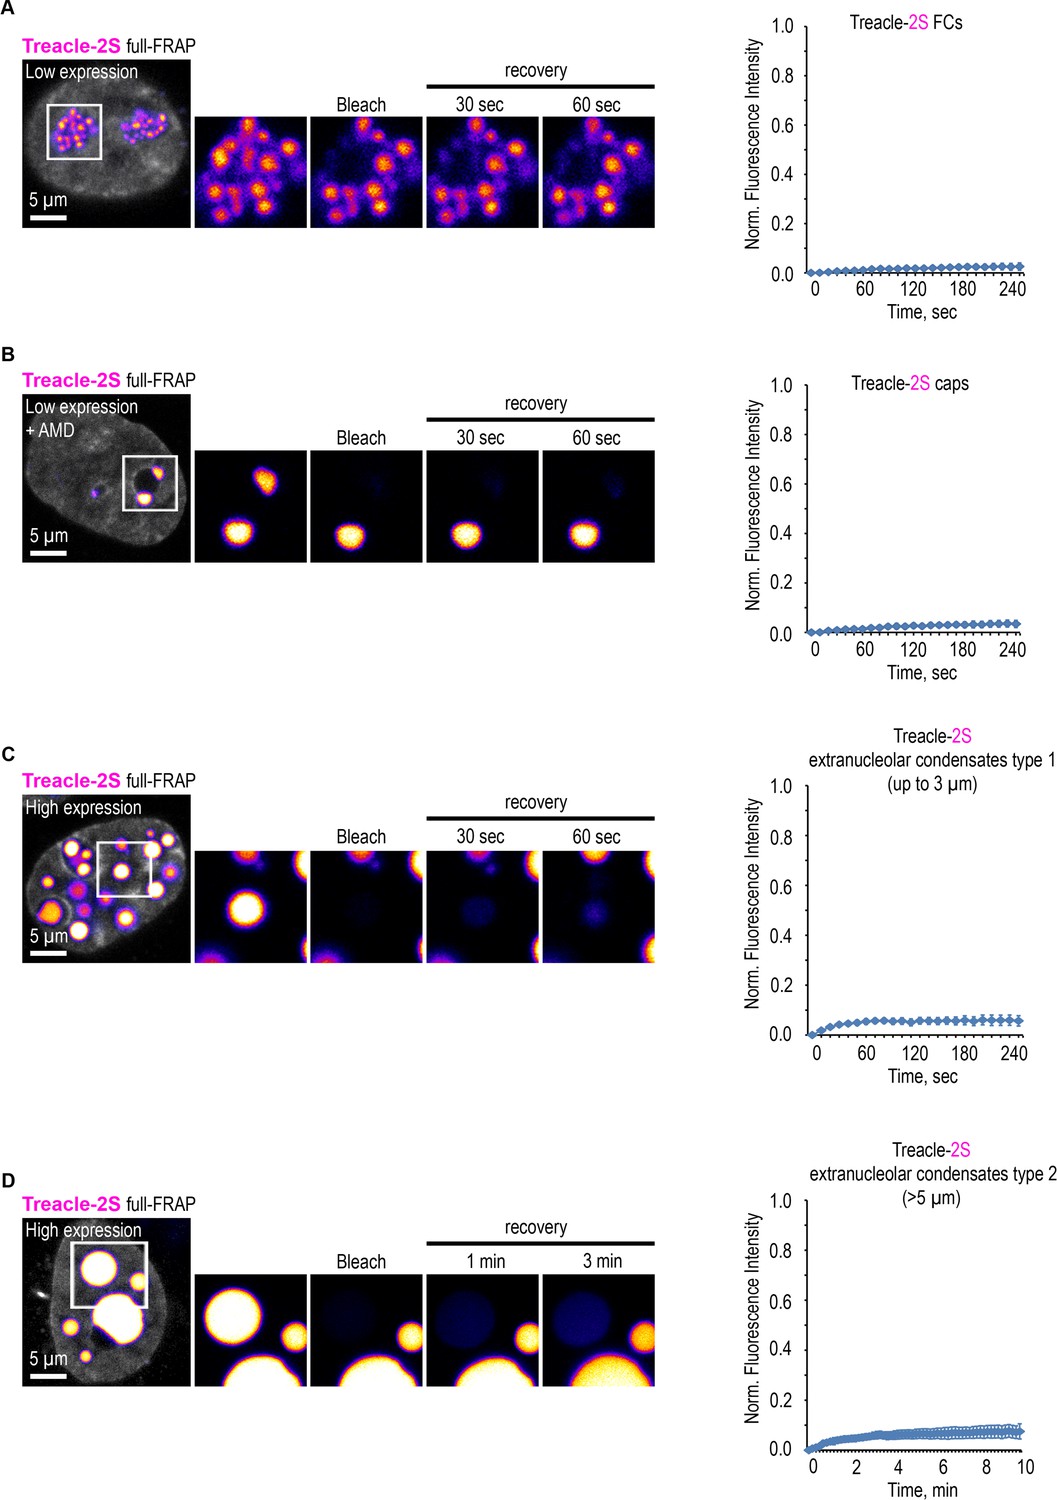
(A) The structure of the most common isoform of Treacle. Treacle isoform d (1488 amino acids, 152 kDa, NP_001128715.1) is encoded by the Treacle transcript variant 4. It is an intrinsically disordered protein with N-terminal (ND, 1–83 aa), C-terminal (CD, 1121–1488 aa) regions, and central repeated domain (RD, 83–1121 aa) consisting of 15 low-complexity regions (LCRs) interspersed with disordered linker sequences. (B) The purified recombinant fragment of Treacle undergoes condensation in vitro in the presence of 5% polyethylene glycol. (C) Condensates of recombinant Treacle’s fragment were time-lapse imaged. Representative images of condensates fusion events are shown. (D) HeLa cells were transfected with Treacle-FusionRed-Cry2 (opto-Treacle) construct. DNA was stained with Hoechst 33342 (gray). Formation of Treacle condensates was induced with blue light illumination of the cells for 10 s. Representative images are shown. (E) HeLa cells were transfected with Treacle-Katushka2S (Treacle-2S) at a quantity of 50 ng plasmids per 2×10⁵ cells. For low levels of expression analysis, the cells were fixed 16–24 hr after transfection. For high levels of expression analysis, the cells were fixed 48 hr after transfection. DNA was stained with DAPI (gray). Cells were analyzed by laser scanning confocal microscopy. Surface reconstructions of Treacle-2S fibrillar centers (FCs) or extranucleolar condensates are shown in the right panels. Graphs illustrate quantification in arbitrary units of the 3D analysis of Treacle-2S condensate’s shape by LasX software. Sphere form factor = sphere area/particle area. (F) 16–24 hr after transfection with Treacle-2S, HeLa cells were treated with 0.05 µg/ml actinomycin D (AMD) to induce rDNA transcriptional repression and time-lapse imaged for 120 min. DNA was stained with Hoechst 33342 (gray). (G) 48 hr after transfection with Treacle-2S, HeLa cells were live time-lapse imaged for 12 hr. DNA was stained with Hoechst 33342 (gray). Representative images of cells with Treacle-2S condensates fusion events are shown. Graphs illustrate the frequency of fusion Treacle condensates per cell for 12 hr. The calculation is presented for six biological replicates of 10 cells each. (H) HeLa cells were transiently transfected with Treacle-2S. 16–24 hr after transfection half-fluorescence recovery after photobleaching (FRAP) analysis of Treacle-labeled fibrillar center (FCs) was performed. Half of the one FC was bleached, and fluorescence recovery was monitored. Representative time-lapse images of the photobleached FC are shown (magnified images). DNA was stained with Hoechst 33342 (gray). (I) Graphs illustrate the quantification of the FCs half-FRAP analysis described in (H). Half-FRAP curves represent the normalized intensity in the bleached half (blue) and the non-bleached half (green). Each trace represents an average of measurements for at least 20 FCs; error bars represent SD. (J) 16–24 hr after transfection with Treacle-2S, HeLa cells were treated with 0.05 µg/ml AMD to induce the formation of nucleolar caps. Half-FRAP analysis of Treacle-labeled nucleolar caps was performed. Representative time-lapse images of photobleached nucleolar caps are shown (magnified images). DNA was stained with Hoechst 33342 (gray). (K) Graphs illustrate the quantification of the nucleolar caps half-FRAP analysis described in (J). Half-FRAP curves represent the normalized intensity in the bleached half (blue) and the non-bleached half (green). Each trace represents an average of measurements for at least 20 caps; error bars represent SD. (L) HeLa cells were transiently transfected with Treacle-2S. 48 hr after transfection, half-FRAP analysis of Treacle-2S extranucleolar condensates was performed. Half of one condensate was bleached, and fluorescence recovery was monitored. The analysis included condensates with diameters of up to 3 µm (type 1), as well as the largest condensates exceeding 5 µm in diameter (type 2). Representative time-lapse images of photobleached Treacle-2S extranucleolar condensates of both categories are shown (magnified images). DNA was stained with Hoechst 33342 (gray). (M) Graphs illustrate the quantification of the nucleolar caps half-FRAP analysis described in (L). Half-FRAP curves represent the normalized intensity in the bleached half (blue) and the non-bleached half (green). Each trace represents an average of measurements for at least 20 extranucleolar condensates of both categories; error bars represent SD. DNA was stained with Hoechst 33342 (gray).
Figure 2—figure supplement 1
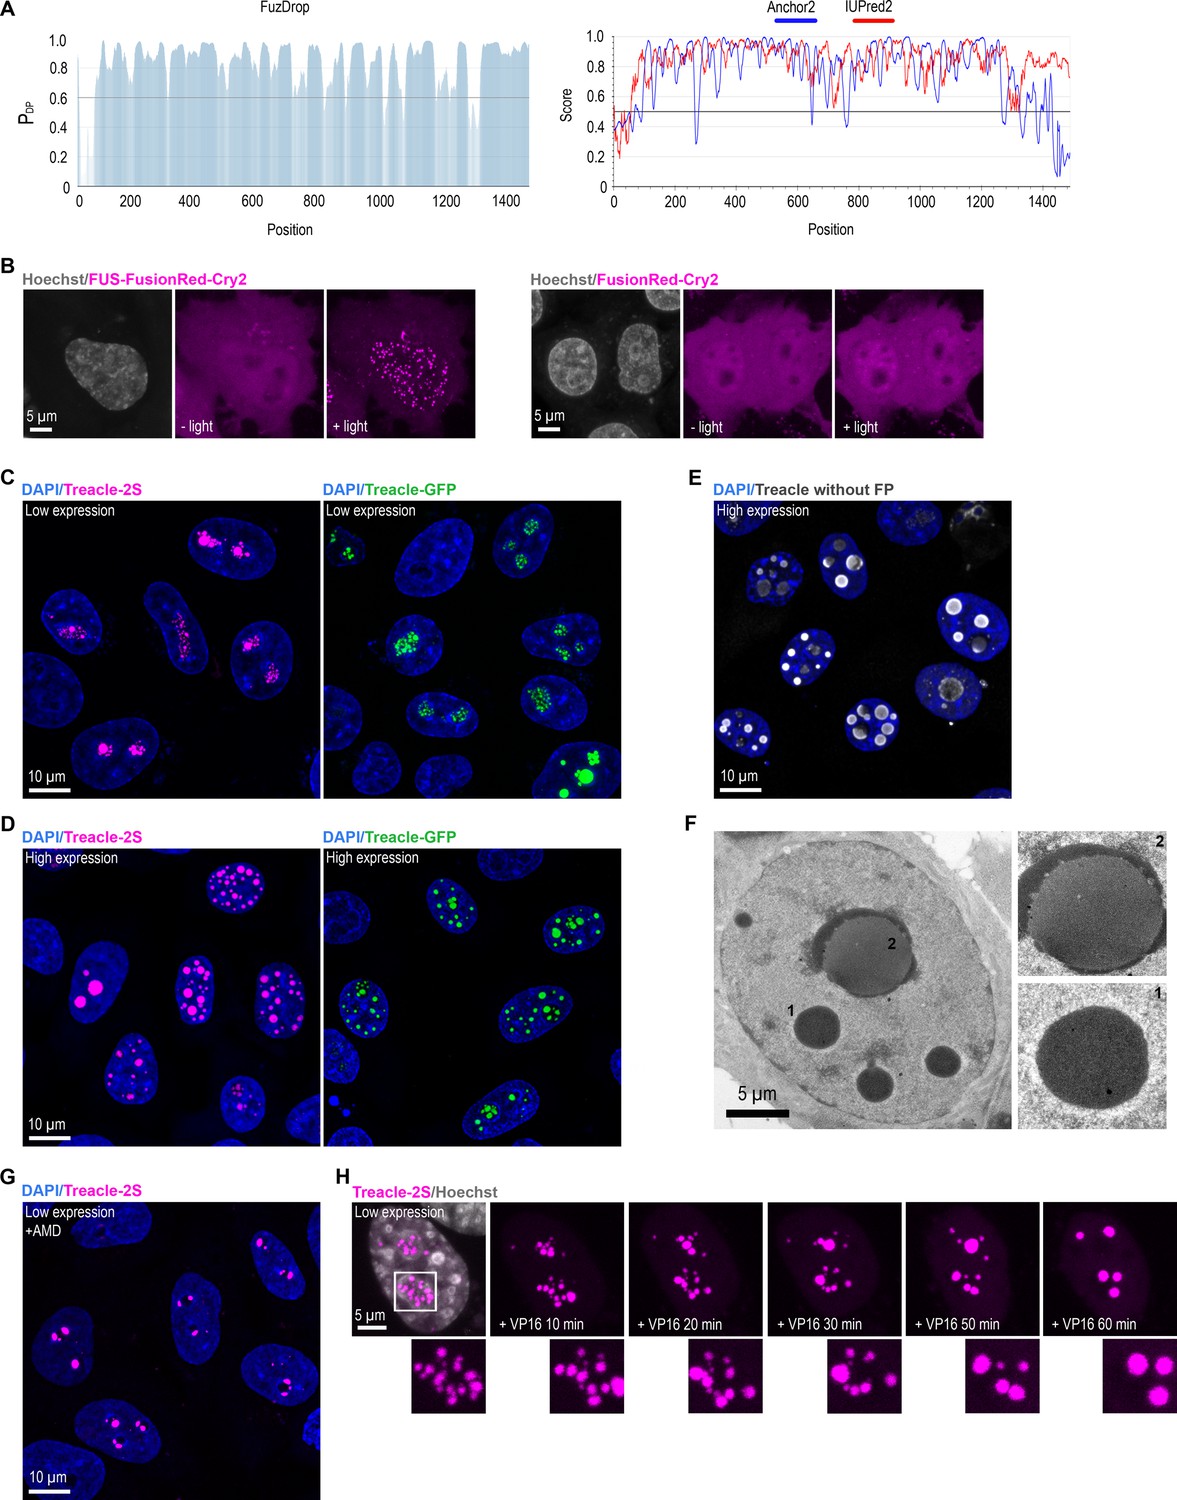
Treacle is an intrinsically disordered protein that forms intranuclear condensates upon overexpression.
(A) Full-length Treacle disorder characteristics predicted by FuzDrop, Anchor2, and IUprep2. (B) HeLa cells were transfected with FusionRed-Cry2 or FUS-FusionRed-Cry2 constructs and, 24 hr after transfection, were illuminated with blue light for 10 s. DNA was stained with Hoechst 33342 (gray). (C) HeLa cells were transfected with Treacle-Katushka2S (Treacle-2S) or Treacle-GFP at a quantity of 50 ng plasmids per 2×10⁵ cells. For low levels of expression analysis, the cells were fixed 16–24 after transfection. DNA was stained with DAPI (blue). Cells were analyzed by laser scanning confocal microscopy. Micrographs depicting representative cell fields are presented. (D) HeLa cells were transfected with Treacle-2S or Treacle-GFP at a quantity of 50 ng plasmids per 2×10⁵ cells. For high levels of expression analysis, the cells were fixed 48 after transfection. DNA was stained with DAPI (blue). Cells were analyzed by laser scanning confocal microscopy. Micrographs depicting representative cell fields are presented. (E) HeLa cells were transfected with Treacle-2S in the absence of a fused fluorescent protein (Treacle without FP). For high levels of expression analysis, the cells were fixed 48 after transfection and immunostained with Treacle antibodies. The DNA was stained with DAPI (blue). Micrographs depicting representative cell fields are presented. (F) HeLa cells were transfected with Treacle-2S and, 24 hr after transfection were fixed and subjected to transmission electron microscopy imaging. (G) 16–24 hr after transfection with Treacle-2S, HeLa cells were treated with 0.05 µg/ml actinomycin D (AMD) to induce rDNA transcriptional repression and subsequent nucleolar cap formation. The cells were fixed and the DNA was stained with DAPI (blue). Micrographs depicting representative cell fields are presented. (H) HeLa cells were transfected with Treacle-2S. 24 hr after transfection, the cells were treated with 90 μM VP16 to induce DNA breaks and live time-lapse imaged for 60 min. Representative examples of Treacle-2S fusions (magnified regions) are shown. DNA was stained with Hoechst 33342 (gray).
Figure 2—figure supplement 2
Treacle exhibits limited molecular dynamics between condensates.
Figure 2—video 1
Intranucleolar Treacle-2S fusion events (low expression, actinomycin D [AMD]-treated cells).
Figure 2—video 2
Extranucleolar Treacle-2S fusion events (high expression).
Figure 2—video 3
Treacle-2S fibrillar centers (FCs) half-fluorescence recovery after photobleaching (FRAP).
Figure 2—video 4
Treacle-2S actinomycin D (AMD) half-fluorescence recovery after photobleaching (FRAP).
Figure 2—video 5
.Treacle-2S intranucleolar condensates type 1 half-fluorescence recovery after photobleaching (FRAP).
Figure 2—video 6
Treacle-2S intranucleolar condensate type 2 half-fluorescence recovery after photobleaching (FRAP).
Figure 2—video 7
Intranucleolar Treacle-2S fusion events (low expression, VP16-treated cells).
Figure 3 with 1 supplement
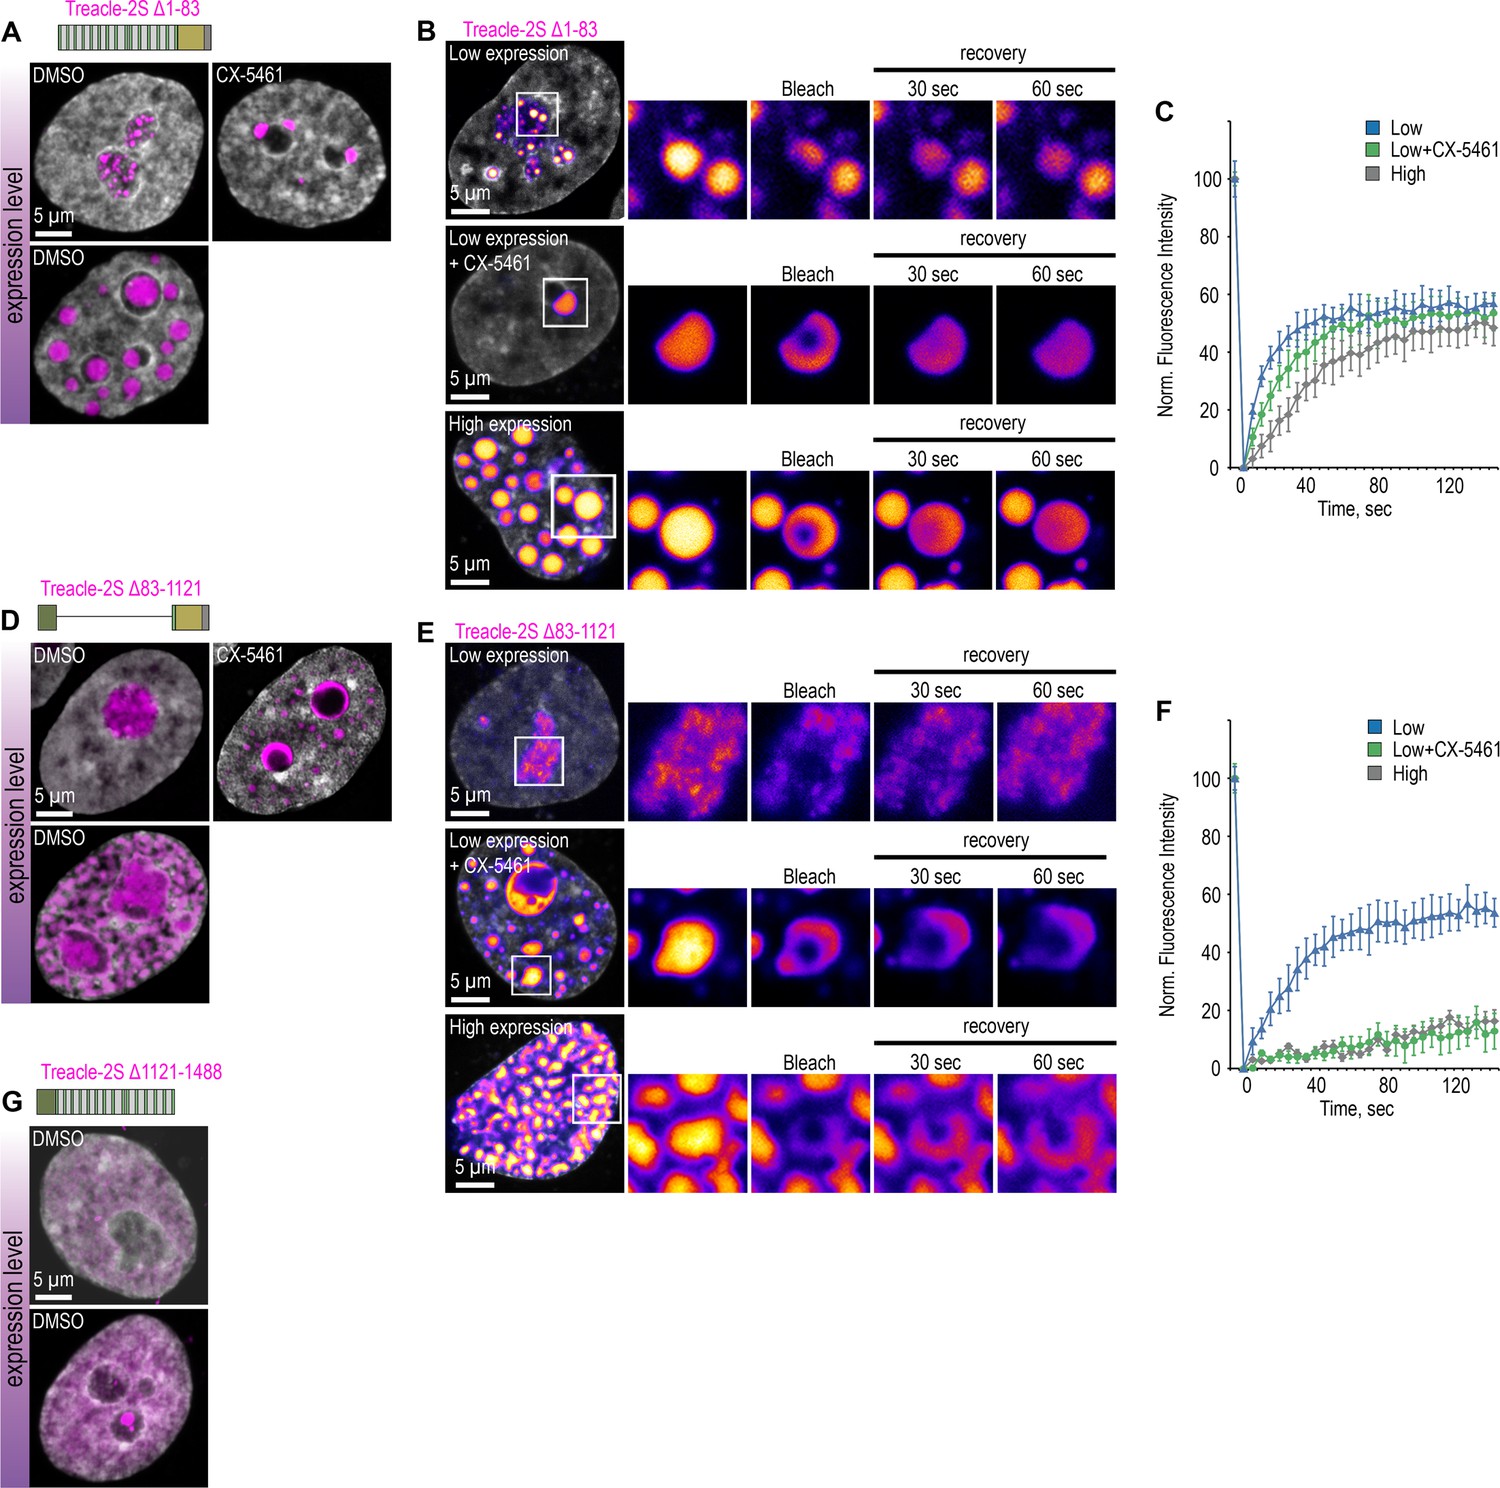
Treacle’s condensation is regulated by its central and C-terminal domains.
(A) HeLa cells were transfected with Treacle-2S Δ1–83 deletion mutant. For low or high levels expression analysis cells were cultivated 16–24 or 48 hr after transfection respectively. The expression level is indicated by the colored zone to the left of the cell images. HeLa cells with low expression level were additionally treated with CX-5461 to induce rDNA transcriptional repression and subsequent nucleolar cap formation. Cells were fixed and analyzed by laser scanning confocal microscopy. DNA was stained with DAPI (gray). Representative images of Treacle-2S Δ1–83 condensate are shown. (B) HeLa cells were transfected with Treacle-2S Δ1–83 deletion mutant and processed as described in (A). Partial fluorescence recovery after photobleaching (FRAP) analysis of Treacle-2S Δ1–83 condensates was performed. A part of each condensate type was photobleached, and the subsequent fluorescence recovery was monitored. Representative time-lapse images of the photobleached condensates are shown (magnified images). DNA was stained with Hoechst 33342 (gray). (C) HeLa cells were transfected with Treacle-2S Δ1–83 deletion mutant and processed as described in (A). Graphs illustrate the quantification of the Treacle-2S Δ1–83 condensates partial FRAP analysis described in (B). Each trace represents an average of measurements for at least 20 Treacle Δ1–83 condensates of each type; error bars represent SD. (D) HeLa cells were transfected with Treacle-2S Δ83–1121 deletion mutant and processed as described in (A). (E) HeLa cells were transfected with Treacle-2S Δ83–1121 deletion mutant and processed as described in (A). Partial FRAP analysis of Treacle-2S Δ83–1121 condensates dynamics was performed as described in (B). (F) HeLa cells were transfected with Treacle-2S Δ83–1121 deletion mutant and processed as described in (A). Partial FRAP analysis of 2S-fused Treacle Δ83–1121 condensates dynamics was performed as described in (B). Graphs illustrate the quantification of the Treacle-2S Δ83–1121 condensates partial FRAP analysis. Each trace represents an average of measurements for at least 20 Treacle-2S Δ83–1121 condensates of each type; error bars represent SD. (G) HeLa cells were transfected with Treacle-2S Δ1121–1488 deletion mutant fused with nuclear localization signal (NLS) from simian virus 40 (SV40). For low or high levels expression analysis cells were cultivated 16–24 or 48 hr after transfection respectively. The expression level is indicated by the colored zone to the left of the cell images. Cells were fixed and analyzed by laser scanning confocal microscopy. DNA was stained with DAPI (gray). Representative images of cells are shown.
Figure 3—figure supplement 1
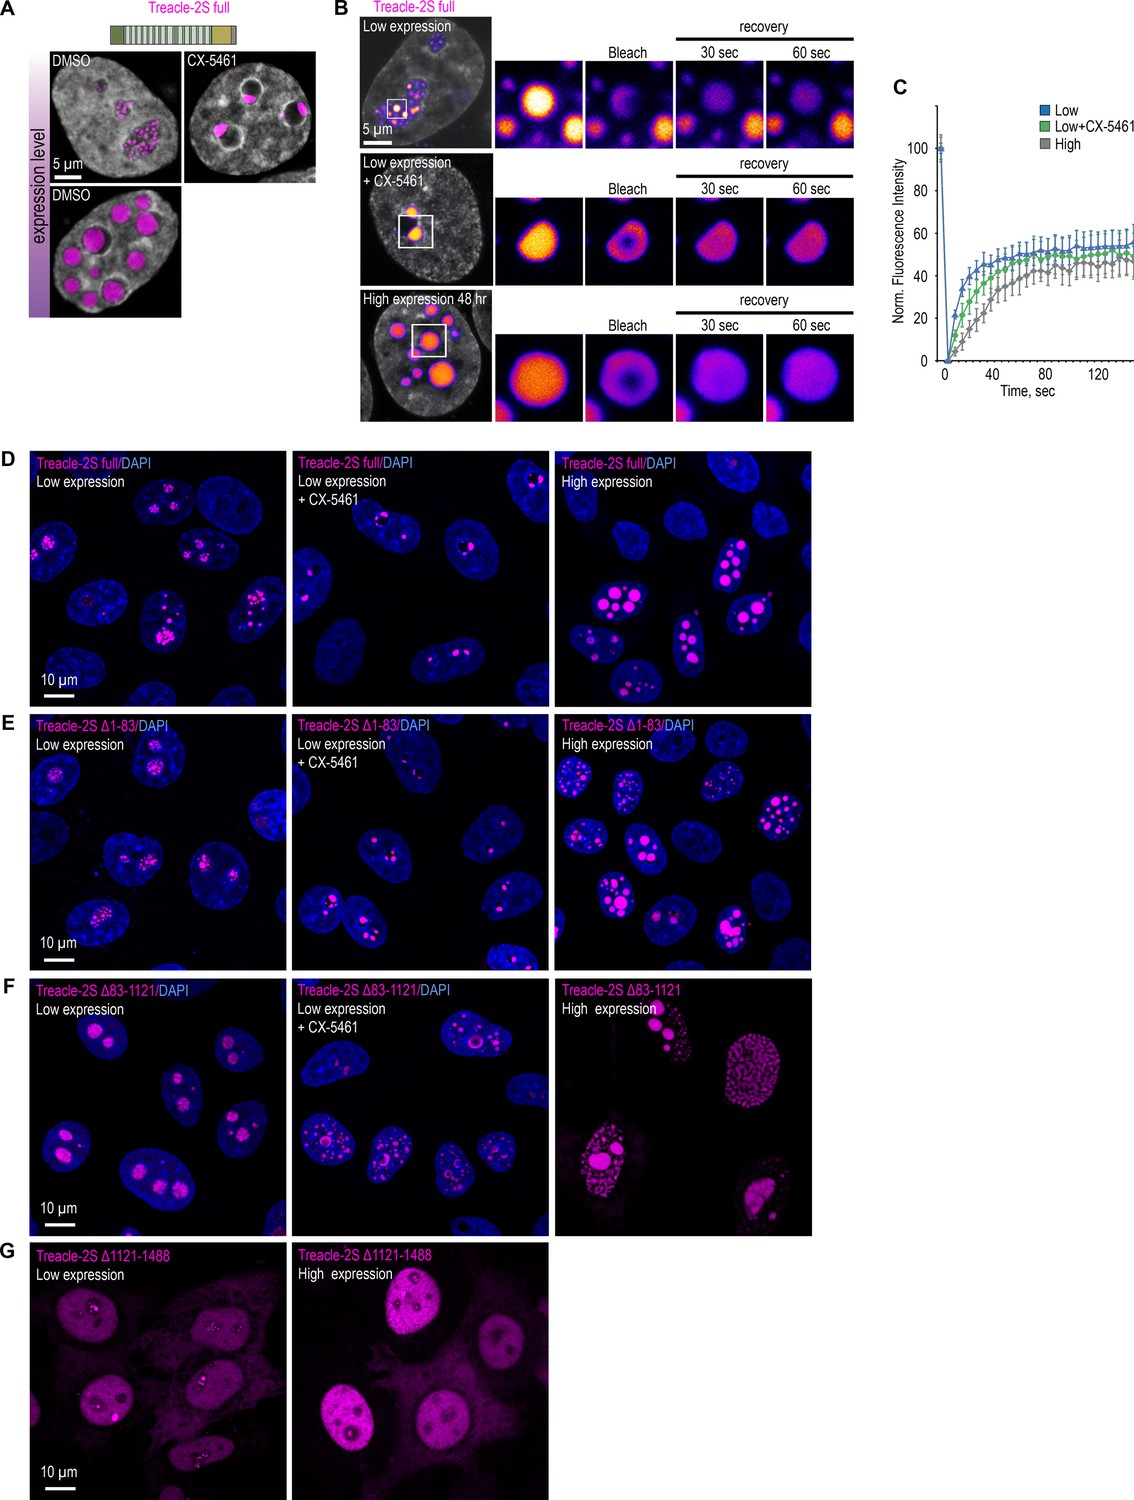
Treacle’s condensation properties are governed by its central repeating domain (RD) and C-terminal domain (CD).
(A) HeLa cells were transfected with full-length Treacle-2S. For low or high levels expression analysis cells were cultivated 16–24 or 48 hr after transfection respectively. The expression level is indicated by the colored zone to the left of the cell images. HeLa cells with low expression level were additionally treated with CX-5461 to induce rDNA transcriptional repression and subsequent nucleolar cap formation. Cells were fixed and analyzed by laser scanning confocal microscopy. DNA was stained with DAPI (blue). Representative images of full-length Treacle-2S condensate are shown. (B) HeLa cells were transfected with full-length Treacle-2S and processed as described in (A). Partial fluorescence recovery after photobleaching (FRAP) analysis of full-length Treacle-2S condensates was performed. A part of each condensate type was photobleached, and the subsequent fluorescence recovery was monitored. Representative time-lapse images of the photobleached condensates are shown (magnified images). DNA was stained with Hoechst 33342 (gray). (C) HeLa cells were transfected with full-length Treacle-2S and processed as described in (A). Partial FRAP analysis of full-length Treacle-2S condensates was performed as described in (B). Graphs illustrate the quantification of the full-length Treacle-2S condensates partial FRAP analysis. Each trace represents an average of measurements for at least 20 full-length Treacle-2S condensates of each type; error bars represent SD. (D) HeLa cells were transfected with full-length Treacle-2S and processed as described in (A). DNA was stained with DAPI (blue). Cells were analyzed by laser scanning confocal microscopy. Micrographs depicting representative cell fields are presented. (E) HeLa cells were transfected with Treacle-2S Δ1–83 deletion mutant and processed as described in (A). DNA was stained with DAPI (blue). Cells were analyzed by laser scanning confocal microscopy. Micrographs depicting representative cell fields are presented. (F) HeLa cells were transfected with Treacle-2S Δ83–1121 deletion mutant and processed as described in (A). DNA was stained with DAPI (blue). Cells were analyzed by laser scanning confocal microscopy. Micrographs depicting representative cell fields are presented. (G) HeLa cells were transfected with Treacle-2S Δ1121–1488 deletion mutant fused with nuclear localization signal (NLS) from simian virus 40 (SV40). For low or high levels expression analysis cells were cultivated 16–24 or 48 hr after transfection respectively. Cells were fixed and analyzed by laser scanning confocal microscopy. Representative images of cells are shown.
Figure 4 with 1 supplement
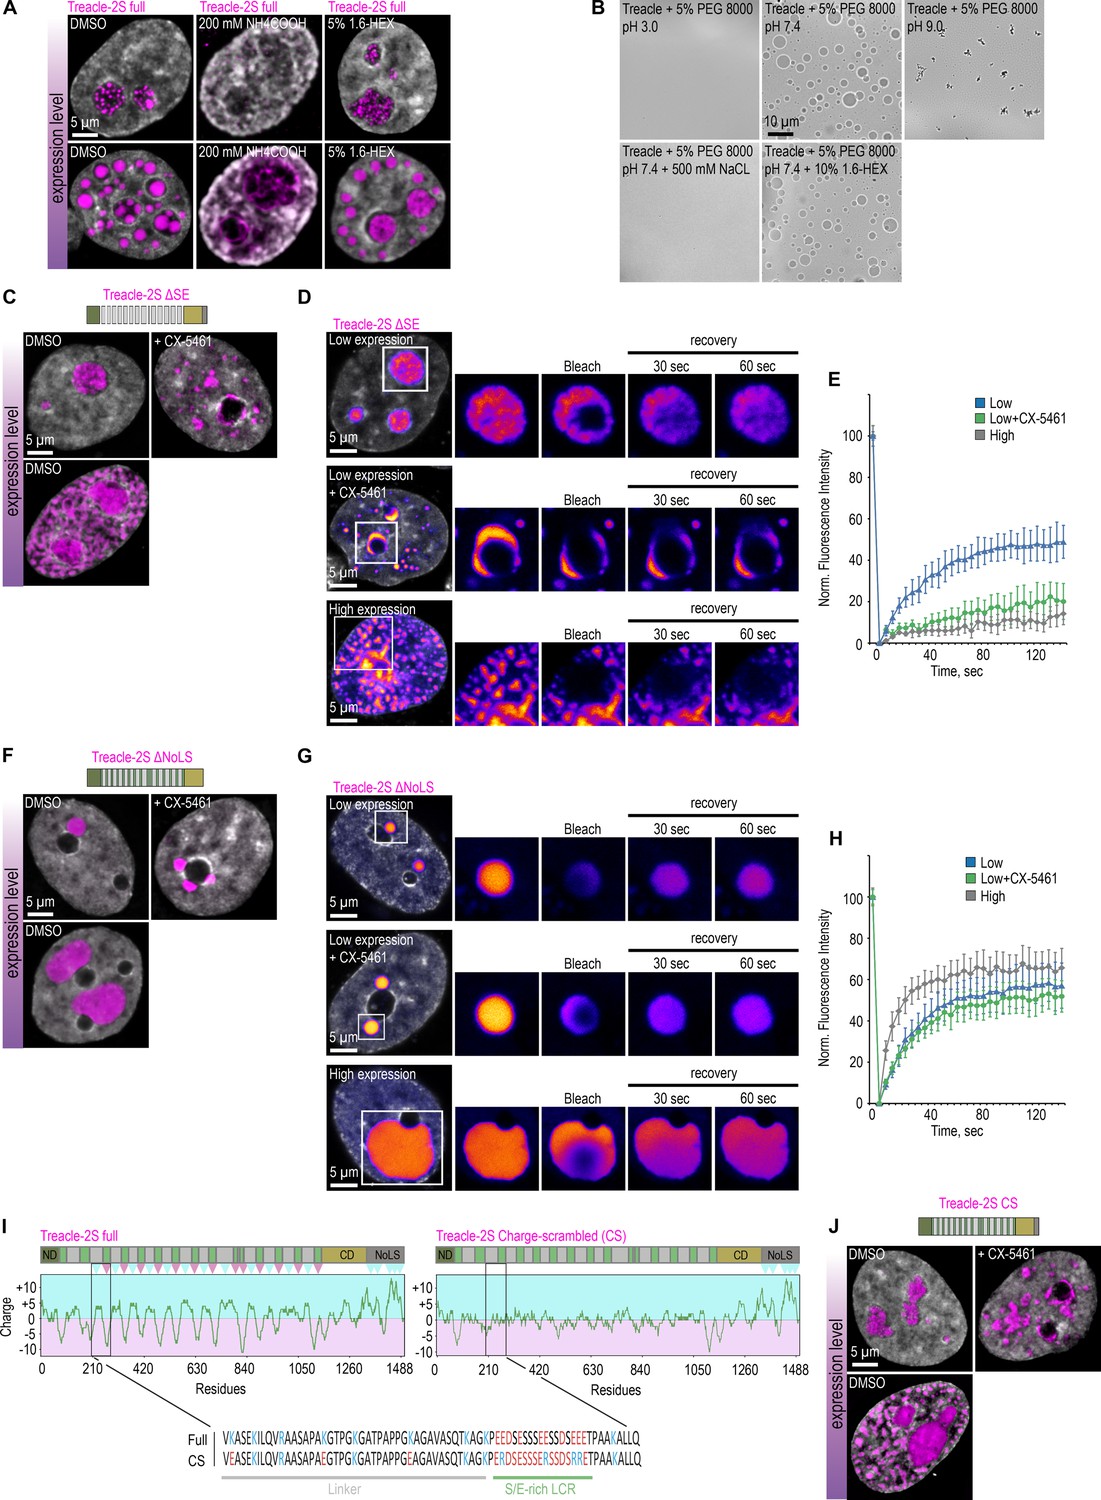
The condensation of Treacle is controlled by the specific charge distribution in its domains.
(A) HeLa cells were transfected with Treacle-2S. For low or high levels expression analysis, cells were cultivated 16–24 or 48 hr after transfection respectively. The expression level is indicated by the colored zone to the left of the cell images. Cells were treated with 5% 1,6-hexandiol (1,6-HEX) for 10 min or 200 mM ammonium acetate for 5 min. Cells were fixed and analyzed by laser scanning confocal microscopy. DNA was stained with DAPI (gray). Representative images of cells are shown. (B) The purified recombinant fragment of Treacle undergoes condensation in vitro in the presence of 10% 1,6-HEX, 500 mM sodium chloride or buffers with different pH. In each case, 5% PEG 8000 was used as a crowding agent. (C) HeLa cells were transfected with Treacle-2S ΔSE mutant. For low or high levels expression analysis cells were cultivated 16–24 or 48 hr after transfection respectively. The expression level is indicated by the colored zone to the left of the cell images. HeLa cells with low expression level were additionally treated with CX-5461 to induce rDNA transcriptional repression. Cells were fixed and analyzed by laser scanning confocal microscopy. DNA was stained with DAPI (gray). Representative images of Treacle ΔSE condensate are shown. (D) HeLa cells were transfected with Treacle-2S ΔSE mutant and processed as described in (C). Partial fluorescence recovery after photobleaching (FRAP) analysis of Treacle-2S ΔSE condensates was performed. A part of each condensate type was photobleached, and the subsequent fluorescence recovery was monitored. Representative time-lapse images of the photobleached condensates are shown (magnified images). DNA was stained with Hoechst 33342 (gray). (E) HeLa cells were transfected with Treacle-2S ΔSE mutant and processed as described in (C). Graphs illustrate the quantification of the Treacle-2S ΔSE condensates partial FRAP analysis described in (D). Each trace represents an average of measurements for at least 20 Treacle-2S ΔSE condensates of each type; error bars represent SD. (F) HeLa cells were transfected with Treacle-2S Δ1350–1488 deletion mutant (Treacle-2S ΔNoLS) and processed as described in (C). (G) HeLa cells were transfected with Treacle-2S ΔNoLS deletion mutant and processed as described in (C). Partial FRAP analysis of Treacle-2S ΔNoLS condensates was performed as described in (D). (H) HeLa cells were transfected with Treacle-2S ΔNoLS deletion mutant and processed as described in (C). Partial FRAP analysis of Treacle-2S ΔNoLS condensates dynamics was performed as described in (D). Graphs illustrate the quantification of the Treacle-2S ΔNoLS condensates partial FRAP analysis. Each trace represents an average of measurements for at least 20 Treacle ΔNoLS condensates of each type; error bars represent SD. (I) Charge plots of full-length Treacle (left panel) and charge-scrambled Treacle (Treacle CS) form (right panel) are shown. Positive and negative charge blocks are depicted by blue and red triangles, respectively. Charge distribution was calculated as the sum of the charges (Arg and Lys, +1; Glu and Asp, −1;) in the 25 amino acids window range. The center of the panel shows the aligned amino acid sequences of one of the S/E-rich low-complexity region (LCR) and its adjacent linker of RD for both full Treacle and Treacle CS. (J) HeLa cells were transfected with Treacle-2S CS mutant and processed as described in (C).
Figure 4—figure supplement 1
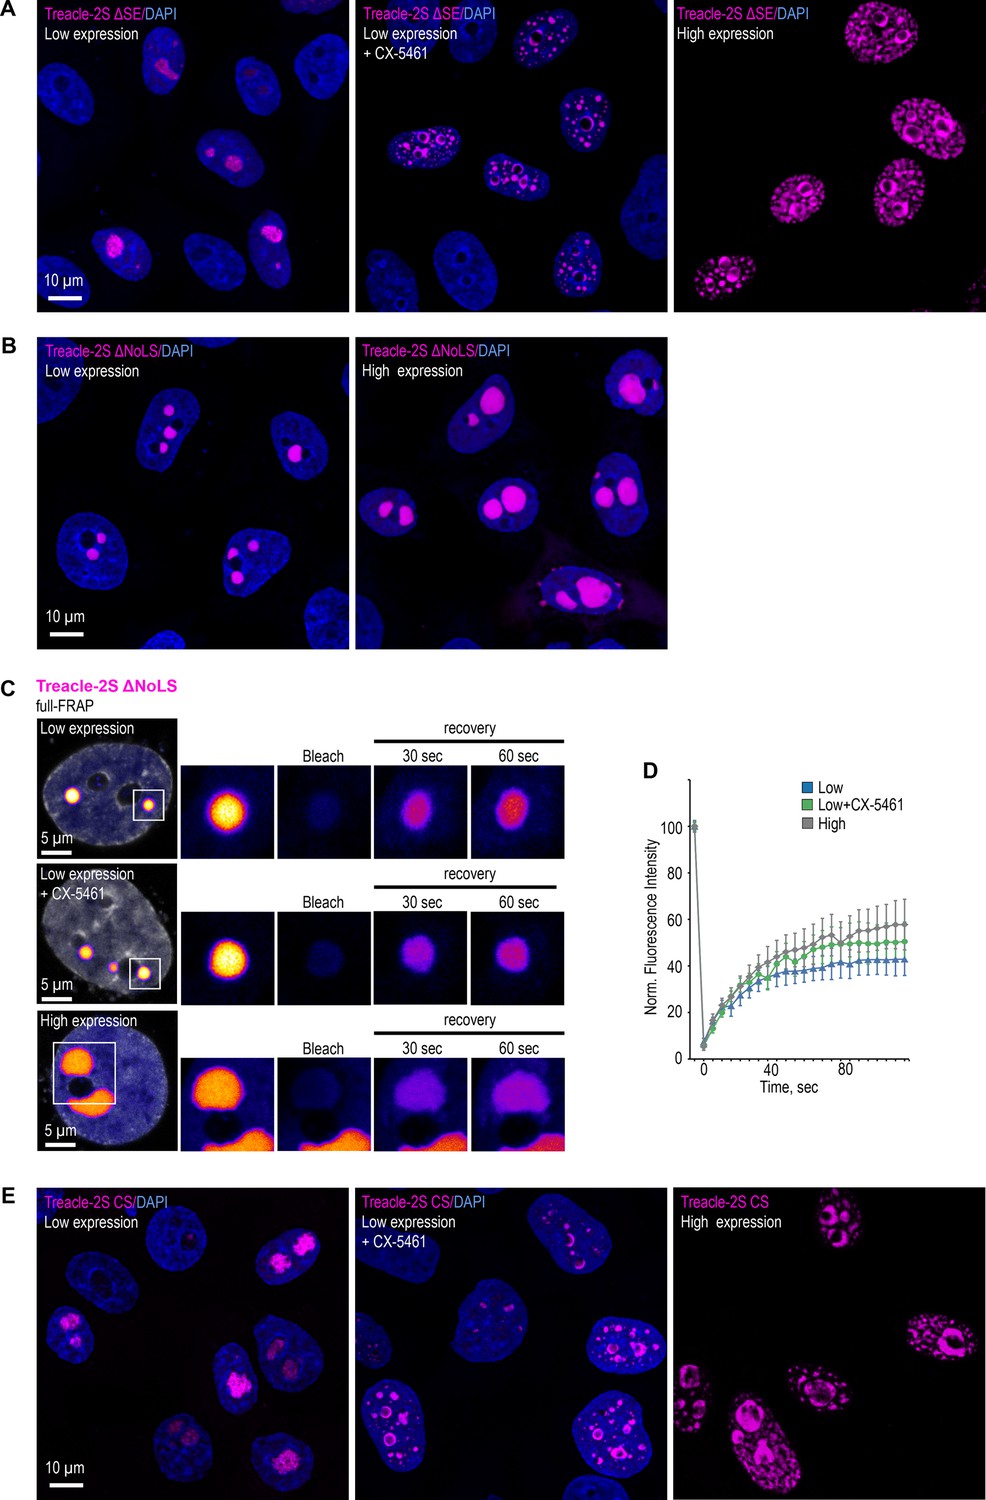
The condensation properties of the Treacle are determined by the charge distribution in its central repeating domain (RD).
(A) HeLa cells were transfected with Treacle-2S ΔSE mutant. For low or high levels expression analysis cells were cultivated 16–24 or 48 hr after transfection respectively. The expression level is indicated by the colored zone to the left of the cell images. HeLa cells with low expression level were additionally treated with CX-5461 to induce rDNA transcriptional repression. Cells were fixed and analyzed by laser scanning confocal microscopy. DNA was stained with DAPI (blue). Micrographs depicting representative cell fields are presented. (B) HeLa cells were transfected with Treacle-2S Δ1350–1488 deletion mutant (Treacle-2S ΔNoLS). For low or high levels expression analysis cells were cultivated 16–24 or 48 hr after transfection respectively. Cells were fixed and analyzed by laser scanning confocal microscopy. DNA was stained with DAPI (blue). Micrographs depicting representative cell fields are presented. (C) HeLa cells were transiently transfected with Treacle-2S ΔNoLS. For low or high levels expression analysis cells were cultivated 16–24 or 48 hr after transfection respectively. HeLa cells with low expression level were additionally treated with CX-5461. Full-fluorescence recovery after photobleaching (FRAP) analysis of Treacle-2S ΔNoLS condensates was performed. Each type of condensate was fully photobleached, and the subsequent fluorescence recovery was monitored. Representative time-lapse images of the photobleached condensates are shown (magnified images). DNA was stained with Hoechst 33342 (gray). (D) HeLa cells were transfected with Treacle-2S ΔNoLS mutant and processed as described in (C). Graphs illustrate the quantification of the Treacle-2S ΔNoLS condensates partial FRAP analysis. Each trace represents an average of measurements for at least 20 Treacle-2S ΔNoLS condensates of each type; error bars represent SD. (E) HeLa cells were transfected with charge-scrambled Treacle-2S mutant (Treacle-2S CS) and processed as described in (A).
Figure 5 with 1 supplement
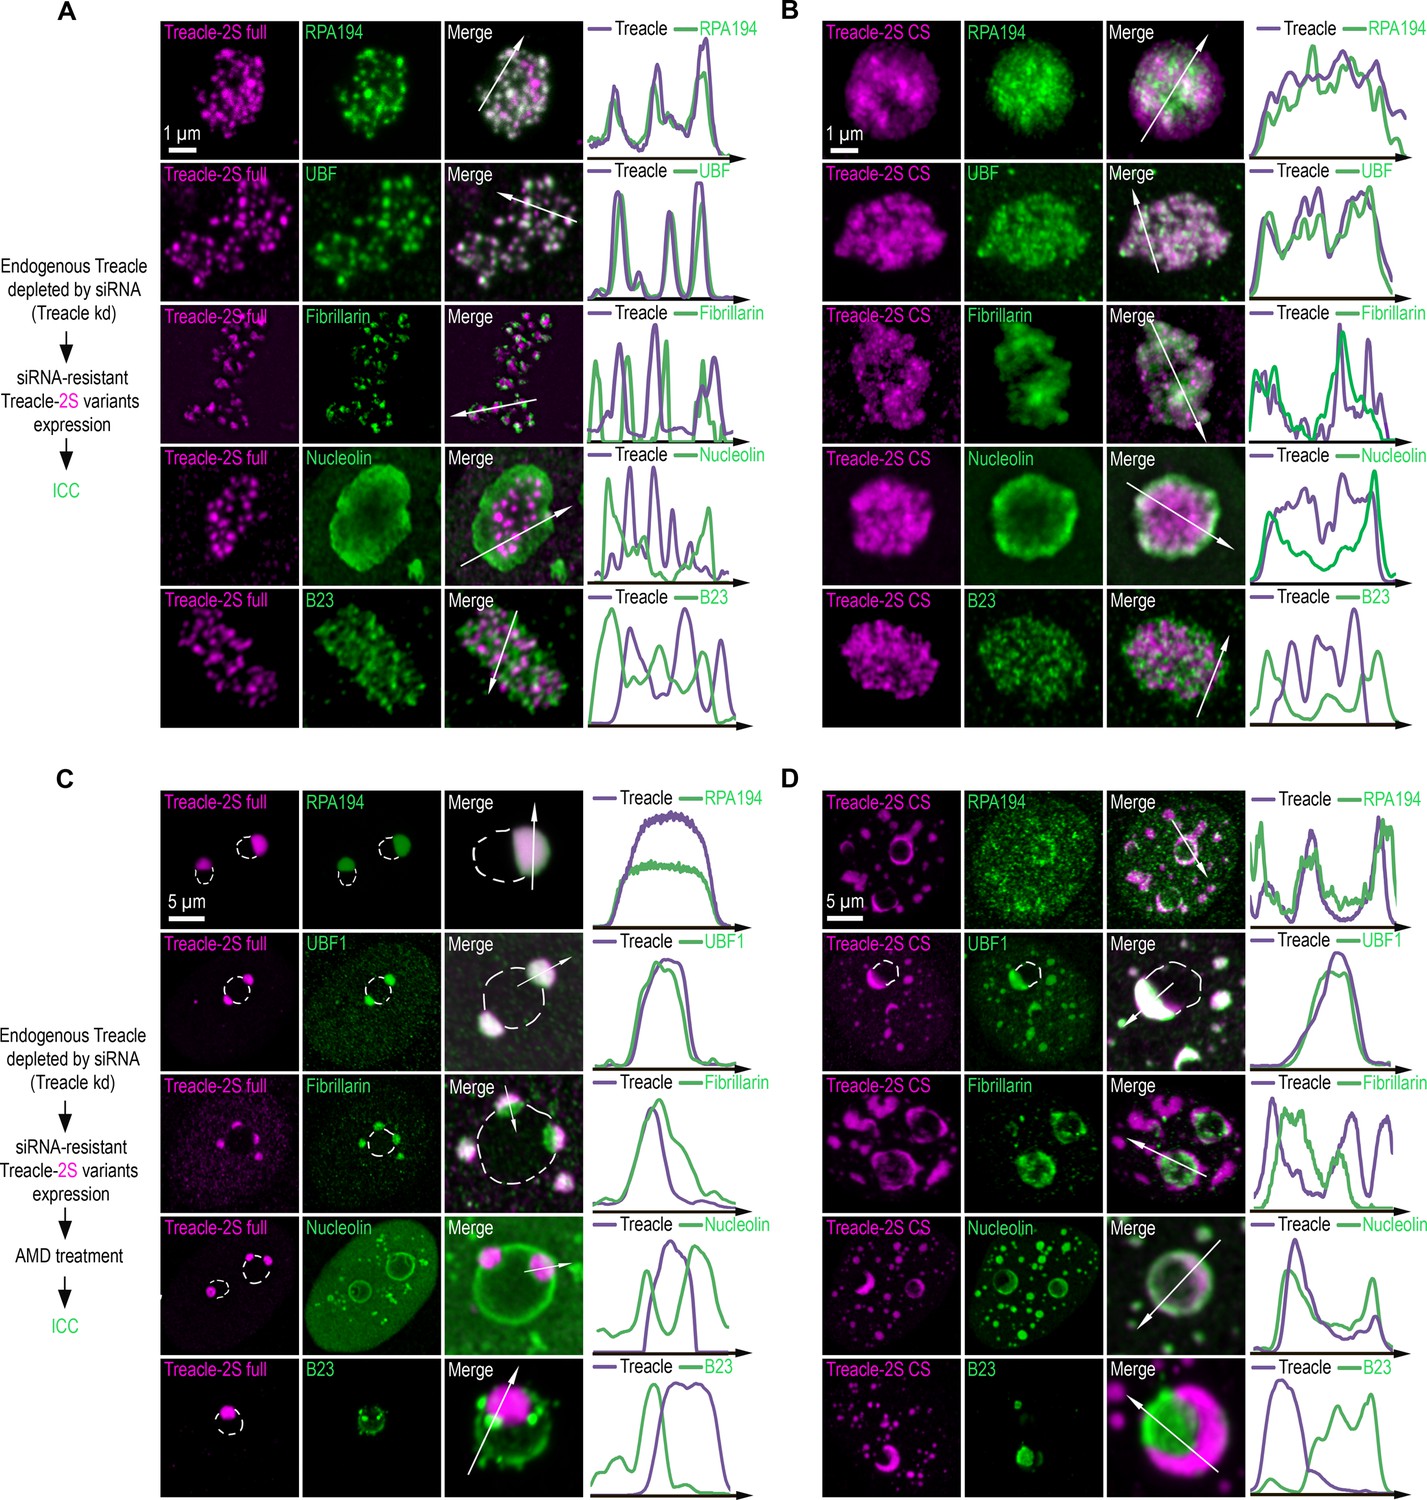
The condensation of Treacle facilitates its functional interactions with partner proteins.
(A) Endogenous Treacle was depleted by small interfering RNA (siRNA)-mediated knockdown (Treacle kd). Next, Treacle-depleted cells were transfected with siRNA-resistant full-length Treacle-2S (Treacle-2S full). Cells were fixed 16–24 after transfection and immunostained with either RPA194, UBF, fibrillarin, B23, or nucleolin antibodies. Cells were analyzed by laser scanning confocal microscopy. Representative images of magnified nucleoli are shown. Co-localization analysis was performed on the merged images. Graphs illustrate quantification in arbitrary units of Treacle-2S variants and RPA194, UBF, fibrillarin, B23, or nucleolin fluorescence distribution along the lines shown in the figures. (B) Endogenous Treacle was depleted by siRNA-mediated knockdown (Treacle kd). Next, Treacle-depleted cells were transfected with siRNA-resistant charge-scrambled Treacle-2S (Treacle-2S CS) and processed as described in (A). (C) Endogenous Treacle was depleted by siRNA-mediated knockdown (Treacle kd). Next, Treacle-depleted cells were transfected with siRNA-resistant full-length Treacle-2S (Treacle-2S full). 16–24 hr after transfection cells were treated with 0.05 µg/ml actinomycin D (AMD) to induce rDNA transcriptional repression, fixed and processed as described in (A). (D) Endogenous Treacle was depleted by siRNA-mediated knockdown (Treacle kd). Next, Treacle-depleted cells were transfected with siRNA-resistant charge-scrambled Treacle-2S (Treacle-2S CS). 16–24 hr after transfection cells were treated with 0.05 µg/ml AMD to induce rDNA transcriptional repression, fixed and processed as described in (A).
Figure 5—figure supplement 1
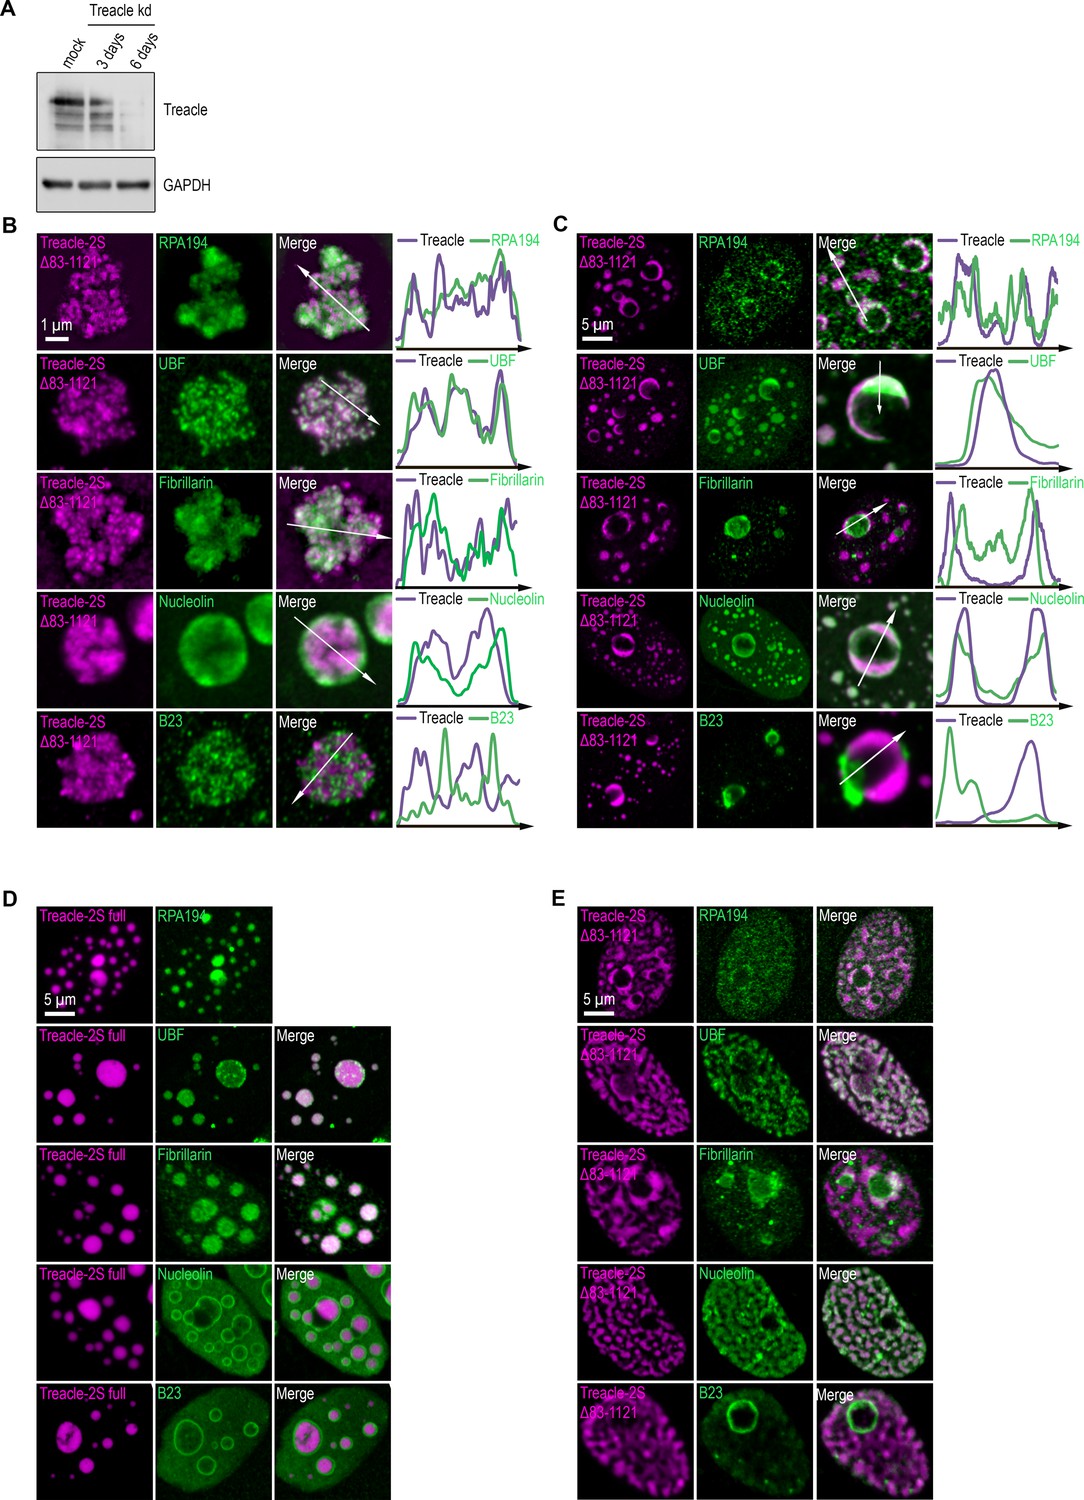
Disruption of Treacle’s condensation properties alters its interaction specificity with protein partners.
(A) Endogenous Treacle was depleted by small interfering RNA (siRNA)-mediated knockdown (Treacle kd). After 3–6 days, knockdown efficiencies were analyzed by western blotting. Mock, scrambled control siRNA. (B) Endogenous Treacle was depleted by siRNA-mediated knockdown (Treacle kd). Next, Treacle-depleted cells were transfected with siRNA-resistant Treacle-2S Δ83–1121 deletion mutant (Treacle-2S Δ83–1121). Cells were fixed 16–24 after transfection and immunostained with either RPA194, UBF, fibrillarin, B23, or nucleolin antibodies. Cells were analyzed by laser scanning confocal microscopy. Representative images of magnified nucleoli are shown. Co-localization analysis was performed on the merged images. Graphs illustrate quantification in arbitrary units of Treacle-2S variants and RPA194, UBF, fibrillarin, B23, or nucleolin fluorescence distribution along the lines shown in the figures. (C) Endogenous Treacle was depleted by siRNA-mediated knockdown (Treacle kd). Next, Treacle-depleted cells were transfected with siRNA-resistant Treacle-2S Δ83–1121 deletion mutant (Treacle-2S Δ83–1121). 16–24 hr after transfection cells were treated with 0.05 µg/ml actinomycin D (AMD) to induce rDNA transcriptional repression, fixed and processed as described in (B). (D) HeLa cells were transiently transfected with full-length Treacle-2S (Treacle-2S full). 48 hr after transfection cells were fixed and immunostained with either RPA194, UBF, fibrillarin, B23, or nucleolin antibodies. Cells were analyzed by laser scanning confocal microscopy. Representative images of cells are shown. (E) HeLa cells were transiently transfected with Treacle-2S Δ83–1121 deletion mutant (Treacle-2S Δ83–1121) and processed as described in (D).
-
Figure 5—figure supplement 1—source data 1
TIFF file containing original western blots for panel A, indicating the relevant bands.
- https://cdn.elifesciences.org/articles/96722/elife-96722-fig5-figsupp1-data1-v1.zip
-
Figure 5—figure supplement 1—source data 2
Original files for western blot analysis displayed in panel A.
- https://cdn.elifesciences.org/articles/96722/elife-96722-fig5-figsupp1-data2-v1.zip
Figure 6
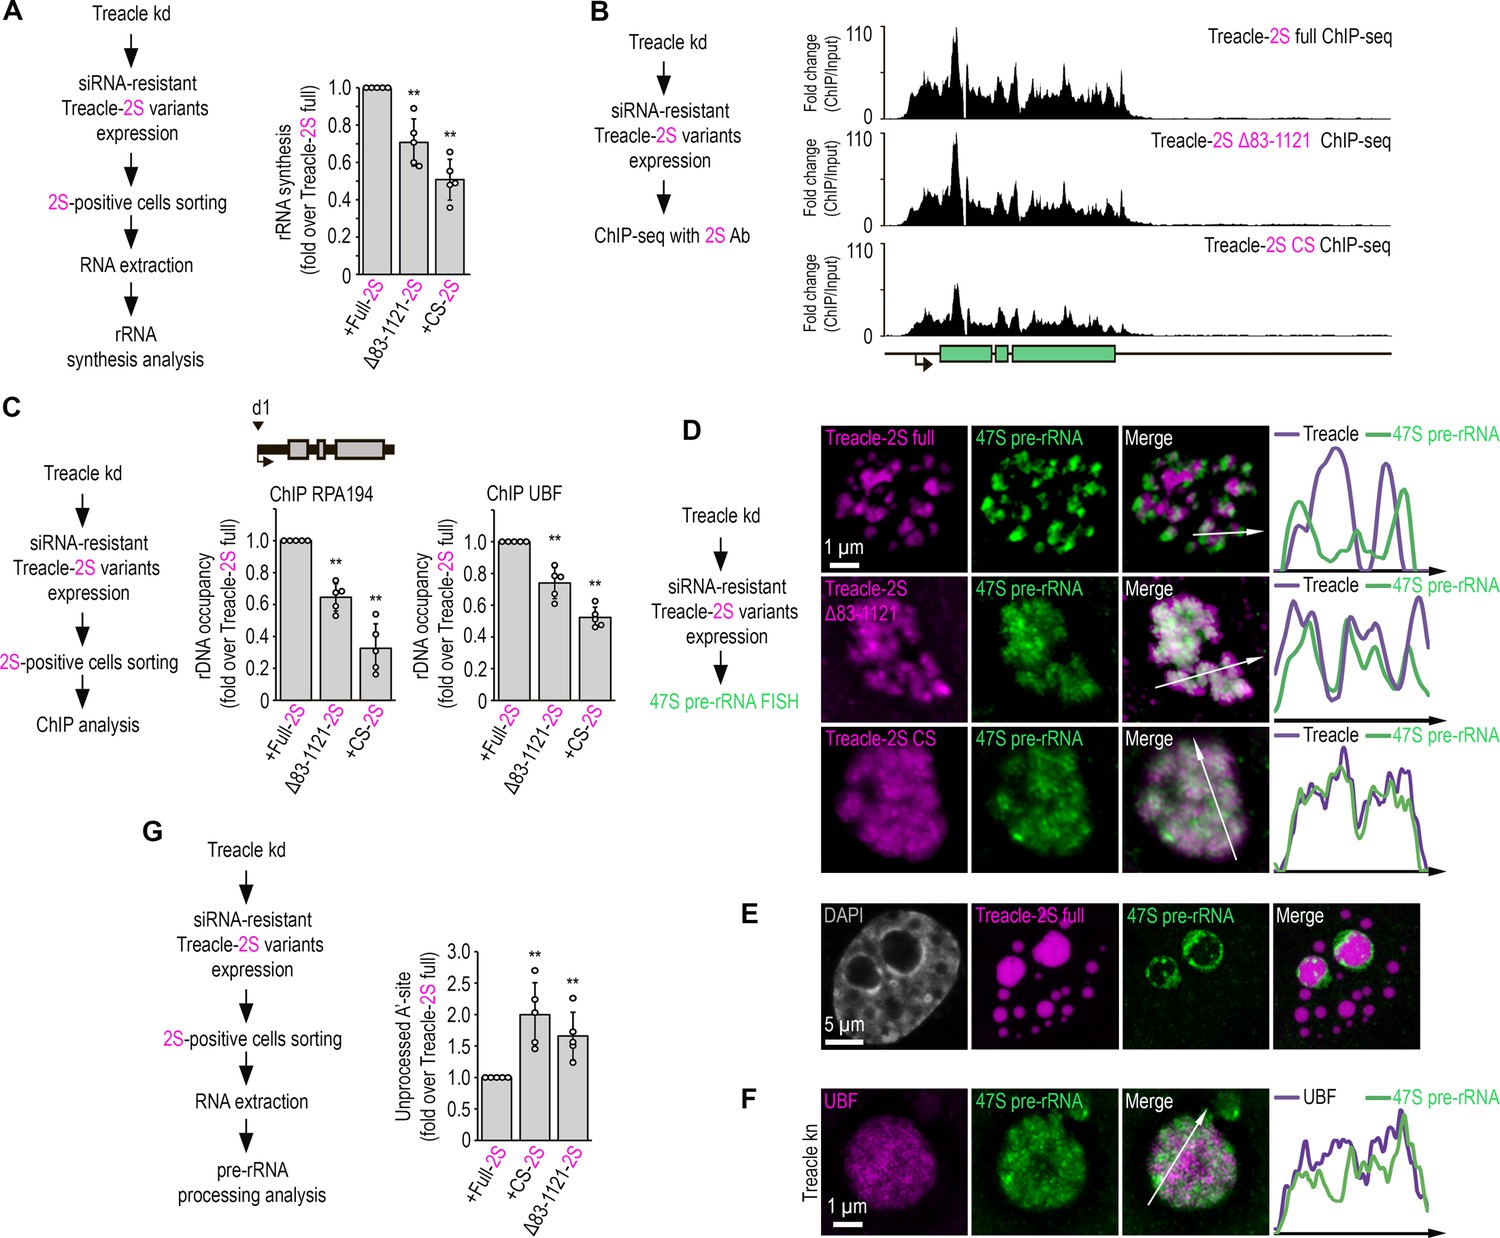
The condensation of Treacle is essential for the transcription and processing of ribosomal RNA (rRNA).
(A) Endogenous Treacle was depleted by small interfering RNA (siRNA)-mediated knockdown (Treacle kd). Next, Treacle-depleted cells were transfected with siRNA-resistant full-length Treacle-2S (Treacle-2S full), charge-scrambled Treacle-2S (Treacle-2S CS), or Treacle-2S Δ83–1121 deletion mutant (Treacle-2S Δ83–1121). Cells were fixed 16–24 after transfection and subjected to cell sorting in the fluorescent analysis mode to obtain 2S-positive populations. The sorted cell fractions were used for RNA extraction. Reverse transcription-quantitative polymerase chain reaction (RT-qPCR) was performed; it shows levels of 47S pre-rRNA normalized to GAPDH mRNA. Normalized pre-rRNA level in full-length Treacle-2S-positive cells is set to 1. Values are mean ± SD. The calculation is presented for five biological replicates. **, p<0.01 by unpaired t test. (B) HeLa cells were processed as described in (A). Cells were fixed 16–24 after transfection and subjected to chromatin immunoprecipitation sequencing (ChIP-seq) analysis with Katushka2S antibodies. ChIP-seq signal were normalized to the input. (C) HeLa cells were processed as described in (A). Cells were fixed 16–24 after transfection and subjected to cell sorting in the fluorescent analysis mode to obtain 2S-positive populations. The sorted cell fractions were used for used for ChIP with RPA194 or UBF antibodies. ChIP was followed by qPCR using the d1 primers to the promoter of the rRNA gene (positioned as indicated on the scheme). Percentage of enrichment relative to input in full-length Treacle-2S-positive cells is set to 1. Values are mean ± SD. The calculation is presented for five biological replicates. **, p<0.01 by unpaired t test. (D) HeLa cells were processed as described in (A). Cells were fixed 16–24 after transfection and stained for 47S pre-rRNA (revealed by single-molecule fluorescence in situ hybridization [smFISH]). Cells were analyzed by laser scanning confocal microscopy. Representative images of magnified nucleoli are shown. Co-localization analysis was performed on the merged images. Graphs illustrate quantification in arbitrary units of Treacle-2S variants and smFISH fluorescence distribution along the lines shown in the figures. (E) HeLa cells were transfected with full-length Treacle-2S. 48 hr after transfection cells were fixed and stained for 47S pre-rRNA (revealed by smFISH). Cells were analyzed by laser scanning confocal microscopy. Representative images of magnified nucleoli are shown. (F) HeLa cells were transfected with a construct coding CRISPR/Cas9 and single guide RNA (sgRNA) to the TCOF1 gene (Treacle kn). 7–10 days after transfection, the cells were fixed and stained with UBF antibodies and 47S pre-rRNA. Representative images of Treacle-negative nucleolus (magnified images) are shown. (G) HeLa cells were processed as described in (A). Cells were fixed 16–24 after transfection and subjected to cell sorting in the fluorescent analysis mode to obtain 2S-positive populations. The sorted cell fractions were used for RNA extraction. RT-qPCR was performed; it shows levels of A′ site contained unprocessed rRNA normalized to GAPDH mRNA. Normalized unprocessed rRNA level in full-length Treacle-2S-positive cells is set to 1. Values are mean ± SD. The calculation is presented for five biological replicates. **, p<0.01 by unpaired t test.
Figure 7 with 3 supplements
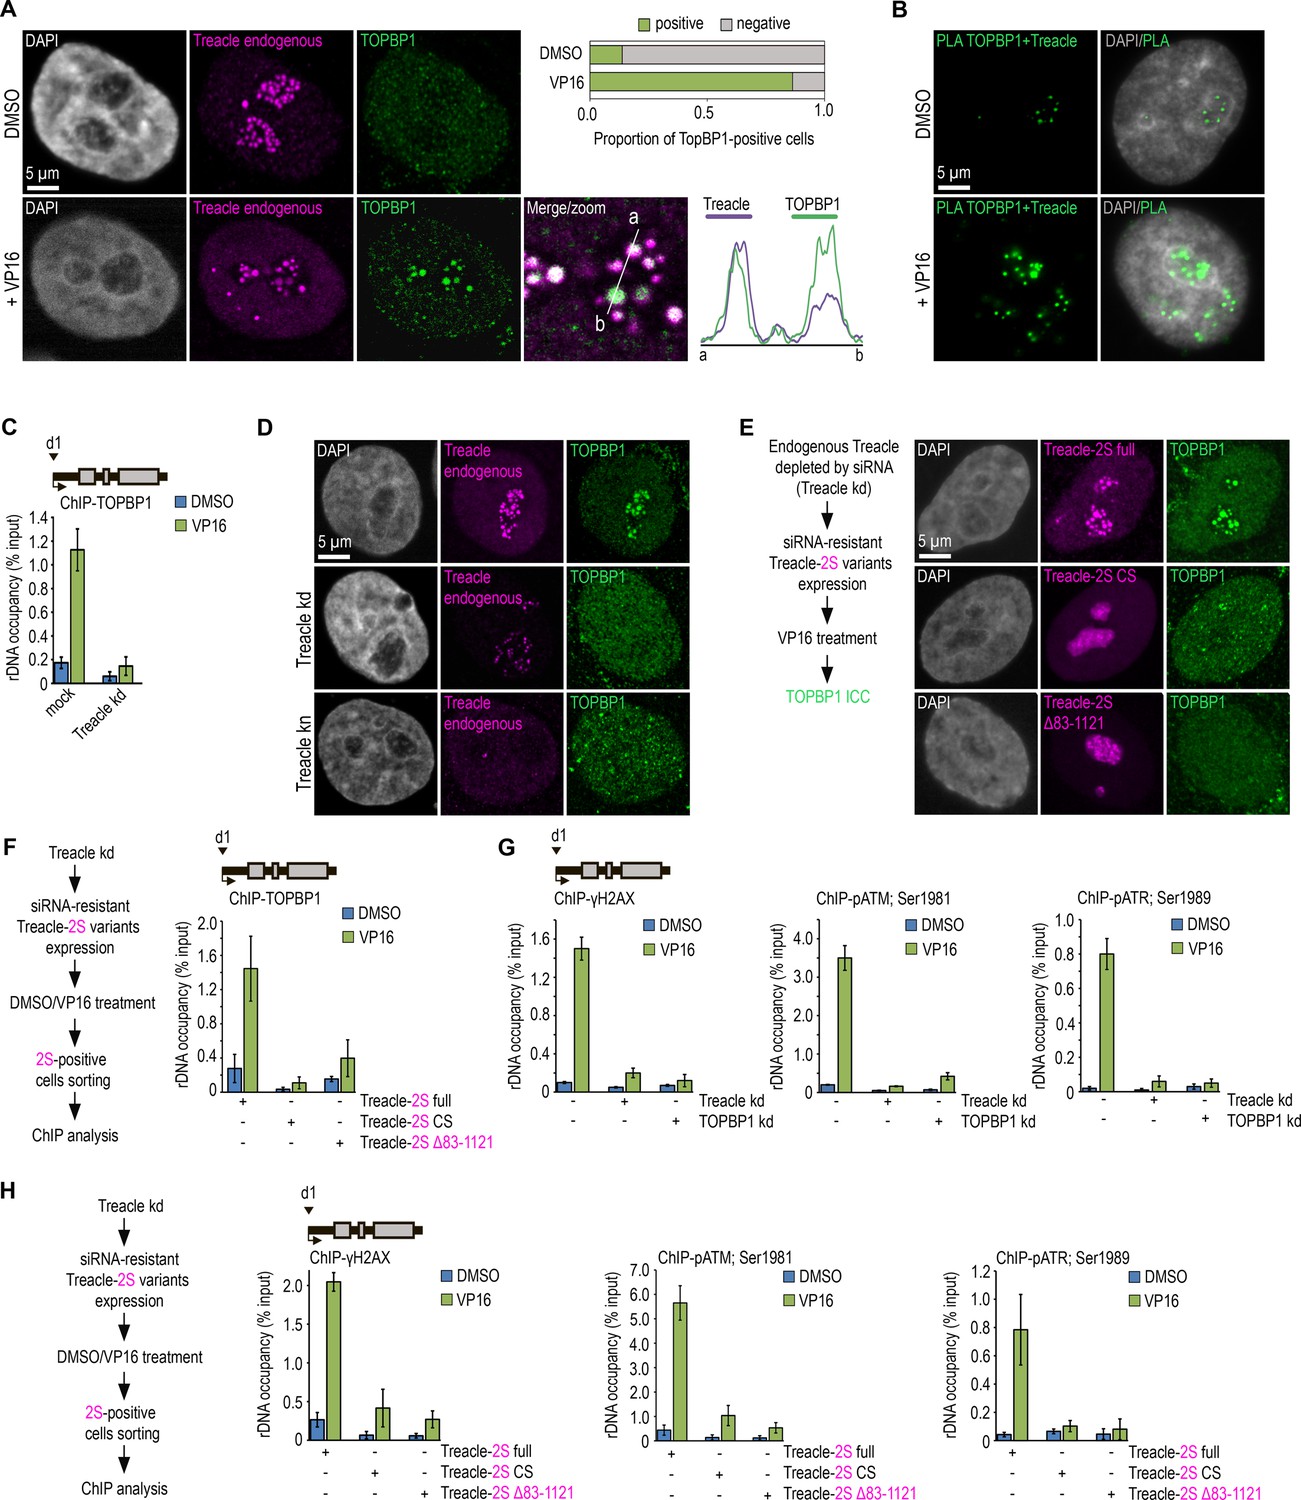
Treacle phase separation is essential for DNA damage response (DDR) activation in ribosomal genes under genotoxic stress conditions.
(A) DMSO-treated and VP16-treated (90 μM, 30 min) HeLa cells were co-immunostained for Treacle (Treacle endogenous; magenta) and TOPBP1 (green) and analyzed by laser scanning confocal microscopy. The DNA was stained with DAPI (gray). Co-localization analysis was performed on the merged images (magnified images). Graphs illustrate quantification in arbitrary units of Treacle and TOPBP1 fluorescence distribution along the lines shown in the figures. Percentage of cells containing TOPBP1 (TOPBP1-positive) foci within nucleoli is shown. (B) DMSO-treated and VP16-treated (90 μM, 30 min) HeLa cells were subjected to proximity ligation assay (PLA) with antibodies against TOPBP1 and Treacle. DNA was stained with DAPI (gray). PLA detection of Treacle-TOPBP1 interactions is visible as distinct green fluorescent dots. (C) Mock-treated HeLa cells or cells with small interfering RNA (siRNA)-mediated Treacle knockdown (Treacle kd) were treated with DMSO or VP16 (90 μM, 30 min). Chromatin immunoprecipitation (ChIP) experiments were performed with antibodies against TOPBP1. ChIP was followed by quantitative polymerase chain reaction (qPCR) using the d1 primers to the promoter of the ribosomal RNA (rRNA) gene (positioned as indicated on the scheme). Data are represented relative to the input. Values are means ± SD from at least three independent replicates. (D) Intact HeLa cells, siRNA-depleted for Treacle (Treacle kd) cells, or CRISPR/Cas9-depleted for Treacle (Treacle kn) cells were treated with 90 μM VP16 for 30 min. Cells were co-immunostained for TOPBP1 (green) and Treacle (magenta) antibodies and analyzed by laser scanning confocal microscopy. The DNA was stained with DAPI (gray). (E) Endogenous Treacle was depleted by siRNA-mediated knockdown (Treacle kd). Next, Treacle-depleted cells were transfected with plasmid constructs encoding either siRNA-resistant full-length Treacle-2S (Treacle-2S full), Treacle-2S Δ83–1121 deletion mutant, or charge-scrambled mutant Treacle-2S (Treacle-2S CS). 24 hr after transfection, cells were treated with VP16 (90 μM for 30 min), fixed and stained for TOPBP1 (green), and analyzed by laser scanning confocal microscopy. The DNA was stained with DAPI (gray). (F) Endogenous Treacle was depleted by siRNA-mediated knockdown (Treacle kd). Treacle-depleted cells were transfected with plasmid constructs encoding either siRNA-resistant Treacle-2S full, Treacle-2S Δ83–1121, or Treacle-2S CS. 24 hr after transfection, cells were treated with DMSO or VP16 (90 μM for 30 min) and fixed. Cells were subjected to cell sorting in the fluorescent analysis mode to obtain 2S-positive populations. At least 2×10⁶ sorted cells were used for ChIP with TOPBP1 antibodies. ChIP was followed by qPCR using the d1 primers to the promoter of the rRNA gene (positioned as indicated on the scheme). Data are represented relative to the input. Values are means ± SD from at least three independent replicates. (G) Intact HeLa cells and cells siRNA-depleted for either Treacle (Treacle kd) or TOPBP1 (TOPBP1 kd) were treated with DMSO or 90 μM VP16 for 30 min. ChIP experiments were performed with antibodies against phospho-ATR (pATR; Ser1989), phospho-ATM (pATM; Ser1981), or γH2AX antibodies. ChIP was followed as described in (F). (H) HeLa cells were processed as described in (F). At least 2×10⁶ sorted cells were used for ChIP with phospho-ATR (pATR; Ser1989), phospho-ATM (pATM; Ser1981), or γH2AX antibodies. ChIP was followed by qPCR using the d1 primers to the promoter of the rRNA gene (positioned as indicated on the scheme). Data are represented relative to the input. Values are means ± SD from at least three independent replicates.
Figure 7—figure supplement 1
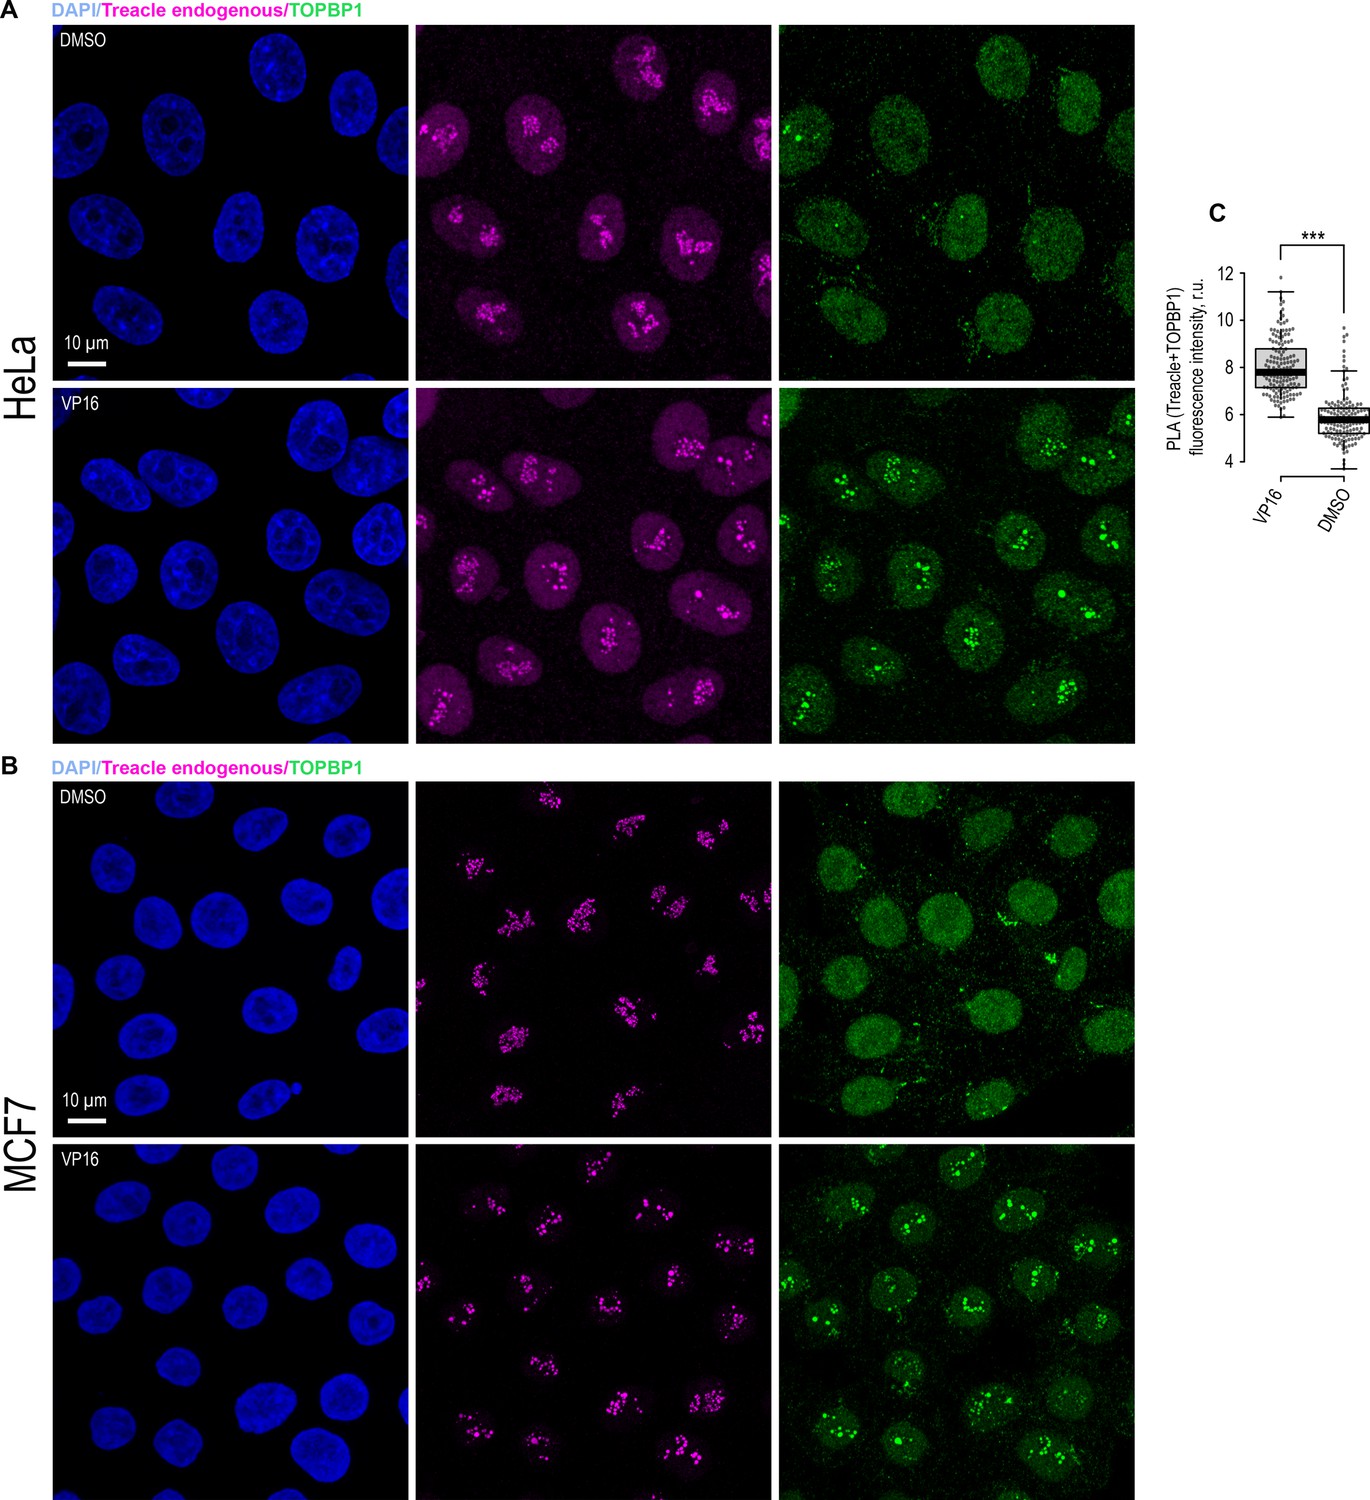
Etoposide (VP16) induces the association of TOPBP1 with Treacle in HeLa and MCF7 cells.
(A) DMSO-treated and VP16-treated (90 μM, 30 min) HeLa cells were co-immunostained for Treacle (Treacle endogenous; magenta) and TOPBP1 (green) and analyzed by laser scanning confocal microscopy. The DNA was stained with DAPI (blue). Micrographs depicting representative cell fields are presented. (B) DMSO-treated and VP16-treated (90 μM, 30 min) MCF7 cells were co-immunostained for Treacle (magenta) and TOPBP1 (green) and analyzed by laser scanning confocal microscopy. The DNA was stained with DAPI (blue). Micrographs depicting representative cell fields are presented. (C) DMSO-treated and VP16-treated (90 μM, 30 min) HeLa cells were subjected to proximity ligation assay (PLA) with antibodies against TOPBP1 and Treacle. Graphs illustrate quantification of the intensity of the PLA fluorescent signal per nucleolus (n>100).
Figure 7—figure supplement 2

Etoposide (VP16) promotes TOPBP1 translocation to the nucleolus in a Treacle-dependent manner.
(A) Intact HeLa cells, small interfering RNA (siRNA)-depleted for Treacle (Treacle kd) cells or CRISPR/Cas9-depleted for Treacle (Treacle kn) cells were treated with 90 μM VP16 for 30 min. Cells were co-immunostained for TOPBP1 (green) and Treacle (magenta) antibodies and analyzed by laser scanning confocal microscopy. The DNA was stained with DAPI (blue). Micrographs depicting representative cell fields are presented. (B) Intact HeLa cells and Treacle kd cells were treated with 90 μM VP16 for 30 min. Cells were immunostained for TOPBP1. Percentage of cells containing TOPBP1 (TOPBP1-positive) foci within nucleoli is shown.
Figure 7—figure supplement 3
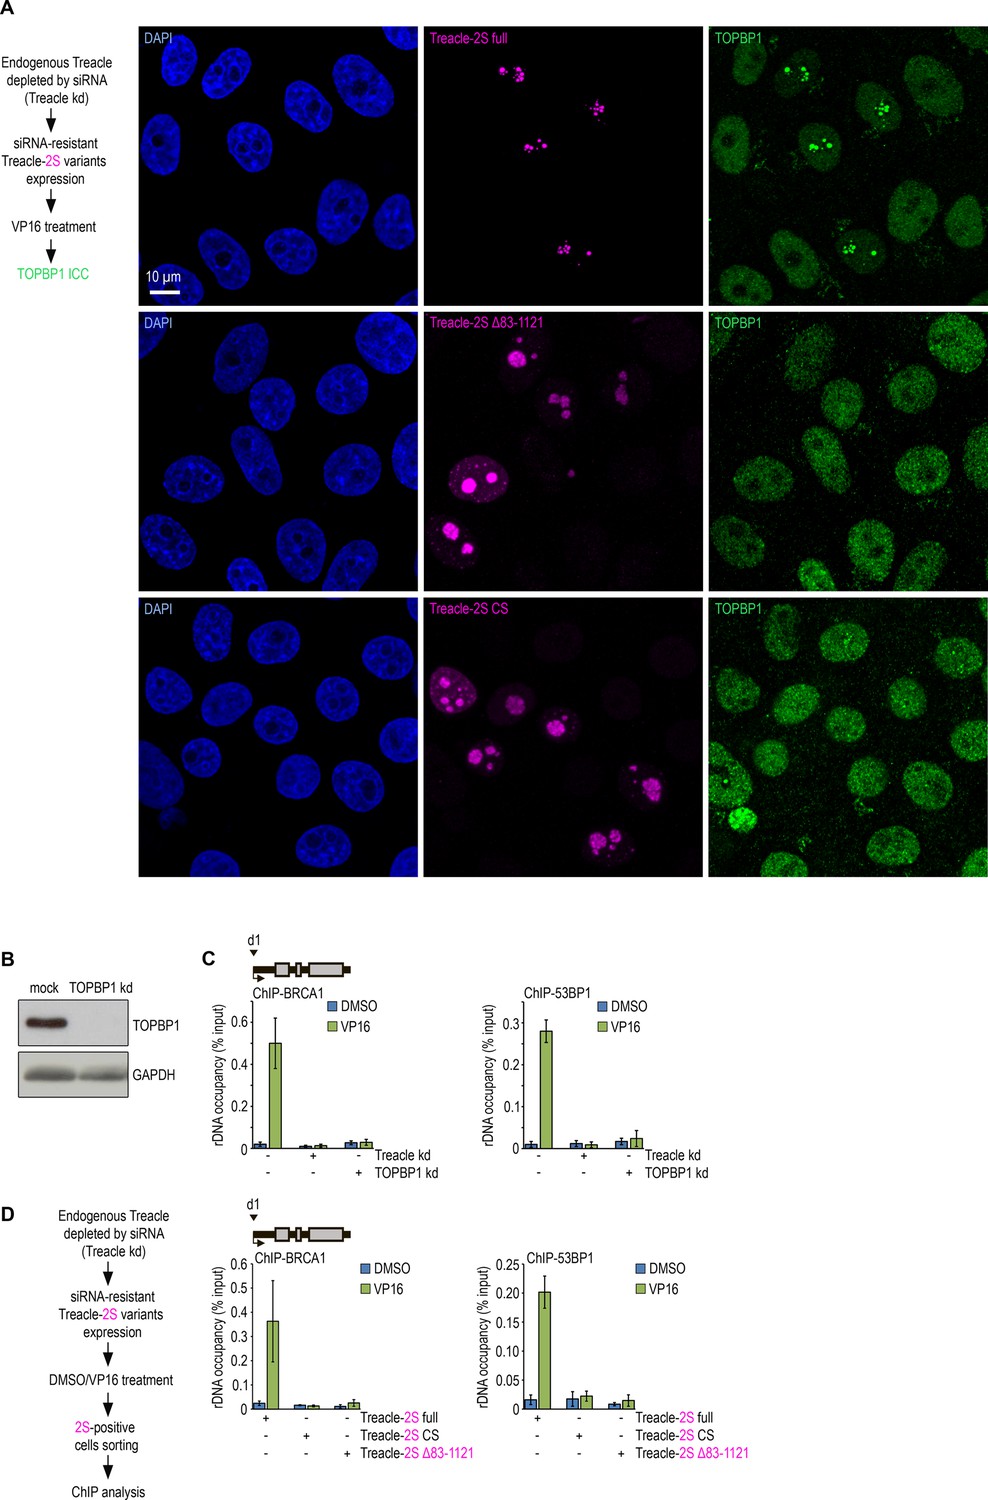
Disruption of Treacle’s condensation properties abrogates its interaction with TOPBP1 and impairs activation of the rDNA damage response under genotoxic stress.
(A) Endogenous Treacle was depleted by small interfering RNA (siRNA)-mediated knockdown (Treacle kd). Next, Treacle-depleted cells were transfected with plasmid constructs encoding either siRNA-resistant full-length Treacle-2S (Treacle-2S full), Treacle-2S Δ83–1121 deletion mutant, or charge-scrambled mutant Treacle-2S (Treacle-2S CS). 24 hr after transfection, cells were treated with VP16 (90 μM for 30 min), fixed and immunostained for TOPBP1 (green), and analyzed by laser scanning confocal microscopy. The DNA was stained with DAPI (blue). Micrographs depicting representative cell fields are presented. (B) HeLa cells were depleted for TOPBP1 using siRNA-mediated knockdown (TOPBP1 kd). (C) Intact HeLa cells and cells siRNA-depleted for either Treacle (Treacle kd) or TOPBP1 (TOPBP1 kd) were treated with DMSO or 90 μM VP16 for 30 min. Chromatin immunoprecipitation (ChIP) experiments were performed with antibodies against BRCA1 or 53BP1 antibodies. ChIP was followed by quantitative polymerase chain reaction (qPCR) using the d1 primers to the promoter of the ribosomal RNA (rRNA) gene (positioned as indicated on the scheme). Data are represented relative to the input. Values are means ± SD from at least three independent replicates. (D) Endogenous Treacle was depleted by siRNA-mediated knockdown (Treacle kd). Treacle-depleted cells were transfected with plasmid constructs encoding siRNA-resistant either Treacle-2S full, Treacle-2S Δ83–1121, or Treacle-2S CS. 24 hr after transfection, cells were treated with DMSO or VP16 (90 μM for 30 min) and fixed. Cells were subjected to cell sorting in the fluorescent analysis mode to obtain 2S-positive populations. At least 2×10⁶ sorted cells were used for ChIP with BRCA1 or 53BP1 antibodies. ChIP was followed by qPCR using the d1 primers to the promoter of the rRNA gene (positioned as indicated on the scheme). Data are represented relative to the input. Values are means ± SD from at least three independent replicates.
-
Figure 7—figure supplement 3—source data 1
TIFF file containing original western blots for panel B, indicating the relevant bands.
- https://cdn.elifesciences.org/articles/96722/elife-96722-fig7-figsupp3-data1-v1.zip
-
Figure 7—figure supplement 3—source data 2
Original files for western blot analysis displayed in panel B.
- https://cdn.elifesciences.org/articles/96722/elife-96722-fig7-figsupp3-data2-v1.zip
Tables
Key resources table
| Reagent type (species) or resource | Designation | Source or reference | Identifiers | Additional information |
|---|---|---|---|---|
| Cell line (Homo sapiens) | HeLa | ATCC | CCL-2, RRID:CVCL_0030 | Mycoplasma free |
| Cell line (Homo sapiens) | MCF7 | ATCC | HTB-22, RRID:CVCL_0031 | Mycoplasma free |
| Cell line (Homo sapiens) | Dermal fibroblast (normal, Adult) | Gift from Dr. M Lagarkova | Female 46XX, Mycoplasma free | |
| Chemical compound, drug | Etoposide (VP16) | Sigma-Aldrich | E1383 | |
| Chemical compound, drug | CX-5461 | Sigma-Aldrich | #5092650001 | |
| Chemical compound, drug | Actinomycin D (AMD) | Sigma-Aldrich | A1410 | |
| Chemical compound, drug | 1,6-Hexanediol (1,6-HD) | Sigma-Aldrich | #240117 | |
| Chemical compound, drug | Ammonium acetate | Serva | #39750.01 | |
| Chemical compound, drug | Hoechst 33342 | Sigma-Aldrich | #14533 | |
| Chemical compound, drug | DAPI | Sigma-Aldrich | D9542 | |
| Antibody | Anti-Treacle/TCOF1 (Mouse monoclonal) | Santa Cruz Biotechnology | sc-374536, RRID:AB_10987865 | ICC (1:500), WB (1: 5000), ChIP-qPCR |
| Antibody | Anti-Treacle/TCOF1 (Rabbit polyclonal) | Sigma-Aldrich | HPA038237 | ICC (1:500) |
| Antibody | Anti-RPA194 (Mouse monoclonal) | Santa Cruz Biotechnology | sc-48385, RRID:AB_675814 | ICC (1:50), ChIP-qPCR |
| Antibody | Anti-UBF1 (Rabbit polyclonal) | Thermo Fisher | PA5-82245, RRID:AB_2789405 | ICC (1:200), ChIP-qPCR |
| Antibody | Anti-Fibrillarin (Rabbit monoclonal) | Abcam | ab166630, RRID:AB_2928100 | ICC (1:500) |
| Antibody | Anti-Nucleolin (Rabbit monoclonal) | Cell Signaling | 14574, RRID:AB_2798519 | ICC (1:500) |
| Antibody | Anti-B23 (Mouse monoclonal) | Sigma-Aldrich | B0556, RRID:AB_2154872 | ICC (1:300) |
| Antibody | Anti-TOPBP1 (Mouse monoclonal) | Santa Cruz Biotechnology | sc-271043, RRID:AB_10610636 | ICC (1:200), ChIP-qPCR, WB (1:2500) |
| Antibody | Anti-BRCA1 (Mouse monoclonal) | Santa Cruz Biotechnology | sc-6954, RRID:AB_626761 | ChIP-qPCR |
| Antibody | Anti-pATM (Ser1981) (Mouse monoclonal) | Cell Signaling | 4526, RRID:AB_2062663 | ChIP-qPCR |
| Antibody | Anti-γH2AX (Ser139) (Mouse monoclonal) | Millipore | 05-636, RRID:AB_309864 | ChIP-qPCR |
| Antibody | Anti-pATR (Thr1989) (Rabbit polyclonal) | Cell Signaling | 58014, RRID:AB_2722679 | ChIP-qPCR |
| Antibody | Anti-53BP1 (Rabbit polyclonal) | Santa Cruz Biotechnology | sc-22760, RRID:AB_2256326 | ChIP-qPCR |
| Antibody | Anti-Katushka2S (Rabbit polyclonal) | Eurogene | AB233, RRID:AB_2571743 | ChIP-seq |
| Antibody | Anti-GAPDH, (Rabbit polyclonal) | Abcam | ab9485, RRID:AB_307275 | WB |
| Antibody | Polyclonal Goat anti-mouse Alexa Fluor Plus 488 | Invitrogen | A32723, RRID:AB_2633275 | ICC (1:200) |
| Antibody | Polyclonal Goat anti-mouse Alexa Fluor Plus 594 | Invitrogen | A32742, RRID:AB_2762825 | ICC (1:200) |
| Antibody | Polyclonal Goat anti-rabbit CF488A | Biotium | #20012, RRID:AB_10853801 | ICC (1:200) |
| Antibody | Polyclonal Goat anti-rabbit CF594 | Biotium | #20112, RRID:AB_10559190 | ICC (1:200) |
| Commercial assay or kit | Duolink In Situ Detection Reagents Green | Sigma-Aldrich | DUO92014 | |
| Commercial assay or kit | Click-i RNA Alexa Fluor 488 Imaging Kit | Thermo Fisher | C10329 | |
| Software, algorithm | ImageJ (version 1.44) | https://imagej.net/ij/download.html | RRID:SCR_003070 | |
| Software, algorithm | CellProfiler (version 4.2.8) | https://cellprofiler.org/releases | RRID:SCR_007358 | |
| Software, algorithm | Bowtie (version 2.2.3) | https://bowtie-bio.sourceforge.net/bowtie2/index.shtml | RRID:SCR_016368 | |
| Software, algorithm | SAMtools (version 1.5) | https://github.com/samtools/samtools | RRID:SCR_002105 | |
| Software, algorithm | deepTools (version 3.4.2) | https://github.com/deeptools/deepTools | RRID:SCR_016366 | |
| Other | Lipofectamine LTX and Plus Reagent | Invitrogen | #15338-100 | |
| Other | Lipofectamine 3000 | Invitrogen | L3000-015 |
-
Abbreviations: ICC, immunocytochemistry; ChIP, chromatin immunoprecipitation; WB: western blotting.
Additional files
-
Supplementary file 1
List of primers used for cloning.
- https://cdn.elifesciences.org/articles/96722/elife-96722-supp1-v1.docx
-
Supplementary file 2
The amino acid substitutions and deletions engineered to generate the Treacle ΔSE and Treacle CS mutant variants.
- https://cdn.elifesciences.org/articles/96722/elife-96722-supp2-v1.docx
-
Supplementary file 3
List of primers used for knockdown and knockout.
- https://cdn.elifesciences.org/articles/96722/elife-96722-supp3-v1.docx
-
Supplementary file 4
List of primers used for quantitative polymerase chain reaction (qPCR).
- https://cdn.elifesciences.org/articles/96722/elife-96722-supp4-v1.docx
-
Supplementary file 5
List of primers used for chromatin immunoprecipitation (ChIP)-quantitative polymerase chain reaction (qPCR).
- https://cdn.elifesciences.org/articles/96722/elife-96722-supp5-v1.docx
-
Supplementary file 6
List FITS-labeled oligonucleotides used for single-molecule fluorescence in situ hybridization (smFISH).
- https://cdn.elifesciences.org/articles/96722/elife-96722-supp6-v1.docx
-
MDAR checklist
- https://cdn.elifesciences.org/articles/96722/elife-96722-mdarchecklist1-v1.docx
Download links
A two-part list of links to download the article, or parts of the article, in various formats.
Downloads (link to download the article as PDF)
Open citations (links to open the citations from this article in various online reference manager services)
Cite this article (links to download the citations from this article in formats compatible with various reference manager tools)
Treacle’s ability to form liquid-like phase condensates is essential for nucleolar fibrillar center assembly, efficient rRNA transcription and processing, and rRNA gene repair
eLife 13:RP96722.
https://doi.org/10.7554/eLife.96722.3


