The domesticated transposon protein L1TD1 associates with its ancestor L1 ORF1p to promote LINE-1 retrotransposition
- Division of Cell and Developmental Biology, Center for Anatomy and Cell Biology, Medical University of Vienna, Austria
- Medical University of Vienna, Max Perutz Labs Vienna, Campus Vienna Biocenter, Austria
- Department of Pathology, Medical University of Vienna, Austria
- Department of Experimental Oncology, IEO, European Institute of Oncology IRCCS, Italy
- National Institute of Chemistry, Slovenia
- Dementia Research Institute at King’s College London and The Francis Crick institute, United Kingdom
Figures
Figure 1 with 2 supplements
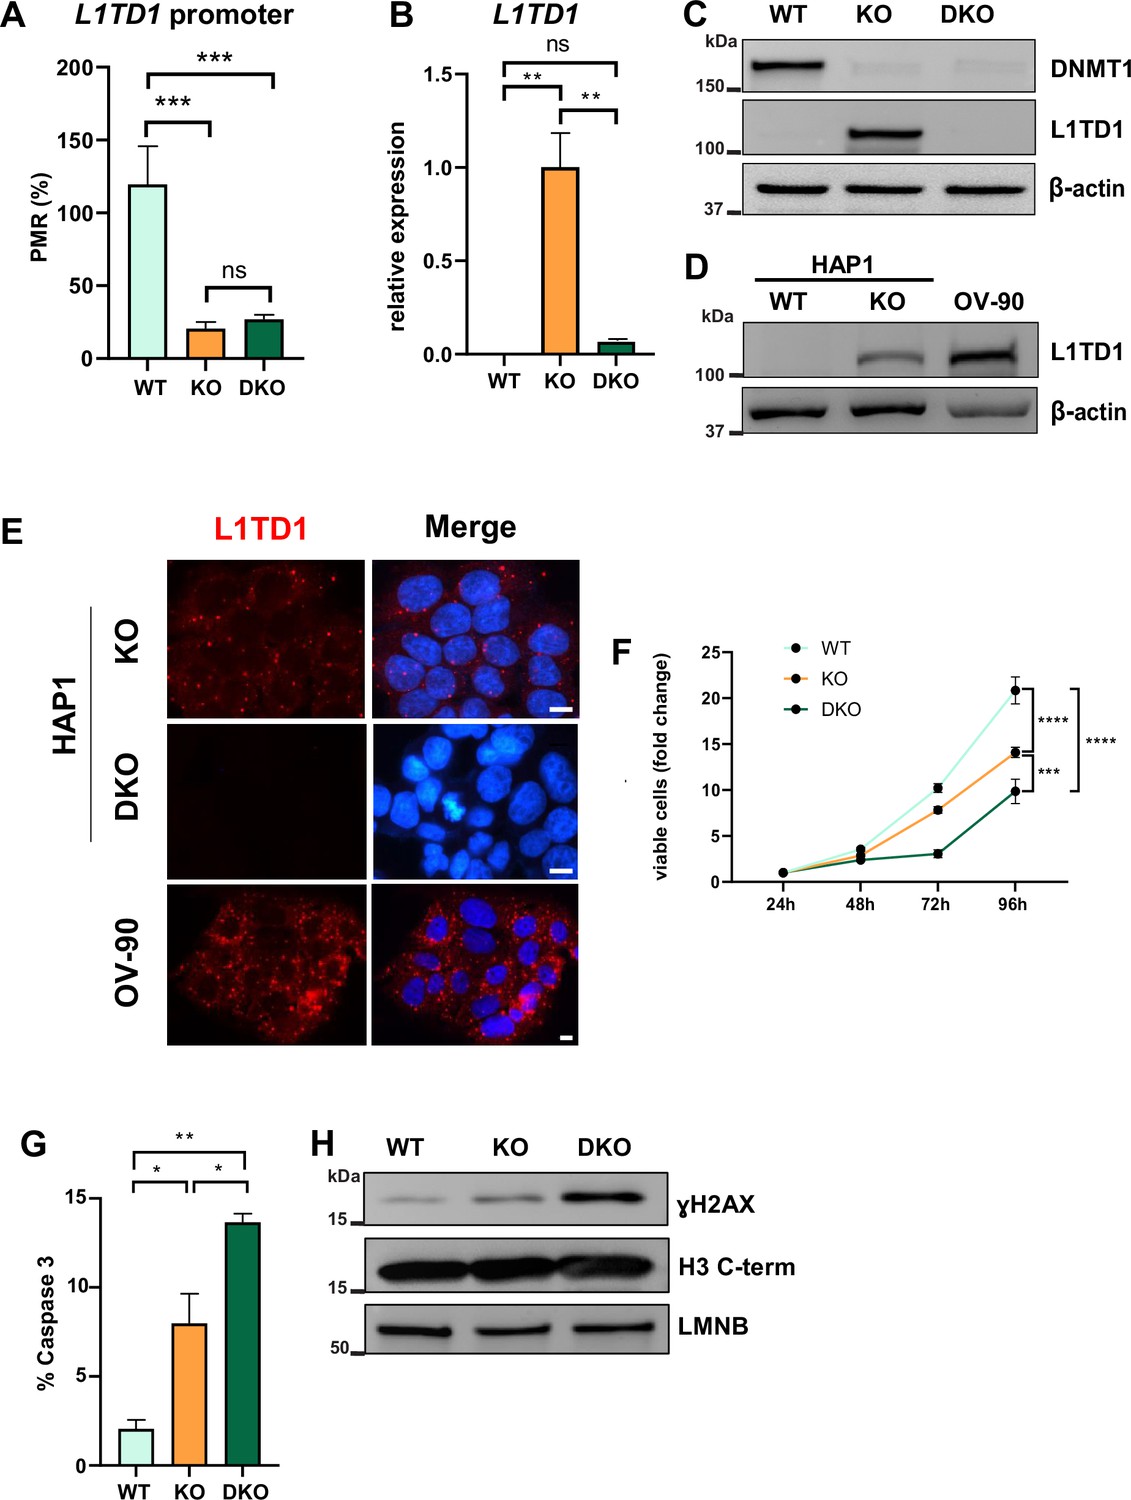
DNA hypomethylation results in the activation of L1TD1 expression and loss of L1TD1 affects cell viability in HAP1 cells.
(A) Quantification of DNA methylation levels at the L1TD1 promoter in HAP1 wildtype (WT), DNMT1 KO, and DNMT1/L1TD1 DKO cells using the MethyLight assay. DNA methylation is shown as percentage of methylation ratio (PMR). (B) qRT-PCR analysis of L1TD1 mRNA expression in HAP1 WT, DNMT1 KO, and DNMT1/L1TD1 DKO cells. GAPDH was used as a normalization control and relative L1TD1 mRNA levels in DNMT1 KO cells were set to 1. Data are shown as a mean of ± SD of three biological replicates. (C) Western blot analysis of L1TD1 levels in HAP1 WT, DNMT1 KO, and DNMT1/L1TD1 DKO cells. β-Actin was used as loading control. (D) Western blot analysis of L1TD1 protein expression in HAP1 WT and DNMT1 KO cells and OV-90 cells; β-actin was used as loading control. (E) Indirect immunofluorescence staining of L1TD1 (red) in HAP1 DNMT1 KO and DNMT1/L1TD1 DKO cells and OV-90 cells. In merged images, nuclear DNA was stained with DAPI (blue). Scale bars, 5 µm. (F) Cell viability analysis of HAP1 WT, DNMT1 KO, and DNMT1/L1TD1 DKO cells using the CellTiter-Glo assay measured over 96 hours (n = 6). (G) Bar graph representing the percentage of apoptotic cells of cultured cell lines quantified by flow cytometry analysis of cleaved caspase 3. (H) Western blot analysis of ɣH2AX levels in HAP1 WT, DNMT1 KO, and DNMT1/L1TD1 DKO cells in nuclear extracts. Antibodies specific for histone H3 C-terminus and LAMIN B (LMNB) were used as loading controls. (A–B, F–G) Statistical significance was determined using one-way ANOVA with Tukey’s multiple comparison correction. *p≤0.05, **p≤0.01, ***p≤0.001, ****p≤0.0001, ns = not significant.
-
Figure 1—source data 1
Source data for all plots in Figure 1 and corresponding details of statistical tests and p-values.
- https://cdn.elifesciences.org/articles/96850/elife-96850-fig1-data1-v1.xlsx
-
Figure 1—source data 2
Original western blots of Figure 1D and H indicating the relevant bands.
- https://cdn.elifesciences.org/articles/96850/elife-96850-fig1-data2-v1.pdf
-
Figure 1—source data 3
Original image files for western blots of Figure 1D and H.
- https://cdn.elifesciences.org/articles/96850/elife-96850-fig1-data3-v1.zip
Figure 1—figure supplement 1
Deregulation of the HAP1 transcriptome upon loss of DNMT1.
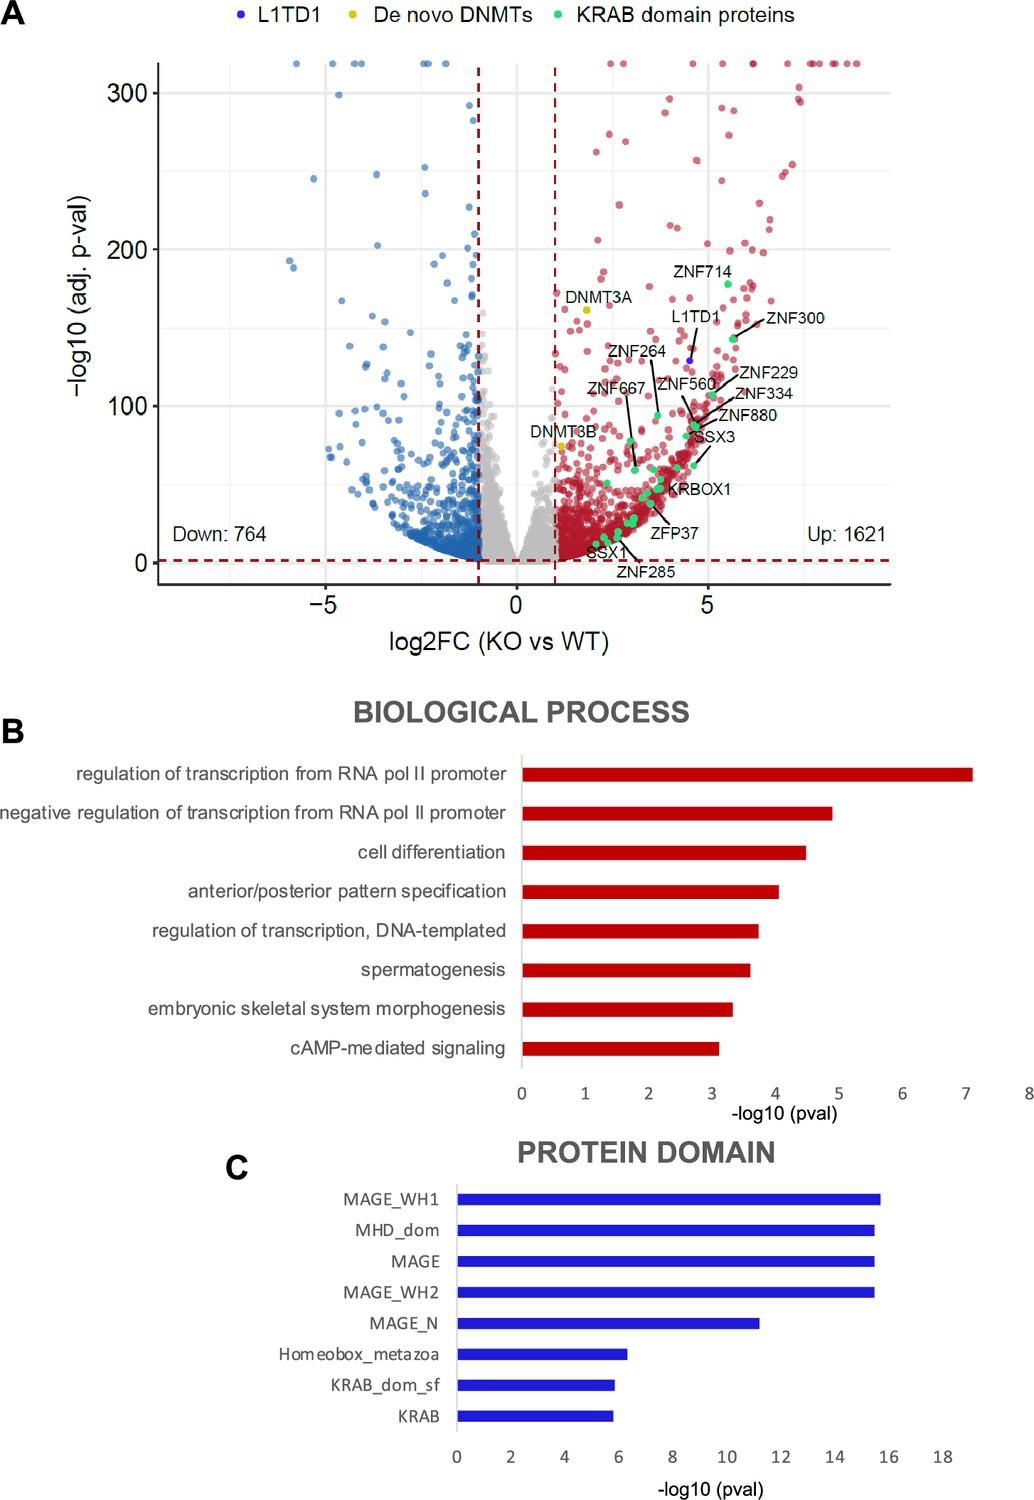
(A) Volcano plot illustrating the DESeq2 analysis of RNA-seq of HAP1 DNMT1 KO and wildtype (WT) cells. Differentially expressed genes are plotted as DNMT1 KO over WT (log2FC ≥1, adj. p-value<0.05 [red] and log2FC ≤ –1, adj. p-value<0.05 [blue]). L1TD1 is highlighted in blue, KRAB-containing zinc finger proteins in green and de novo DNMTs in yellow. (B, C) DAVID Gene Ontology enrichment analysis of top upregulated transcripts DESeq2 comparisons (DNMT1 KO versus input and DNMT1 KO versus WT HAP1, log2FC ≥2, adj. p-value<0.05) in terms of biological processes (B) and protein domains (C).
-
Figure 1—figure supplement 1—source data 1
Plots and statistics source data for all plots in Figure 1—figure supplement 1 and corresponding details of statistical tests and p-values.
- https://cdn.elifesciences.org/articles/96850/elife-96850-fig1-figsupp1-data1-v1.xlsx
Figure 1—figure supplement 2

DNMT1 ablation results both in DNA hypomethylation at L1 elements and expression of L1 ORF1p transcripts.
(A) Quantification of DNA methylation levels at the L1TD1 promoter in HAP1 wildtype (WT) and DNMT1 KO cells using the MethyLight assay. DNA methylation is shown as percentage of methylation ratio (PMR). (B) qRT-PCR analysis of L1 mRNA expression in HAP1 WT and DNMT1 KO cells. GAPDH was used as a normalization control. All data in the figure are shown as a mean of ± SD of three biological replicates. *p≤0.05, ***p≤0.001.
-
Figure 1—figure supplement 2—source data 1
Plots and statistics source data for all plots in Figure 1—figure supplement 2 and corresponding details of statistical tests and p-values.
- https://cdn.elifesciences.org/articles/96850/elife-96850-fig1-figsupp2-data1-v1.xlsx
Figure 2 with 1 supplement
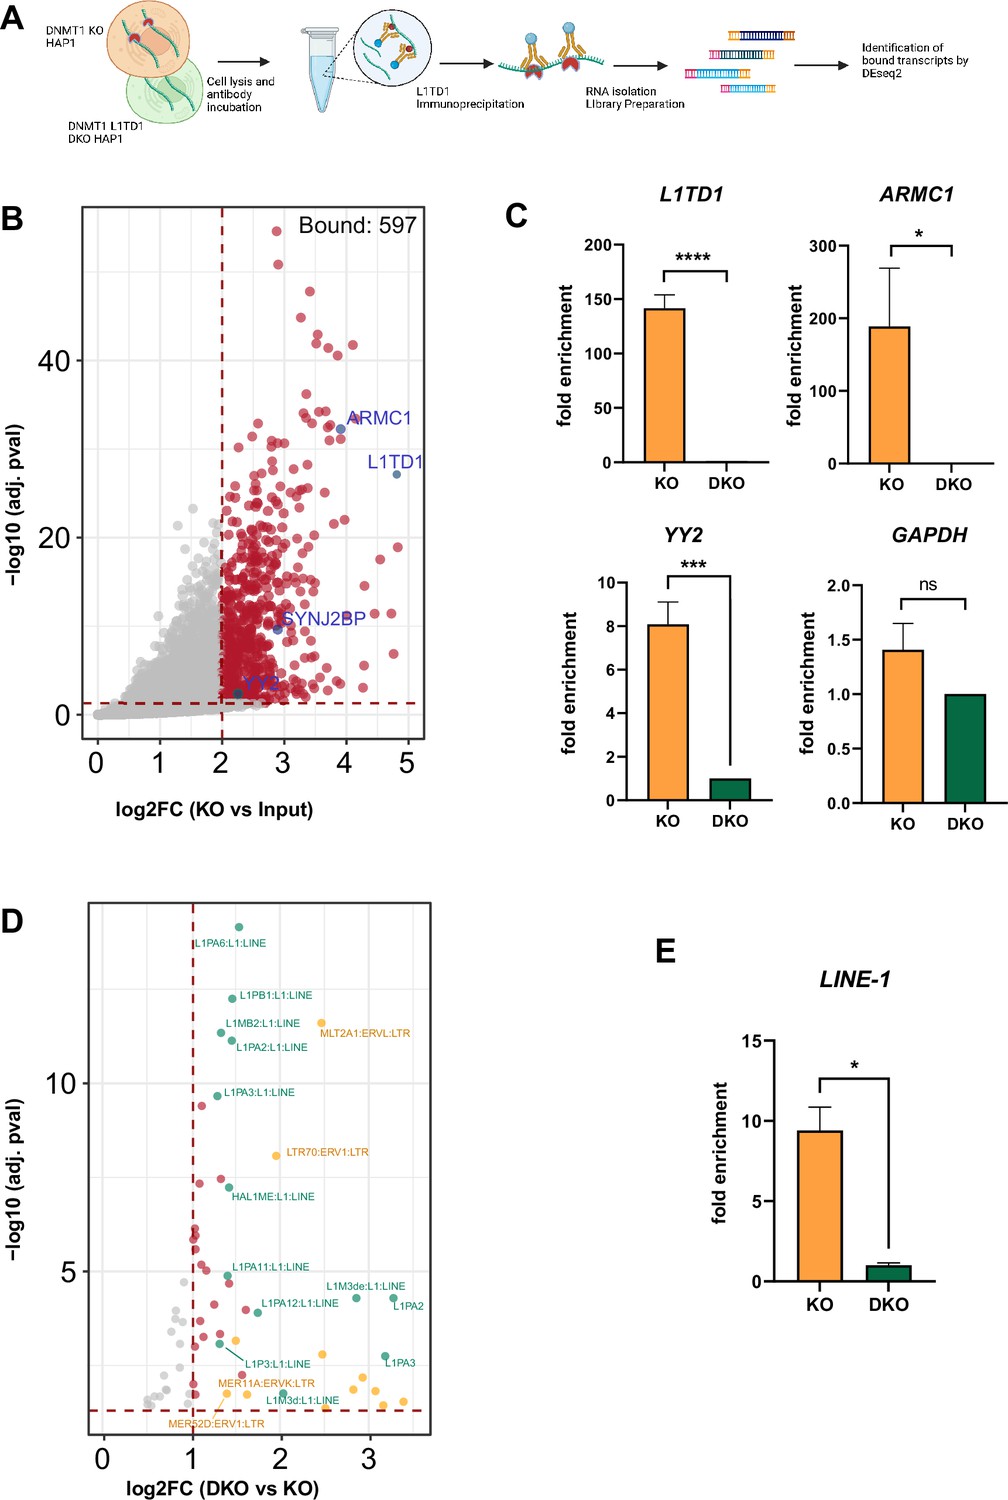
RIP-seq identifies a set of RNAs and transposon transcripts associated with L1TD1.
(A) Schematic representation of the RNA immunoprecipitation sequencing (RIP-seq) method (figure created with BioRender.com). L1TD1-RNA complexes were isolated from HAP1 KO cell extracts with an L1TD1-specific antibody, RNA was isolated from complexes and input and cDNA libraries were prepared using the Smart-seq3 protocol. Sequencing data was analyzed by DEseq2 and TEtranscript software, separately. (B) Volcano plot showing L1TD1-associated transcripts as a result of DESeq2 analysis (cut-off log2FC >2 and adj. p-value<0.05). Selected hits are highlighted in blue. (C) RIP-qPCR analysis confirms L1TD1 interaction with the transcripts L1TD1, ARMC1, YY2. The bar graphs represent the fold enrichments of the transcripts in the IP samples of DNMT1 KO relative to DNMT1/L1TD1 DKO cells (set to 1) and normalized to input samples in the indicated cells. GAPDH was used as a negative control for the RIP-qPCR analysis. (D) Volcano plot showing L1TD1-associated transposon transcripts as result of the TEtranscript analysis with a log2FC >1 and adj. p-value<0.05. LINE1 elements are highlighted in green, ERV elements in yellow and other associated transposon transcripts in red. (E) RIP-qPCR analysis confirms the association of L1TD1 with L1 transcripts. Statistical significance was determined using paired two-tailed t-test. All data in the figure are shown as a mean of ± SD of three biological replicates. *p≤0.05, **p≤0.01, ***p≤0.001, ****p≤0.0001, ns = not significant.
-
Figure 2—source data 1
Source data for all plots in Figure 2 and corresponding details of statistical tests and p-values.
- https://cdn.elifesciences.org/articles/96850/elife-96850-fig2-data1-v1.xlsx
Figure 2—figure supplement 1
L1TD1 interacts with a specific set of mRNAs and transposon transcripts.
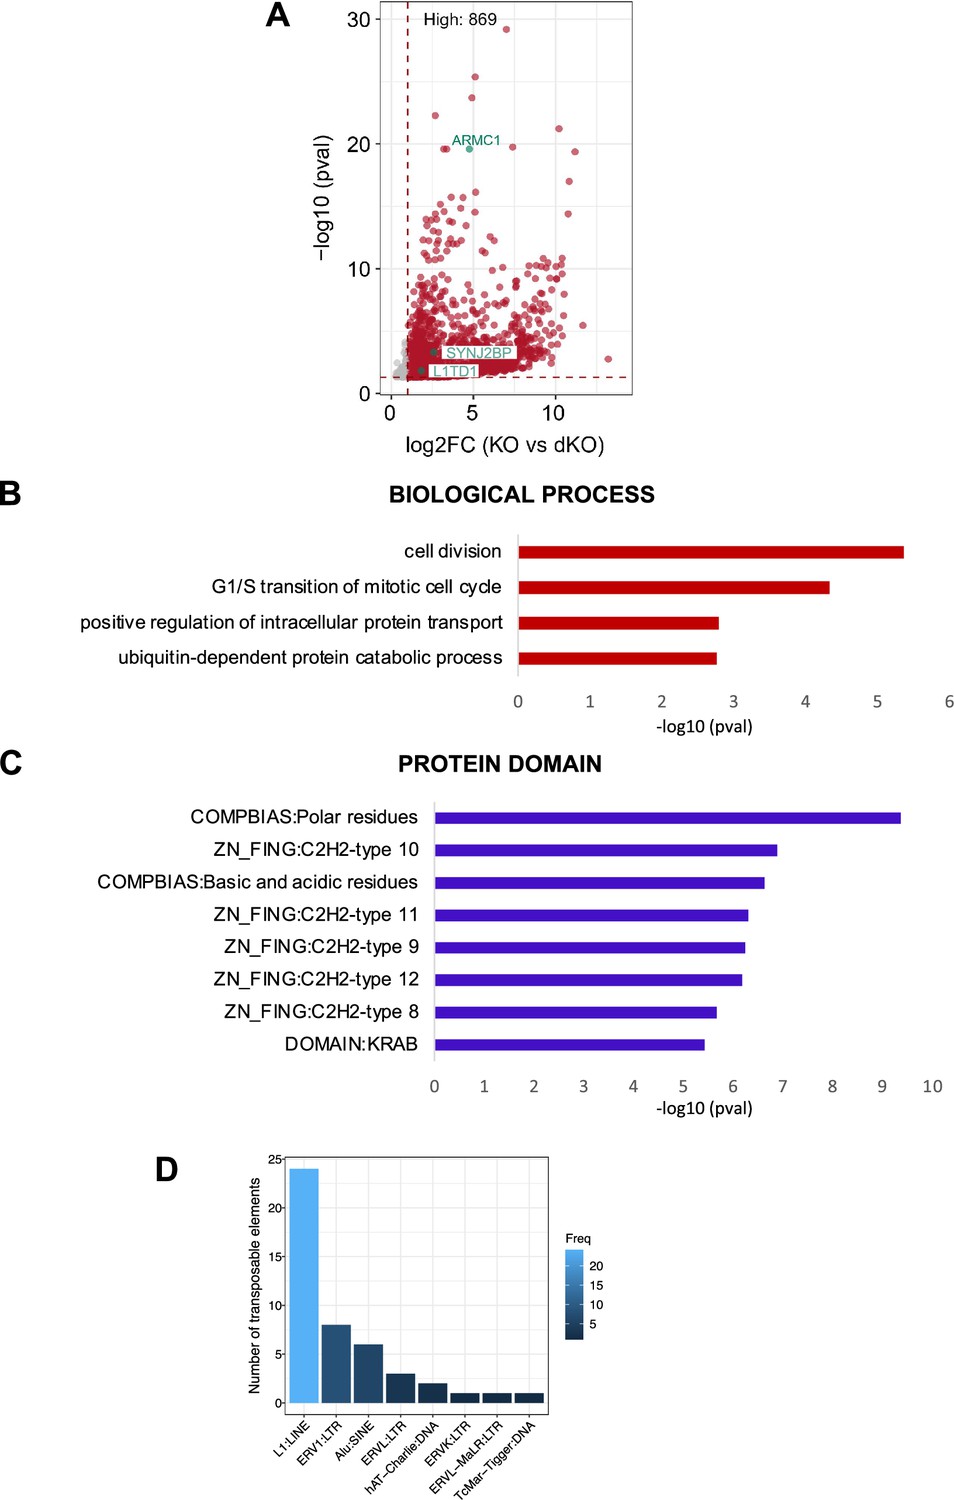
(A) Volcano plot showing the L1TD1-associated transcripts enriched in DNMT1 KO IP over DNMT1/L1TD1 DKO IP (log2FC ≥2 and adj. p-val<0.05). The transcripts of L1TD1, SYNJ2BP, ARMC1 are highlighted in green. (B, C) DAVID Gene Ontology enrichment analysis of 228 common transcripts identified as L1TD1 targets in both DESeq2 comparisons (DNMT1 KO versus input and DNMT1 KO versus DNMT1/L1TD1 DKO) in terms of biological processes (B) and protein domains (C).(D) Classification of TEs associated with L1TD1 (log2FC >1, adj. p-val<0.05) according to their frequency (taken from Supplementary file 3).
-
Figure 2—figure supplement 1—source data 1
Plots and statistics source data for all plots in Figure 2—figure supplement 1 and corresponding details of statistical tests and p-values.
- https://cdn.elifesciences.org/articles/96850/elife-96850-fig2-figsupp1-data1-v1.xlsx
Figure 3 with 3 supplements
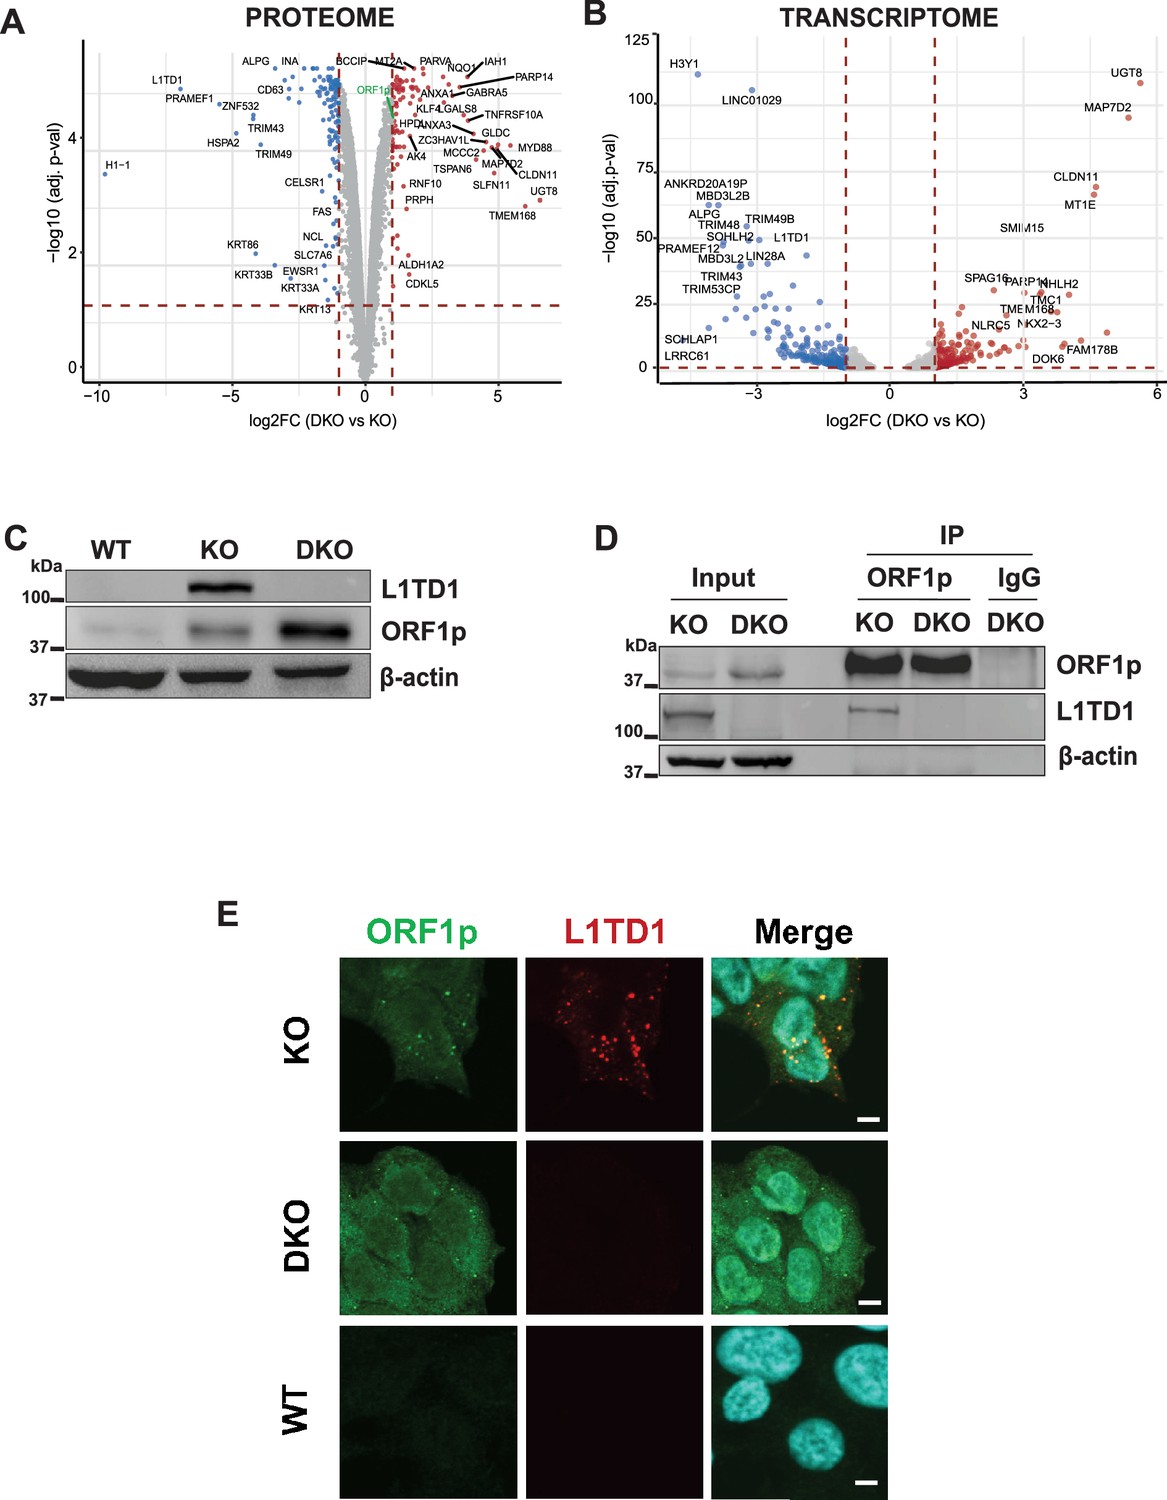
L1TD1 cross-talk with its ancestor L1 ORF1p.
(A) Volcano plot displaying the comparison of the proteomes of HAP1 DNMT1 KO and DNMT1/L1TD1 DKO cells determined by mass spectrometry. Differentially abundant proteins were plotted as DNMT1/L1TD1 DKO over DNMT1 KO (log2FC ≥1, adj. p-value<0.05 [red] and log2FC ≤ –1, adj. p-value<0.05 [blue]). (B) Volcano plot illustrating the DESeq2 analysis of RNA-seq performed with HAP1 DNMT1 KO and DNMT1/L1TD1 DKO cells. Differentially expressed genes are plotted as DNMT1/L1TD1 DKO over DNMT1 KO (log2FC ≥1, adj. p-value<0.05 [red] and log2FC ≤ –1, adj. p-value<0.05 [blue]). (C) Western blot analysis illustrating protein levels of L1TD1 and L1 ORF1p in HAP1 WT, DNMT1 KO and DNMT1/L1TD1 DKO cells. β-actin was used as loading control. (D) Physical interaction of L1 ORF1p and L1TD1. L1 ORF1p was immunoprecipitated with an L1 ORF1p-specific antibody from whole cell extracts prepared from DNMT1 KO and DNMT1/L1TD1 DKO cells. Precipitated L1 RNP complexes and inputs were analyzed on a Western blot. IgG was used as a negative IP control and β-actin was used as loading control. (E) Confocal microscopy images of indirect immunofluorescence co-stainings using mouse L1 ORF1p (green) and rabbit L1TD1 (red) antibodies in DNMT1 KO, DNMT1/L1TD1 DKO and HAP1 WT cells. In merged images nuclear DNA was stained with DAPI. Scale bars, 5 µm.
-
Figure 3—source data 1
Source data for all plots in Figure 3 and corresponding details of statistical tests and p-values.
- https://cdn.elifesciences.org/articles/96850/elife-96850-fig3-data1-v1.xlsx
-
Figure 3—source data 2
Original western blots of Figure 3C and D indicating the relevant bands.
- https://cdn.elifesciences.org/articles/96850/elife-96850-fig3-data2-v1.pdf
-
Figure 3—source data 3
Original image files for western blots of Figure 3C and D.
- https://cdn.elifesciences.org/articles/96850/elife-96850-fig3-data3-v1.zip
Figure 3—figure supplement 1
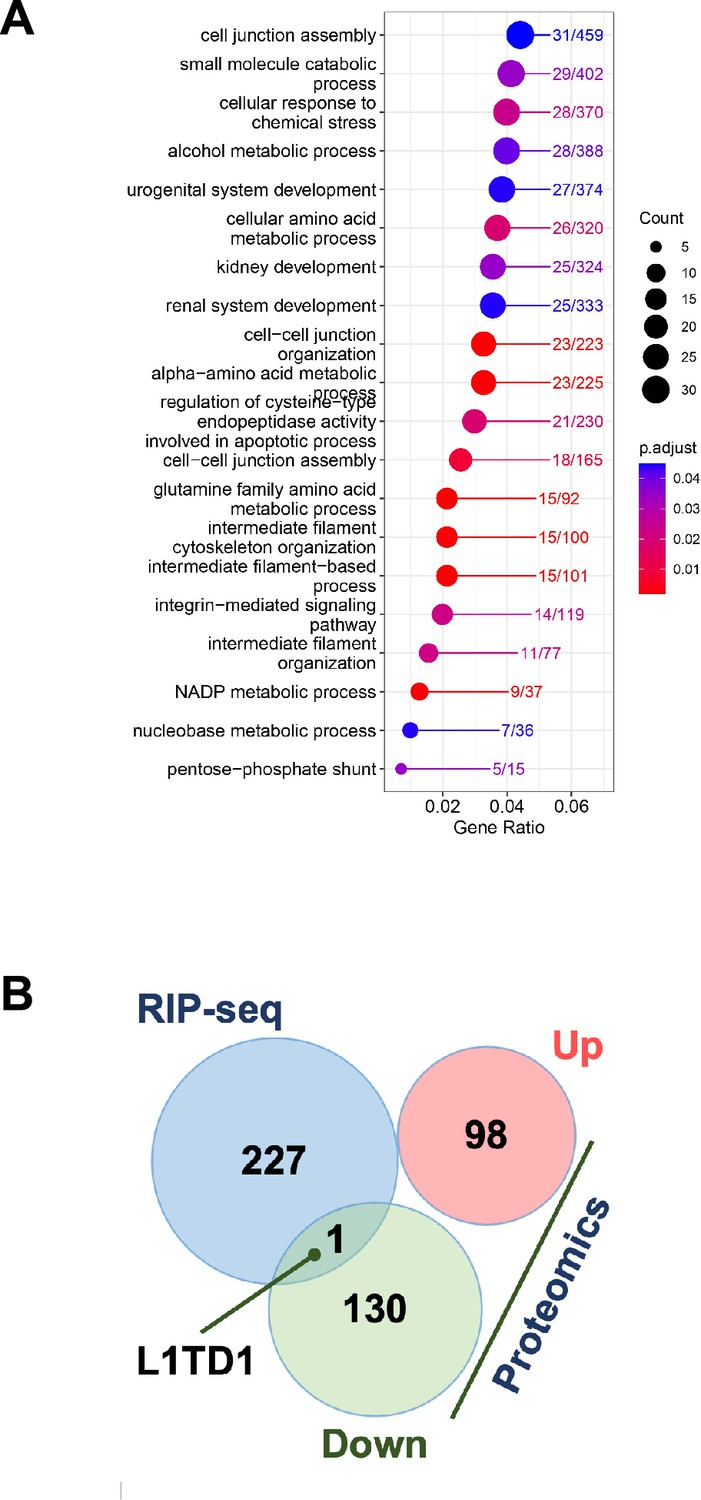
GSEA analysis of proteins upon loss of L1TD1.
(A) Gene ontology enrichment analysis of proteins differentially expressed in HAP1 DNMT1/L1TD1 DKO versus DNMT1 KO cells. (B) Venn plot of the overlap of mRNAs identified in the RIP-seq analysis and differentially expressed proteins (up and down) identified in the mass spectrometry analysis of HAP1 DNMT1/L1TD1 DKO and DNMT1 KO cells. The single common mRNA is L1TD1.
-
Figure 3—figure supplement 1—source data 1
Source data for all plots in Figure 3—figure supplement 1 and corresponding details of statistical tests and p-values.
- https://cdn.elifesciences.org/articles/96850/elife-96850-fig3-figsupp1-data1-v1.xlsx
Figure 3—figure supplement 2
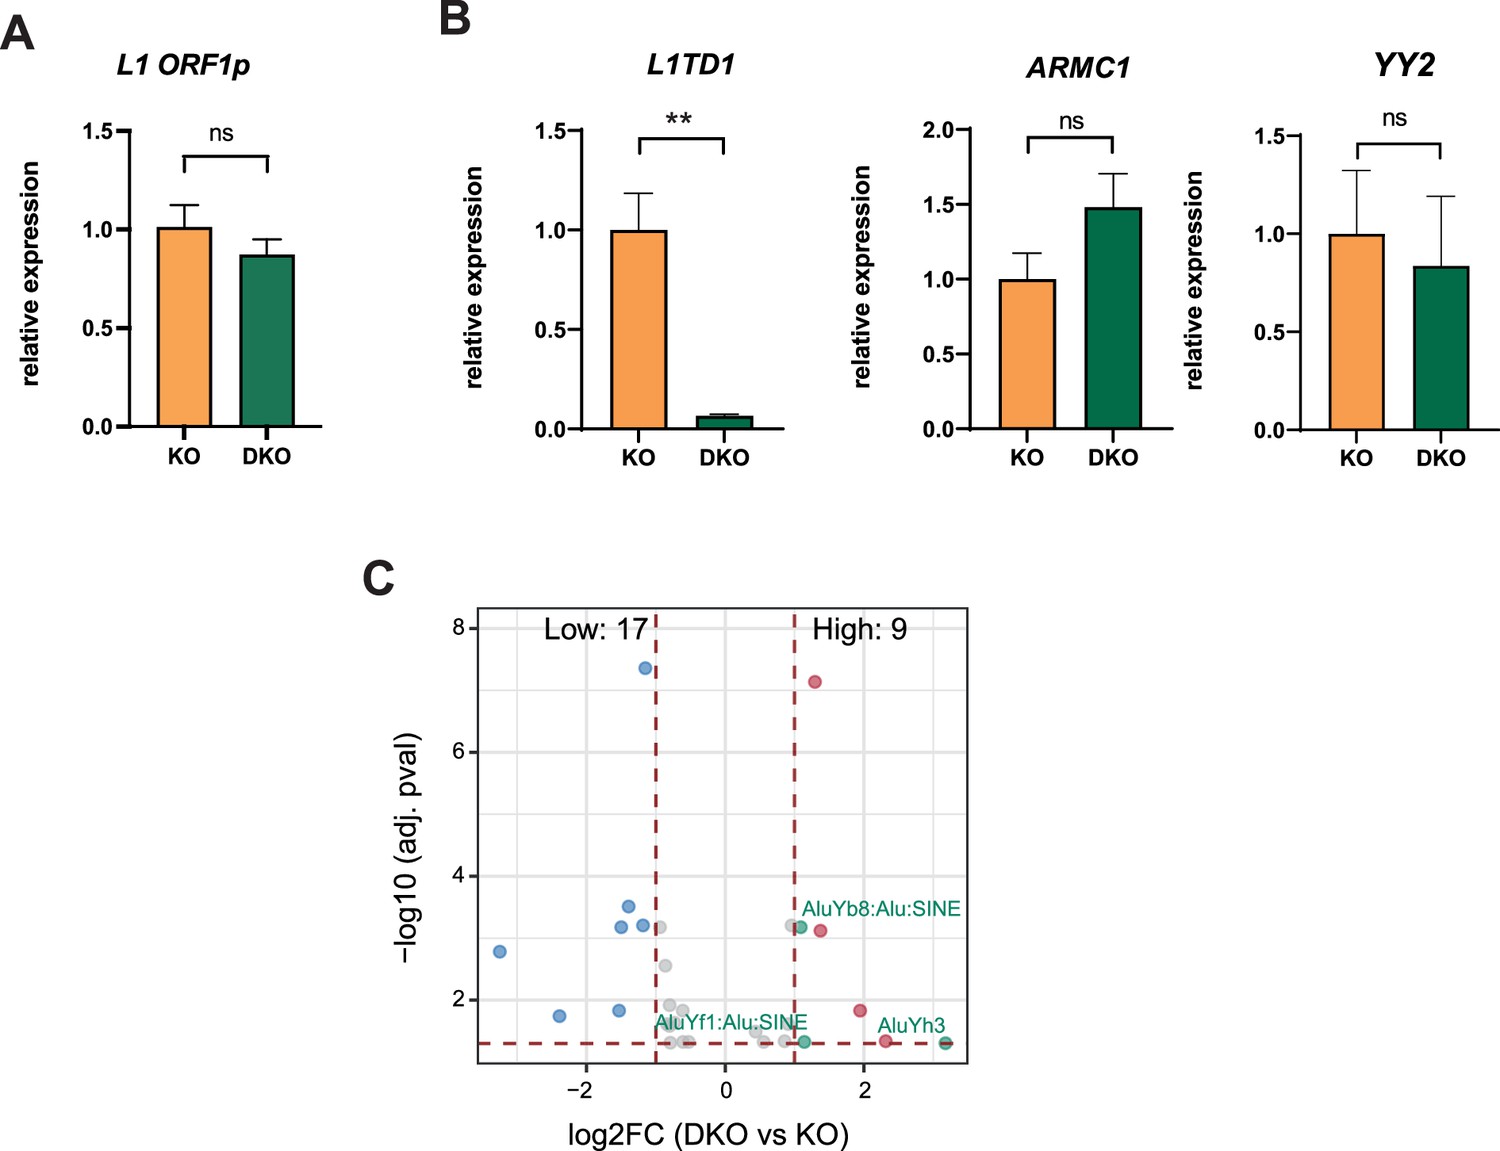
Ablation of L1TD1 leads to changes in the transcriptome of HAP1 cells.
(A, B) qRT-PCR analyses of selected L1TD1-associated transcripts. Statistical significance was determined using unpaired two-tailed t-test. Data are shown as mean of ± SD of three biological replicates. **p≤0.01, ns = not significant. (C) Volcano plot illustrating TEtranscript analysis of RNA-seq performed in HAP1 DNMT1 KO and DNMT1/L1TD1 DKO cells. Positively enriched TEs are shown in red and negatively enriched TEs are shown in blue. Alu elements are highlighted in green.
-
Figure 3—figure supplement 2—source data 1
Source data for all plots in Figure 3—figure supplement 2 and corresponding details of statistical tests and p-values.
- https://cdn.elifesciences.org/articles/96850/elife-96850-fig3-figsupp2-data1-v1.xlsx
Figure 3—figure supplement 3
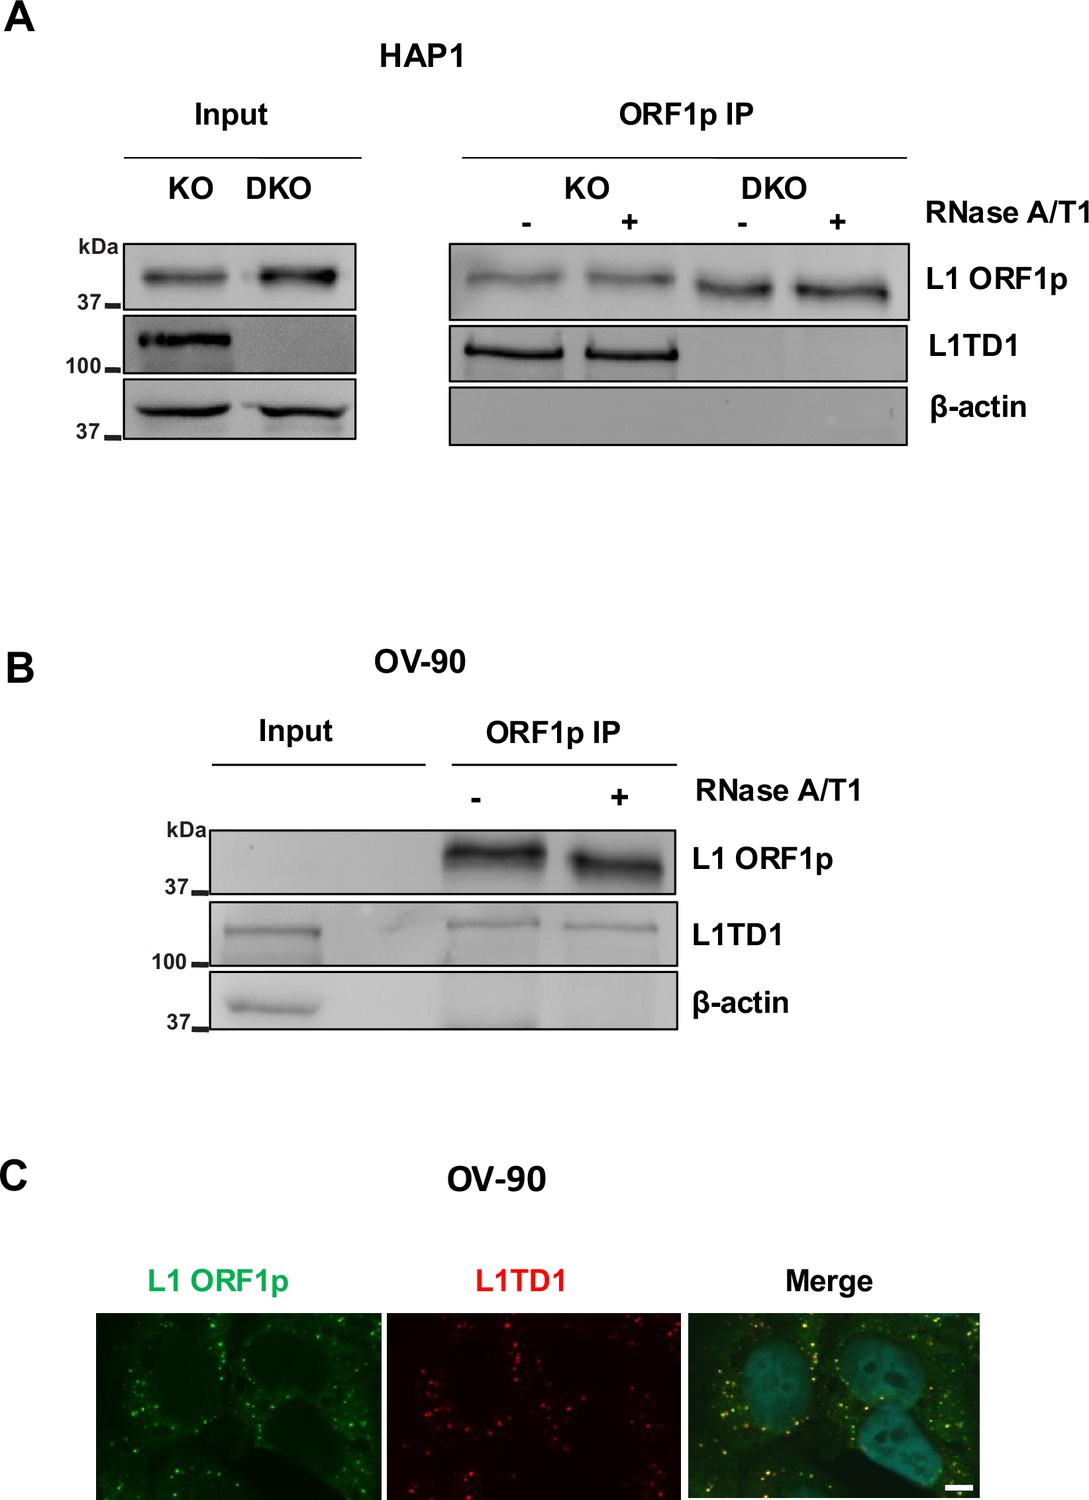
RNA-independent interaction of L1TD1 and L1 ORF1p in HAP1 and OV-90 cells.
(A) Western blot analysis of L1 ORF1p IPs with and without RNase A/T1 digestion in DNMT1 KO HAP1 cells using antibodies specific for L1 ORF1p and L1TD1 together with input samples. DNMT1/L1TD1 DKO HAP1 cells were used as a negative IP control and β-actin was used as western blot loading control. (B) Western blot analysis of L1 ORF1p IPs with and without RNase A/T1 digestion in OV-90 cells using antibodies specific for L1 ORF1p and L1TD1 in OV-90 cells. Mouse IgG was used as a negative control for the IP and β-actin was used as western blot loading control. (C) Indirect immunofluorescence analysis of L1 ORF1p (green) and L1TD1 (red) in OV-90 cells. In merged images nuclear DNA was stained with DAPI (blue). Scale bar, 5 µm.
-
Figure 3—figure supplement 3—source data 1
Original western blots of Figure 3—figure supplement 3B indicating the relevant bands.
- https://cdn.elifesciences.org/articles/96850/elife-96850-fig3-figsupp3-data1-v1.pdf
-
Figure 3—figure supplement 3—source data 2
Original image files for western blots of Figure 3—figure supplement 3B.
- https://cdn.elifesciences.org/articles/96850/elife-96850-fig3-figsupp3-data2-v1.zip
Figure 4 with 1 supplement
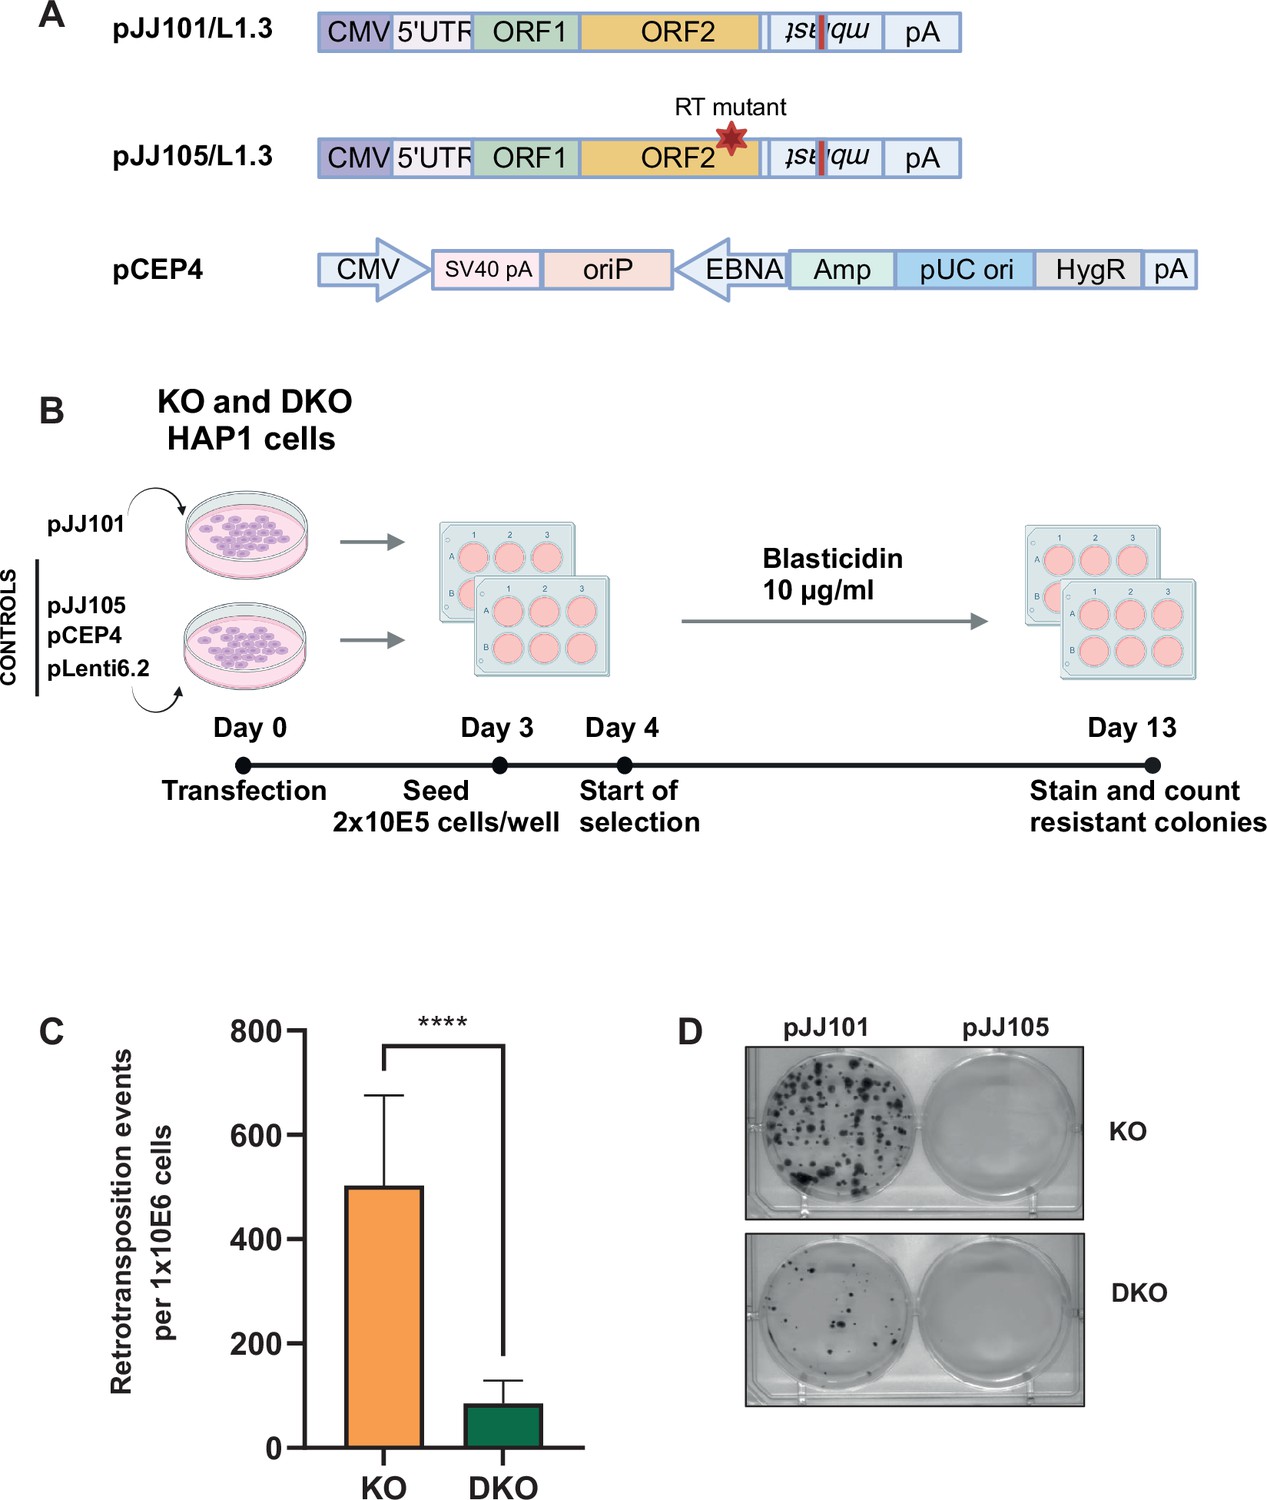
L1TD1 promotes L1 retrotransposition.
(A) Schematic representation of plasmids used for retrotransposition (figure modified from Kopera et al., 2016 and generated with BioRender.com). The pJJ101/L1.3 construct contains the full-length human L1.3 element with a blasticidin deaminase gene (mblast) inserted in antisense within the 3’UTR. The mblast gene is disrupted by an intron and mblast expression occurs only when L1 transcript is expressed, reverse transcribed, and inserted into the genome. The pJJ105/L1.3 plasmid contains a mutation in the reverse transcriptase (RT), resulting in defective retrotransposition. The backbone plasmid pCEP4 was used as additional negative control. The blasticidin deaminase gene containing plasmid pLenti6.2 was used as transfection/selection control. (B) Workflow of retrotransposition assay. DNMT1 KO and DNMT1/L1TD1 DKO cells were separately transfected with pJJ101 and control plasmids. Equal number of cells were seeded for each condition. Blasticidin selection (10 µg/ml) was started at day 4 and resistant colonies were counted on day 13. This panel was created using BioRender.com. (C) Bar graph showing the average number of retrotransposition events per 106 cells seeded in three independent experiments. Blasticidin-resistant colonies in pLenti6.2 transfected cells were used for normalization. Statistical significance was determined using unpaired t-test. All data in the figure are shown as a mean of ± SD of three independent experiments, ****p≤0.0001. (D) Representative pictures of bromophenol blue stainings of blasticidin-resistant colonies for each genotype and each transfection.
-
Figure 4—source data 1
Source data for all plots in Figure 4 and corresponding details of statistical tests and p-values.
- https://cdn.elifesciences.org/articles/96850/elife-96850-fig4-data1-v1.xlsx
Figure 4—figure supplement 1
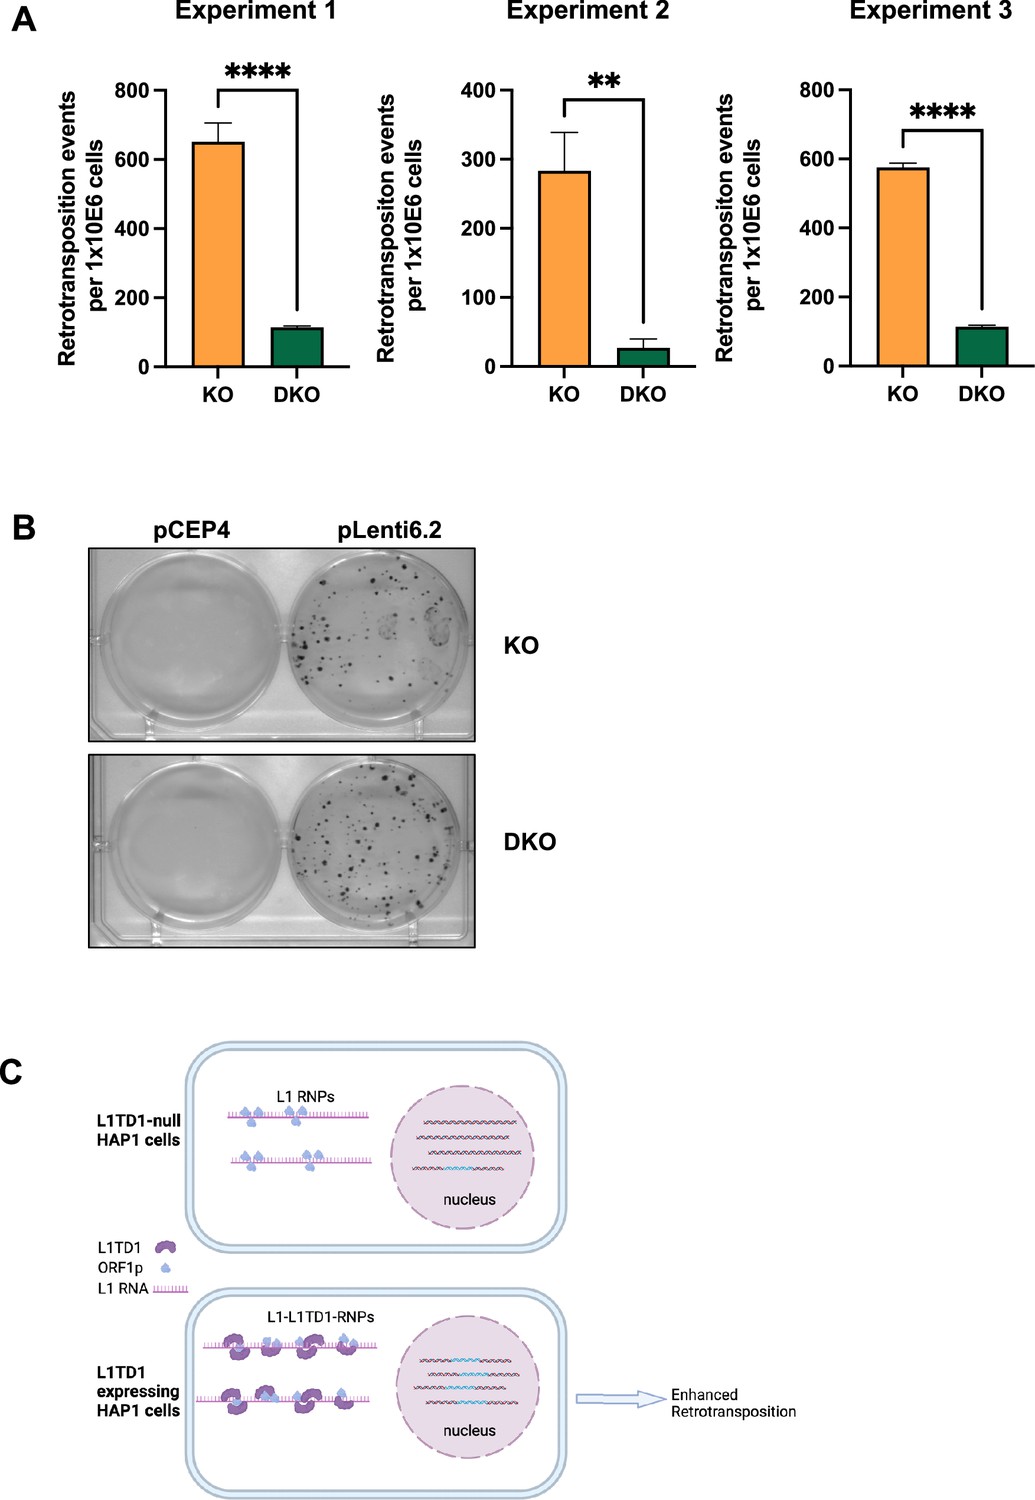
L1TD1 enhances L1 retrotransposition.
(A) The bar graphs separately show the number of retrotransposition events per 106 cells seeded for three independent biological replicates. Blasticidin-resistant colonies in pLenti6.2 transfected cells were used for normalization. Statistical significance was determined using unpaired t-test. All data in the figure are shown as a mean of ± SD of three technical replicates. **p≤0.01, ****p≤0.0001. (B) Representative pictures of bromophenol blue stainings of blasticidin-resistant colonies for transfection with the backbone plasmid pCEP4 used as negative control and the blasticidin deaminase gene containing plasmid pLenti6.2 used as transfection/selection control. (C) Potential mechanism of facilitated L1 retrotransposition by L1TD1. By association with L1-RNPs L1TD1 might enhance the chaperone function of L1ORF1p, resulting in more efficient L1 retrotransposition (figure created with BioRender.com).
-
Figure 4—figure supplement 1—source data 1
Plots and statistics source data for all plots in Figure 4—figure supplement 1 and corresponding details of statistical tests and p-values.
- https://cdn.elifesciences.org/articles/96850/elife-96850-fig4-figsupp1-data1-v1.xlsx
Author response image 1
Tables
Key resources table
| Reagent type (species) or resource | Designation | Source or reference | Identifiers | Additional information |
|---|---|---|---|---|
| Cell line (Homo sapiens) | HAP1 | Near-haploid human cell line derived from the male CML cell line KBM-7 | Horizon Discovery C631 RRID:CVCL_Y019 | |
| Cell line (H. sapiens) | OV-90 | Human malignant papillary serous carcinoma cell line | ATCC-CRL-3585 RRID:CVCL_3768 | |
| Transfected construct (human) | pJJ101/L1.3 (plasmid) | Kopera et al., 2016 | Retrotransposition assay | Full-length human L1.3 element |
| Transfected construct (human) | pJJ105/L1.3 (plasmid) | Kopera et al., 2016 | Retrotransposition assay | Full-length human L1.3 element with mutation in RT |
| Transfected construct (human) | pCEP4 (plasmid) | Kopera et al., 2016 | Retrotransposition assay | Backbone plasmid |
| Transfected construct (human) | pLenti6.2 | Thermo Fisher | Retrotransposition assay control | Blasticidin deaminase gene |
| Antibody | L1TD1 (polyclonal rabbit) | Sigma-Aldrich | HPA028501 RRID:AB_10599287 | 1:1000 |
| Antibody | L1TD1 (monoclonal mouse) | R&D Systems | MAB8317 RRID:AB_10616625 | 4 ug/IP |
| Antibody | LINE-1 ORF1p (monoclonal mouse) | Sigma-Aldrich | MABC1152 RRID:AB_2941775 | 4 ug/IP 1:1000 WB 1:1000 IF |
| Antibody | LAMIN (polyclonal goat) | Santa Cruz | sc-6216 RRID:AB_648156 | 1:1000 |
| Antibody | Vinculin (monoclonal rabbit) | Cell Signaling | 13901 RRID:AB_2728768 | 1:1000 |
| Antibody | β-actin (monoclonal mouse) | Abcam | ab8226 RRID:AB_306371 | 1:1000 |
| Antibody | DNMT1 (H-300) (polyclonal rabbit) | Santa Cruz | sc20701 RRID:AB_2293064 | 1:1000 |
| Antibody | ɣ-H2AX (monoclonal mouse) | Millipore | JBW301 RRID:AB_2847865 | 1:1000 |
| Antibody | Histone H3 C-term (polyclonal rabbit) | Abcam | Ab1791 RRID:AB_302613 | 1:5000 |
| Antibody | Cleaved caspase 3 (polyclonal rabbit) | Cell Signaling | 9661 RRID:AB_2341188 | 1:50 |
| Antibody | Anti-mouse HRP (polyclonal) | Jackson Laboratories | 115-035-008 RRID:AB_2313585 | 1:10,000 |
| Antibody | Anti-rabbit HRP (polyclonal) | Jackson Laboratories | 211-032-171 RRID:AB_2339149 | 1:10,000 |
| Antibody | Goat anti-Rabbit IgG (H+L) Alexa Fluor Plus 488 | Invitrogen | A32731 RRID:AB_2633280 | 1:500 |
| Antibody | Goat anti-Mouse IgG (H+L) Alexa Fluor Plus 546 | Invitrogen | A11030 RRID:AB_2737024 | 1:500 |
| Sequence-based reagent | hL1TD1 _f | This paper | PCR primers | CTTACCCTGG TAGCCGACCT |
| Sequence-based reagent | hL1TD1 _r | This paper | PCR primers | GGCTGGCAAA TTTTCTAAGG |
| Sequence-based reagent | hARMC1_f | This paper | PCR primers | AGCTCTGGAG CGAATTTAAGA |
| Sequence-based reagent | hARMC1_r | This paper | PCR primers | GGCAGACATC CCTGATCCTG |
| Sequence-based reagent | hYY2_f | This paper | PCR primers | TCCCGGATAG CATTGAAGAC |
| Sequence-based reagent | hYY2_r | This paper | PCR primers | TTGACCTGCA TTTGCTTCTG |
| Sequence-based reagent | hORF1p_f | This paper | PCR primers | AGTGCTTAAAG GAGCTGATGG |
| Sequence-based reagent | hORF1p_r | This paper | PCR primers | AACTGGAAGAA AGGGTATCAGC |
| Commercial assay or kit | CellTiter-Glo Luminiscent Cell Viability Assay | Promega | G7571 | |
| Commercial assay or kit | Monarch RNA Cleanup Kit | New England Biolabs | T2047L | |
| Commercial assay or kit | Qubit RNA High Sensitivity kit | Thermo Fisher Scientific | Q32852 | |
| Commercial assay or kit | iScript cDNA synthesis Kit | Bio-Rad | 1708891 | |
| Commercial assay or kit | Wizard Genomic DNA isolation kit | Promega | ||
| Commercial assay or kit | EZ DNA Methylation Kit | Zymo Research | D5001 | |
| Software, algorithm | DESeq2 | Love et al., 2014 | RRID:SCR_015687 | |
| Software, algorithm | TEtranscript | Jin et al., 2015 | RRID:SCR_023208 | |
| Software, algorithm | Fiji ImageJ | Schindelin et al., 2012 | RRID:SCR_002285 | |
| Software, algorithm | FlowJo | BD Bioscience | 10.6.1 RRID:SCR_008520 |
Additional files
-
Supplementary file 1
DEG list (upregulated and downregulated) for HAP1 DNMT1 KO versus HAP1 WT cells.
- https://cdn.elifesciences.org/articles/96850/elife-96850-supp1-v1.xlsx
-
Supplementary file 2
DESeq2 analysis of L1TD1 RIP-seq data from HAP1 DNMT1 KO and HAP1 DNMT1 L1TD1 DKO cells.
- https://cdn.elifesciences.org/articles/96850/elife-96850-supp2-v1.xlsx
-
Supplementary file 3
TETranscript analysis of L1TD1 RIP-seq data from HAP1 DNMT1 KO and HAP1 DNMT1 L1TD1 DKO cells.
- https://cdn.elifesciences.org/articles/96850/elife-96850-supp3-v1.xlsx
-
Supplementary file 4
Mass spectrometry analysis of deregulated proteins in HAP1 DNMT1 KO and HAP1 DNMT1 L1TD1 DKO cells.
- https://cdn.elifesciences.org/articles/96850/elife-96850-supp4-v1.xlsx
-
Supplementary file 5
DESeq2 transcriptome analysis of HAP1 DNMT1 L1TD1 DKO versus HAP1 DNMT1 KO cells.
- https://cdn.elifesciences.org/articles/96850/elife-96850-supp5-v1.xlsx
-
Supplementary file 6
t transcriptome analysis of HAP1 DNMT1 L1TD1 DKO versus HAP1 DNMT1 KO cells.
- https://cdn.elifesciences.org/articles/96850/elife-96850-supp6-v1.xlsx
-
Supplementary file 7
Sequences of primers used in this study.
- https://cdn.elifesciences.org/articles/96850/elife-96850-supp7-v1.xlsx
-
Supplementary file 8
Antibodies used in this study.
- https://cdn.elifesciences.org/articles/96850/elife-96850-supp8-v1.xlsx
-
MDAR checklist
- https://cdn.elifesciences.org/articles/96850/elife-96850-mdarchecklist1-v1.docx
Download links
A two-part list of links to download the article, or parts of the article, in various formats.
Downloads (link to download the article as PDF)
Open citations (links to open the citations from this article in various online reference manager services)
Cite this article (links to download the citations from this article in formats compatible with various reference manager tools)
The domesticated transposon protein L1TD1 associates with its ancestor L1 ORF1p to promote LINE-1 retrotransposition
eLife 13:RP96850.
https://doi.org/10.7554/eLife.96850.4


