Dynamic chromatin architecture identifies new autoimmune-associated enhancers for IL2 and novel genes regulating CD4+ T cell activation
- Center for Spatial and Functional Genomics, Children's Hospital of Philadelphia, United States
- Division of Human Genetics, The Children’s Hospital of Philadelphia, United States
- Department of Pathology, The Children’s Hospital of Philadelphia, United States
- Benaroya Research Institute at Virginia Mason, United States
- Department of Immunology, University of Washington School of Medicine, United States
- Department of Genetics, Perelman School of Medicine, University of Pennsylvania, United States
- Department of Pediatrics, Perelman School of Medicine, University of Pennsylvania, United States
- Division of Endocrinology and Diabetes, The Children’s Hospital of Philadelphia, United States
- Department of Pathology and Laboratory Medicine, Perelman School of Medicine, University of Pennsylvania, United States
- Institute for Immunology, Perelman School of Medicine, University of Pennsylvania, United States
Figures
Figure 1 with 1 supplement
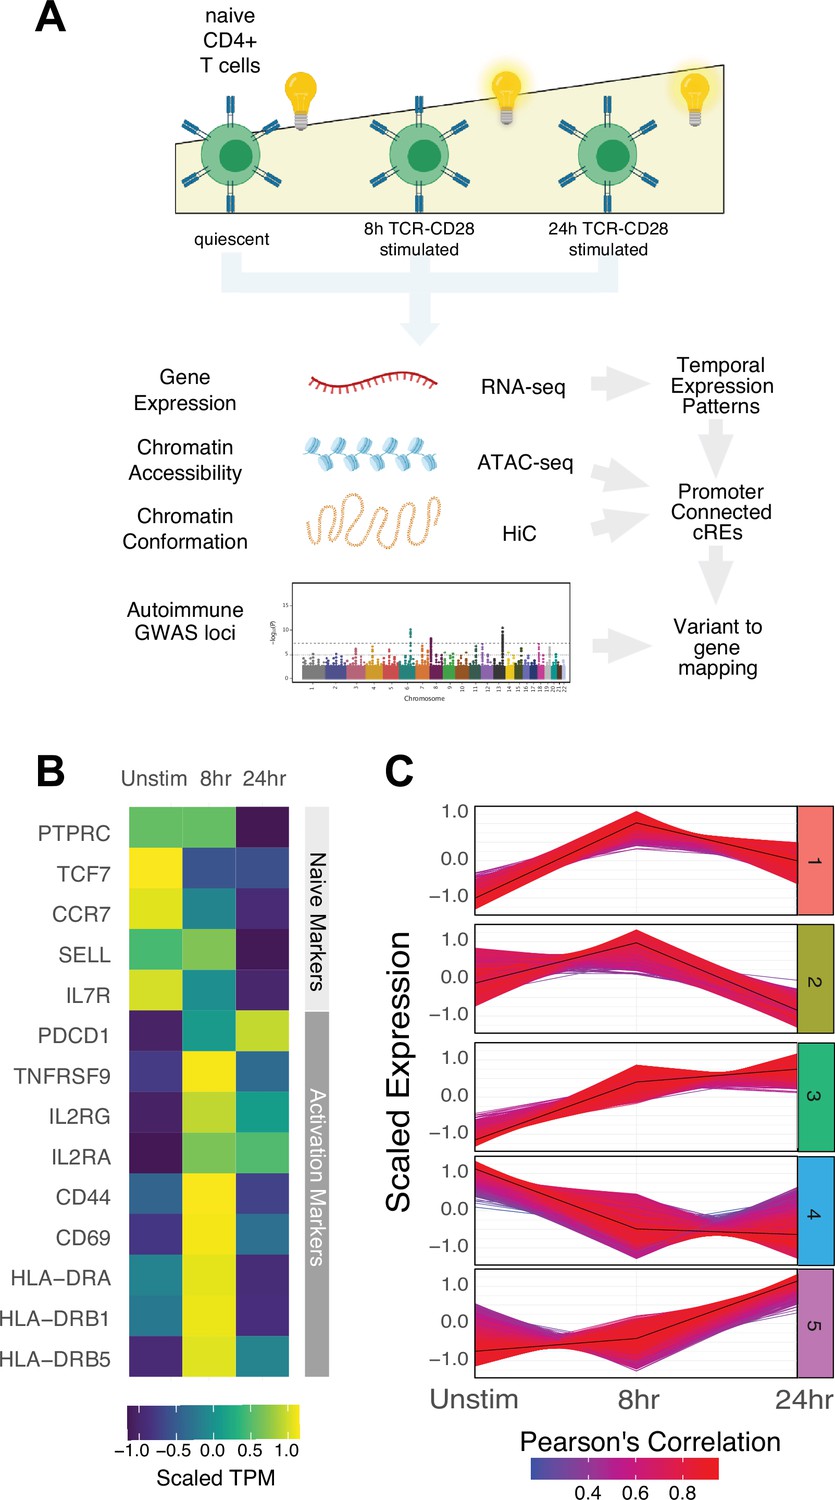
Defined gene expression dynamics throughout activation of naïve CD4+ T cells.
(A) Diagram of study design: RNA-seq, ATAC-seq, and HiC libraries were prepared from sorted CD3+CD4+CD45RA+CD45RO- naïve T cells (donor N = 3) prior to or following 8 hr or 24 hr stimulation with anti-CD3/28 beads. cis-regulatory elements (cRE) are classified to genes allowing for interrogation of the pattern of expression, accessibility, and chromatin structure changes of autoimmune-associated variants. (B) Heatmap showing normalized expression of known markers of T cell activation. (C) k-means clustering of differentially expressed genes into five groups using the elbow and within-cluster-sum of squares methods to select the number of clusters. The centroid of the cluster is depicted as a black line, and members of the cluster are depicted as colored lines. Color indicates the Pearson’s correlation coefficient between the gene and the cluster centroid, with red indicating higher correlation and blue lower correlation.
Figure 1—figure supplement 1
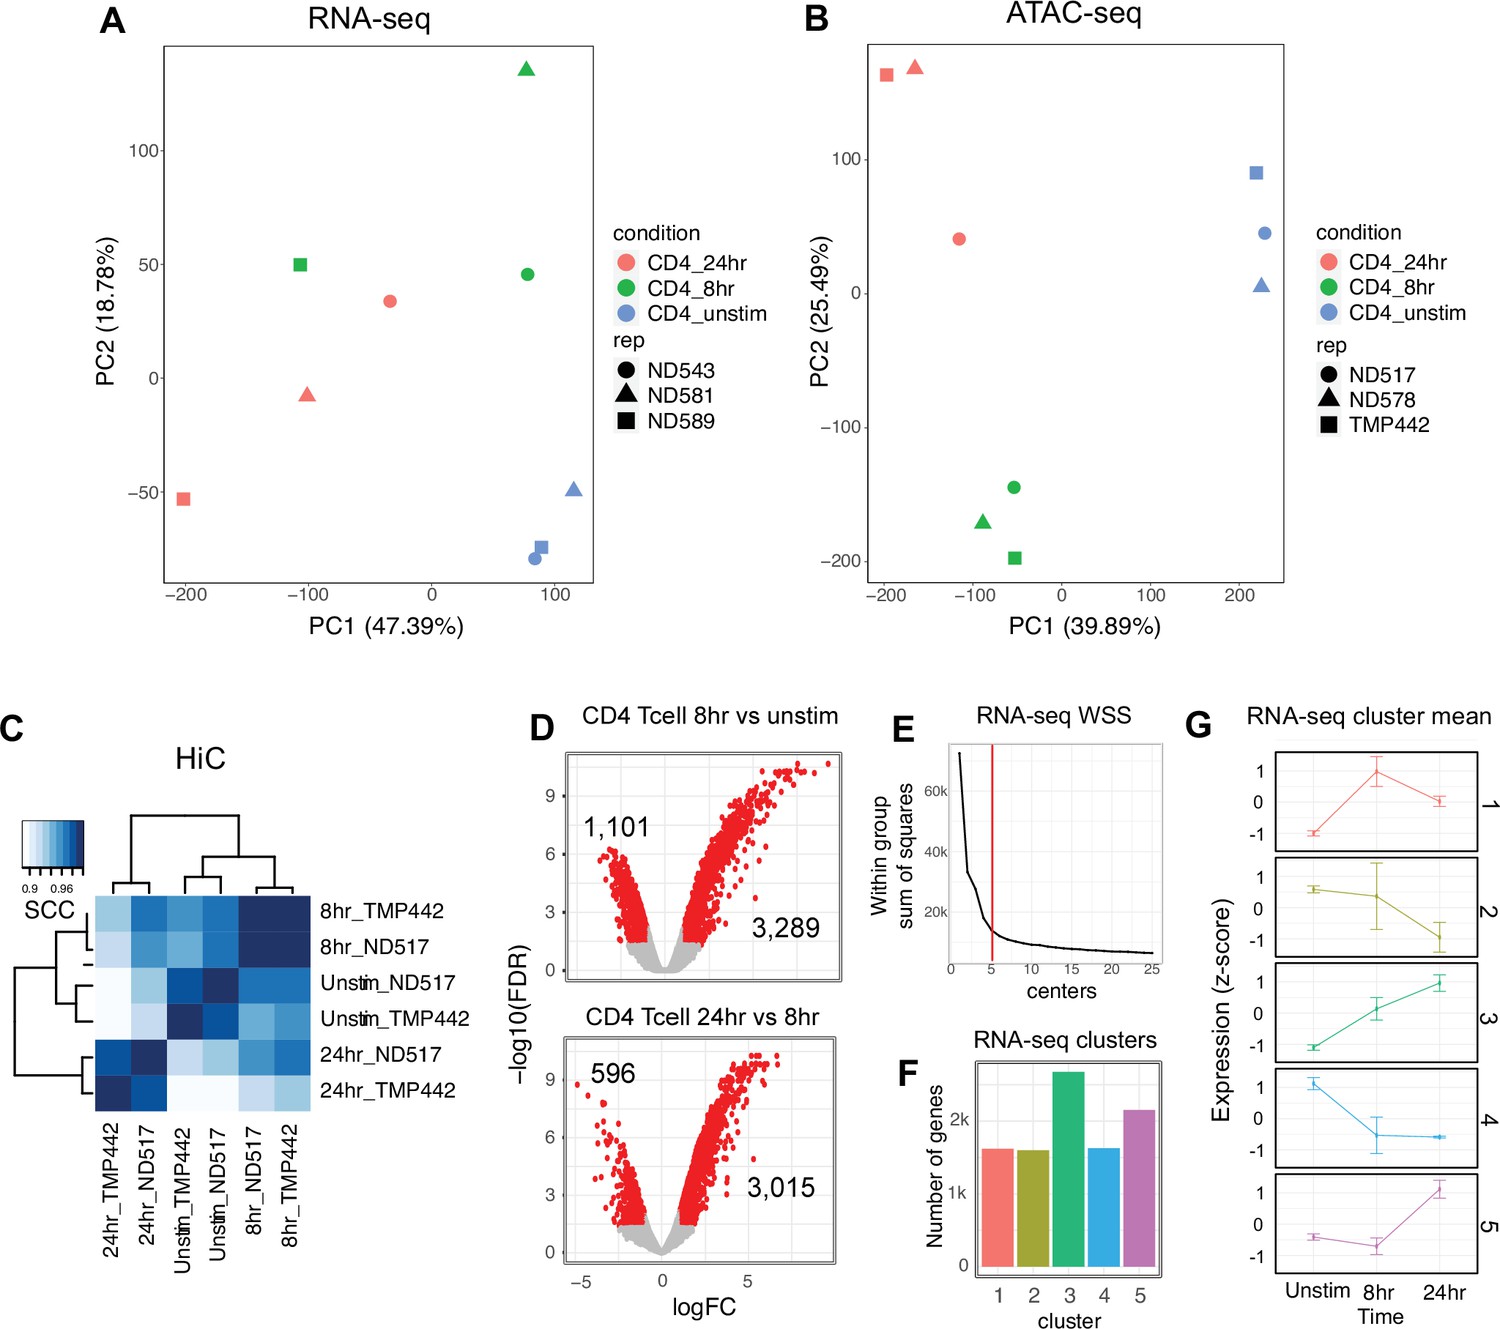
Library sequencing reproducibility and expression clustering.
(A) Principal component analysis (PCA) of RNA-seq libraries. (B) PCA of ATAC-seq libraries. (C) Stratified correlation (SCC) of HiC libraries from two donors by stage of activation. (D) Volcano plot of RNA-seq data for CD4+ T cells unstimulated vs. 8 hr stimulation (top) and 8 hr vs. 24 hr stimulation (number of differentially expressed genes [DEG] indicated). (E) Elbow plot of the within group sum of squares used to determine optimal cluster number. (F) Genes per expression cluster. (G) Centroids ± standard deviation for each cluster.
Figure 2 with 3 supplements
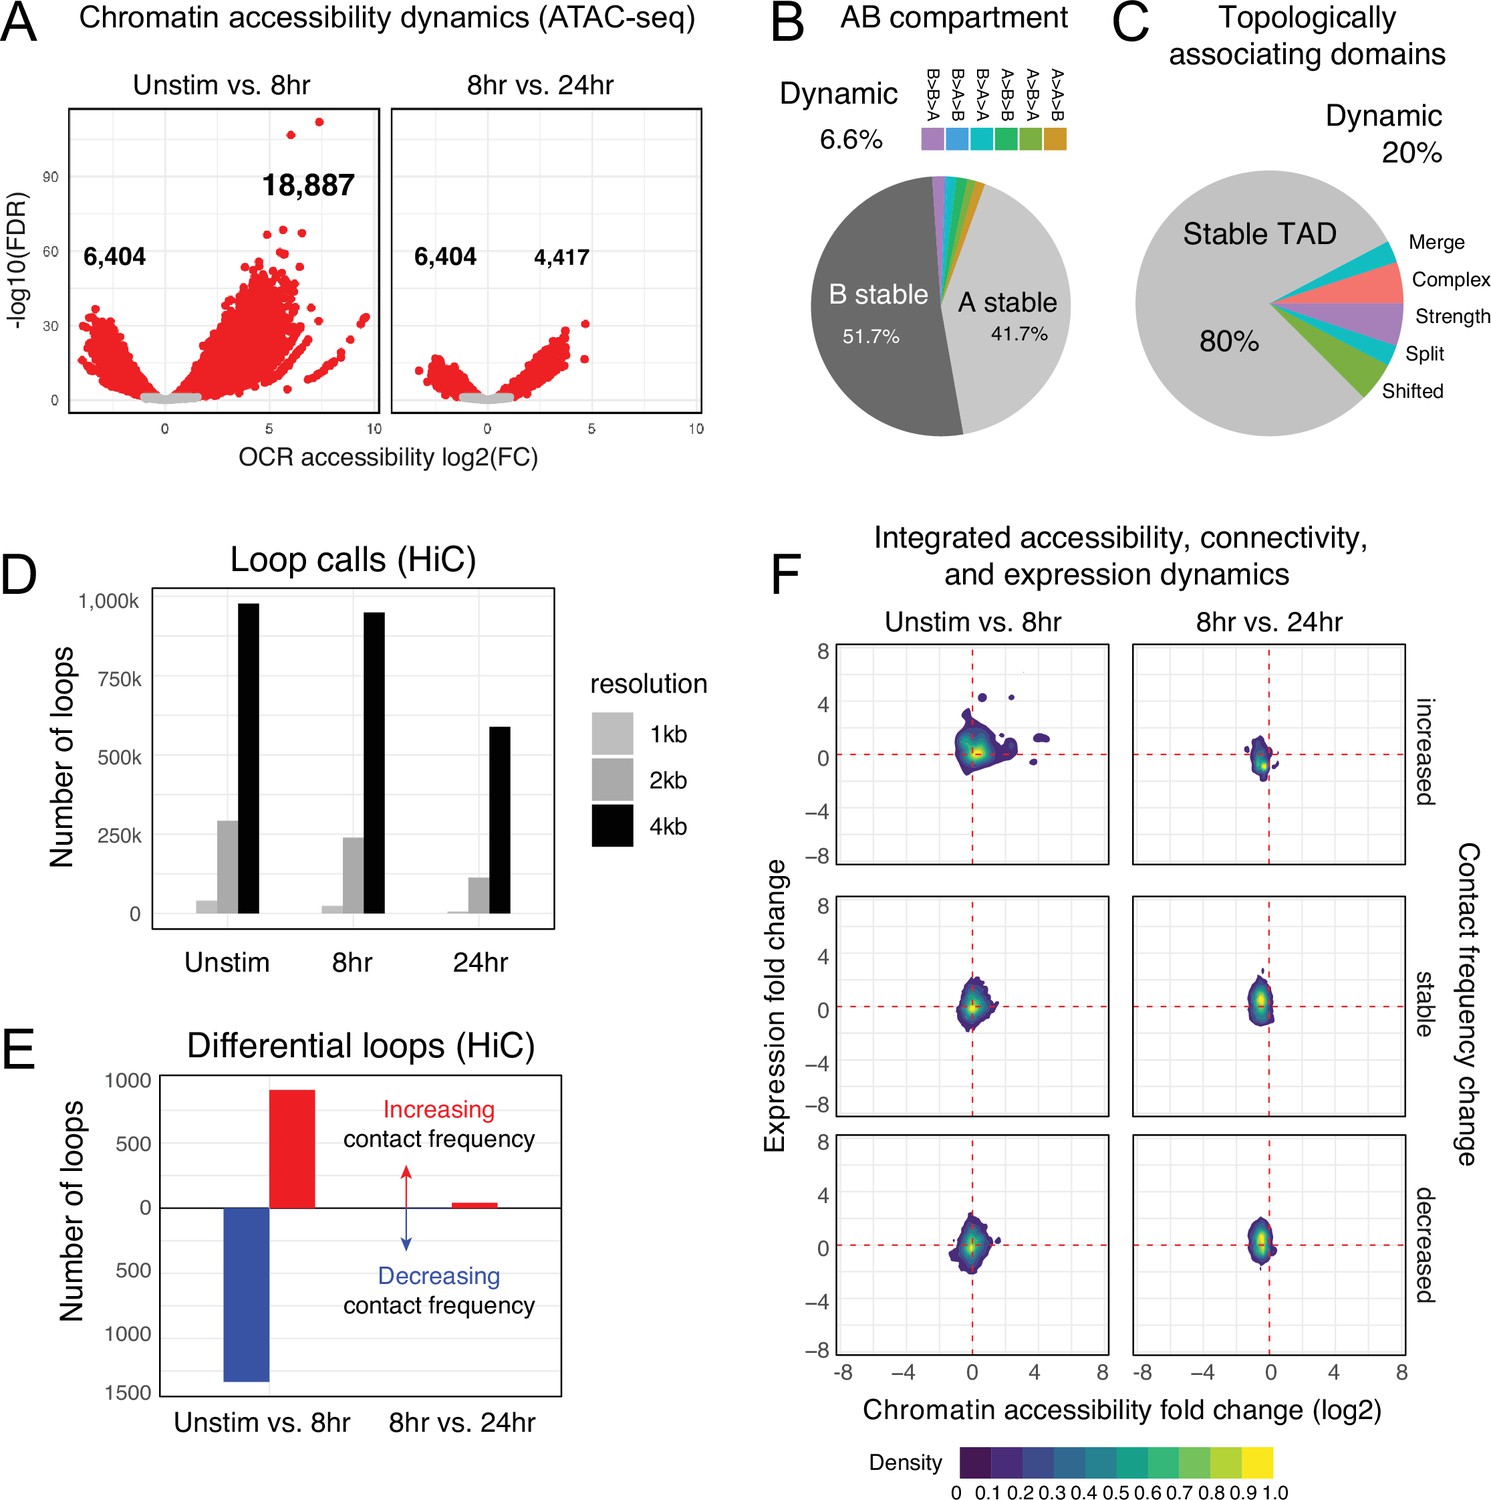
Chromatin accessibility and architecture changes across three stages of T cell activation.
(A) Volcano plots depicting the log2 change in accessibility in all reproducible open chromatin regions (OCR) (present in two of the three replicates) compared to the -log10(FDR), significant points are indicated in red (FDR < 0.05; abs(log2FC) > 1). (B) Genomic regions were classified by membership in A vs B compartments at each timepoint. The pie chart depicts regions with differential A/B compartment assignment in response to activation. (C) Topologically associating domain (TAD) structure was determined at each timepoint, and regions exhibiting a shift, split/merge, change in strength, or more complex rearrangements are depicted in the pie chart. (D) Loop calls identified from HiC data for each timepoint called at three resolutions (1 kb, 2 kb, 4 kb bins). (E) Differential loop calls called across all resolutions. (F) Density plots of cis-regulatory elements (cRE) accessibility and gene expression separated by whether contact frequency increased, decreased, or remained stable from the transition from unstimulated to 8 hr activation and 8 hr to 24 hr activation.
Figure 2—figure supplement 1
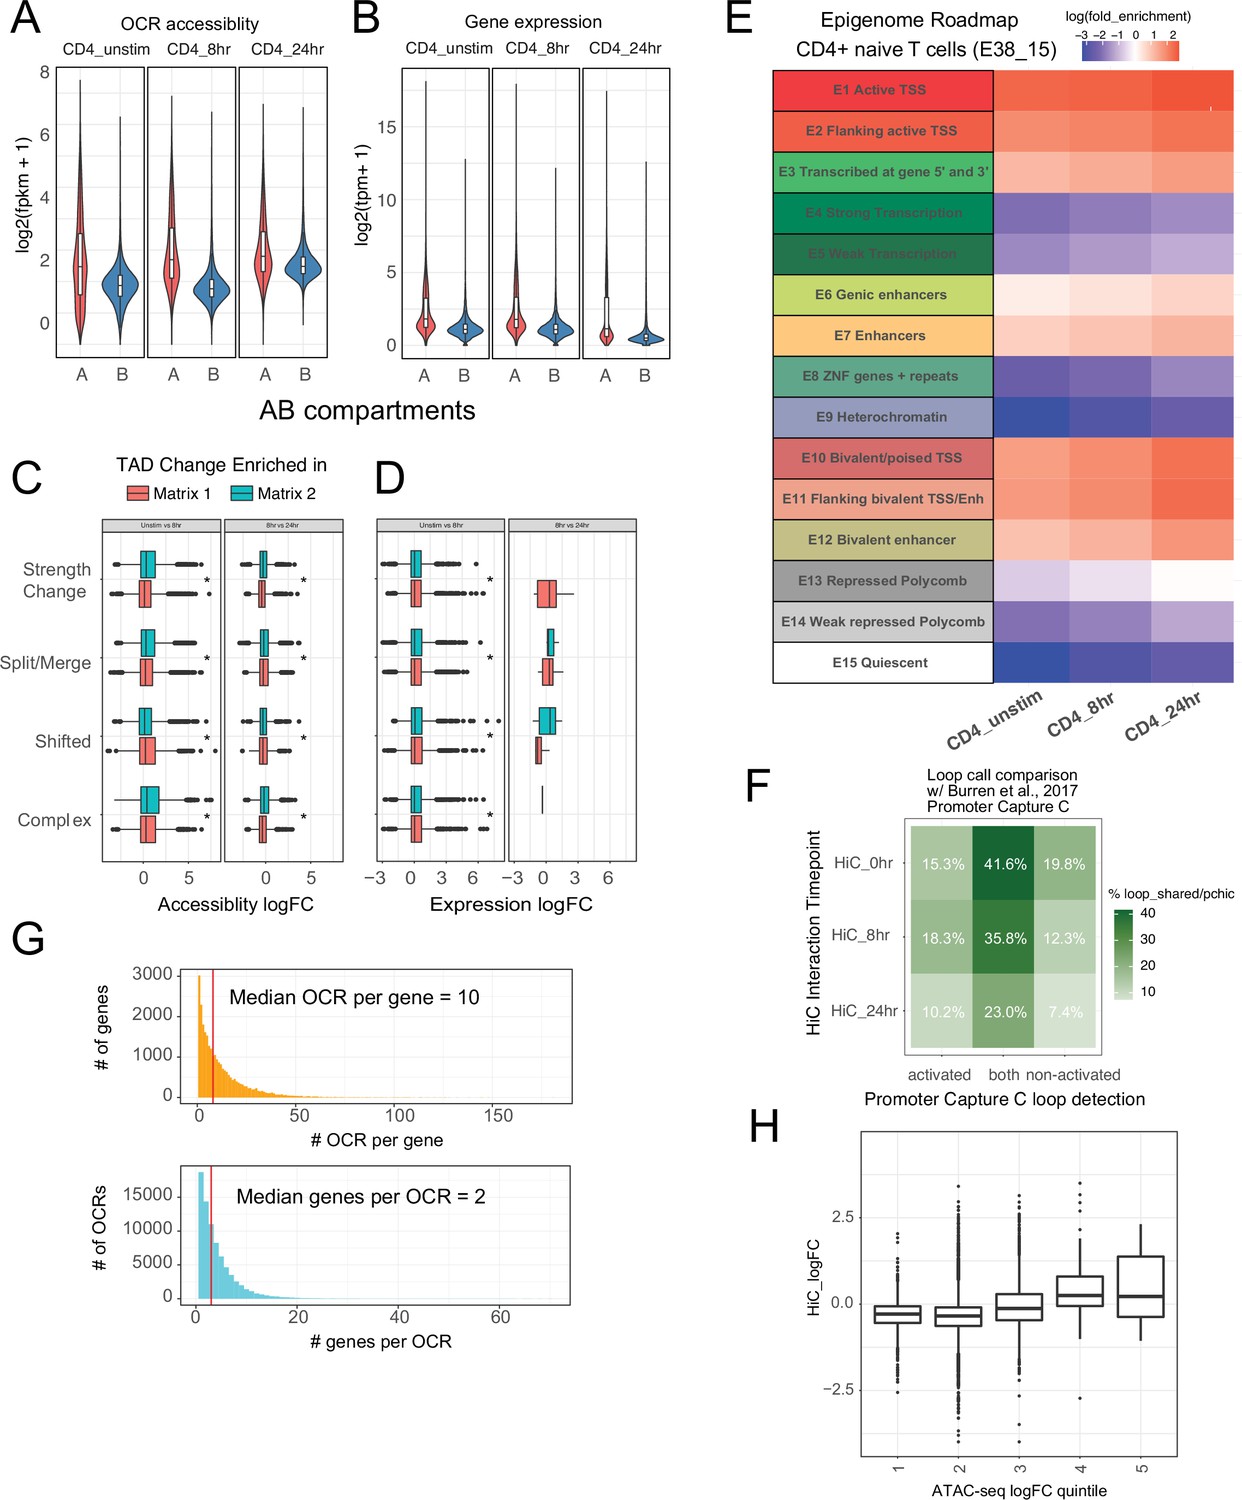
Characterization of CD4+ T cell epigenomic data.
(A) Accessibility of open chromatin region (OCR) and (B) expression of genes located in A vs. B compartments (log2 fkpm). Differential accessibility (C) and expression (D) of cRE-gene pairs in regions exhibiting differential topologically associating domain (TAD) structure. (E) Enrichment of promoter interacting region OCR for annotated regulatory elements in CD4+ T cells from the epigenome roadmap project (E038_15). (F) Overlap of cRE-promoter loops defined in this study to loops defined by Burren et al. in a prior promoter capture Hi-C study. (G) Distribution of OCR contacted per gene (top, median = 8 OCR per gene). Distribution of genes contacted per OCR (bottom, median = 3). (H) Differential promoter–OCR connectivity by HiC as a function of differential OCR accessibility (central bar = median, boxplot edges = 25–75 quantiles, whiskers = 1.5× interquantile range).
Figure 2—figure supplement 2
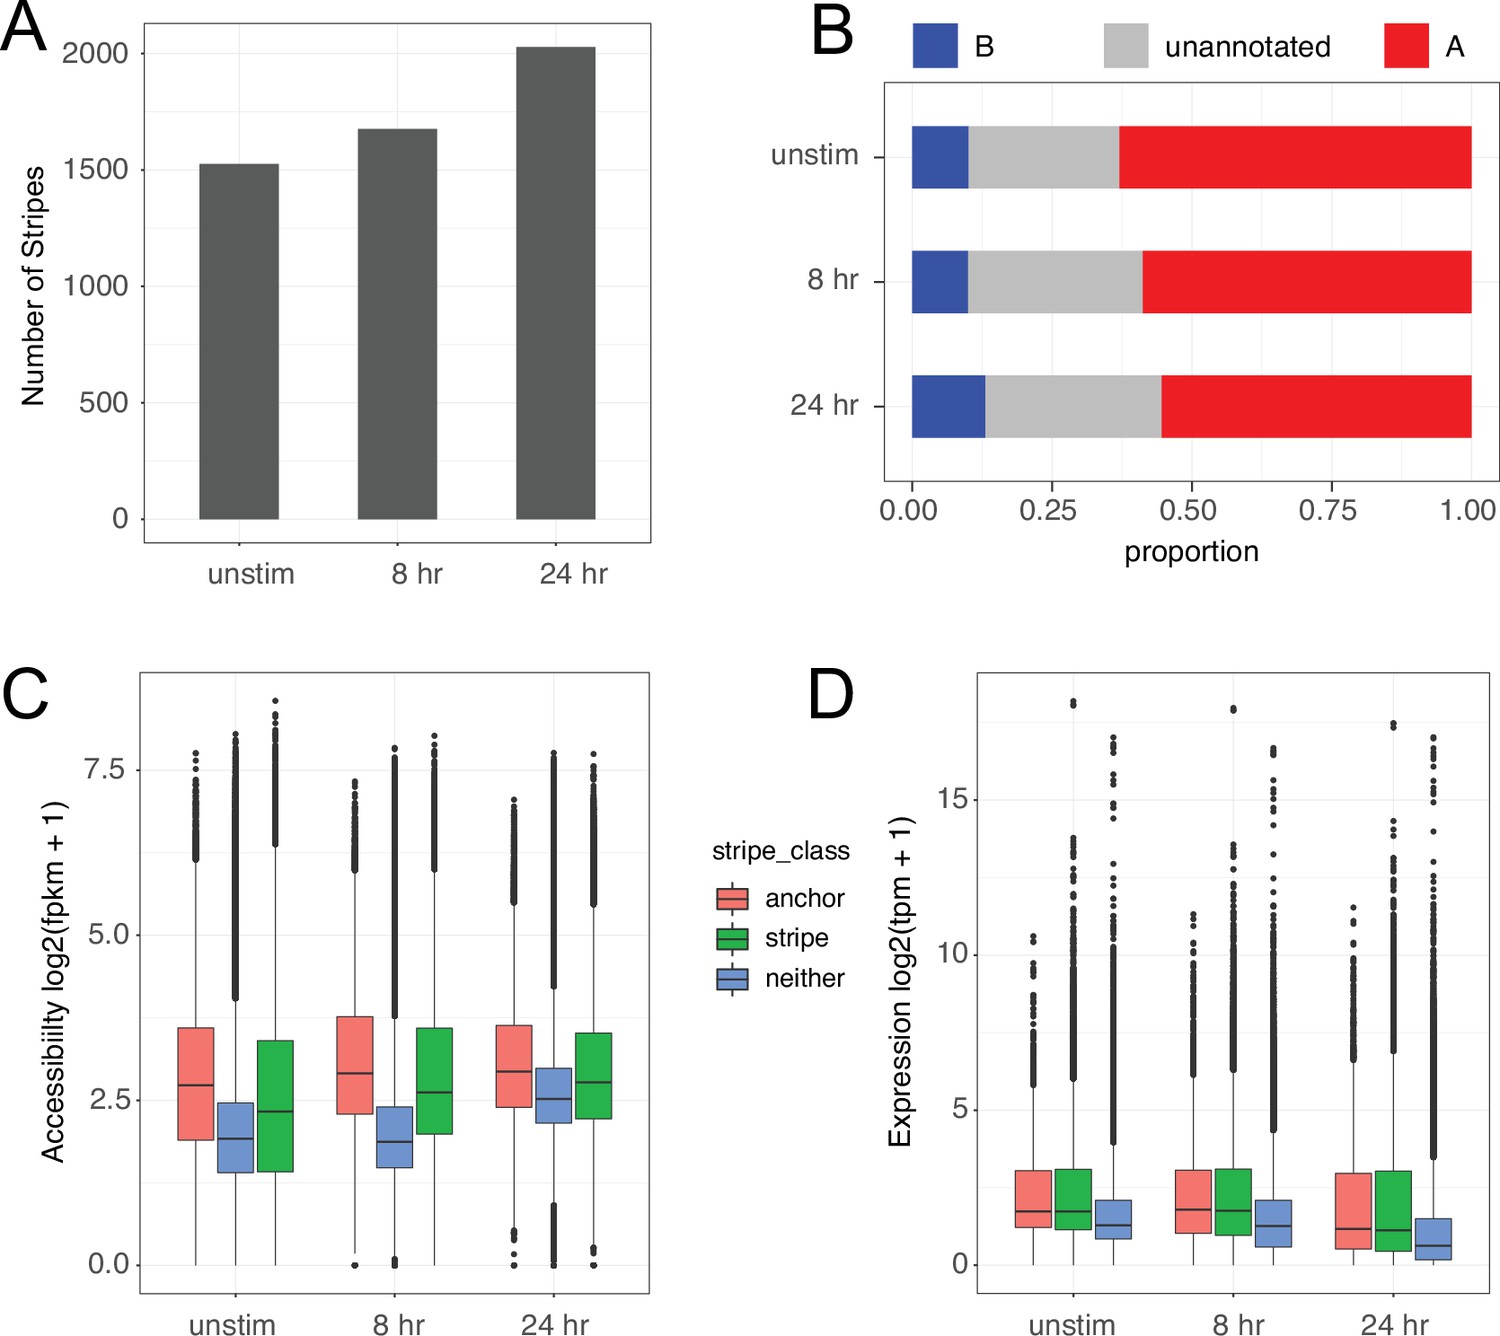
Characterization of chromatin stripes during CD4+ T cell activation.
(A) Stripes called per timepoint. (B) Proportion of SNPs annotated in A vs. B compartments. Accessibility of open chromatin region (OCR) (C) and expression of genes (D) located in anchor (small more interactive region of stripe), stripe excluding the anchor (stripe), or outside stripes.
Figure 2—figure supplement 3
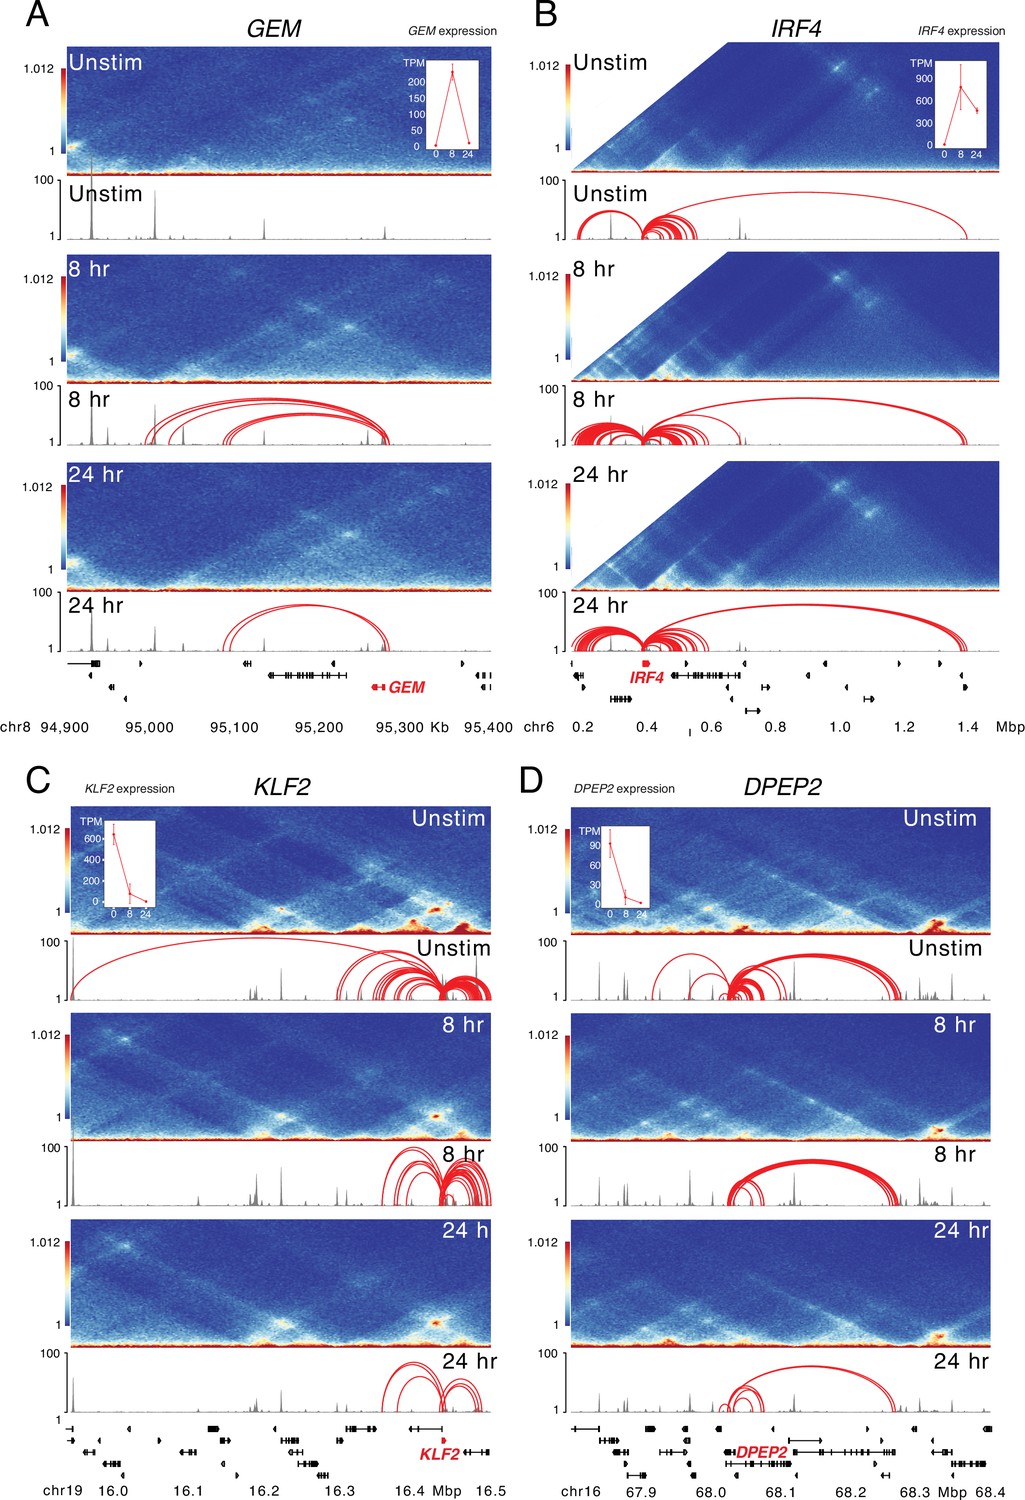
Large-scale epigenetic changes at dynamically expressed genes during CD4+ T cell activation.
HiC contact frequency matrix (heatmap), chromatin accessibility (gray), and loop calls (red) for (A) GEM, (B) IRF4, (C) KLF2, and (D) DPEP2. The IRF4 matrix is truncated at by end of the chromosome annotation, and inset shows the expression (TPM) at each timepoint for each gene.
Figure 3 with 1 supplement
Transcription factors (TF) prediction potential regulators of chromatin status and expression changes.
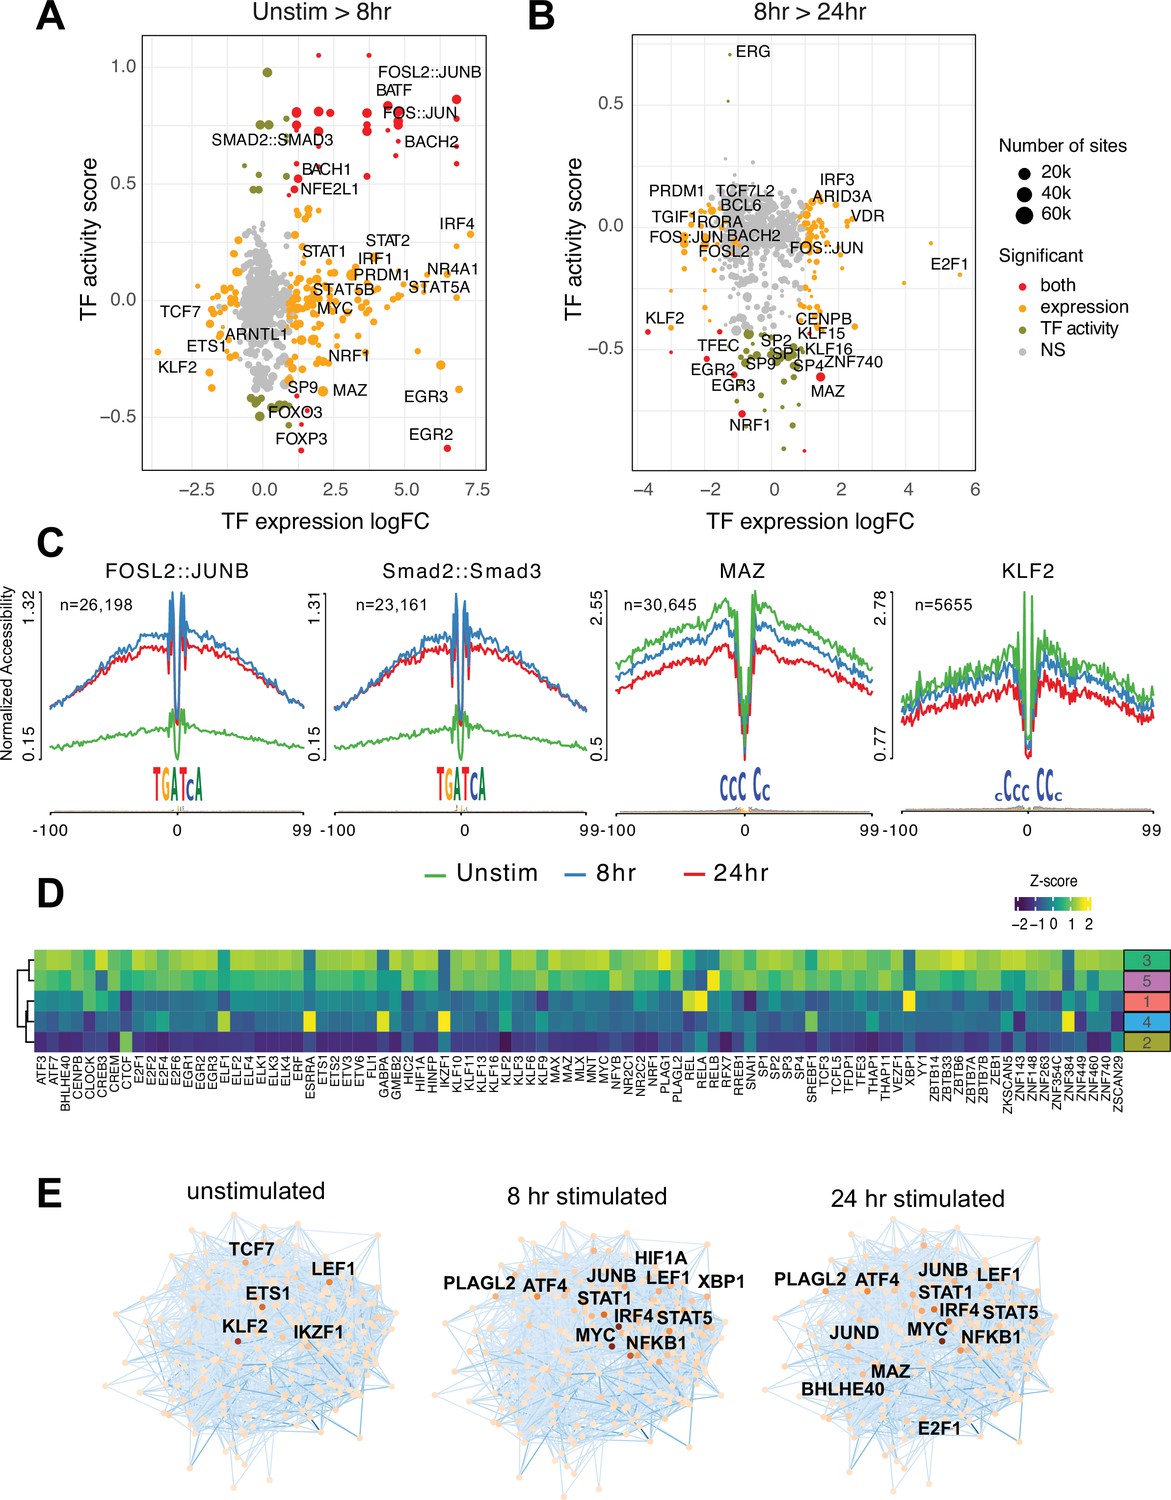
Footprints were annotated to each TF motif by sequence matching to the JASPAR motif database, and the average accessibility of the region surrounding each motif was used as a measure of activity at each timepoint. Scatterplots depict the change in accessibility for each TF motif (activity score) and log2FC of TF gene expression between unstimulated and 8 hr activation (A) or 8 hr and 24 hr activation (B). TF were classified as differentially expressed (orange), differentially active (brown), both (red), or neither (gray). Dot size indicates the number of predicted footprints occupied by each motif. (C) Average accessibility (normalized by depth and motif number) in a 200 bp window surrounding motif footprints for FOSL2::JUNB, Smad2::Smad3, MAZ, and KLF2 from three timepoints (unstim: green; 8 hr: blue; 24 hr: red). (D) Z-score of TF motif enrichment for cis-regulatory elements (cRE) connected to the five clusters compared to all open chromatin regions (OCR). Lighter color indicates higher specificity of enrichment for that TF cluster. (E) Connections between different TFs based on physical interactions and predicted regulation-based co-expression determined using GENIE3 for the three timepoints. Node color indicates expression (TPM; darker = higher expression, lighter = lower expression), edge color reflects confidence in the interaction called by GENIE3 (darker higher confidence).
Figure 3—figure supplement 1
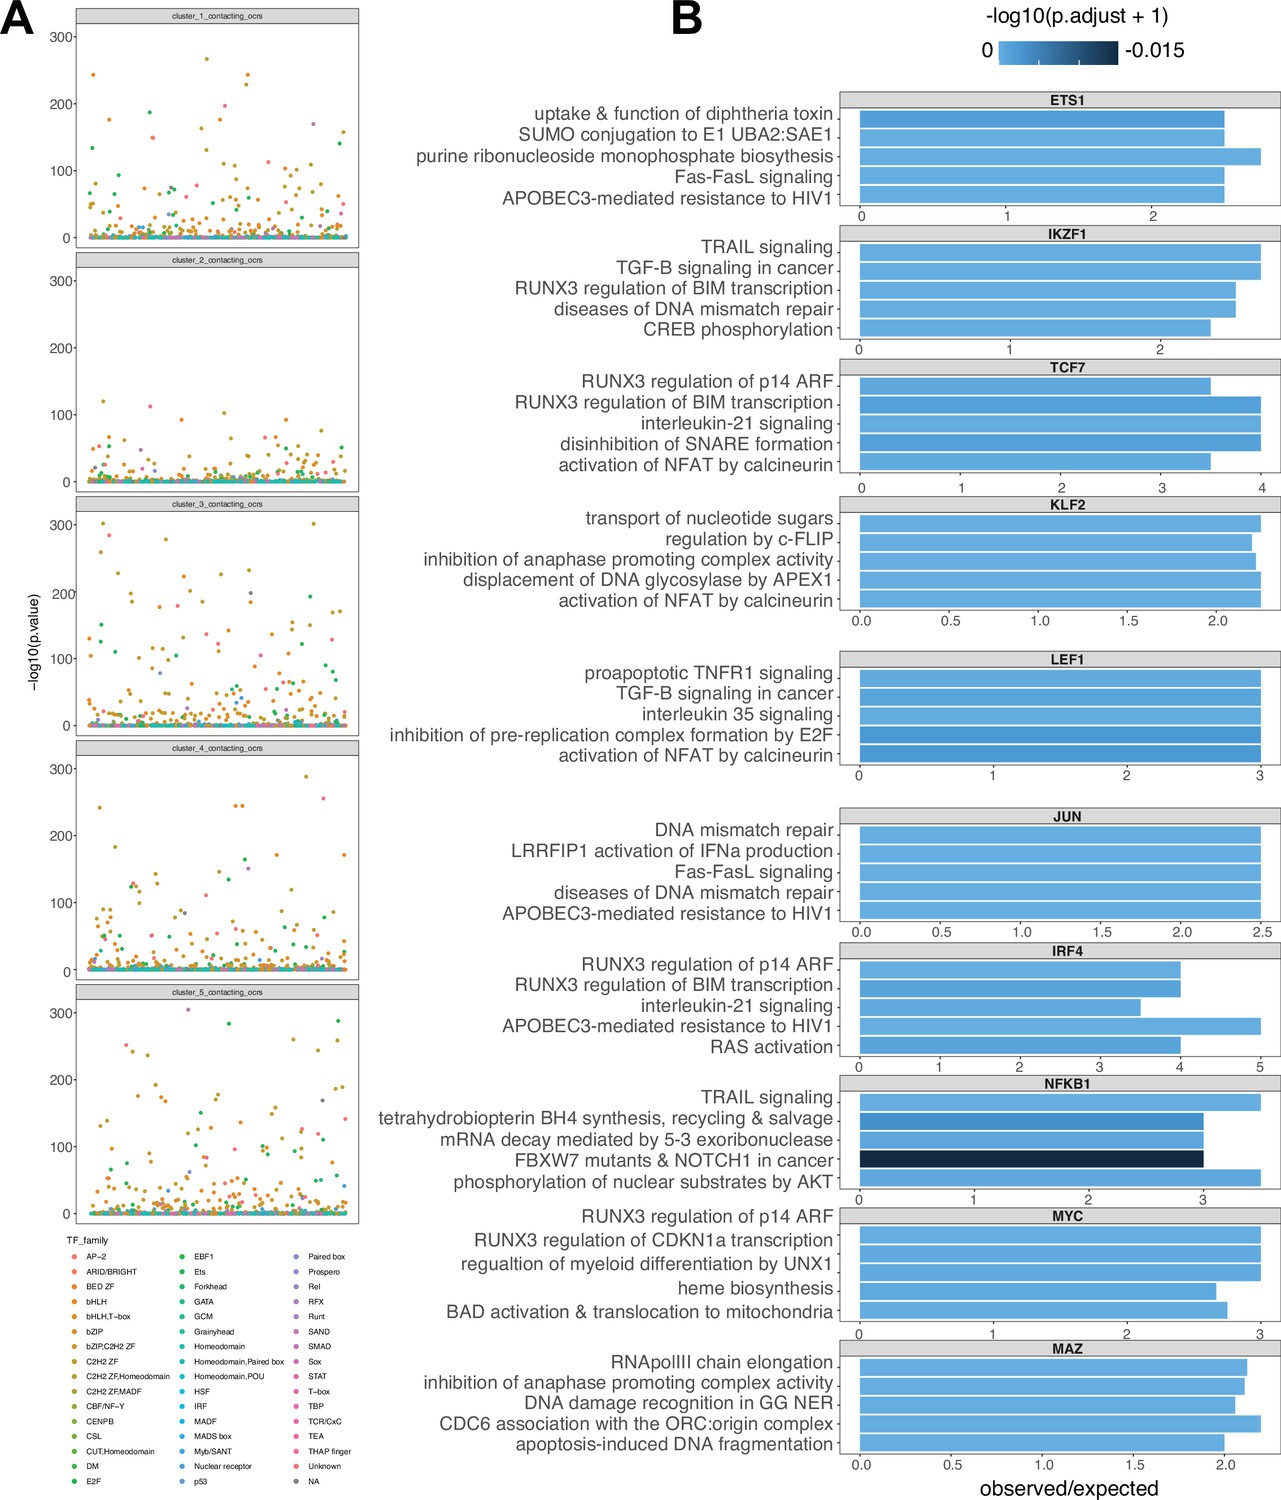
Enrichment of transcription family members and gene regulatory network construction.
(A) -log10(P) enrichment of transcription factors (TF) annotated by family for each expression cluster. (B) Top five pathways enriched for a subset of TF-regulated gene expression.
Figure 4
Variant-to-gene mapping of autoimmune-associated loci implicates genetic variants in the control of T cell activation.
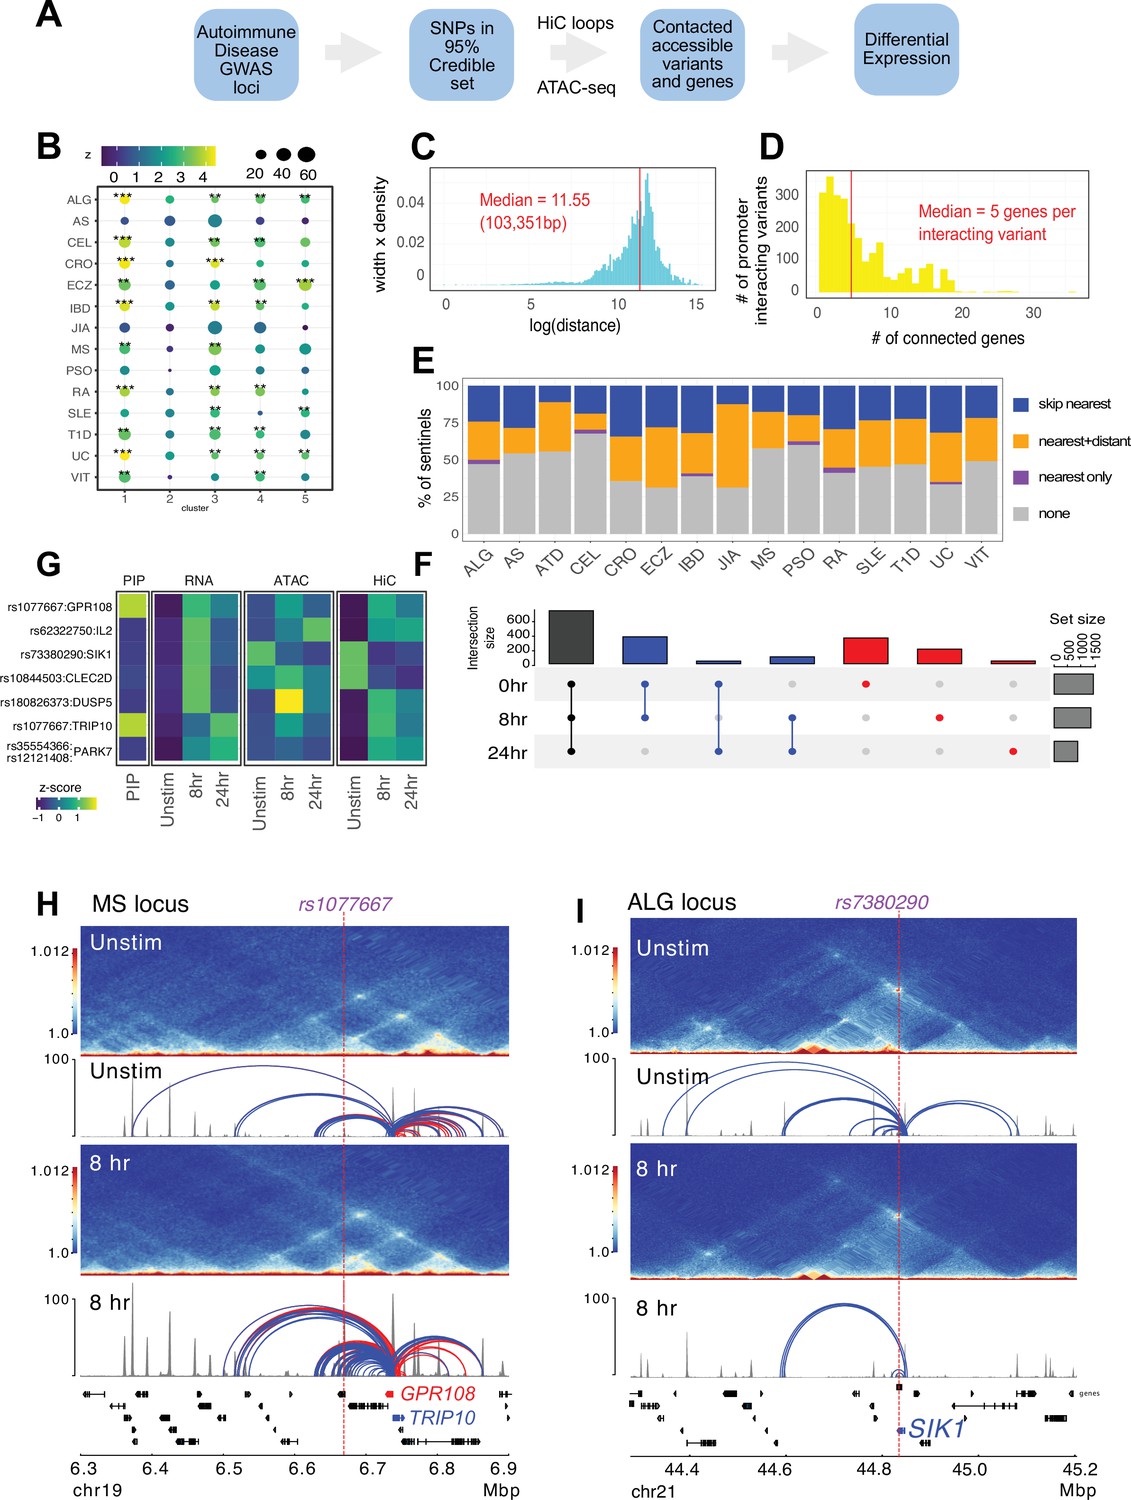
(A) Identification of genes in contact with open chromatin regions (OCR) harboring autoimmune-associated SNPs. Sentinel SNPs from 15 autoimmune genome-wide association studies (GWAS) (Supplementary file 11) were used to identify the 95% credible set of proxy SNPs for each lead SNP. SNP locations were integrated with ATAC-seq and HiC data to identify the 95% credible set of accessible SNPs in physical contact with a gene promoter. Genes are further refined based on expression dynamics over the time course of T cell activation. (B) Partitioned LD score regression for autoimmune GWAS using the OCR in contact with the genes in the five clusters defined by RNA-seq. Circle size = enrichment, color = significance, **FDR < 0.01, ***FDR < 0.001. (C) Log distribution of the 1D distance between each proxy SNP and its interacting gene based on 3D chromatin conformation (median = 103 kbp). (D) Distribution of the number of genes contacted by each accessible variant (median = 5). (E) Fraction of open disease-associated variants that interact with no gene promoters (gray), only with the nearest gene promoter (purple), with the nearest gene and a distant gene(s) (orange), and with only a distant gene(s) (blue). (F) Number of genes identified by variant-to-gene mapping at each timepoint. Black = shared in all stages, blue = shared in two stages, red = specific to one stage. (G) Set of implicated proxy-genes pairs that are both differentially expressed, display differential accessibility, and chromatin contact across T cell activation. (H) Example MS variant rs1077667 (p=1.0) exhibits increased accessibility and contact with the promoters of the GPR108 and TRIP10 at 8 hr post activation, which are increased in expression at this timepoint. (I) Example allergy variant rs7380290 interacts with the SIK1 gene that is upregulated after activation.
Figure 5
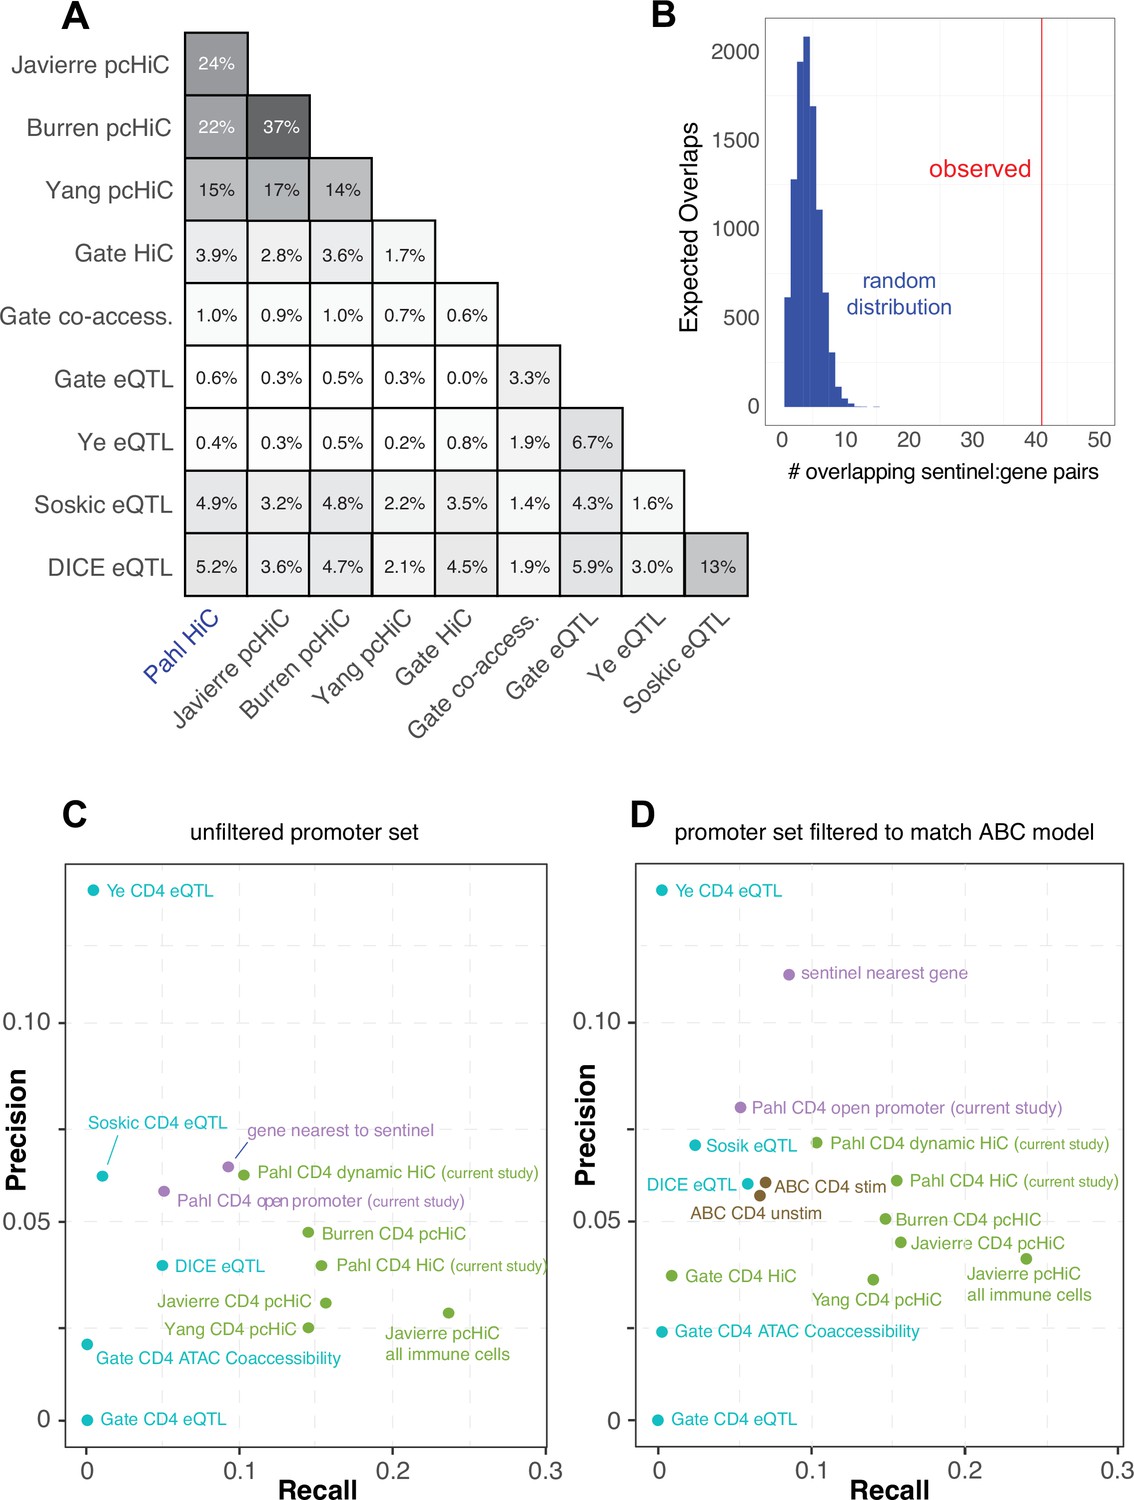
Comparative predictive power of orthogonal variant-to-gene (V2G) approaches.
(A) Percent overlap in predicted genes among chromatin-based and expression quantitative trait mapping (eQTL)-based V2G approaches. (B) Physical variant-gene associations (HiC) are enriched for statistical variant-gene associations (eQTL) in activated CD4+ T cells. The histogram depicts the null distribution of shared variant-gene pairs expected at random (~5) while the red line indicates the observed number of variant-gene pairs (41) shared with the 127 eQTL identified by Soskic et al. in a similar CD4+ T cell activation system. (C) Expression of the shared genes. (D) Precision-recall analysis of V2G gene predictions against the set of monogenic human inborn errors in immunity.
Figure 6 with 1 supplement
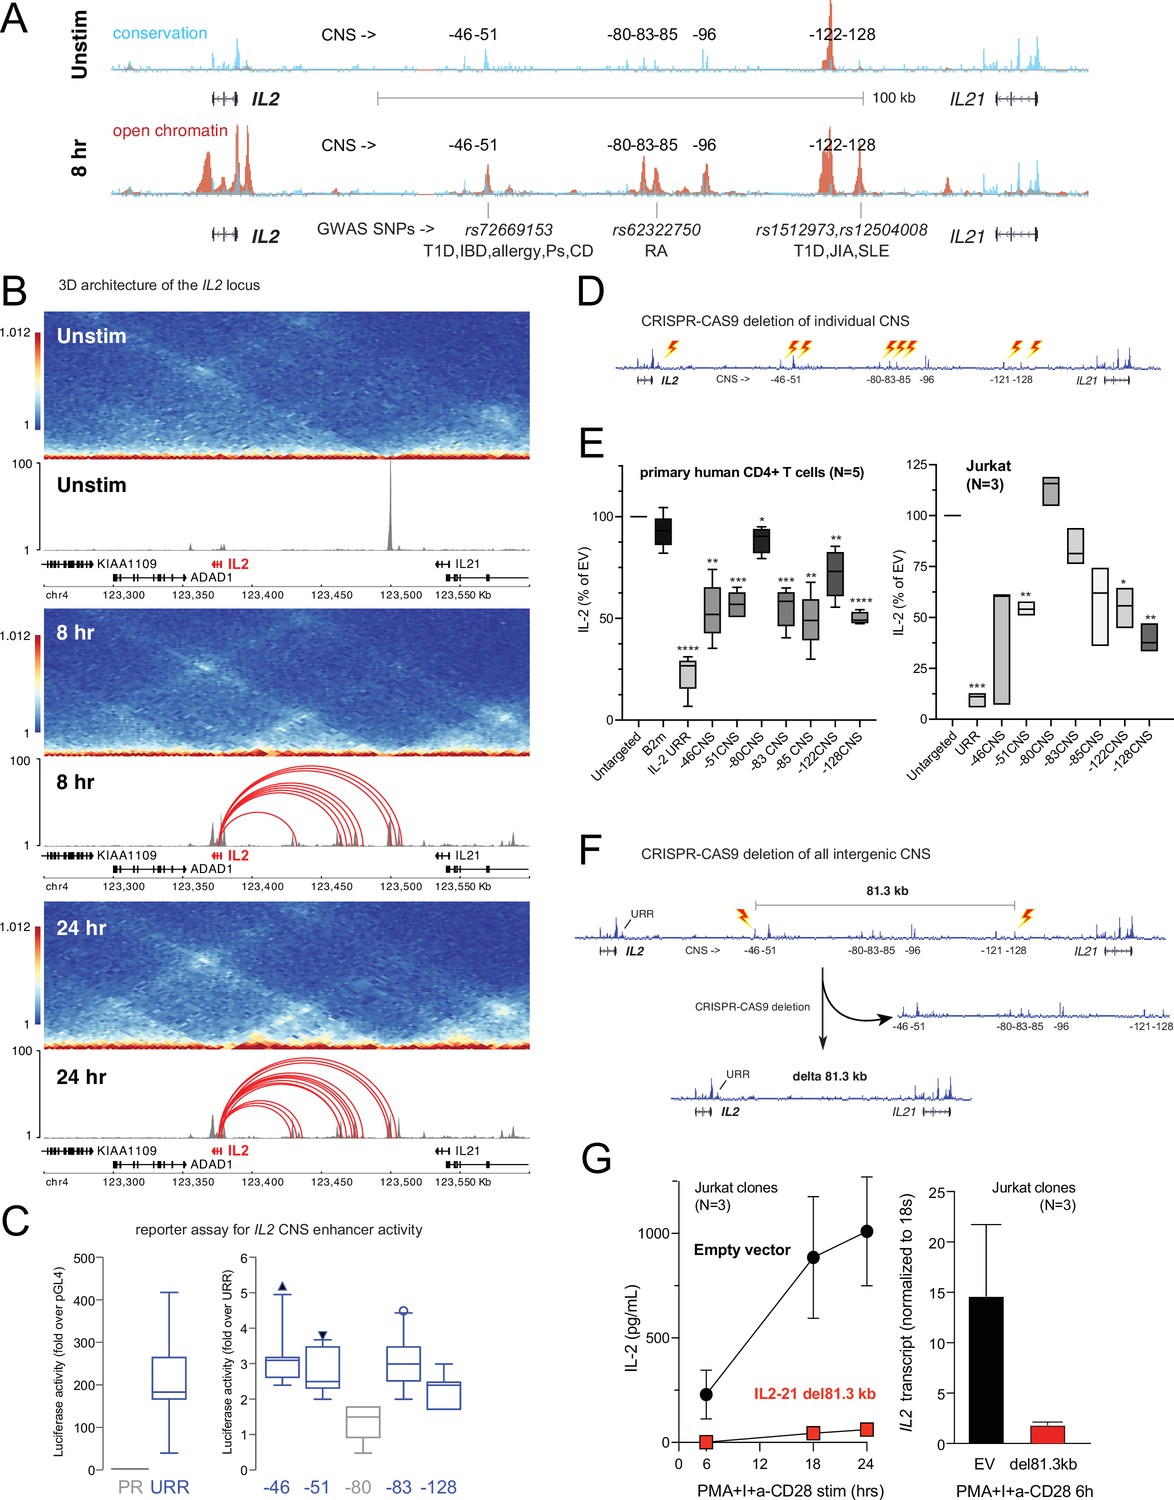
Functional validation of autoimmune variant-to-gene (V2G)-implicated cis-regulatory elements (cRE) at the IL2 locus.
(A) The combination of evolutionary conservation (blue), open chromatin (red), and autoimmune disease-associated SNPs at the IL2 locus identify putative cRE in quiescent vs. 8 hr activated naïve CD4+ T cells. (B) Activation-dependent topologically associating domains (TAD)/sub-TAD structure (heatmaps), chromatin remodeling (gray), and promoter–open chromatin region (OCR) interactions (red) at the IL2 locus. (C) Recombinant reporter assay showing transcriptional activity of the IL2 upstream regulatory region (URR) (+35 to –500 from the TSS) in activated primary CD4+ T cells (N = 7 donors) compared to a basal promoter (pGL4, left panel). The right panel depicts transcriptional activity of the CNS regions indicated in (A) cloned upstream of the URR. All regions except the –80 CNS show statistically significant activity relative to the URR alone (N = 7, p<0.05, line = median, box = 95/5% range). (D) Scheme of CRISPR/CAS9-based deletion of individual IL2 CNS using flanking gRNAs. (E) Activation-induced secretion of IL-2 protein by CRISPR-targeted primary CD4+ T cells (N = 5 donors, left panel) or Jurkat cells (N = 3 replicates, right panel) relative to untargeted control (CAS9, no gRNA) cells (****p<0.0001, ***p<0.001, **p<0.01, *p<0.05, line = median, box = 95/5% range). In primary cells, B2M gRNAs served as an irrelevant targeted control. (F) Scheme of CRISPR/CAS9-based deletion of the 81.3 kb region containing all distal IL2 cRE using flanking gRNAs in Jurkat cells. (G) Activation-induced IL-2 protein (left panel) and mRNA (right panel) by control (black) vs. 81.3 kb deleted (red) Jurkat cells (N = 3 separate clones).
Figure 6—figure supplement 1
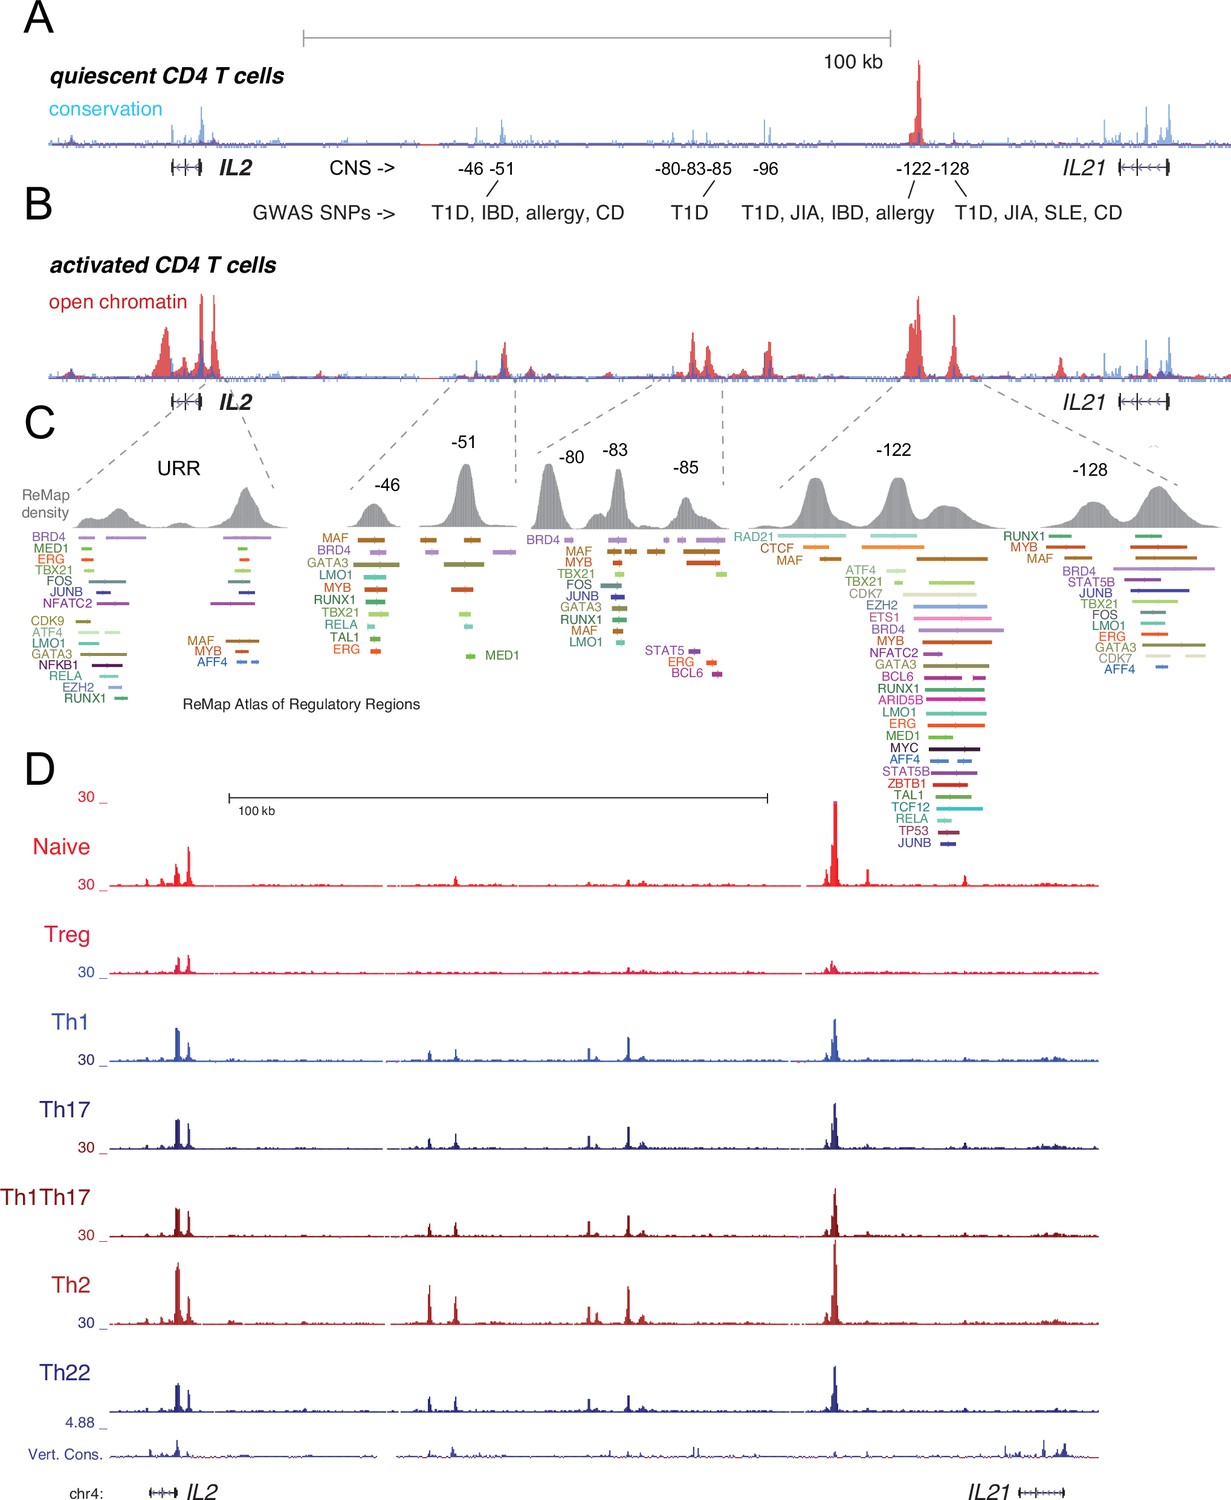
Transcription factor (TF) occupancy and stability of distal IL2 cis-regulatory elements (cRE) in CD4+ T cell subsets.
Evolutionary conservation (blue), open chromatin (red), and autoimmune disease-associated SNPs at the IL2 locus in quiescent (A) and 8 hr activated (B) naïve CD4+ T cells. (C) Curated TF occupancy at the IL2 upstream regulatory region (URR) and distal cRE from the ReMap atlas of regulatory regions. (D) ATAC-seq data depicting the open chromatin landscape at the IL2-IL21 locus in CD4+ T cell subsets purified nd assayed directly ex vivo from human peripheral blood.
Figure 7
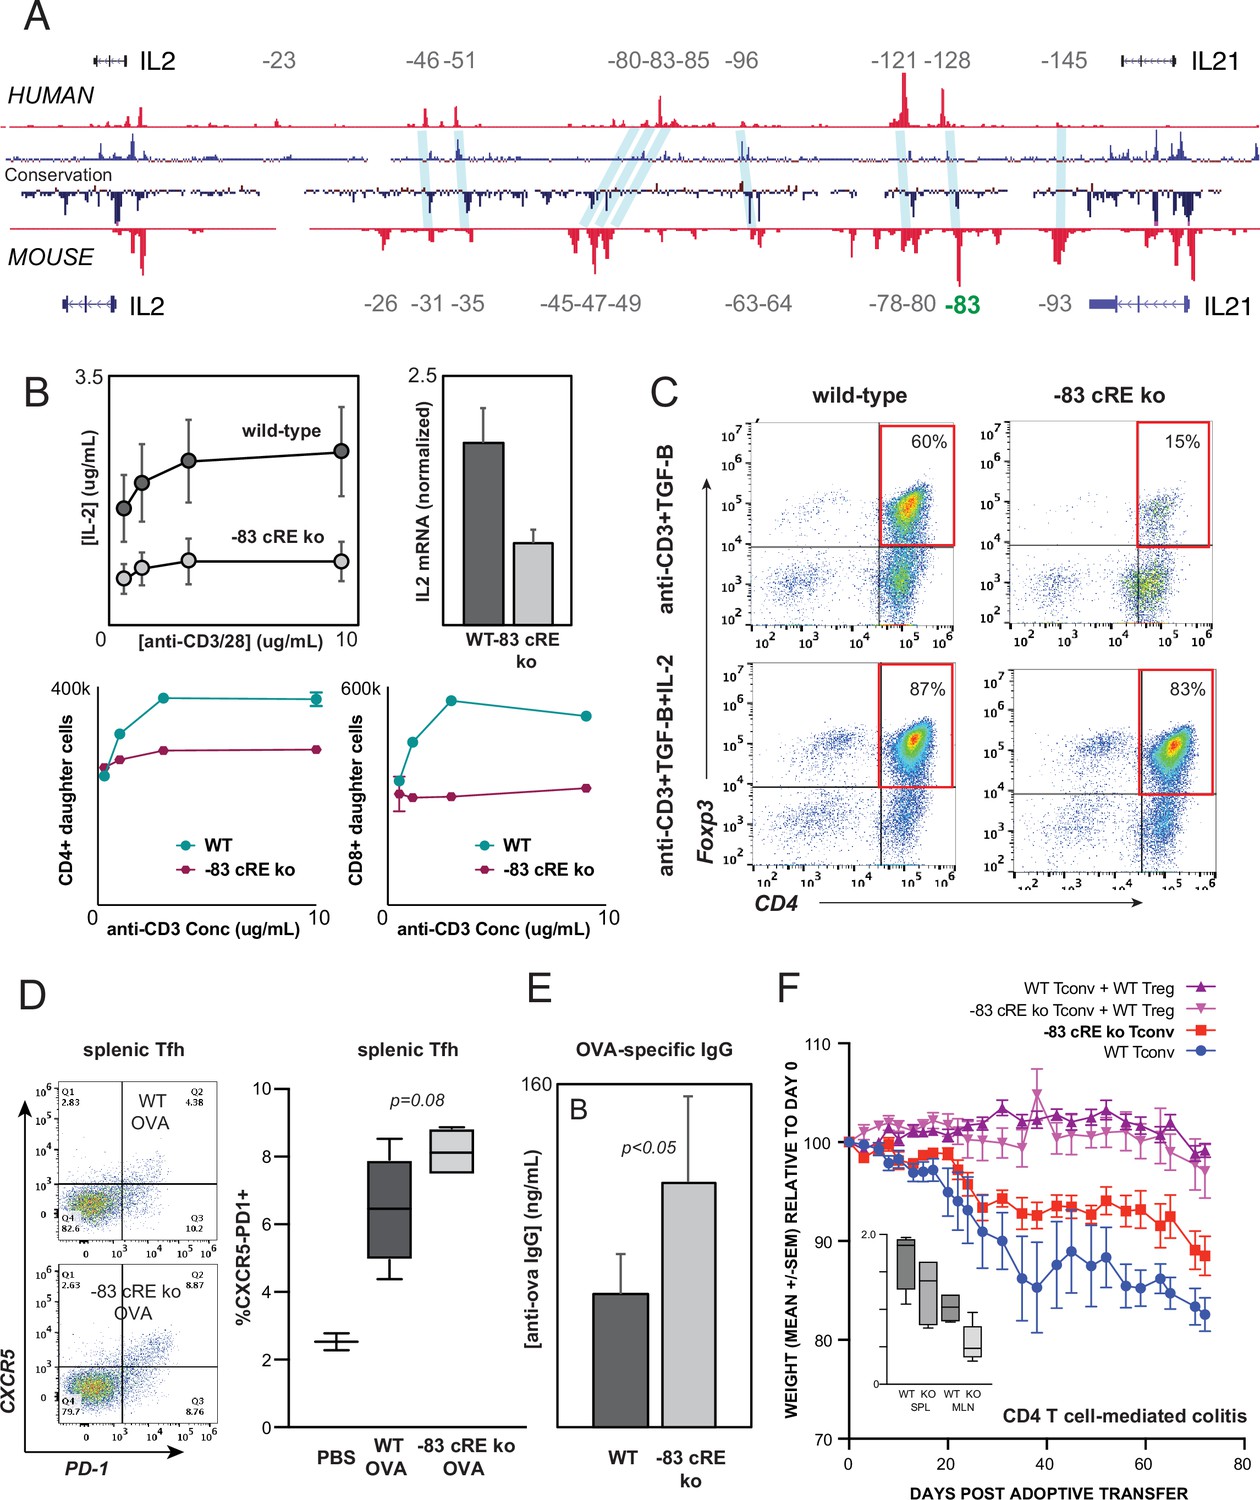
Distal IL2 enhancers are evolutionarily conserved and impact in vivo T cell-mediated immunity in mice.
(A) Map of the human and mouse IL2 locus depicting mammalian conservation (dark blue), ATAC-seq from activated human and mouse CD4+ T cells (red), and orthologous non-coding sequences conserved between mouse and human (light blue). (B) IL-2 protein secretion (top-left panel) and Il2 mRNA expression (top-right panel) by CD4+ T cells from wild-type or Il2-83 cis-regulatory elements (cRE) ko mice in response to stimulation with plate-bound anti-CD3 and anti-CD28 Ab in vitro. Bottom panels show soluble anti-CD3-induced in vitro clonal expansion of wild-type or Il2-83 cRE ko CD4+ (left) and CD8+ (right) T cells measured by dye dilution (Wells et al., 1997). (C) Foxp3 expression by murine CD4+CD25- Tconv stimulated with anti-CD3 Ab and TGF-β in the absence (top panels) vs. presence (bottom panels) of exogenous IL-2. Wild-type or Il2-83 cRE ko mice (N = 6) were immunized intraperitoneally with chicken ovalbumin in incomplete Freund’s adjuvant. The frequency of CD4+PD1+CXCR5hi follicular helper T cells in the spleens of three animals was measured by flow cytometry at day 5 post-immunization (D), and levels of ovalbumin-specific IgG in the serum of three animals were measured at day 10 post-immunization (E). (F) In vivo inflammatory bowel disease (IBD) model. CD4+CD25- Tconv from wild-type (pink, red) or Il2-83 cRE ko (purple, blue) mice were transferred alone (purple, pink) or together with wild-type CD4+CD25+Treg (red, blue) into RAG1-ko mice (N = 5 per group). Animal weight was monitored for 40 days, and the number (in millions) of activated CD4+Tconv in the spleens and mesenteric lymph nodes was measured by flow cytometry (inset). Statistical significance (*p<0.05) was measured by ANOVA or t-test.
Figure 8 with 2 supplements
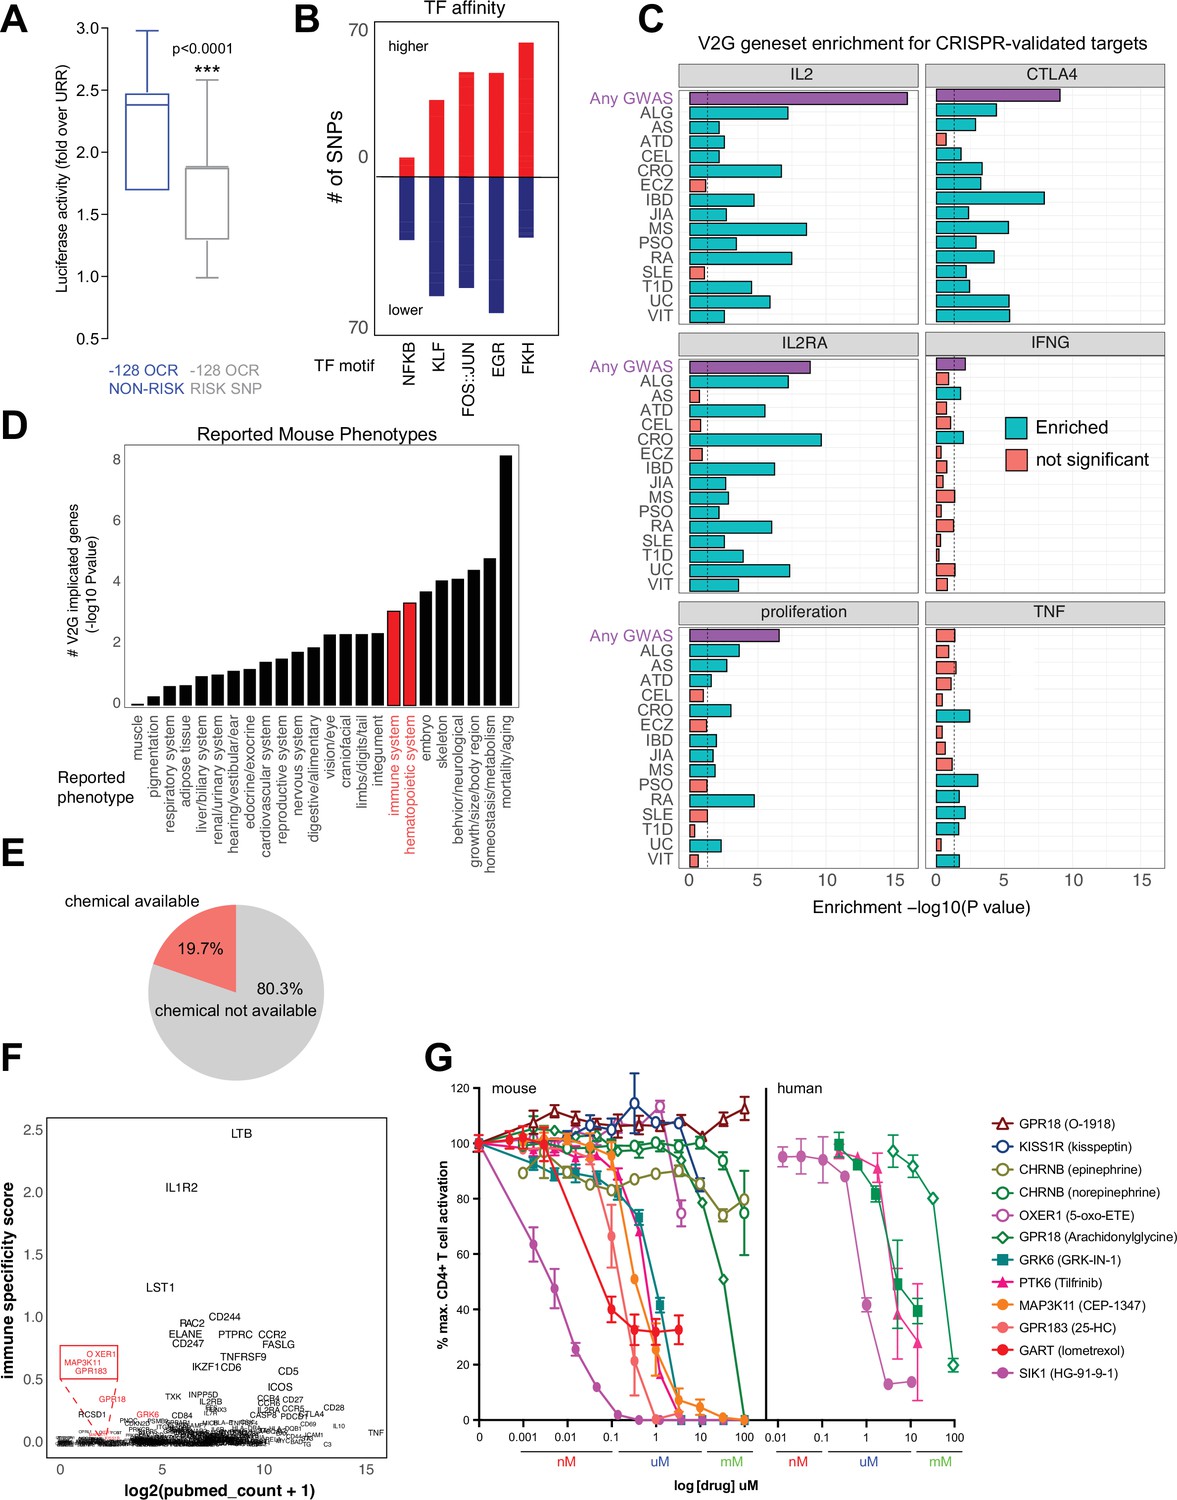
Functional validation of autoimmune variant-to-gene (V2G)-implicated genes.
(A) Recombinant reporter assay in primary activated CD4+ T cells (N = 7 donors) showing transcriptional activity of the reference vs. risk alleles of the IL2 –128 cis-regulatory elements (cRE) relative to the upstream regulatory region (URR) alone (p<0.0001). (B) Prominent transcription factor (TF) motifs predicted to be disrupted (blue) or stabilized (red) by promoter-connected autoimmune SNPs. (C) 3D chromatin-based V2G genes are enriched for CRISPR-implicated genes that regulate CD4+ T cell activation. Observed enrichment of genes regulating multiple aspects of CD4+ T cell activation (IL-2, IL-2 receptor, CTLA-4, IFNg, TNFa or proliferation) from CRISPR screens by Freimer, Schmidt, and Shifrut among sets of 3D chromatin-implicated genes among individual diseases (green, FDR < 0.05) or all diseases (purple, FDR < 0.05). (D) Enrichment for 3D chromatin-based autoimmune V2G genes among genes with germline knock-out mouse immune (red) and other (black) phenotypes (adjP < 0.05, International Mouse Phenotype Consortium [IMPC] database). (E) Autoimmune V2G-implicated genes with at least one pharmacological modulator (rDGIdb). (F) Comparison of the number of manuscripts retrieved from PubMed related to autoimmune disease for each V2G gene with pharmaceutical agents available (x-axis) with an immune-specific expression score computed using the sum GTEX median expression values (v8) for whole blood or spleen divided by other tissues (y-axis). Genes highlighted in red were selected for functional validation in (G). (G) Dose-dependent impact of the indicated pharmacological agents targeting the V2G-implicated genes KISS1R, CHRNB, OXER1, GPR18, GRK6, PTK6, MAP3K11, GPR183, GART, and SIK1 on proliferation of anti-CD3/28 activated murine (left panel) or human (right panel) CD4+ T cells in vitro (N = 4).
Figure 8—figure supplement 1
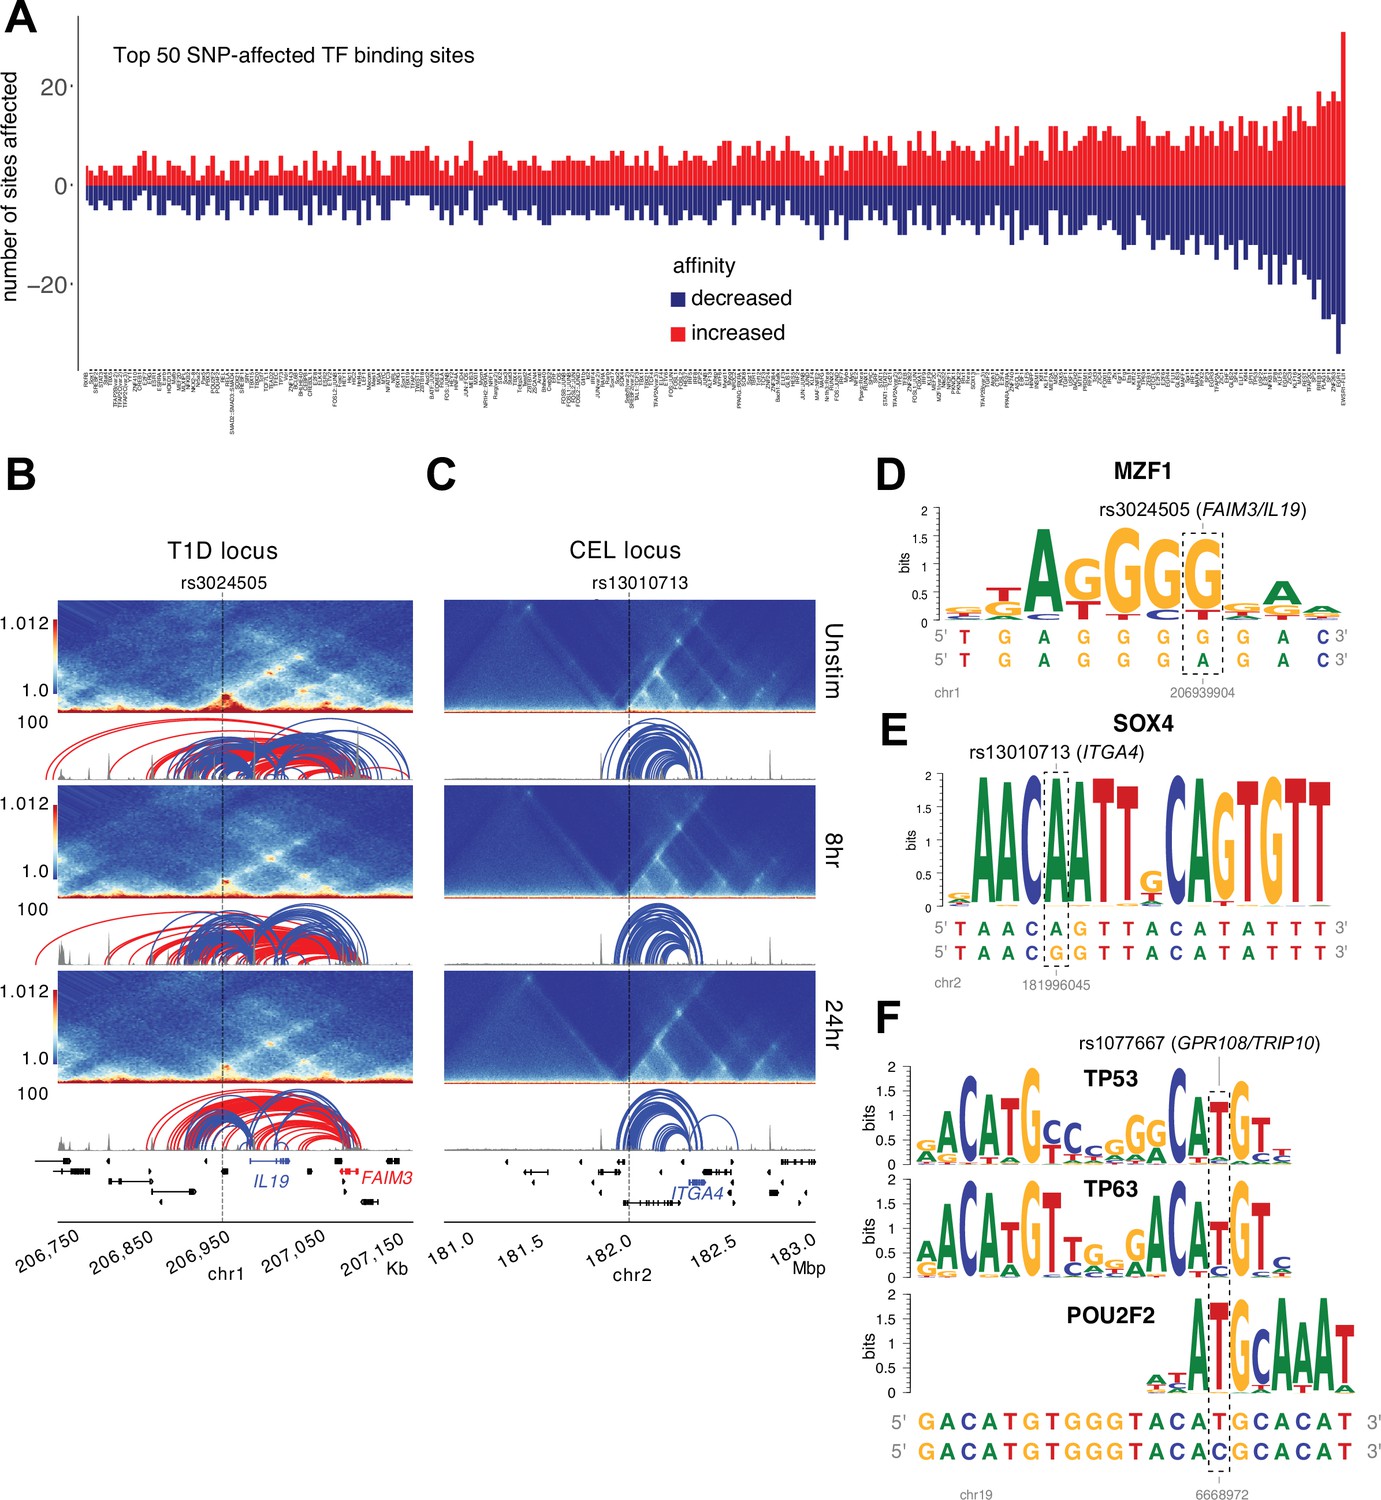
Predicted impact of autoimmune disease-associated genetic variation at variant-to-gene (V2G)-implicated loci.
(A) Top 50 transcription factor (TF) motifs impacted by autoimmune SNPs (see Supplementary file 15). HiC contact frequency matrix (heatmap), chromatin accessibility (gray), and loop calls (blue-IL19/ITGA4, red-FAIM3) at the T1D-rs3024505 locus (B) and the celiac- rs13010713 locus (C). Dashed box indicates the SNP affected by allelic variation. Genetic variation at rs3024505 is predicted to disrupt a MZF1 motif (D), and variation at rs13010713 is predicted to disrupt a SOX4 binding motif (E). (F) Variation at MS SNP rs1077667 is predicted to disrupt TP53, TP63, and POU2F2 (OCT2) binding sites.
Figure 8—figure supplement 2
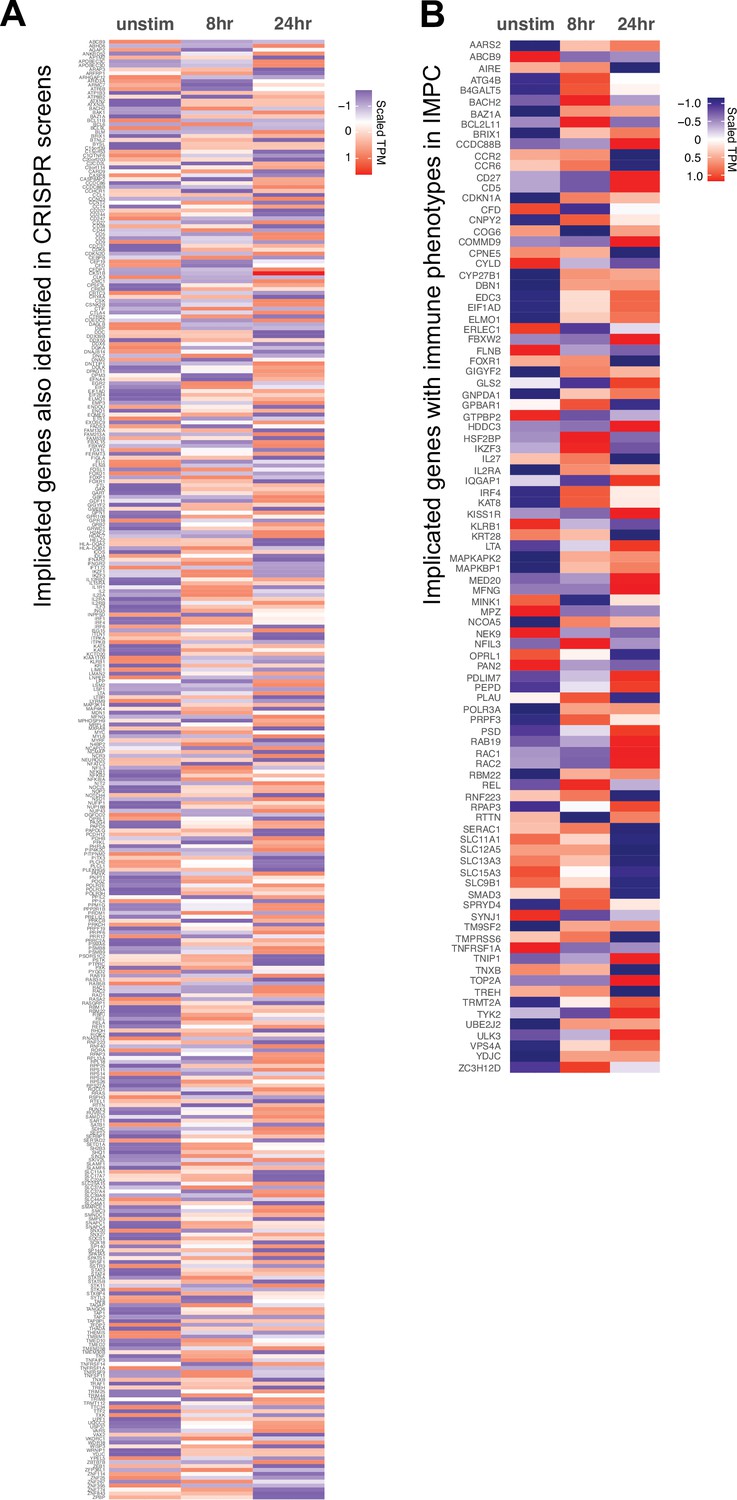
Orthogonal validation of 3D chromatin-based variant-to-gene (V2G) genes.
Expression (scaled TPM) of genes implicated by chromatin contacts in (A) prior CRISPRi/a screens and (B) genes with known immune phenotypes in the international mouse phenotyping consortium. Red = increased, blue = decreased.
Additional files
-
Supplementary file 1
Expression and clustering of differentially expressed genes.
- https://cdn.elifesciences.org/articles/96852/elife-96852-supp1-v1.xlsx
-
Supplementary file 2
Pathway enrichment of differentially expressed RNA-seq genes.
- https://cdn.elifesciences.org/articles/96852/elife-96852-supp2-v1.xlsx
-
Supplementary file 3
Pathway enrichment of differentially expressed RNA-seq genes by cluster.
- https://cdn.elifesciences.org/articles/96852/elife-96852-supp3-v1.xlsx
-
Supplementary file 4
Accessible chromatin regions.
- https://cdn.elifesciences.org/articles/96852/elife-96852-supp4-v1.xlsx
-
Supplementary file 5
Differential accessible open chromatin regions.
- https://cdn.elifesciences.org/articles/96852/elife-96852-supp5-v1.xlsx
-
Supplementary file 6
A/B compartment calls.
- https://cdn.elifesciences.org/articles/96852/elife-96852-supp6-v1.xlsx
-
Supplementary file 7
Differential TAD boundaries.
- https://cdn.elifesciences.org/articles/96852/elife-96852-supp7-v1.xlsx
-
Supplementary file 8
Stripe calls.
- https://cdn.elifesciences.org/articles/96852/elife-96852-supp8-v1.xlsx
-
Supplementary file 9
Differential contact frequency.
- https://cdn.elifesciences.org/articles/96852/elife-96852-supp9-v1.xlsx
-
Supplementary file 10
Summary of TF footprinting.
- https://cdn.elifesciences.org/articles/96852/elife-96852-supp10-v1.xlsx
-
Supplementary file 11
TF target gene pathway enrichment.
- https://cdn.elifesciences.org/articles/96852/elife-96852-supp11-v1.xlsx
-
Supplementary file 12
List of all GWAS included.
- https://cdn.elifesciences.org/articles/96852/elife-96852-supp12-v1.xlsx
-
Supplementary file 13
Variant to gene mapping across all timepoints.
- https://cdn.elifesciences.org/articles/96852/elife-96852-supp13-v1.xlsx
-
Supplementary file 14
Partitioned LD score regression output.
- https://cdn.elifesciences.org/articles/96852/elife-96852-supp14-v1.xlsx
-
Supplementary file 15
Autoimmune variants in open gene promoters.
- https://cdn.elifesciences.org/articles/96852/elife-96852-supp15-v1.xlsx
-
Supplementary file 16
Comparison of V2G approaches.
- https://cdn.elifesciences.org/articles/96852/elife-96852-supp16-v1.xlsx
-
Supplementary file 17
Motifs predicted to disrupt transcription factor binding sites.
- https://cdn.elifesciences.org/articles/96852/elife-96852-supp17-v1.xlsx
-
Supplementary file 18
V2G genes implicated by orthogonal data.
- https://cdn.elifesciences.org/articles/96852/elife-96852-supp18-v1.xlsx
-
Supplementary file 19
V2G target gene drug repurposing results.
- https://cdn.elifesciences.org/articles/96852/elife-96852-supp19-v1.xlsx
-
MDAR checklist
- https://cdn.elifesciences.org/articles/96852/elife-96852-mdarchecklist1-v1.docx
Download links
A two-part list of links to download the article, or parts of the article, in various formats.
Downloads (link to download the article as PDF)
Open citations (links to open the citations from this article in various online reference manager services)
Cite this article (links to download the citations from this article in formats compatible with various reference manager tools)
Dynamic chromatin architecture identifies new autoimmune-associated enhancers for IL2 and novel genes regulating CD4+ T cell activation
eLife 13:RP96852.
https://doi.org/10.7554/eLife.96852.3


