Structural characterization and dynamics of AdhE ultrastructures from Clostridium thermocellum show a containment strategy for toxic intermediates
- Biosciences Center, National Renewable Energy Laboratory, United States
- Thayer School of Engineering at Dartmouth College, United States
- Department of Biochemistry and Molecular Genetics, University of Colorado Anschutz Medical Campus, United States
- SLAC National Accelerator Laboratory, United States
Figures
Figure 1 with 1 supplement
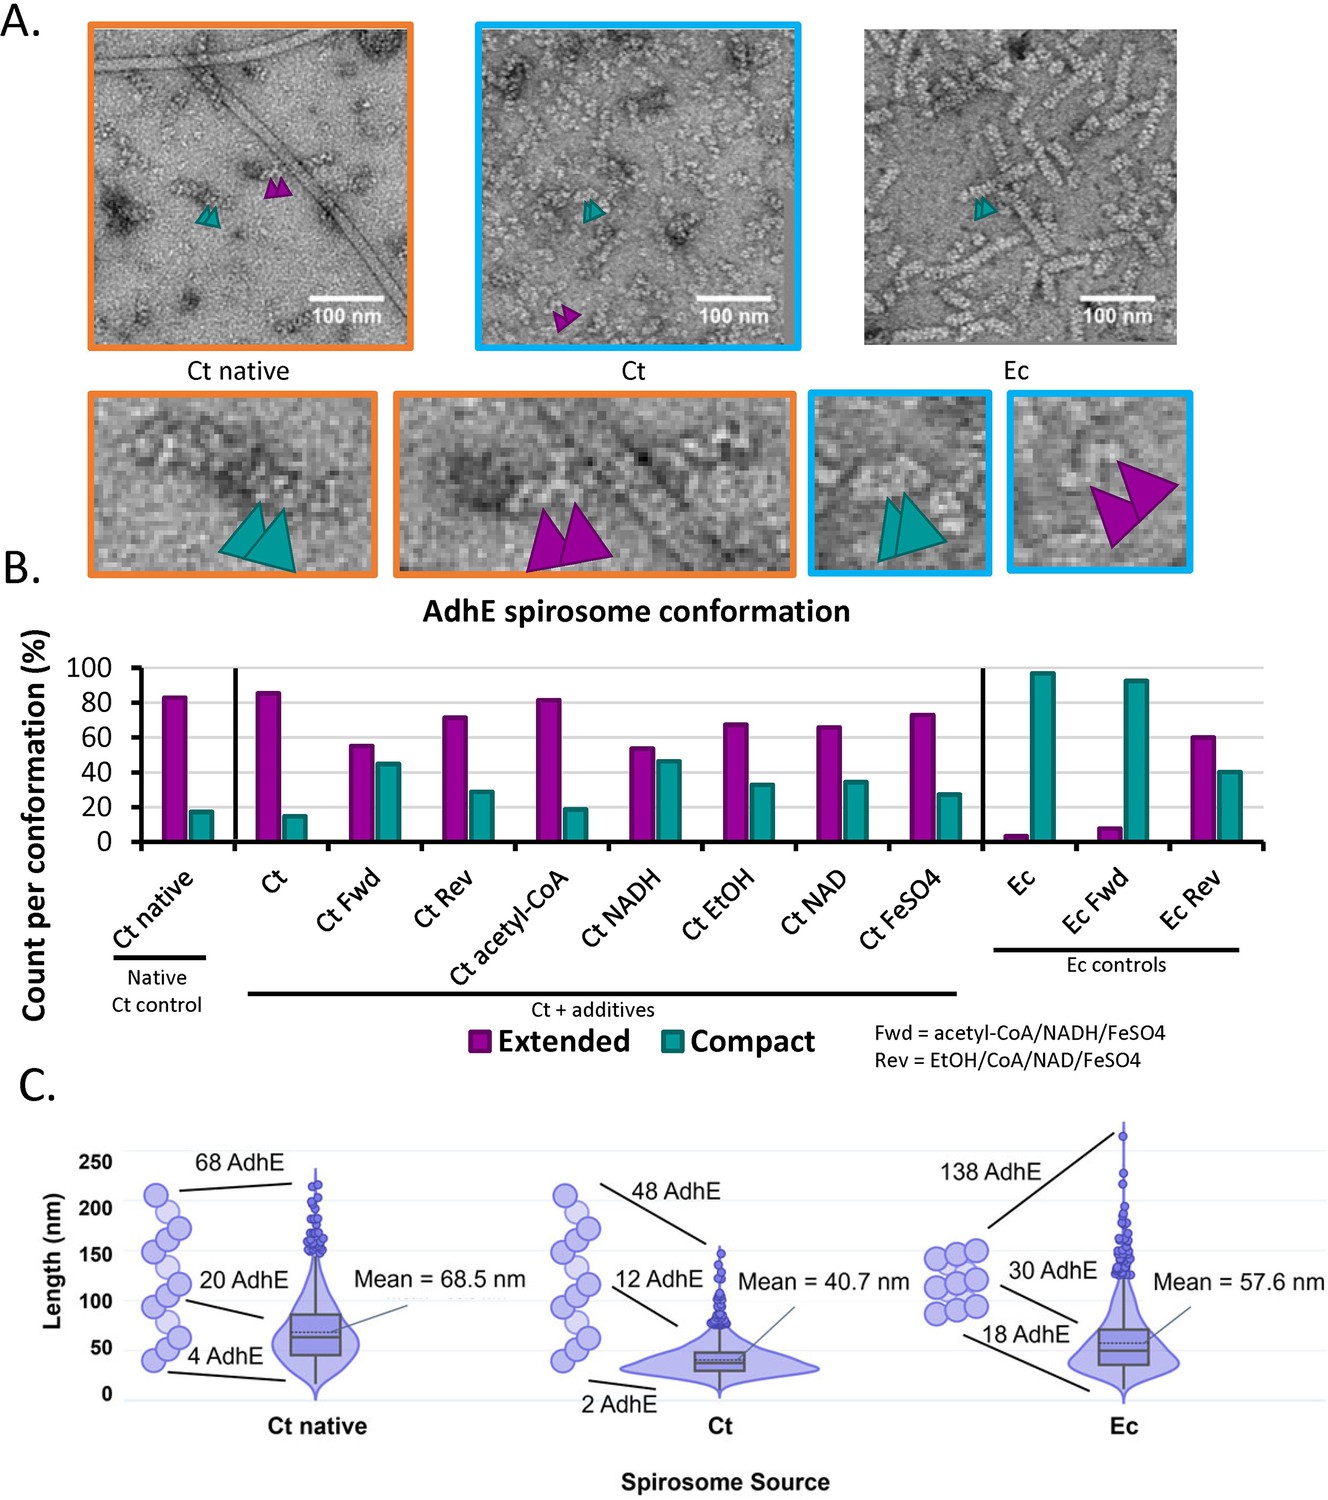
Negative-stain data of aldehyde-alcohol dehydrogenase (AdhE) spirosomes indicate that conformation differs between bacteria.
(A) Sample negative stained images. Ct = C. thermocellum, Ec = E. coli. Compact spirosome indicated by teal arrows, extended by purple arrows. Zoom panels correlate by color. (B) Measurement of spirosome conformation as determined in at least 500 instances. (C) Violin plot of the lengths of spirosomes measured in 1250 instances – example spirosomes to the left of each group represent the majority conformation in the apo state. The difference in mean length was statistically significant for all three samples as determined by a Mann-Whitney U test.
Figure 1—figure supplement 1

Negative stain images of C. thermocellum aldehyde-alcohol dehydrogenase (AdhE) in the presence of reactants.
A representative image from each of the added reactants from Figure 1B. Each image has compact spirosomes in rectangles and extended spirosomes in ovals. Fwd – acetyl-CoA, NADH, FeSO4; Rev – ethanol, NAD+, FeSO4.
Figure 2 with 3 supplements
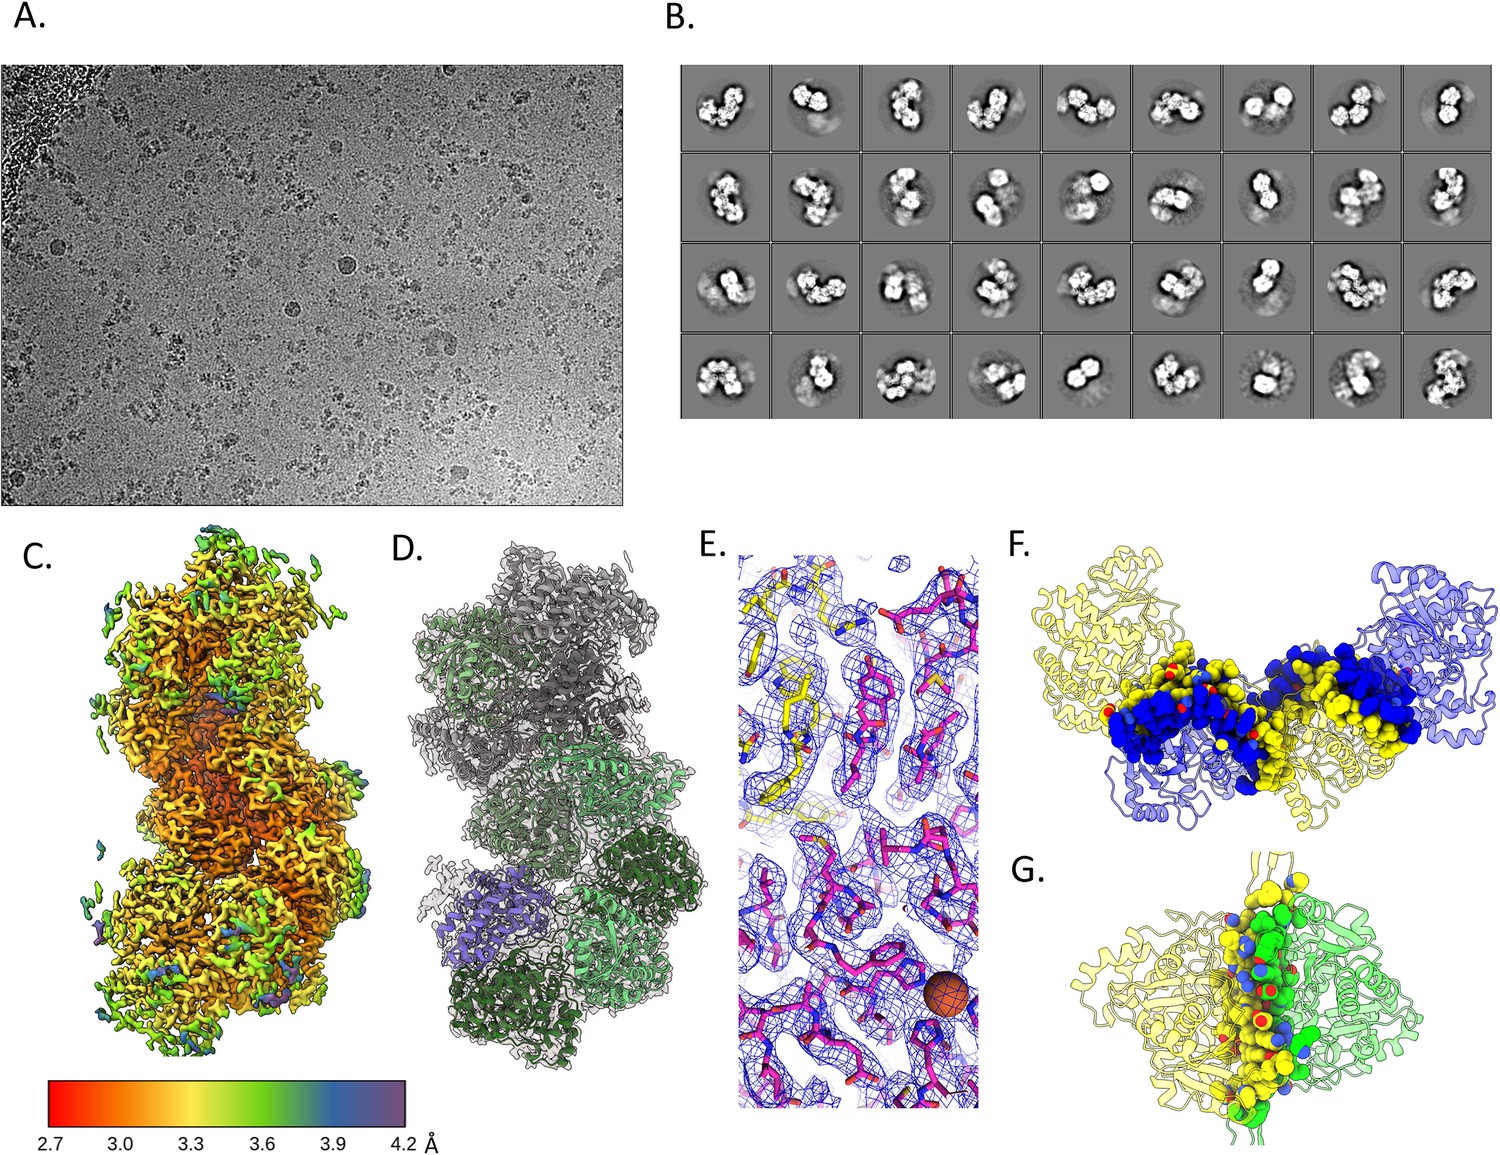
Cryo-electron microscopy (cryo-EM) structure of the extended C. thermocellum aldehyde-alcohol dehydrogenase (AdhE) spirosome.
(A) Representative cryo-EM image. (B) 2D class averages of the single-particle analysis. (C) Local resolution of the final map. (D) Cartoon model fit in the density. (E) Stick representation to show that side chains can be determined at this resolution, the sphere represents the catalytic Fe in the alcohol dehydrogenase (ADH) domain. (F) Dimer interface shows a swapped domain dimerization with a large buried surface area. (G) Tetramer interface has a smaller buried surface area.
Figure 2—figure supplement 1

Comparing structural properties of the interfaces of the C. thermocellum and E. coli aldehyde-alcohol dehydrogenase (AdhE) spirosomes.
A chart examining the dimer and tetramer interfaces of the C. thermocellum (Ct) and E. coli (Ec) extended and compact structures. Ec extended – PDBID 7BVP, Ec compact – PDBID 6AHC, Ct compact – SWISS-MODEL. Scale bars for electrostatics, hydrophobicity, and B-factor are included at the bottom of each cell.
Figure 2—figure supplement 2

Lower-resolution C. thermocellum aldehyde-alcohol dehydrogenase (AdhE) structure.
(A) Density of the 3.8 Å AdhE structure colored by local resolution. (B) Initial model generated fit into the density, gray. This was used as the template for the final structure model.
Figure 2—figure supplement 3

Data processing of the C. thermocellum aldehyde-alcohol dehydrogenase (AdhE) structure.
(A) Pipeline of data processing indicating number of particles at each major step, as well as resolutions pre- and post-polishing. (B) Final FSC curve of the masked density, indicating the structure is 3.28 Å at an FSC of 0.143. (C) SMOC correlation of the residue to density fit for all six chains as calculated by TEMPy local in CCPEM.
Figure 3 with 1 supplement
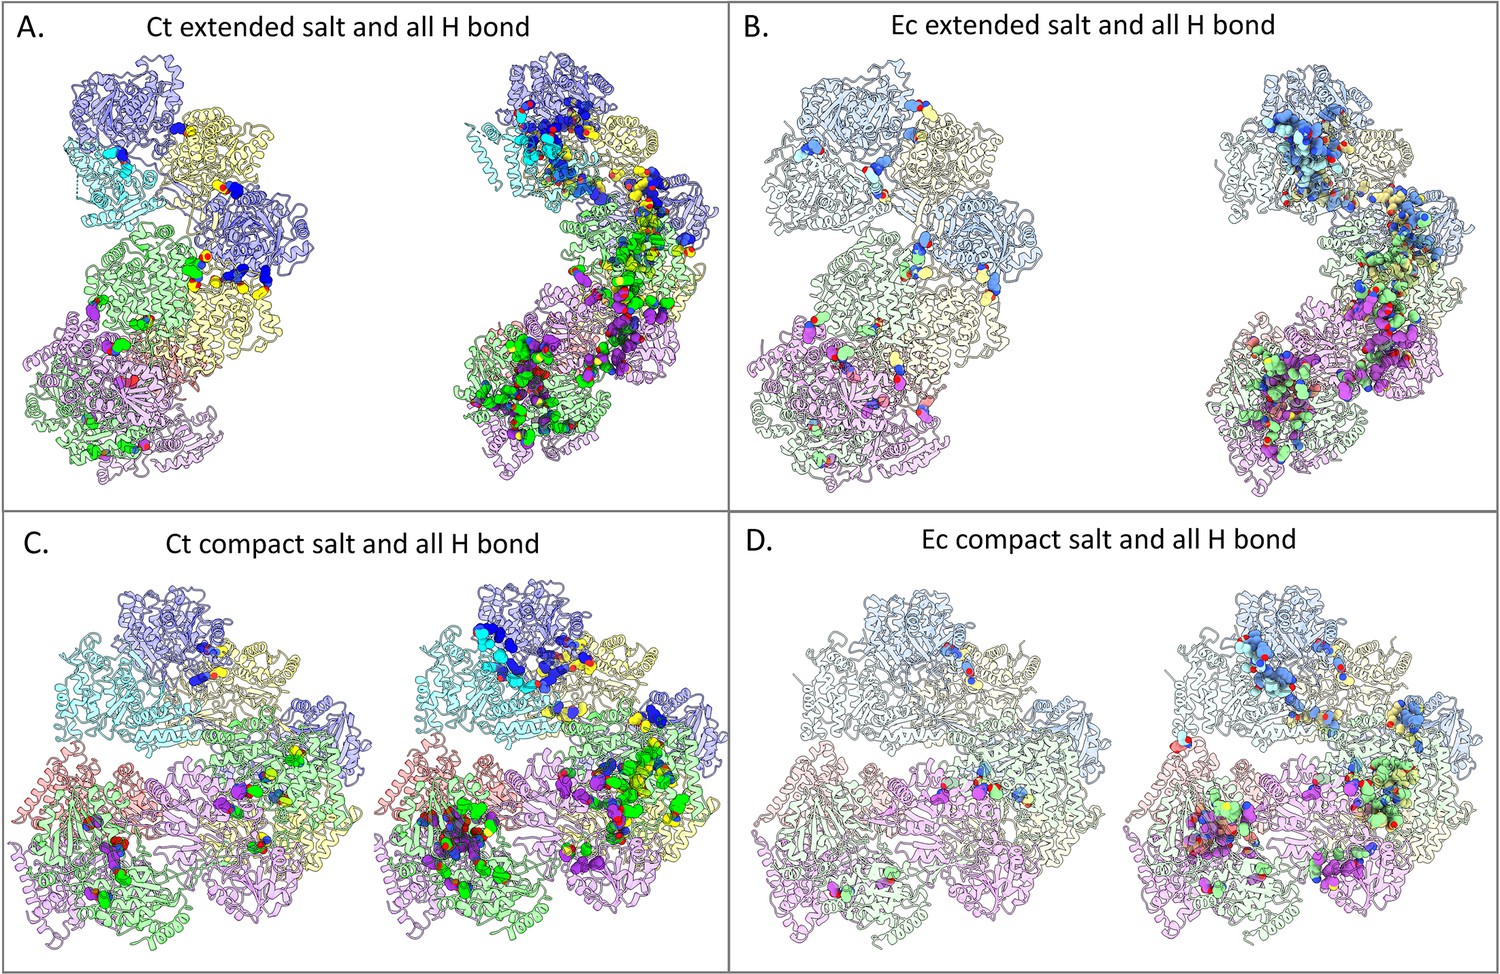
Hydrogen bond networks are more prevalent in the extended spirosomes of both E. coli and C. thermocellum.
(A) C. thermocellum extended spirosome. (B) E. coli extended spirosome from PDB ID 7BVP. (C) SWISS-MODEL of the C. thermocellum compact spirosome. (D) E. coli compact spirosome from PDB ID 6AHC. Individual monomers have unique colors. The E. coli structure monomers are colored with lighter shades to correlate to the corresponding monomer in C. thermocellum. All salt bridges and hydrogen bonds are represented with spheres to emphasize their locations in the ribbon structure.
Figure 3—figure supplement 1

Distribution of amino acids found in spirosome interfaces.
Bar graph representing the amino acid types found in the interfaces. ‘Special’ amino acids are cysteine, glycine, and proline.
Figure 4 with 1 supplement
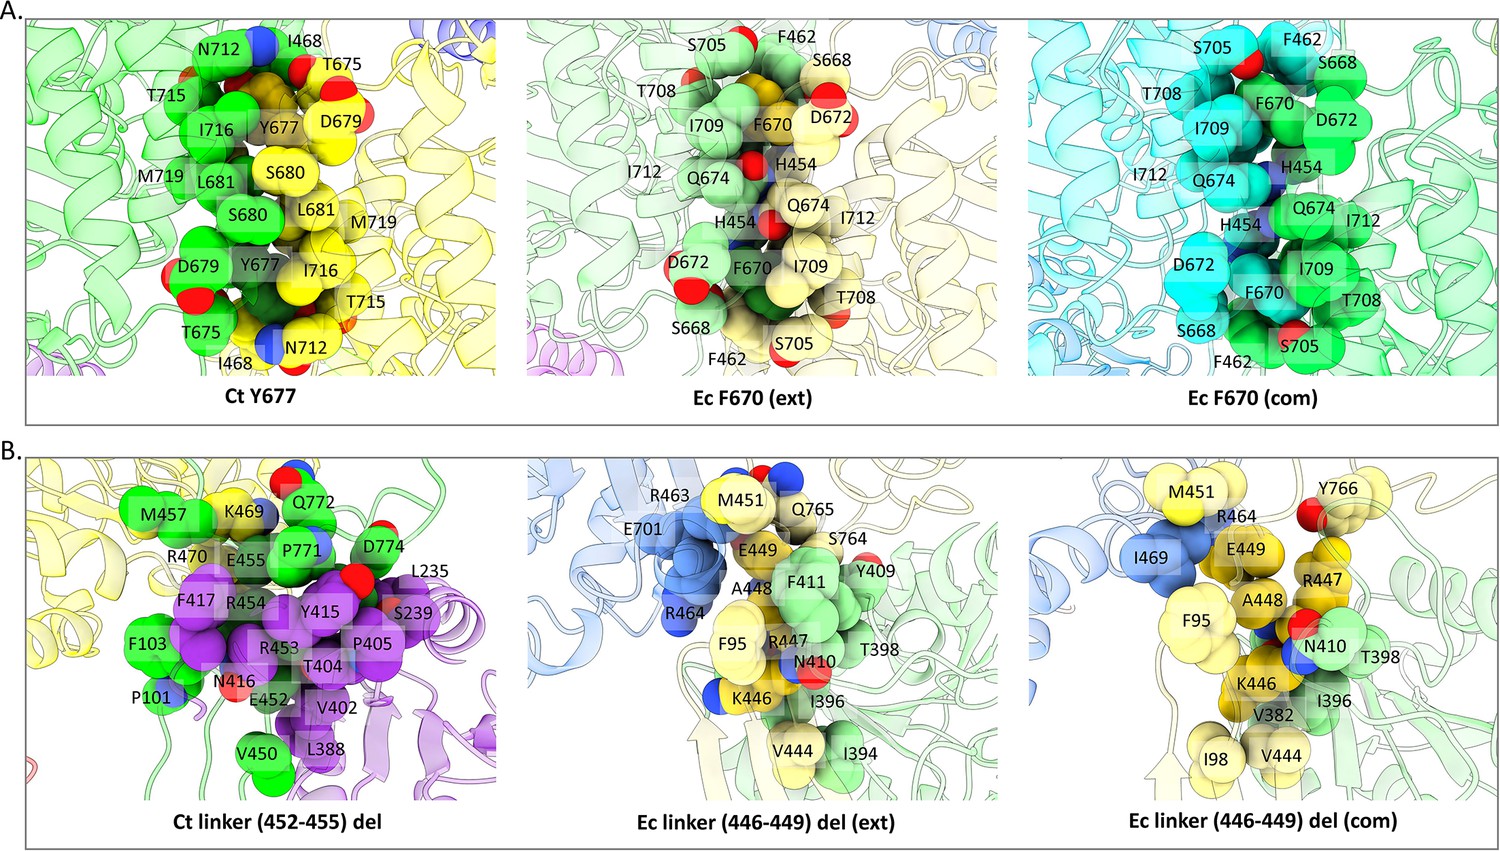
Previously identified mutants in E. coli compared to the C. thermocellum structure.
(A) Top row represents the mutant E. coli F670 that disrupts spirosomes, as well as E. coli F670/S705 that lengthens spirosomes as found in PDBID 7BVP. (B) Bottom row represents the E. coli 446–449 linker deletion as found in PDBID 6TQH. All residues within 5 Å are labeled with their single-letter amino acid code.
Figure 4—figure supplement 1

Aldehyde-alcohol dehydrogenase (AdhE) active site consensus sequences.
Graphs showing the prevalence of residues at positions lining the NADH binding pocket of both the aldehyde dehydrogenase (ALDH) and alcohol dehydrogenase (ADH) domains in 1000 AdhE sequences. The position on the x-axis represents the location in C. thermocellum. The residue listed at the top of each bar indicates the consensus residue, as well as the percentage of consensus.
Figure 5 with 1 supplement
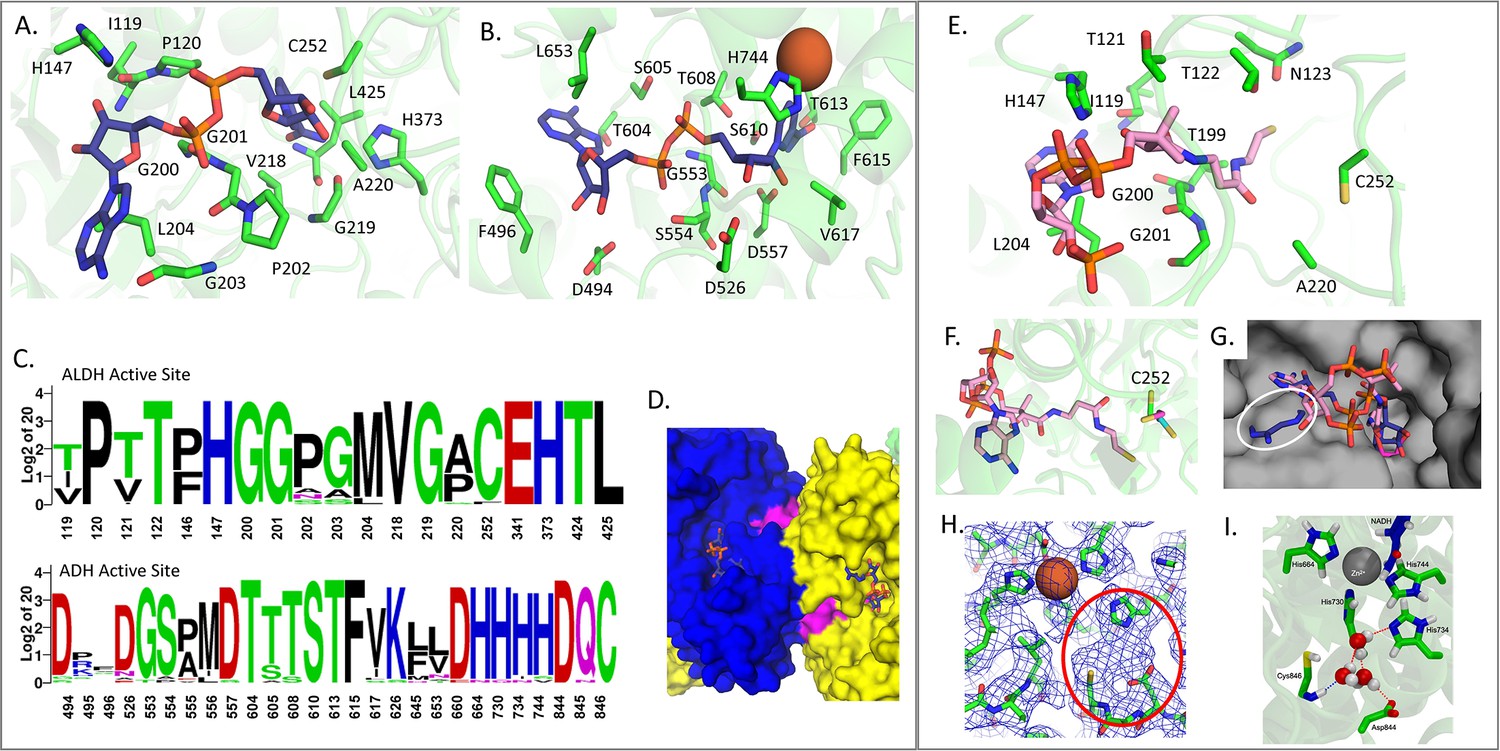
Active sites of C. thermocellum aldehyde-alcohol dehydrogenase (AdhE) compared to E. coli AdhE.
(A) Aldehyde dehydrogenase (ALDH) NAD+ binding domain, where all residues within 2.5 Å of the NAD+ are shown in stick (Ct – green, NAD+ – navy). (B) Alcohol dehydrogenase (ADH) NAD+ binding domain, where all residues within 2.5 Å of the NAD+ are shown in stick (Fe2+ – rust sphere). (C) Sequence alignment of the active site residues. (D) Surface representation of the novel NAD(P)H binding site (magenta) shown between two AdhE monomers (blue and yellow). (E) ALDH binding domain compared to Rhodopseudomonas palustris (Rp) bound to acetyl-CoA, where all residues within 2.5 Å of the docked Rp acetyl-CoA are shown as sticks (Ct – green, acetyl-CoA – pink). (F) Zoom panel from C showing the catalytic cysteine in relation to the docked acetyl-CoA (Ct – green, Ec – cyan, Rp – magenta). (G) Surface view of C. thermocellum with both NAD+ (Ec, navy) and acetyl-CoA (Rp, pink) docked into the structure; white circle indicates a clash between NAD+ and C. thermocellum. (H) Density of the C. thermocellum ADH active site, showing the coordinated Fe2+ atom and an empty density between H734, D844, and C846, circled in red. (I) Snapshot from molecular dynamics simulation at the ADH active site, illustrating hydrogen bonding between water molecules occupying the active site and the three catalytic residues (H734, D844, and C846, green sticks). Also shown are NADH molecules (navy sticks), H644, H730, and H744 (green sticks), and zinc (gray sphere).
Figure 5—figure supplement 1

Consensus sequences of the aldehyde-alcohol dehydrogenase (AdhE) channel-lining residues.
Graphs showing the prevalence of residues at positions lining the extended and compact channels in 1000 AdhE sequences. The position on the x-axis represents the location in C. thermocellum. The residue listed at the top of each bar indicates the consensus residue, as well as the percentage of consensus.
Figure 6 with 1 supplement
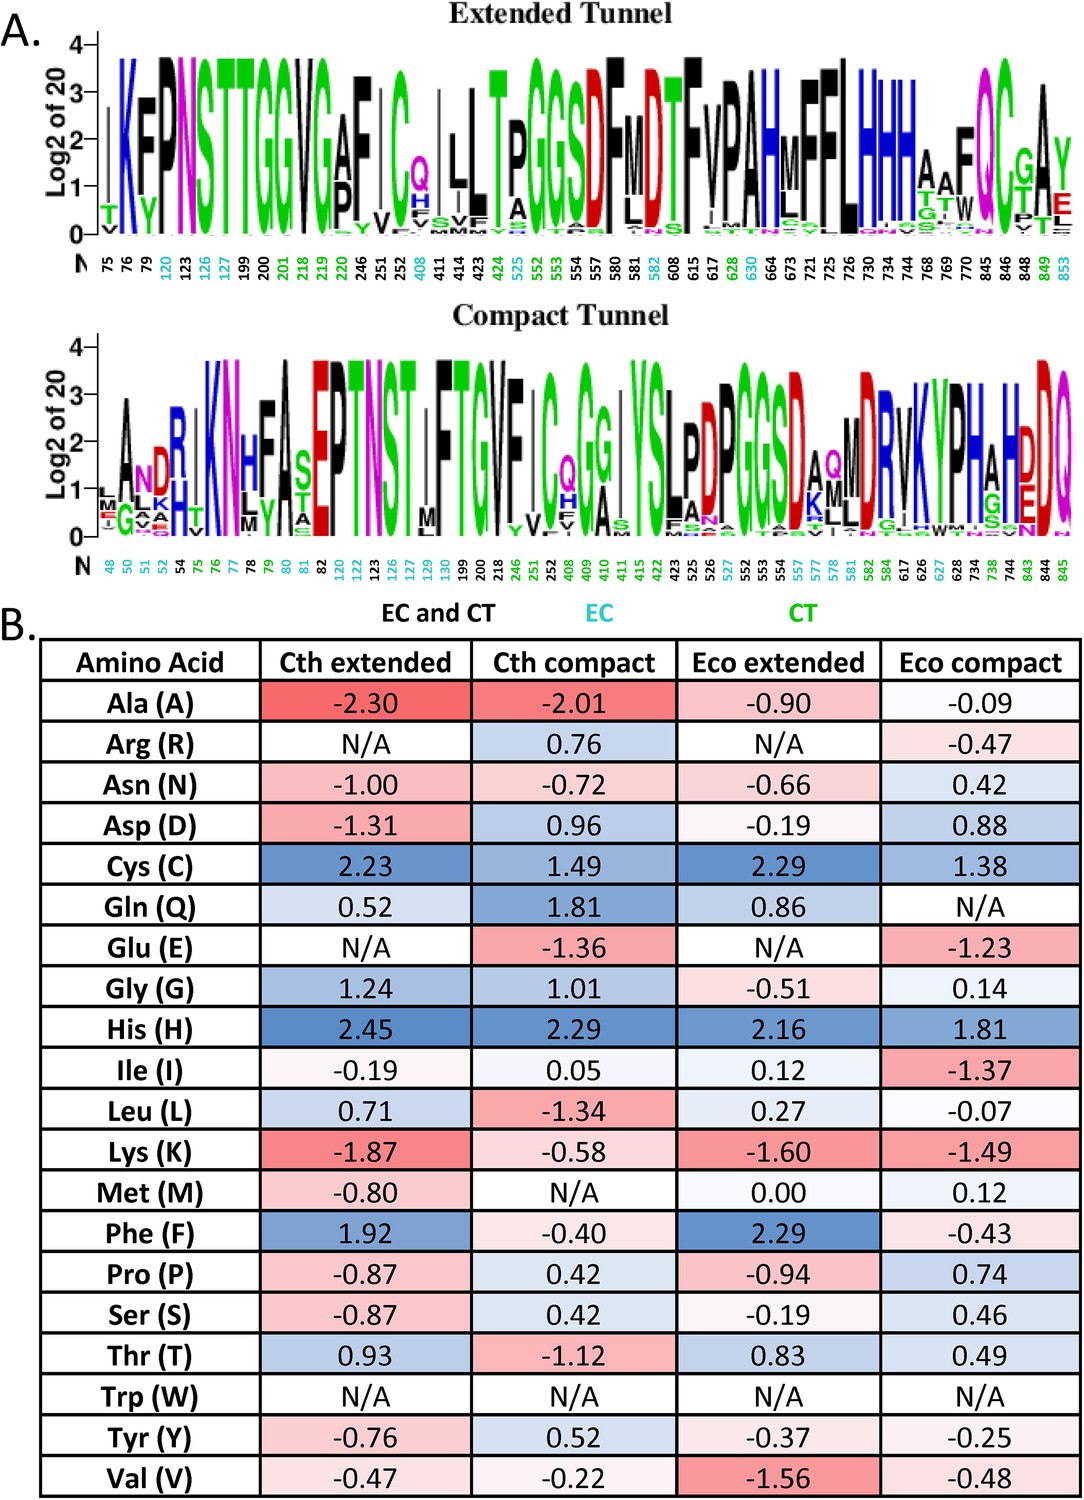
Analysis of the residues lining the spirosome channel.
(A) Sequence homology of the channel from both C. thermocellum (Ct) and E. coli (Ec), residues only identified in the Ct channel are green and in the Ec only channel are cyan. (B) Log2-fold difference between the residues that line the channel and the full-length protein. The scale of change is color-coded from deep red for fewer residues represented in the channel to deep blue for more residues represented in the channel.
Figure 6—figure supplement 1

Molecular dynamics (MD) of aldehyde channeling in E. coli.
(A) Starting configuration for MD simulation of the E. coli extended spirosome structure overlaid with the channel connecting the aldehyde dehydrogenase (ALDH) and alcohol dehydrogenase (ADH) active sites as determined by MOLE (Pravda et al., 2018) (shown in gold spheres, structure used is PDB code 7BVP). Also shown are C246 (representing the ALDH active site, green sticks), three histidine residues that coordinate the divalent metal at the ADH active site (His657, His723, His737, yellow sticks), zinc ion (purple sphere), the starting location for acetaldehyde (violet spheres), and the tertiary aldehyde-alcohol dehydrogenase (AdhE) structure (each AdhE molecular colored distinctly). (B) Same as panel A, except the MOLE tunnel is removed, and acetaldehyde location from MD simulation is shown every 1 ns for 200 ns. In this simulation, the acetaldehyde molecule remains within the enzyme for the full 200 ns simulation. (C) Representations are the same as in A, but here the channel shown is determined by MOLE for the compact spirosome structure (structure used is PDB code 6TQM and aligned with homology structure for compact C. thermocellum spirosome). (D) Same as panel C, except MOLE tunnel is replaced with acetaldehyde location from MD simulation, shown every 1 ns. In this simulation, the acetaldehyde molecule exits the enzyme into solution at about 8 ns. (E) Average residence time for acetaldehyde in the channel before exiting AdhE in MD simulations for two different starting configurations for the AdhE spirosome (extended and compact) and acetaldehyde (at ALDH active site and midway along the channel). Error bars are the standard deviation for simulations performed in triplicate. (F) Channel radius profile from MOLE for E. coli extended cryo-electron microscopy (cryo-EM) structure (PDB code 6TQH). (G) Channel radius profile from MOLE for C. thermocellum extended cryo-EM structure. (H) To give a sense of the overall MD system setup, the extended E. coli spirosome (PDB code 6TQH) is shown as an example (solvent omitted for clarity). Two full AdhE molecules are shown in yellow and green. Light blue and royal blue indicate the two capping ADH domains. The active site for ALDH and ADH domains is indicated. Also shown is the tunnel found by MOLE that connects the two active sites. This panel is analogous to panel A, shown at larger scale.
Figure 7
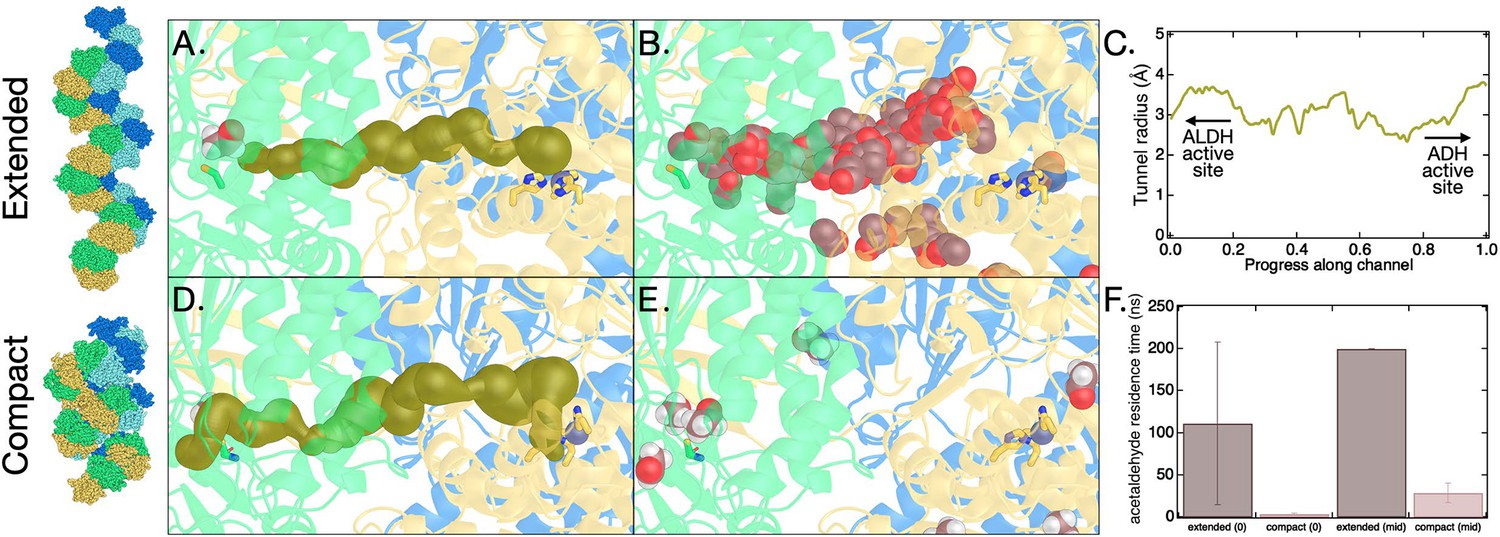
Molecular dynamics (MD) of aldehyde channeling in C. thermocellum aldehyde-alcohol dehydrogenase (AdhE) spirosome.
(A) Starting configuration for MD simulation of the C. thermocellum extended spirosome structure overlaid with the channel connecting the aldehyde dehydrogenase (ALDH) and alcohol dehydrogenase (ADH) active sites as determined by MOLE (shown in gold spheres) (Pravda et al., 2018). Also shown are C252 (representing the ALDH active site, green sticks), three histidine residues that coordinate the divalent metal at the ADH active site (His664, His730, His744, yellow sticks), zinc ion (purple sphere), the starting location for acetaldehyde (violet spheres), and the tertiary AdhE structure (each AdhE molecule colored distinctly). (B) Same as panel A, except the MOLE tunnel is removed, and acetaldehyde location from MD simulation is shown every 1 ns for 160 ns. In this simulation, the acetaldehyde molecule exits the enzyme into solution after about 125 ns. (C) Representations are the same as in A, but here the channel shown is determined by MOLE for the compact spirosome structure (E. coli 6TQM and aligned with C. thermocellum AdhE homology structure). (D) Same as panel C, except MOLE tunnel is replaced with acetaldehyde location from MD simulation, shown every 1 ns. In this simulation, the acetaldehyde molecule exits the enzyme into solution at about 4 ns. (E) Average residence time for acetaldehyde in the channel before exiting AdhE in MD simulations for two different starting configurations for the AdhE spirosome (extended and compact) and acetaldehyde (at ALDH active site and midway along the channel). Error bars are the standard deviation for simulations performed in triplicate.
Figure 8
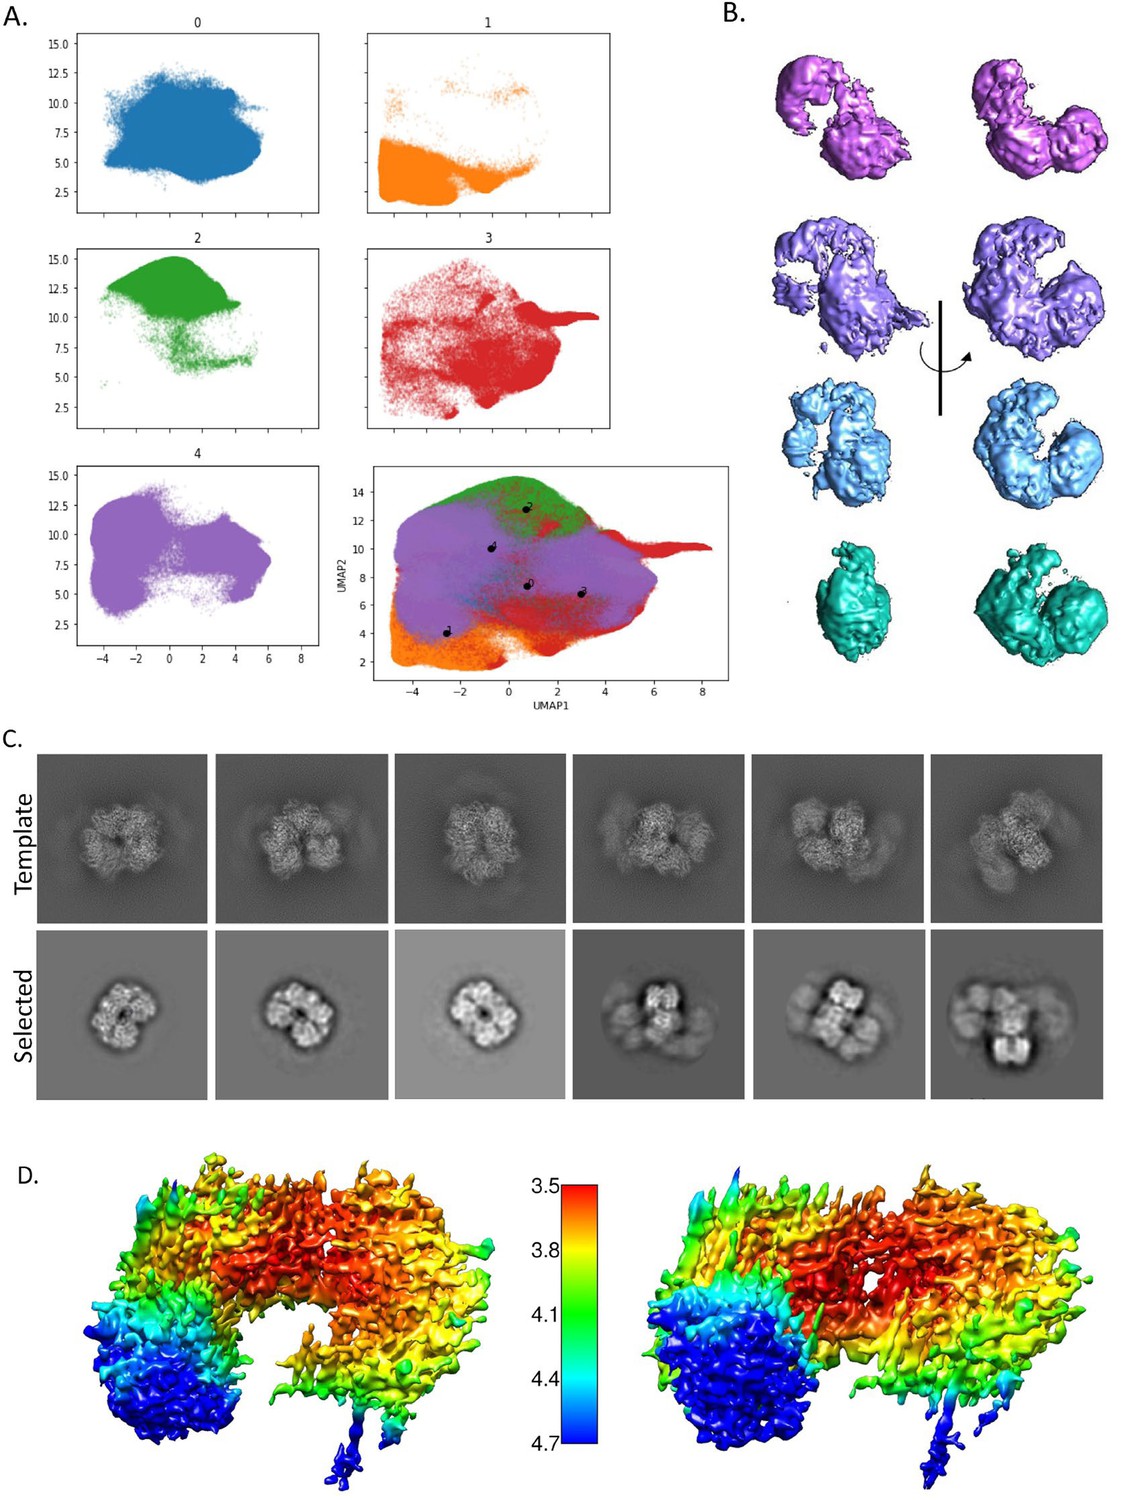
CryoDRGN results show that there is conformational heterogeneity in the sample.
(A) Uniform Manifold Approximation and Projection (UMAP) representation of the particles shows a continuous heterogeneity (bottom right corner). Colored UMAP graph shows the division of the particles into five classes, broken into their individual map based on color. (B) One representative density for each group (excepting the junk class) shown at two angles to illustrate the movement of the spirosome (purple – extended, lavender – intermediate 1, light blue – intermediate 2, teal – compact). (C) Back-projected template classes generated in CryoSPARC from PDB ID 6AHC (top) and the matching classes selected from our data (bottom). (D) Two angles of the final compact spirosome density shown with local resolution coloring as indicated by the scale bar in the center.
Videos
Video 1
Molecular dynamics (MD) of aldehyde channeling.
Example of MD simulation of C. thermocellum extended spirosome with the channel connecting the aldehyde dehydrogenase (ALDH) and alcohol dehydrogenase (ADH) active sites as determined by MOLE (Pravda et al., 2018) shown in gold spheres. Also shown are C252 (representing the ALDH active site, green sticks), three histidine residues that coordinate the divalent metal at the ADH active site (His664, His730, His744, yellow sticks), zinc ion at ADH active site (purple sphere), and the tertiary AdhE structure (each AdhE molecular colored distinctly). Acetaldehyde (violet spheres) is initiated at the ALDH active site and throughout the simulation for 130 ns. In this simulation, the acetaldehyde molecule exits the enzyme into solution after about 125 ns. The movie was created in PyMOL (The PyMOL Molecular Graphics System, version 2.0 Schrödinger, LLC) and the positions of each residue are smooth using the ‘smooth’ command with two passes and a window size of two. This same starting configuration was run in triplicate, with retention times of 9 and 200 ns in the other two simulations.
Additional files
-
Supplementary file 1
Tables of data associated with this study.
(A). Sequences of AdhE primers. Nucleotide sequences of the primers used in this study. (B). Sequences of the AdhE constructs. Amino acid sequences of the two proteins, E. coli and C. thermocellum AdhE, used in this study. (C). Data collection and processing. The statistics describing the cryo-electron microscopy (cryo-EM) data processing performed in this study.
- https://cdn.elifesciences.org/articles/96966/elife-96966-supp1-v1.docx
-
MDAR checklist
- https://cdn.elifesciences.org/articles/96966/elife-96966-mdarchecklist1-v1.docx
Download links
A two-part list of links to download the article, or parts of the article, in various formats.
Downloads (link to download the article as PDF)
Open citations (links to open the citations from this article in various online reference manager services)
Cite this article (links to download the citations from this article in formats compatible with various reference manager tools)
Structural characterization and dynamics of AdhE ultrastructures from Clostridium thermocellum show a containment strategy for toxic intermediates
eLife 13:RP96966.
https://doi.org/10.7554/eLife.96966.3


