LncRNA Snhg3 aggravates hepatic steatosis via PPARγ signaling
- Department of Biochemistry & Molecular Biology, State Key Laboratory of Common Mechanism Research for Major Diseases, Institute of Basic Medical Sciences Chinese Academy of Medical Sciences & School of Basic Medicine Peking Union Medical College, China
- Department of Microbiology and Immunology, Shanxi Medical University, China
- Department of Pathophysiology, Institute of Basic Medical Sciences Chinese Academy of Medical Sciences & School of Basic Medicine Peking Union Medical College, China
- Shanghai Institute of Materia Medica, Chinese Academy of Sciences, China
- Zhongshan Institute for Drug Discovery, Shanghai Institute of Materia Medica, Chinese Academy of Sciences, China
- State Key Laboratory of Brain and Cognitive Science, Institute of Biophysics, Chinese Academy of Sciences, China
Figures
Figure 1
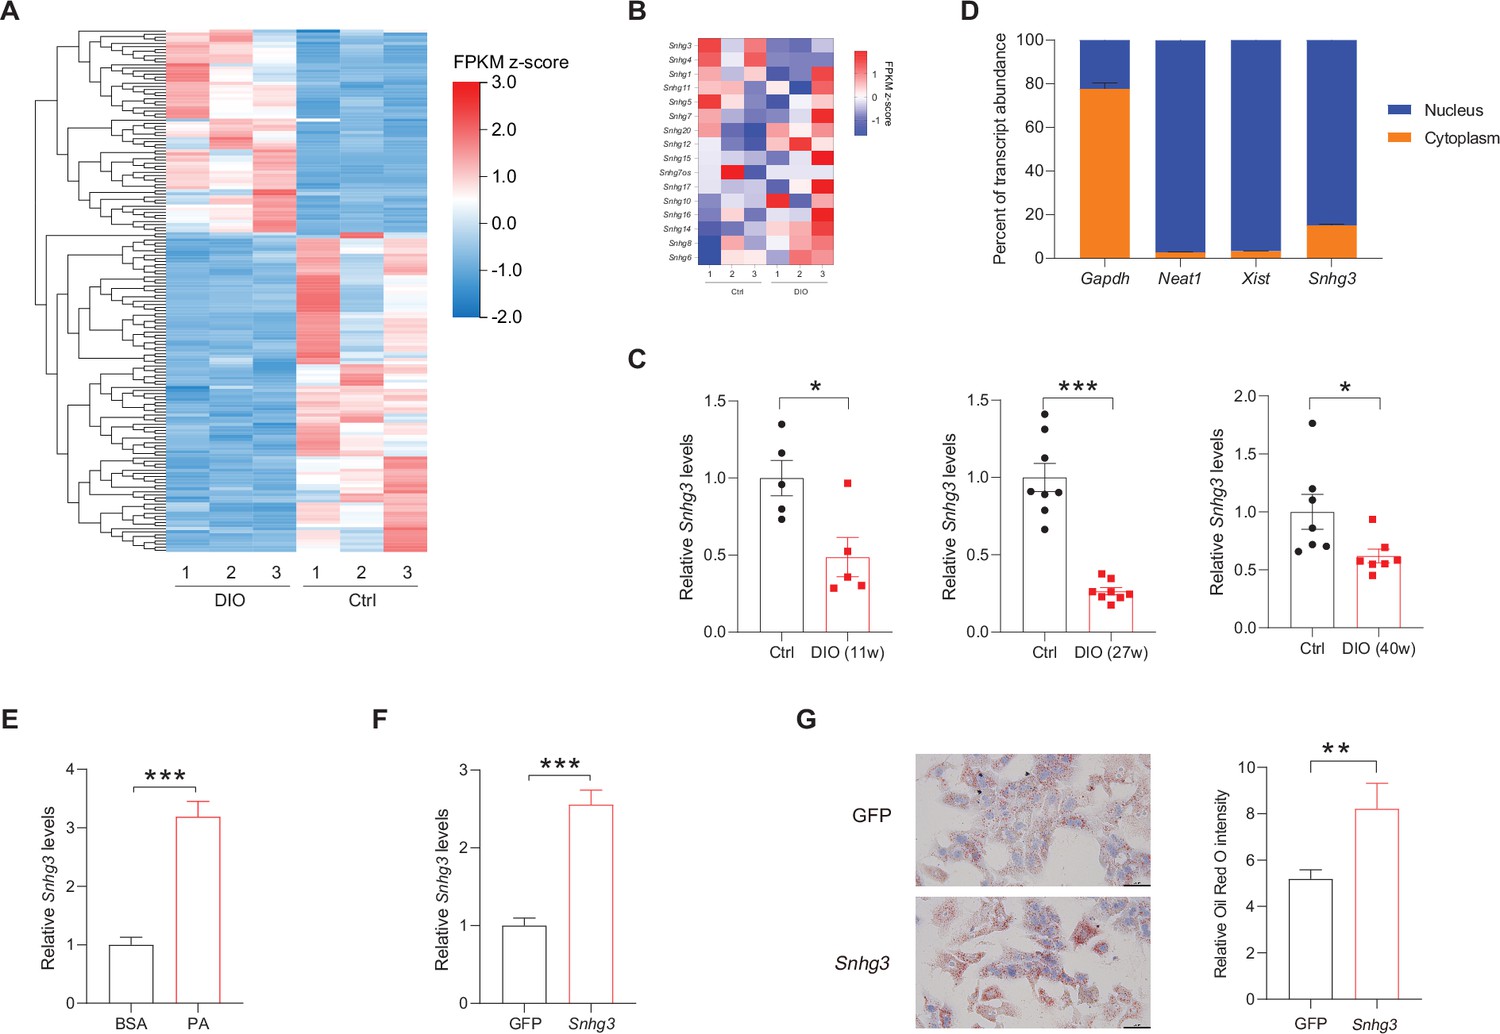
The expression of hepatic lncRNA-Snhg3 is downregulated in DIO mice.
(A) Differentially expressed lncRNAs in livers of 6~8-week-old littermate male mice that were fed an HFD and control diet for 27weeks (n=3mice/group). (B) Heat map of Snhgs in livers of mice as indicated in (A) (n=3mice/group). (C) Expression levels of Snhg3 in the liver of 6~8-week-old littermate male mice that were fed an HFD and control diet for indicated time period 11, 27, and 40weeks. (D) Relative Snhg3 expression levels in nuclear and cytosolic fractions of mouse primary hepatocytes. Nuclear controls: Neat1 and Xist; Cytosolic control: Gapdh. (E) PA promotes the expression of Snhg3 in primary hepatocytes. (F and G) Overexpression of Snhg3 (F) induces lipid accumulation (G) left, Oil red O staining; right, quantitative analysis) in primary hepatocytes with PA treatment. Data are represented as mean ± SEM. *p<0.05, **p<0.01and ***p<0.001 by Student’s t test.
-
Figure 1—source data 1
The lncRNAs expression profiles in the livers of high-fat diet-induced obesity mice and normal chow-fed mice were determined using RNA-Seq for Figure 1A.
- https://cdn.elifesciences.org/articles/96988/elife-96988-fig1-data1-v1.xls
Figure 2 with 1 supplement

Hepatocyte-specific Snhg3 knockout alleviates hepatic steatosis in DIO mice.
(A) The expression of Snhg3 was downregulated in the liver of Snhg3-HKO mice. Snhg3-Flox (n=6) and Snhg3-HKO (n=5). (B) Body weights of Snhg3-Flox (n=6) and Snhg3-HKO (n=5) mice fed HFD for indicated time period. (C) ITT (n=5/group) and GTT (n=6/group) of Snhg3-Flox and Snhg3-HKO mice fed HFD for 18weeks were analyzed, (AUC, Area Under Curve). (D) Liver weight (left) and ratio (right) of liver weight/body weight of Snhg3-Flox (n=6) and Snhg3-HKO (n=5) mice fed HFD for 21weeks. (E) H&E and oil red O staining (left) and NASH score (right) of liver of Snhg3-Flox and Snhg3-HKO mice as indicated in (D). Scale bars, 50μm. (F) Hepatic TG and TC contents of mice as indicated in (D). (G) Serum ALT and AST concentrations of mice as indicated in (D). (H) Serum FFAs, TG and TC concentrations of mice as indicated in (D). Data are represented as mean ± SEM. *p<0.05and **p<0.01 by two-way ANOVA (B and C) and by Student’s t test (the others).
Figure 2—figure supplement 1
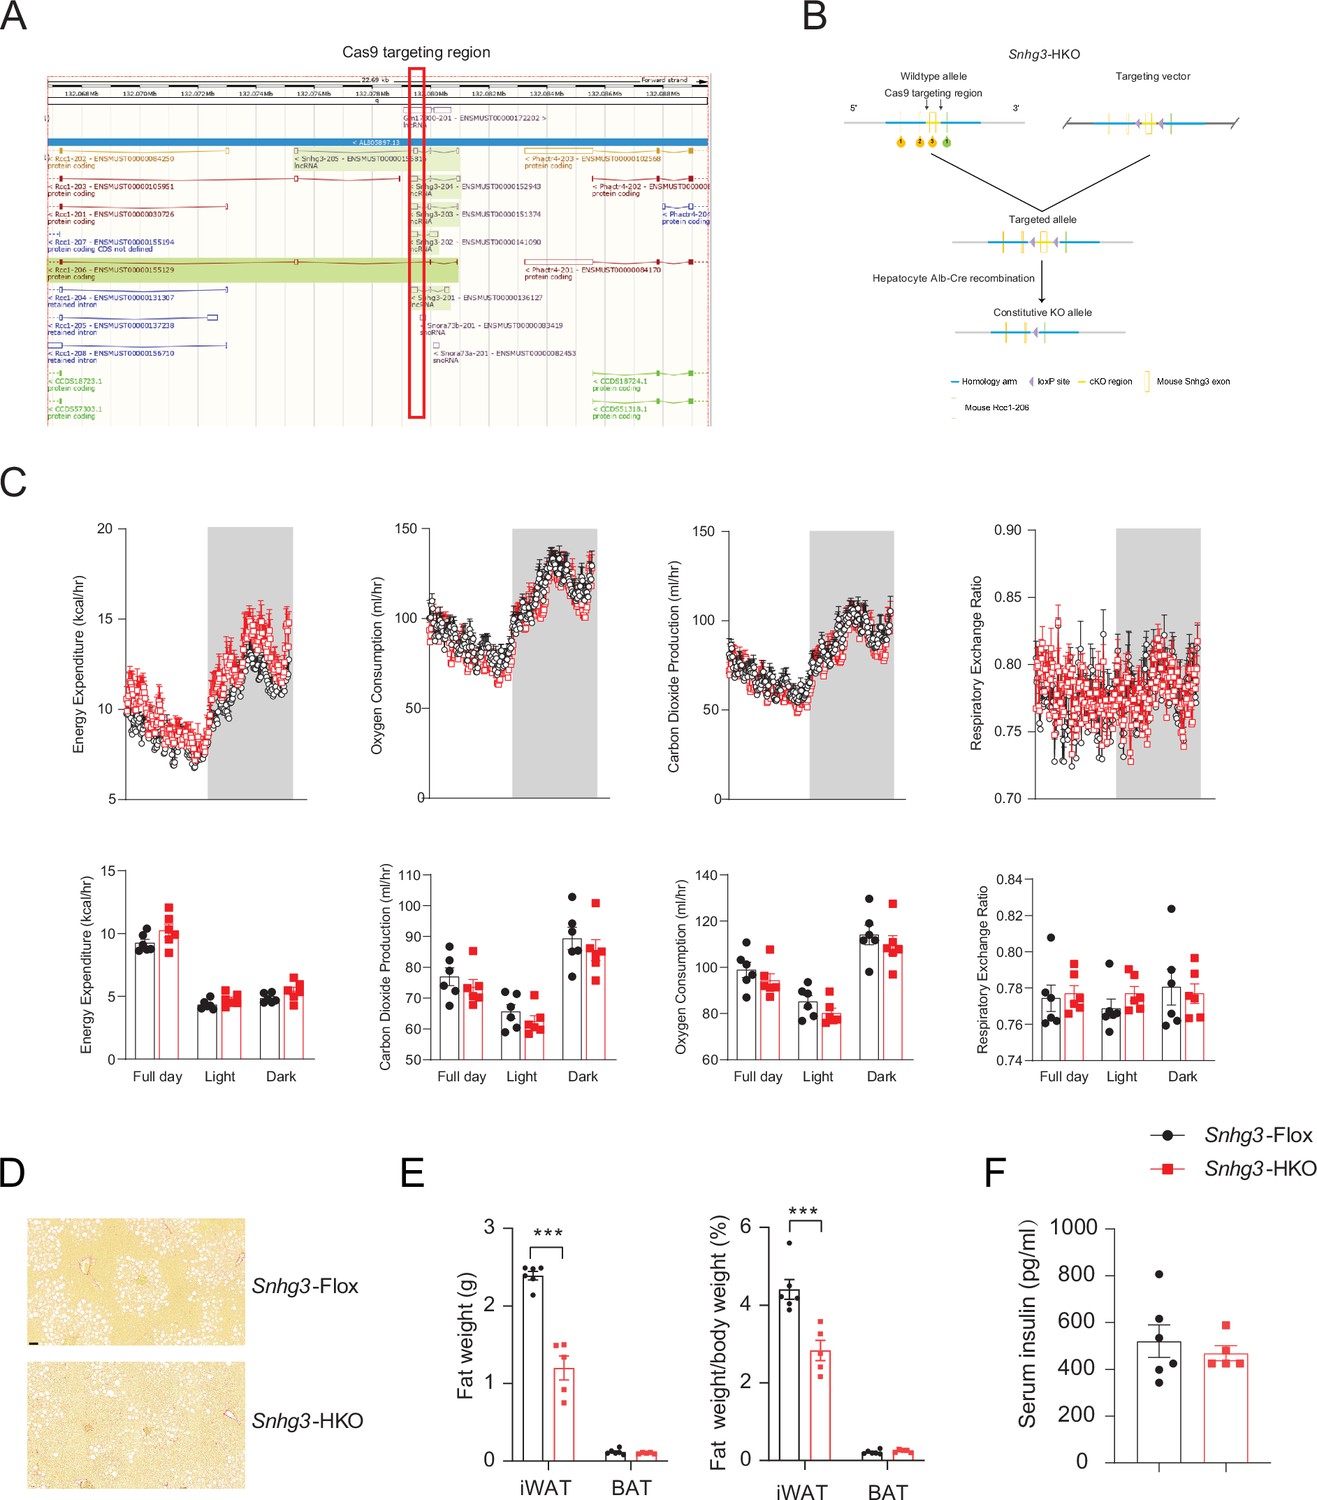
Hepatocyte-specific Snhg3 knockout alleviates hepatic steatosis in DIO mice.
(A) The genome mapping of mouse Snhg3 (https://www.ncbi.nlm.nih.gov/gene/). (B) Schematic diagram for the creation of hepatocyte-specific Snhg3 knock-out (Snhg3-HKO) mice. (C) Heat production, total oxygen consumption and carbon dioxide production, and RER of Snhg3-Flox (n=6) and Snhg3-HKO (n=6) mice fed HFD for 16weeks were measured by CLAMS. (D) Liver fibrosis Snhg3-Flox and Snhg3-HKO mice fed HFD for 16weeks was visualized using Picro Sirius Red Stain. Scale bars, 50μm. (E) iWAT weight (left) and ratio (right) of iWAT weight/body weight of mice as indicated in Snhg3-Flox (n=6) and Snhg3-HKO (n=5) mice fed HFD. (F) Serum insulin concentration of mice as indicated in Snhg3-Flox (n=6) and Snhg3-HKO (n=5) mice fed HFD. Data are represented as mean ± SEM. ***p<0.001 by Student’s t test (the others).
Figure 3 with 1 supplement
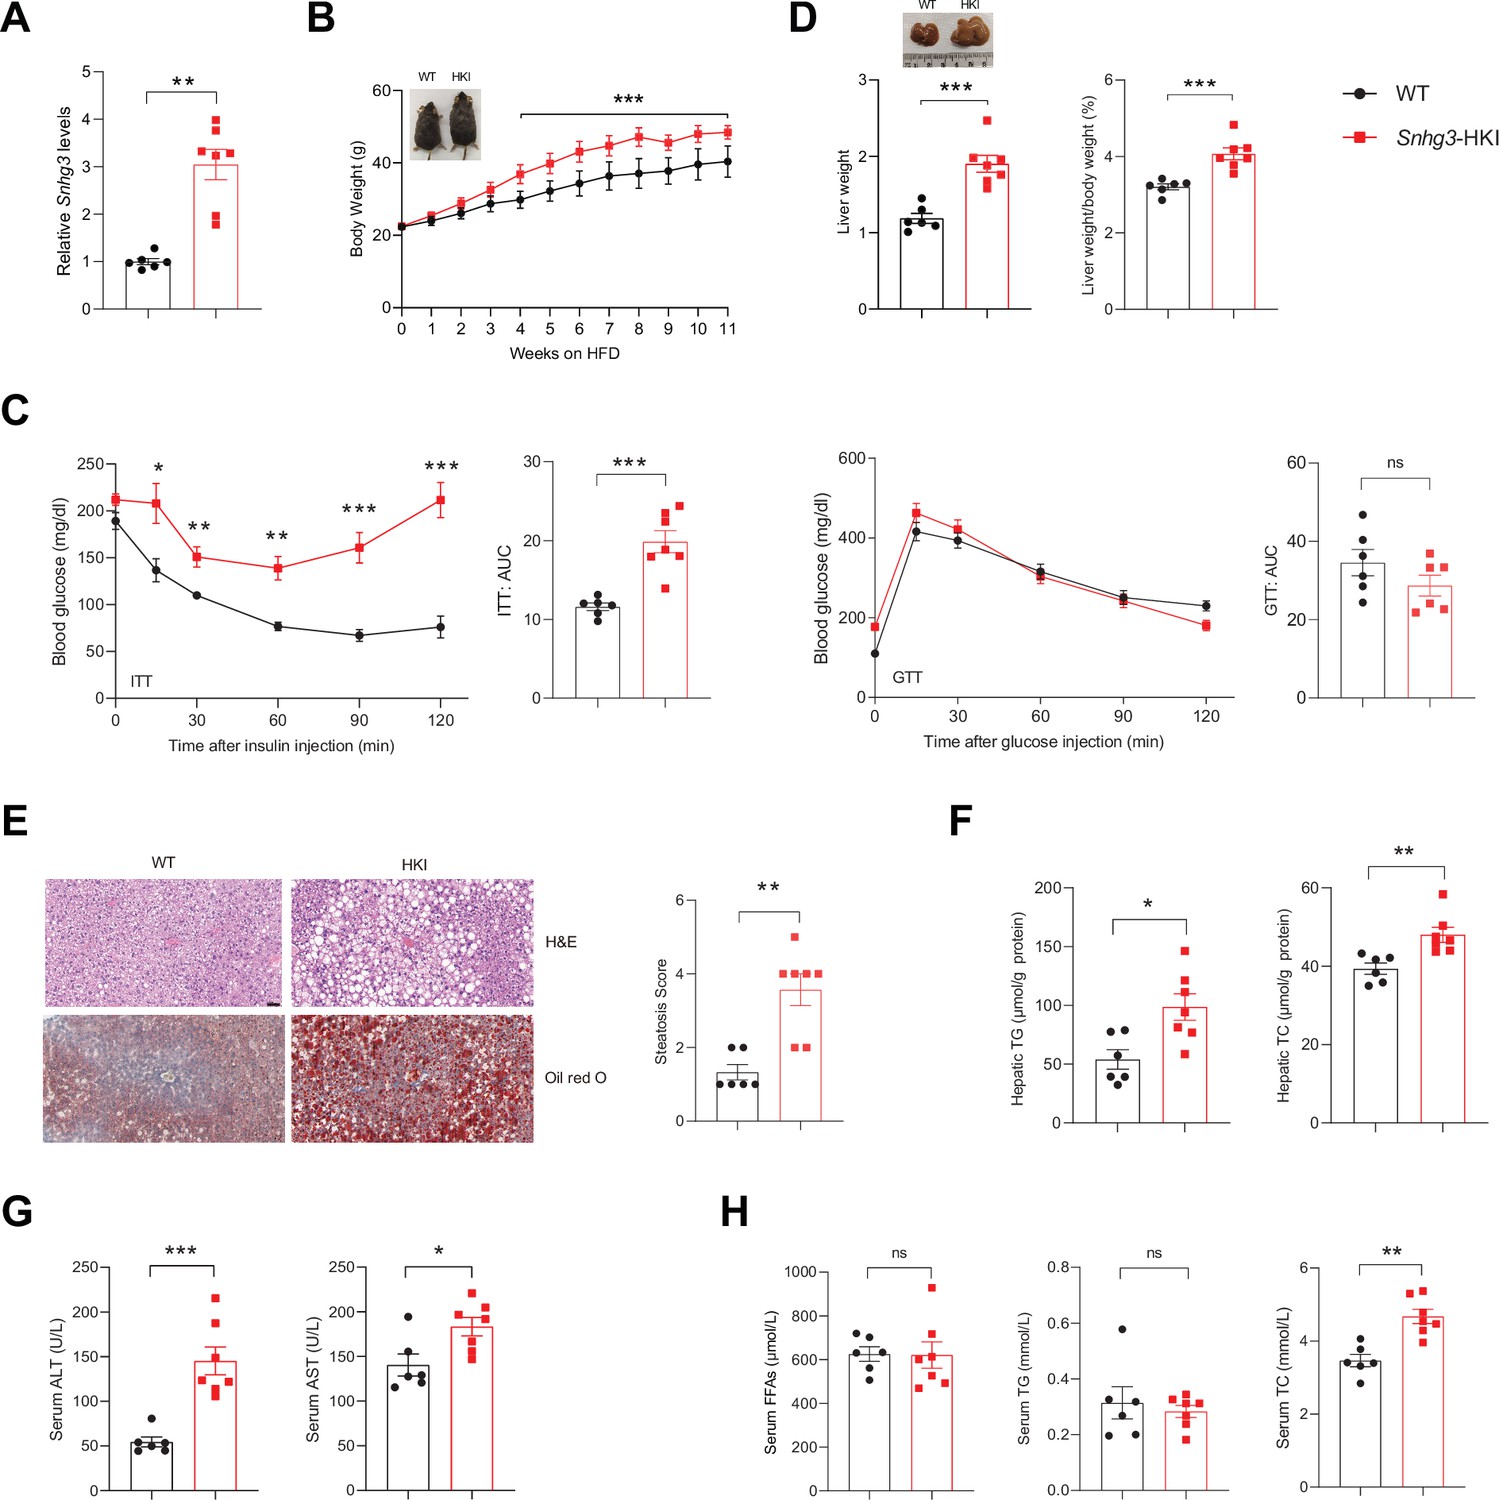
Hepatocyte-specific Snhg3 overexpression aggravates hepatic steatosis in DIO mice.
(A) The expression of Snhg3 was upregulated in the liver of Snhg3-HKI mice. WT (n=6) and Snhg3-HKI (n=7). (B) Body weights of WT mice (n=6) and Snhg3-HKI mice (n=7) fed HFD for indicated times. (C) ITT and GTT of WT (n=6) and Snhg3-HKI (n=7) mice fed HFD for 11weeks were analyzed. (D) Liver weight (left) and ratio (right) of liver weight/body weight of WT (n=6) and Snhg3-HKI (n=7) mice fed HFD for 13weeks. (E) Liver H&E and oil red O staining (left) and NASH score (right) of WT and Snhg3-HKI mice as indicated in (D). Scale bars, 50μm. (F) Hepatic TG and TC contents of mice as indicated in (D). (G) Serum ALT and AST concentrations of mice as indicated in (D). (H) Serum FFAs, TG and TG concentrations of mice as indicated in (D). Data are represented as mean ± SEM. *p<0.05, **p<0.01and ***p<0.001 by two-way ANOVA (B and C) and by Student’s t test (the others).
Figure 3—figure supplement 1
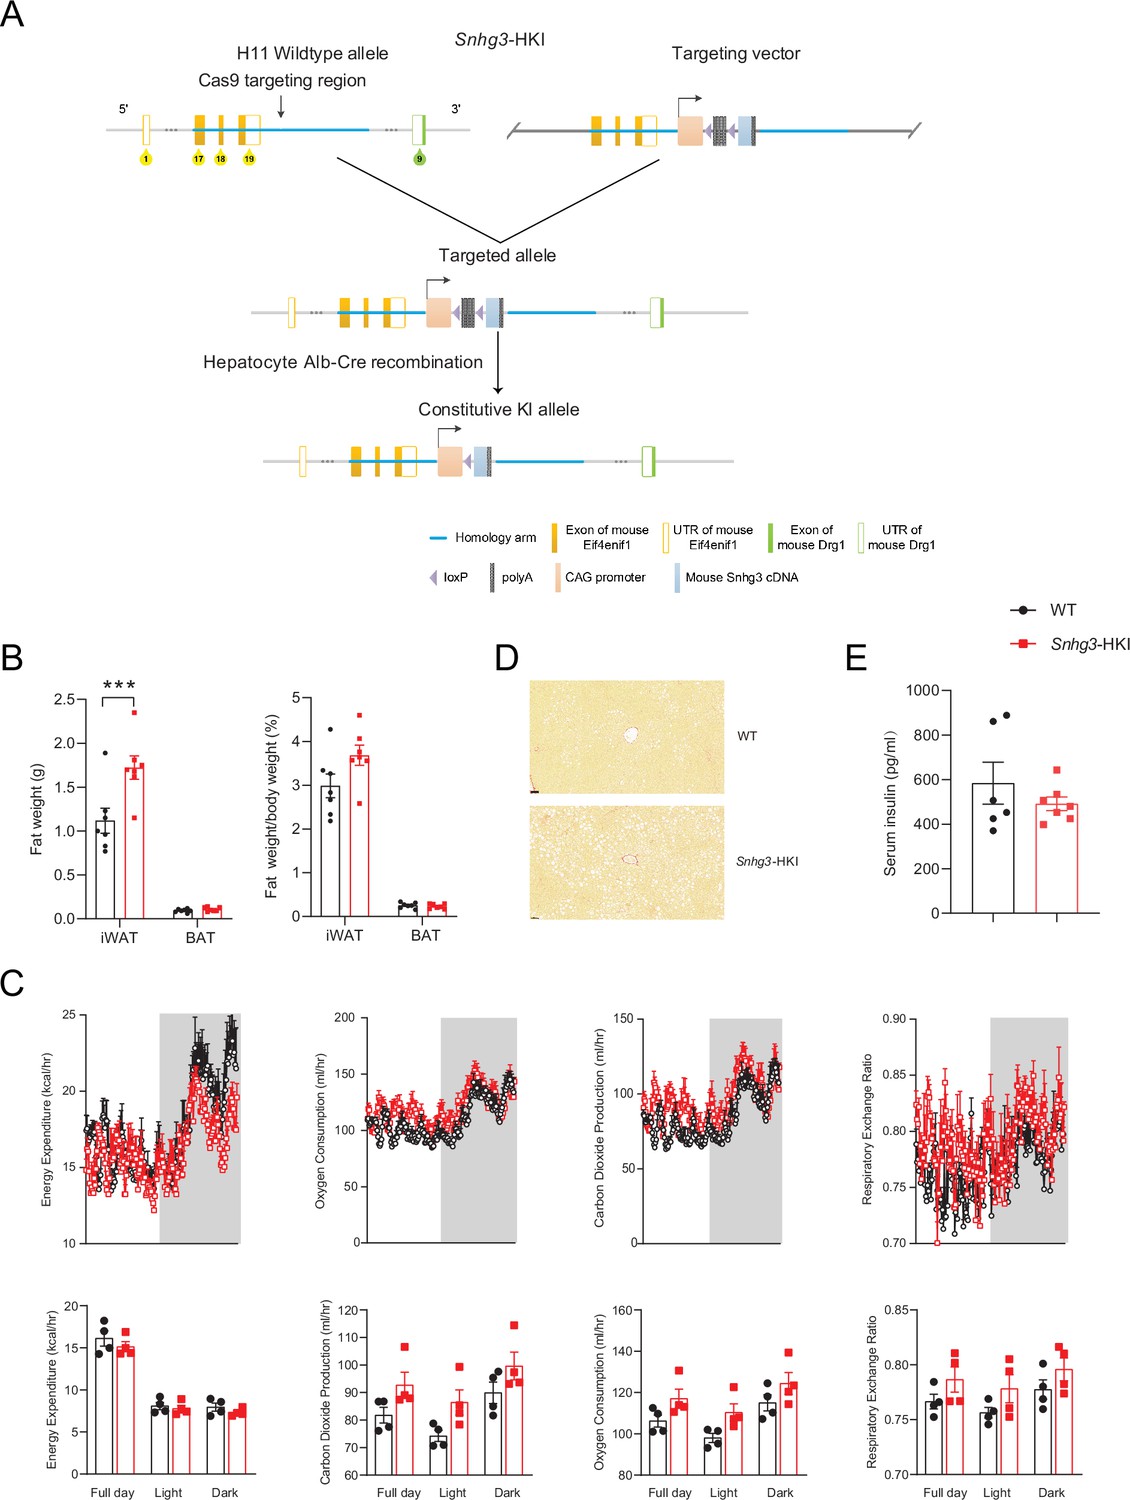
Hepatocyte-specific Snhg3 overexpression aggravates hepatic steatosis in DIO mice.
(A) Schematic diagram for the creation of hepatocyte-specific Snhg3 knock-in (Snhg3-HKI) mice. (B) iWAT weight (left) and ratio (right) of iWAT weight/body weight of mice as indicated in WT (n=6) and Snhg3-HKI (n=7) mice fed HFD for 9weeks. (C) Heat production, total oxygen consumption and carbon dioxide production, and RER of WT (n=4) and Snhg3-HKI (n=4) mice fed HFD for 9weeks were measured by CLAMS. (D) Liver fibrosis in WT and Snhg3-HKI mice fed HFD for 9weeks was visualized using Picro Sirius Red Stain. Scale bars, 50μm. (E) Serum insulin concentration of mice as indicated in WT (n=6) and Snhg3-HKI (n=7) mice fed HFD for 9weeks. Data are represented as mean ± SEM. ***p<0.001 by Student’s t test.
Figure 4 with 1 supplement
Snhg3 promotes hepatic steatosis through regulating chromatin remodeling.
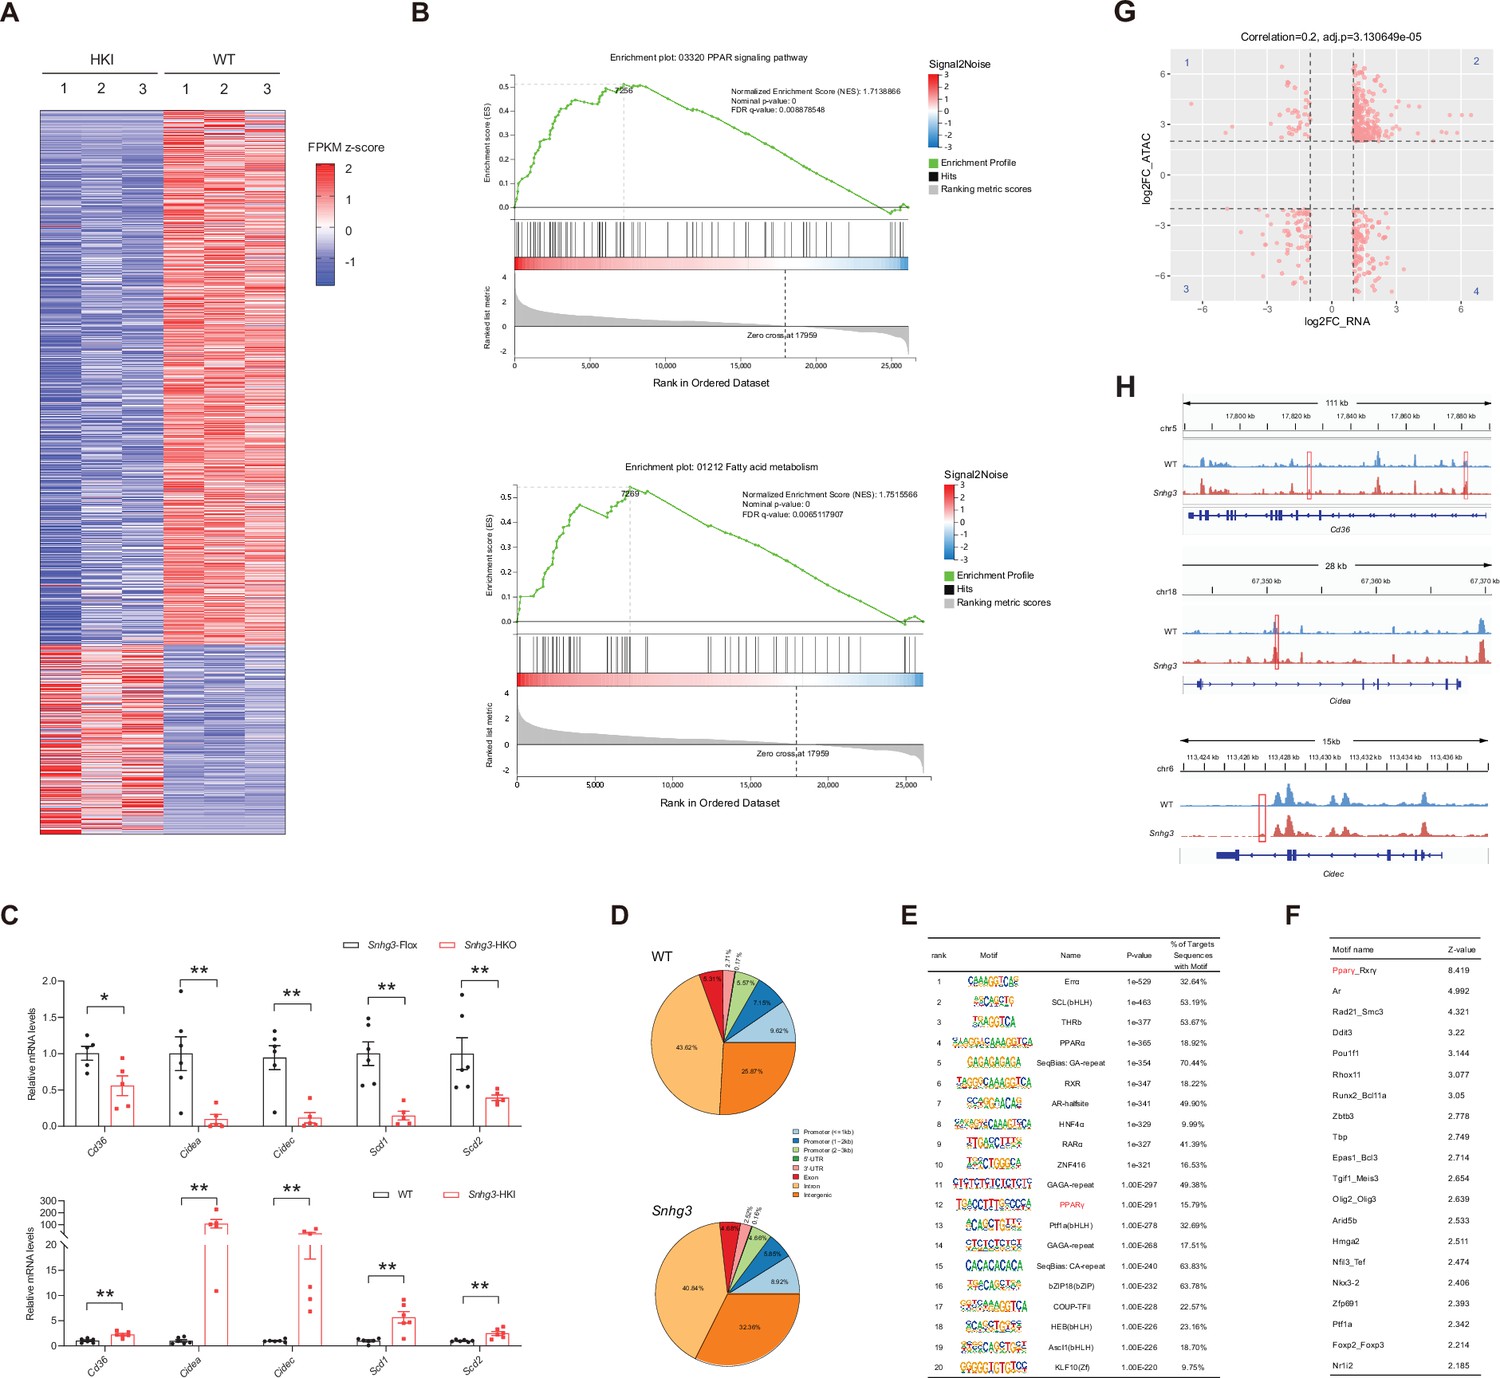
(A) Differentially expressed genes in livers of Snhg3-HKI and WT mice (n=3mice/group). (B) GSEA showing the enrichment of PPAR signaling pathway (up) and fatty acid metabolism (down) (KEGG pathway database) in livers of Snhg3-HKI and WT mice (n=3mice/group). (C) Relative hepatic mRNA levels of fatty acid metabolism were measured in Snhg3-HKO (up) mice and Snhg3-HKI mice (down) compared to the controls. (D) Genome distribution ratio of the differentially accessible regions in the liver between WT and Snhg3-HKI mice by ATAC-Seq. (E and F) The transcription factors analysis in the accessible regions of the liver of Snhg3-HKI mice by HOMER (E) and CREMA (F). (G) Integrated ATAC-Seq data with RNA-Seq data. (H) Chromatin accessibility at Cd36 and Cidea/c genes. Data are represented as mean ± SD. *p<0.05and **p<0.01 by Student’s t test.
-
Figure 4—source data 1
The hepatic differentially expressed genes between DIO Snhg3-HKI and control WT mice were determined using RNA-Seq for Figure 4A.
- https://cdn.elifesciences.org/articles/96988/elife-96988-fig4-data1-v1.xls
-
Figure 4—source data 2
The genome-wide chromatin accessibility in the liver of DIO Snhg3-HKI and WT mice was determined using ATAC-Seq, related to Figure 4D.
- https://cdn.elifesciences.org/articles/96988/elife-96988-fig4-data2-v1.xls
-
Figure 4—source data 3
The genes were associated specifically with the differentially accessible regions in genome in the liver between DIO Snhg3-HKI and WT mice, related to Figure 4D.
- https://cdn.elifesciences.org/articles/96988/elife-96988-fig4-data3-v1.xls
-
Figure 4—source data 4
The hepatic differentially expressed genes between DIO Snhg3-HKI and WT mice were correlated with open chromatin regions by integrated analyzing ATAC-Seq data with RNA-Seq data for Figure 4G.
- https://cdn.elifesciences.org/articles/96988/elife-96988-fig4-data4-v1.xls
Figure 4—figure supplement 1
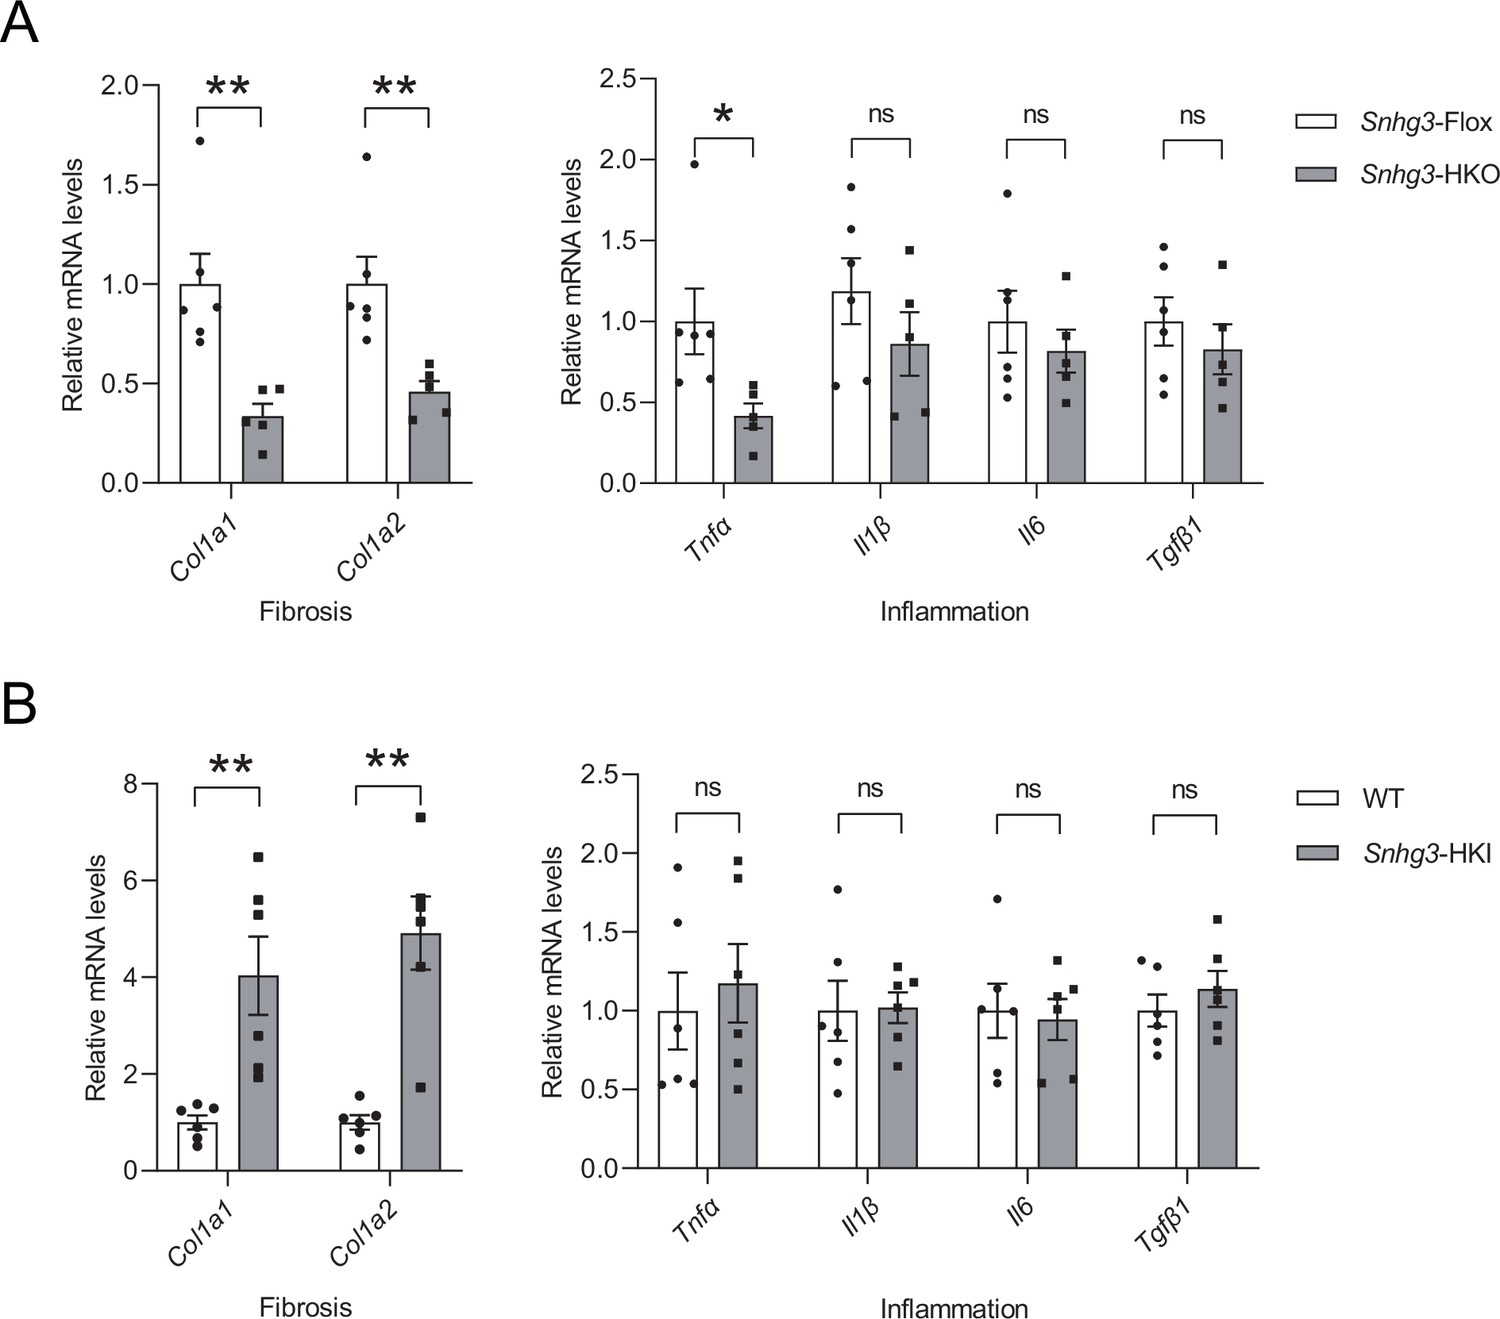
Snhg3 influences the expression of profibrotic genes, not pro-inflammatory factors.
The mRNA levels of liver fibrosis and inflammation in DIO Snhg3-HKO mice (A) and Snhg3-HKI mice (B), compared to the controls. Data are represented as mean ± SEM.*p<0.05 and **p<0.01 by Student’s t test.
Figure 5
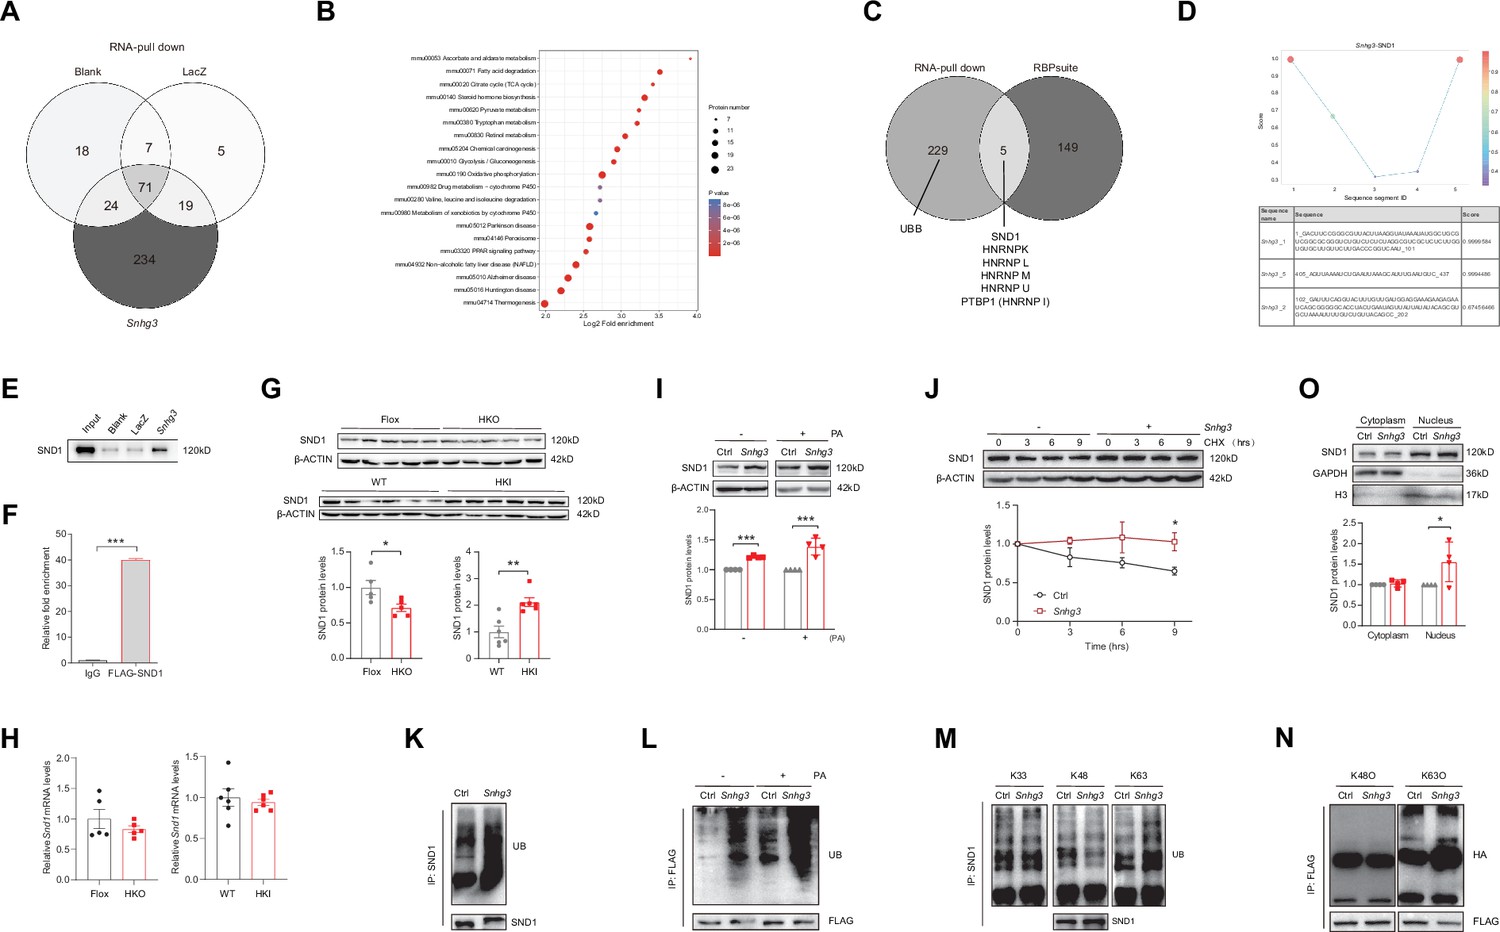
Snhg3 induces SND1 expression and enhances the stability of SND1 protein through physiologically interacting with SND1.
(A) Venn diagram of data from RNA pull-down and MS. (B) KEGG analysis of genes in specific Snhg3-binding proteins from RNA pull-down and MS. (C) Venn diagram of data from RNA pull-down and MS and bioinformatics predicted by RBPsuite. (D) SND1 interacts with different fragments of Snhg3 predicted by bioinformatics using RBPsuite. (E) RNA pull-down and western blotting confirms Snhg3 interacting with SND1. (F) RIP confirms SND1 interacting with Snhg3. (G and H) Relative protein (G, up, western blotting; down, quantitative result) and RNA (H) levels of Snd1 were measured in the liver. (I) Snhg3 enhanced the protein level of SND1 in Hepa1-6 cells (up, western blotting; down, quantitative result). (J) Snhg3 promoted the stability of SND1 protein in Hepa1-6 cells (up, western blotting; down, quantitative result). (K and L) Snhg3 promoted the ubiquitination of endogenous (K) and exogenous (L) SND1 protein in Hepa1-6 cells. (M and N) Snhg3 increased the K63-linked, not K48-linked and K33-linked, ubiquitination modification of endogenous (M) and exogenous (N) SND1 protein. (O) Snhg3 induced the nuclear localization of SND1 in Hepa1-6 cells (up, western blotting; down, quantitative result). Data are represented as mean ± SEM. *p<0.05and ***p<0.001 by two-way ANOVA (J) or Student’s t test (the others).
-
Figure 5—source data 1
Snhg3-bound proteins were identified in mouse primary hepatocytes by RNA-Pulldown-Mass spectrometry for Figure 5A.
- https://cdn.elifesciences.org/articles/96988/elife-96988-fig5-data1-v1.xls
-
Figure 5—source data 2
Snhg3-bound proteins were predicted by bioinformatic method (RBPsuite) for Figure 5C.
- https://cdn.elifesciences.org/articles/96988/elife-96988-fig5-data2-v1.xls
-
Figure 5—source data 3
PDF file containing original western blots for Figure 5E, indicating the relevant bands and treatments.
- https://cdn.elifesciences.org/articles/96988/elife-96988-fig5-data3-v1.pdf
-
Figure 5—source data 4
Original files for western blot analysis displayed in Figure 5E.
- https://cdn.elifesciences.org/articles/96988/elife-96988-fig5-data4-v1.zip
-
Figure 5—source data 5
PDF file containing original western blots for Figure 5G, indicating the relevant bands and treatments.
- https://cdn.elifesciences.org/articles/96988/elife-96988-fig5-data5-v1.pdf
-
Figure 5—source data 6
Original files for western blot analysis displayed in Figure 5G.
- https://cdn.elifesciences.org/articles/96988/elife-96988-fig5-data6-v1.zip
-
Figure 5—source data 7
PDF file containing original western blots for Figure 5I, indicating the relevant bands and treatments.
- https://cdn.elifesciences.org/articles/96988/elife-96988-fig5-data7-v1.pdf
-
Figure 5—source data 8
Original files for western blot analysis displayed in Figure 5I.
- https://cdn.elifesciences.org/articles/96988/elife-96988-fig5-data8-v1.zip
-
Figure 5—source data 9
PDF file containing original western blots for Figure 5J, indicating the relevant bands and treatments.
- https://cdn.elifesciences.org/articles/96988/elife-96988-fig5-data9-v1.pdf
-
Figure 5—source data 10
Original files for western blot analysis displayed in Figure 5J.
- https://cdn.elifesciences.org/articles/96988/elife-96988-fig5-data10-v1.zip
-
Figure 5—source data 11
PDF file containing original western blots for Figure 5K, indicating the relevant bands and treatments.
- https://cdn.elifesciences.org/articles/96988/elife-96988-fig5-data11-v1.pdf
-
Figure 5—source data 12
Original files for western blot analysis displayed in Figure 5K.
- https://cdn.elifesciences.org/articles/96988/elife-96988-fig5-data12-v1.zip
-
Figure 5—source data 13
PDF file containing original western blots for Figure 5L, indicating the relevant bands and treatments.
- https://cdn.elifesciences.org/articles/96988/elife-96988-fig5-data13-v1.pdf
-
Figure 5—source data 14
Original files for western blot analysis displayed in Figure 5L.
- https://cdn.elifesciences.org/articles/96988/elife-96988-fig5-data14-v1.zip
-
Figure 5—source data 15
PDF file containing original western blots for Figure 5M, indicating the relevant bands and treatments.
- https://cdn.elifesciences.org/articles/96988/elife-96988-fig5-data15-v1.pdf
-
Figure 5—source data 16
Original files for western blot analysis displayed in Figure 5M.
- https://cdn.elifesciences.org/articles/96988/elife-96988-fig5-data16-v1.zip
-
Figure 5—source data 17
PDF file containing original western blots for Figure 5N, indicating the relevant bands and treatments.
- https://cdn.elifesciences.org/articles/96988/elife-96988-fig5-data17-v1.pdf
-
Figure 5—source data 18
Original files for western blot analysis displayed in Figure 5N.
- https://cdn.elifesciences.org/articles/96988/elife-96988-fig5-data18-v1.zip
-
Figure 5—source data 19
PDF file containing original western blots for Figure 5O, indicating the relevant bands and treatments.
- https://cdn.elifesciences.org/articles/96988/elife-96988-fig5-data19-v1.pdf
-
Figure 5—source data 20
Original files for western blot analysis displayed in Figure 5O.
- https://cdn.elifesciences.org/articles/96988/elife-96988-fig5-data20-v1.zip
Figure 6
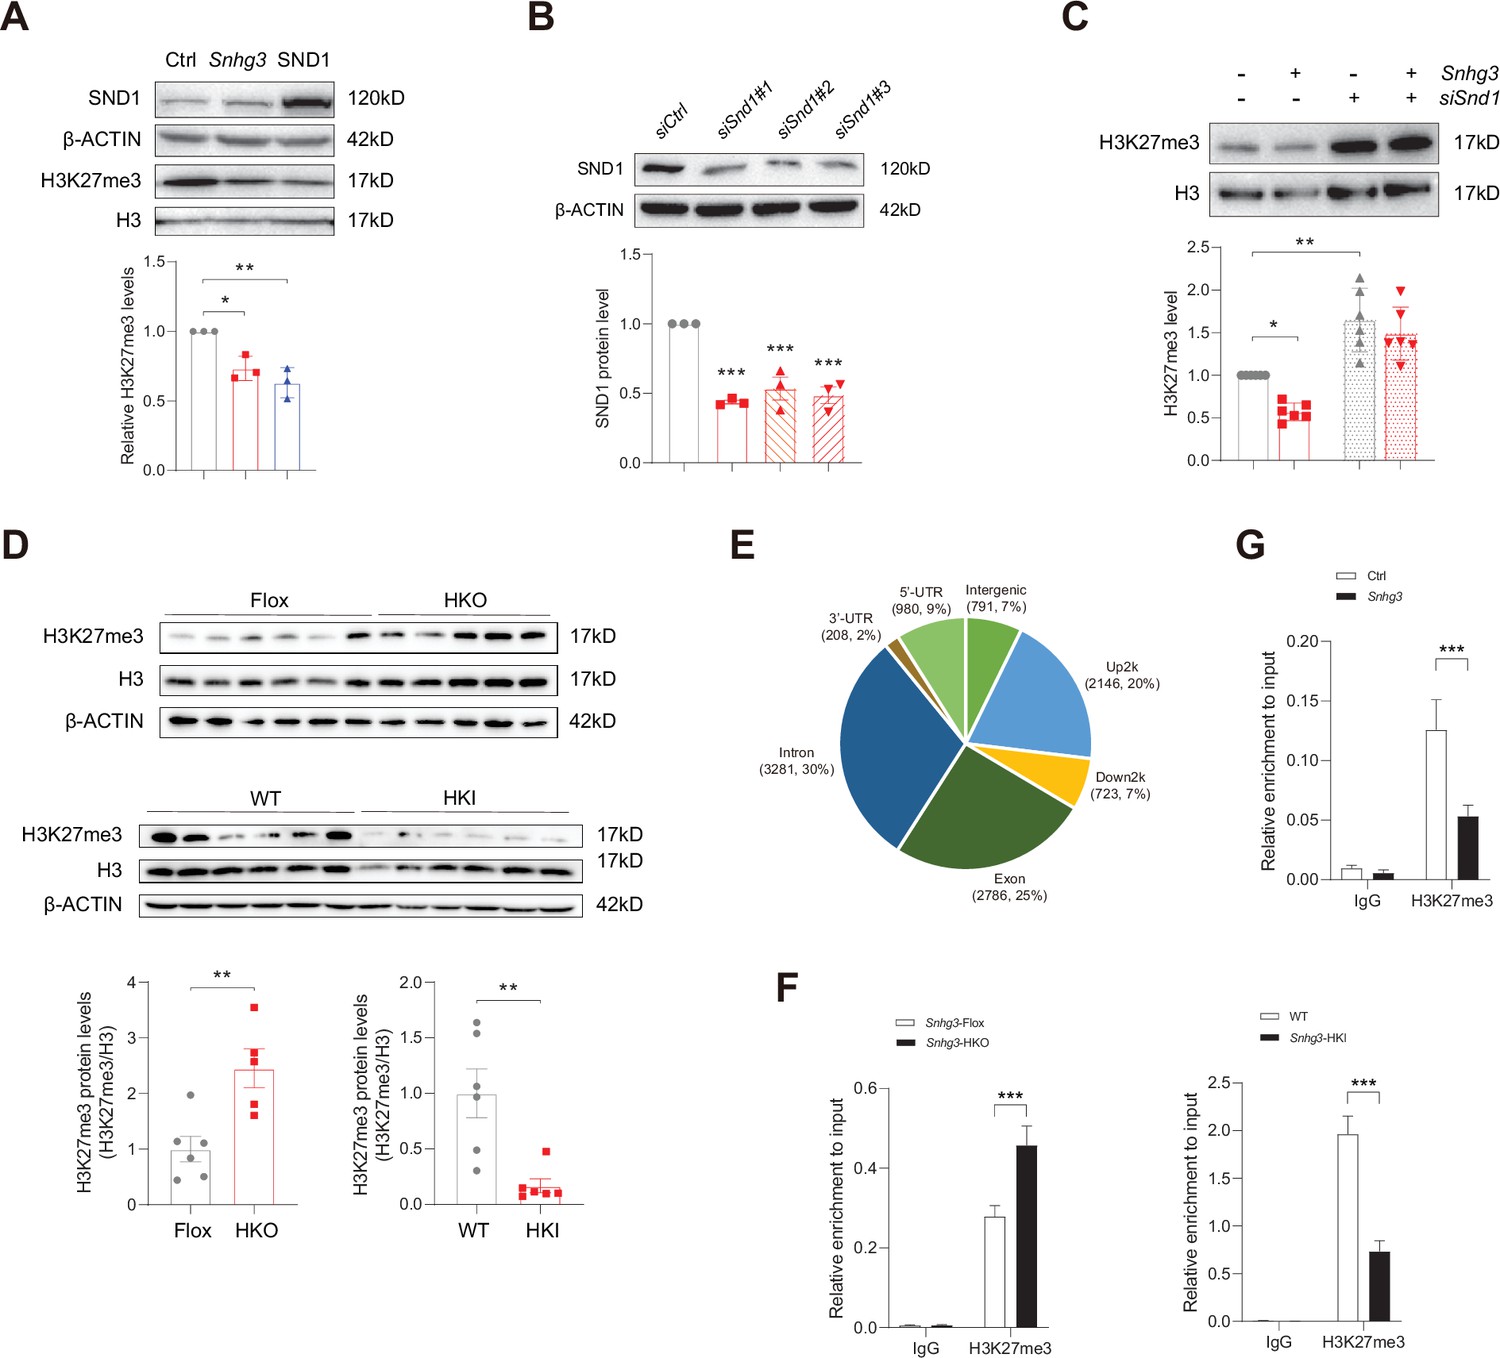
Snhg3 increases PPARγ expression through reducing H3K27me3 enrichment at Pparg promoter.
(A) Overexpression of Snhg3 or SND1 reduced the H3K27me3 level in Hepa1-6 cells with PA treatment (up, western blotting; down, quantitative result). (B) The expression of SND1 was disrupted with siRNA (up, western blotting; down, quantitative result). (C) Disruption SND1 expression reversed the Snhg3-induced decrease in H3K27me3 in primary hepatocytes (up, western blotting; down, quantitative result). (D) The H3K27me3 levels were measured in the liver of Snhg3-HKO and Snhg3-HKI mice (up, western blotting; down, quantitative result). (E) Genome distribution ratio of H3K27me3 enrichment genetic sequence in the liver of Snhg3-HKO mice. (F and G) ChIP result showed that Snhg3 affected H3K27me3 enrichment at Pparg promoter in vivo (F) and in vitro. (G) Data are represented as mean ± SEM. *p<0.05, **p<0.01and ***p<0.001 by one-way ANOVA (C) or by Student’s t test (the others).
-
Figure 6—source data 1
PDF file containing original western blots for Figure 6A, indicating the relevant bands and treatments.
- https://cdn.elifesciences.org/articles/96988/elife-96988-fig6-data1-v1.pdf
-
Figure 6—source data 2
Original files for western blot analysis displayed in Figure 6A.
- https://cdn.elifesciences.org/articles/96988/elife-96988-fig6-data2-v1.zip
-
Figure 6—source data 3
PDF file containing original western blots for Figure 6B, indicating the relevant bands and treatments.
- https://cdn.elifesciences.org/articles/96988/elife-96988-fig6-data3-v1.pdf
-
Figure 6—source data 4
Original files for western blot analysis displayed in Figure 6B.
- https://cdn.elifesciences.org/articles/96988/elife-96988-fig6-data4-v1.zip
-
Figure 6—source data 5
PDF file containing original western blots for Figure 6C, indicating the relevant bands and treatments.
- https://cdn.elifesciences.org/articles/96988/elife-96988-fig6-data5-v1.pdf
-
Figure 6—source data 6
Original files for western blot analysis displayed in Figure 6C.
- https://cdn.elifesciences.org/articles/96988/elife-96988-fig6-data6-v1.zip
-
Figure 6—source data 7
PDF file containing original western blots for Figure 6D, indicating the relevant bands and treatments.
- https://cdn.elifesciences.org/articles/96988/elife-96988-fig6-data7-v1.pdf
-
Figure 6—source data 8
Original files for western blot analysis displayed in Figure 6D.
- https://cdn.elifesciences.org/articles/96988/elife-96988-fig6-data8-v1.zip
-
Figure 6—source data 9
The H3K27me3 enrichment in the genome in the liver of DIO Snhg3-HKO mice were determined using the CUT&Tag-Seq, related to Figure 6E.
- https://cdn.elifesciences.org/articles/96988/elife-96988-fig6-data9-v1.xls
Figure 7 with 1 supplement
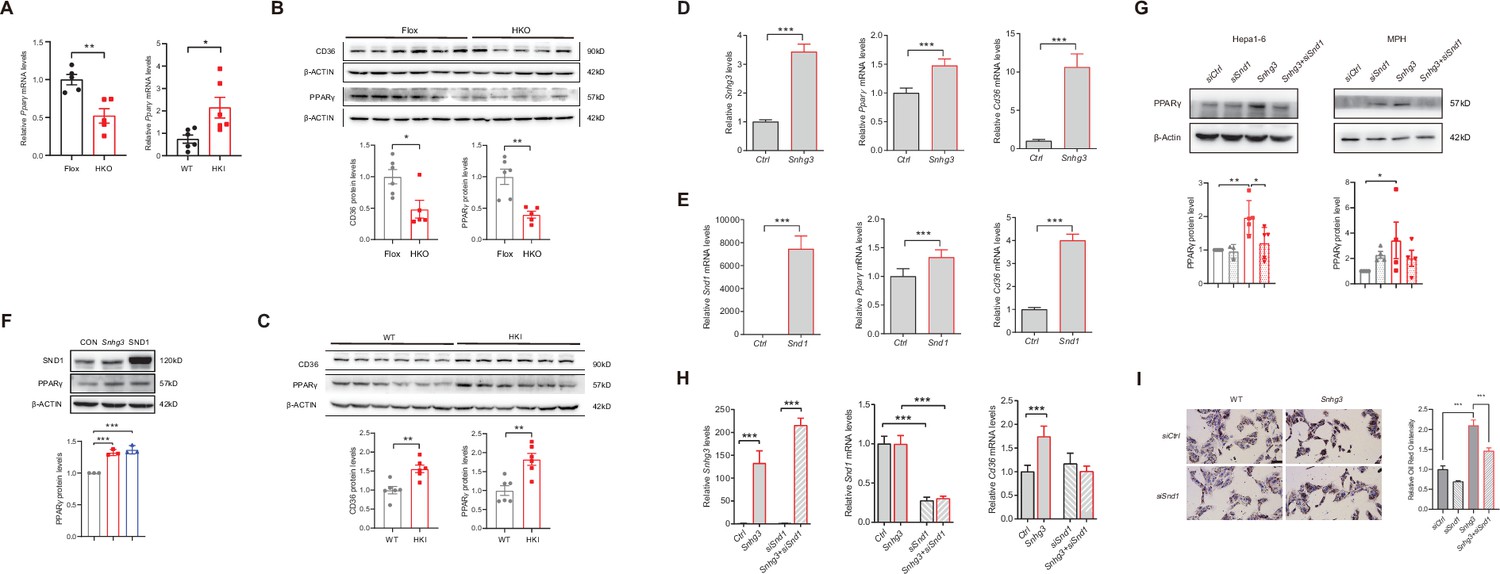
SND1 mediates Snhg3-induced PPARγ upregulation.
(A) The mRNA level of Pparg was measured in the liver of Snhg3-HKO (left) and Snhg3-HKI mice (right). (B) The protein level of PPARγ was measured in the liver of Snhg3-Flox and Snhg3-HKO mice (up, western blotting; down, quantitative result). (C) The protein level of PPARγ were measured in the liver of WT and Snhg3-HKI mice (up, western blotting; down, quantitative result). (D and E) Overexpression of Snhg3 (D) and SND1 (E) promoted the mRNA expression of Pparg and Cd36 in primary hepatocytes. (F) Overexpression of Snhg3 and SND1 increased the protein expression of PPARγ in Hepa1-6 cells (up, western blotting; down, quantitative result). (G) Disruption SND1 expression alleviated Snhg3-induced increase in the protein level of PPARγ in Hepa1-6 cells (left) and mouse primary hepatocytes (MPH, right) with PA treatment (up, western blotting; down, quantitative result). (H) Disruption SND1 expression alleviated Snhg3-induced increase in the mRNA levels of Pparg and Cd36 in Hepa1-6 cells with PA treatment. (I) Disruption SND1 expression alleviated Snhg3-induced increase in lipid accumulation (left, oil red O staining; right, quantitative result) in MPH with PA treatment. Data are represented as mean ± SEM. *p<0.05, **p<0.01and ***p<0.001 by one-way ANOVA (G–I) or by Student’s t test (the others).
-
Figure 7—source data 1
PDF file containing original western blots for Figure 7B, indicating the relevant bands and treatments.
- https://cdn.elifesciences.org/articles/96988/elife-96988-fig7-data1-v1.pdf
-
Figure 7—source data 2
Original files for western blot analysis displayed in Figure 7B.
- https://cdn.elifesciences.org/articles/96988/elife-96988-fig7-data2-v1.zip
-
Figure 7—source data 3
PDF file containing original western blots for Figure 7C, indicating the relevant bands and treatments.
- https://cdn.elifesciences.org/articles/96988/elife-96988-fig7-data3-v1.pdf
-
Figure 7—source data 4
Original files for western blot analysis displayed in Figure 7C.
- https://cdn.elifesciences.org/articles/96988/elife-96988-fig7-data4-v1.zip
-
Figure 7—source data 5
PDF file containing original western blots for Figure 7F, indicating the relevant bands and treatments.
- https://cdn.elifesciences.org/articles/96988/elife-96988-fig7-data5-v1.pdf
-
Figure 7—source data 6
Original files for western blot analysis displayed in Figure 7F.
- https://cdn.elifesciences.org/articles/96988/elife-96988-fig7-data6-v1.zip
-
Figure 7—source data 7
PDF file containing original western blots for Figure 7G, indicating the relevant bands and treatments.
- https://cdn.elifesciences.org/articles/96988/elife-96988-fig7-data7-v1.pdf
-
Figure 7—source data 8
Original files for western blot analysis displayed in Figure 7G.
- https://cdn.elifesciences.org/articles/96988/elife-96988-fig7-data8-v1.zip
Figure 7—figure supplement 1
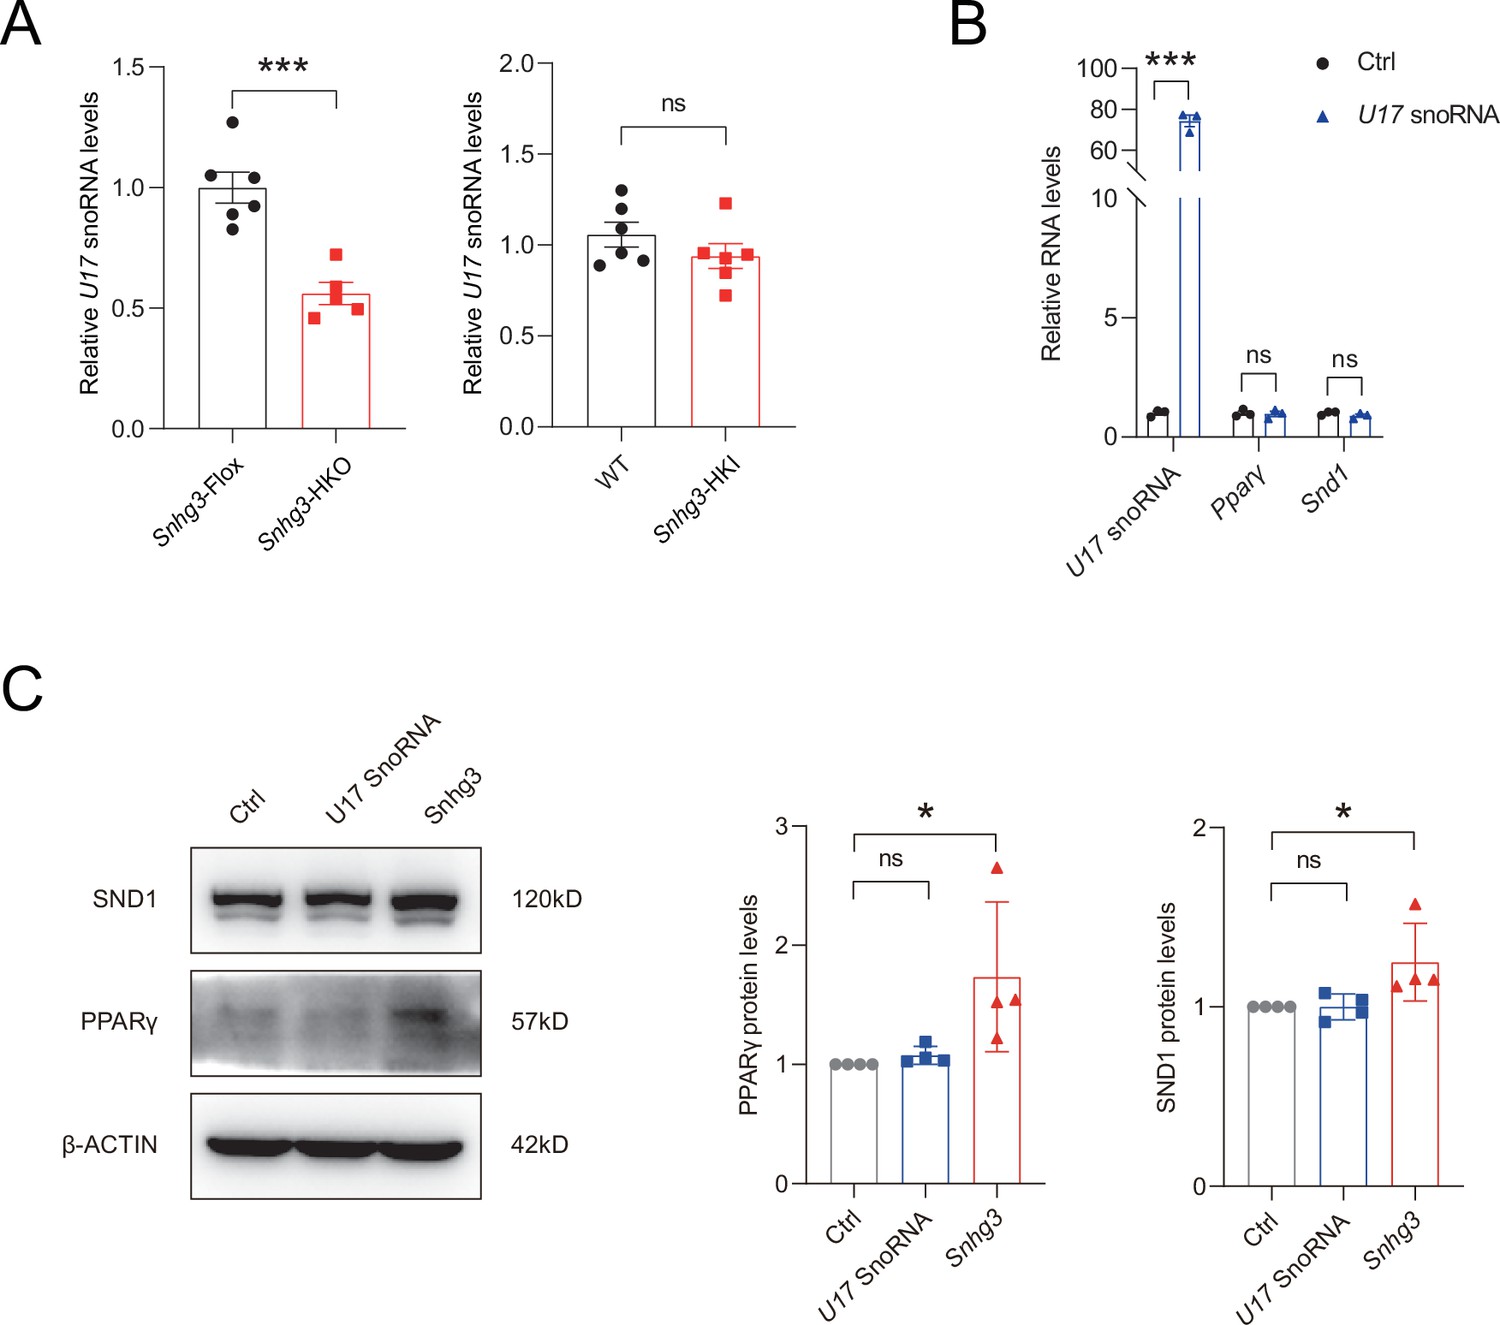
Sngh3-induced changes in PPARγ and SND1 are independent on U17 snoRNA.
(A) Hepatic U17 snoRNA expression in DIO Snhg3-HKO mice and Snhg3-HKI mice compared to the controls. (B and C) Overexpression U17 snoRNA has no effect on the mRNA (B) and protein (C) levels of PPARγ and SND1 (left, western blotting; right, quantitative result). Data are represented as mean ± SEM. *p<0.05and ***p<0.001 by Student’s t test.
-
Figure 7—figure supplement 1—source data 1
PDF file containing original western blots for Figure 7—figure supplement 1C, indicating the relevant bands and treatments.
- https://cdn.elifesciences.org/articles/96988/elife-96988-fig7-figsupp1-data1-v1.zip
-
Figure 7—figure supplement 1—source data 2
Original files for western blot analysis displayed in Figure 7—figure supplement 1C.
- https://cdn.elifesciences.org/articles/96988/elife-96988-fig7-figsupp1-data2-v1.zip
Figure 8 with 1 supplement
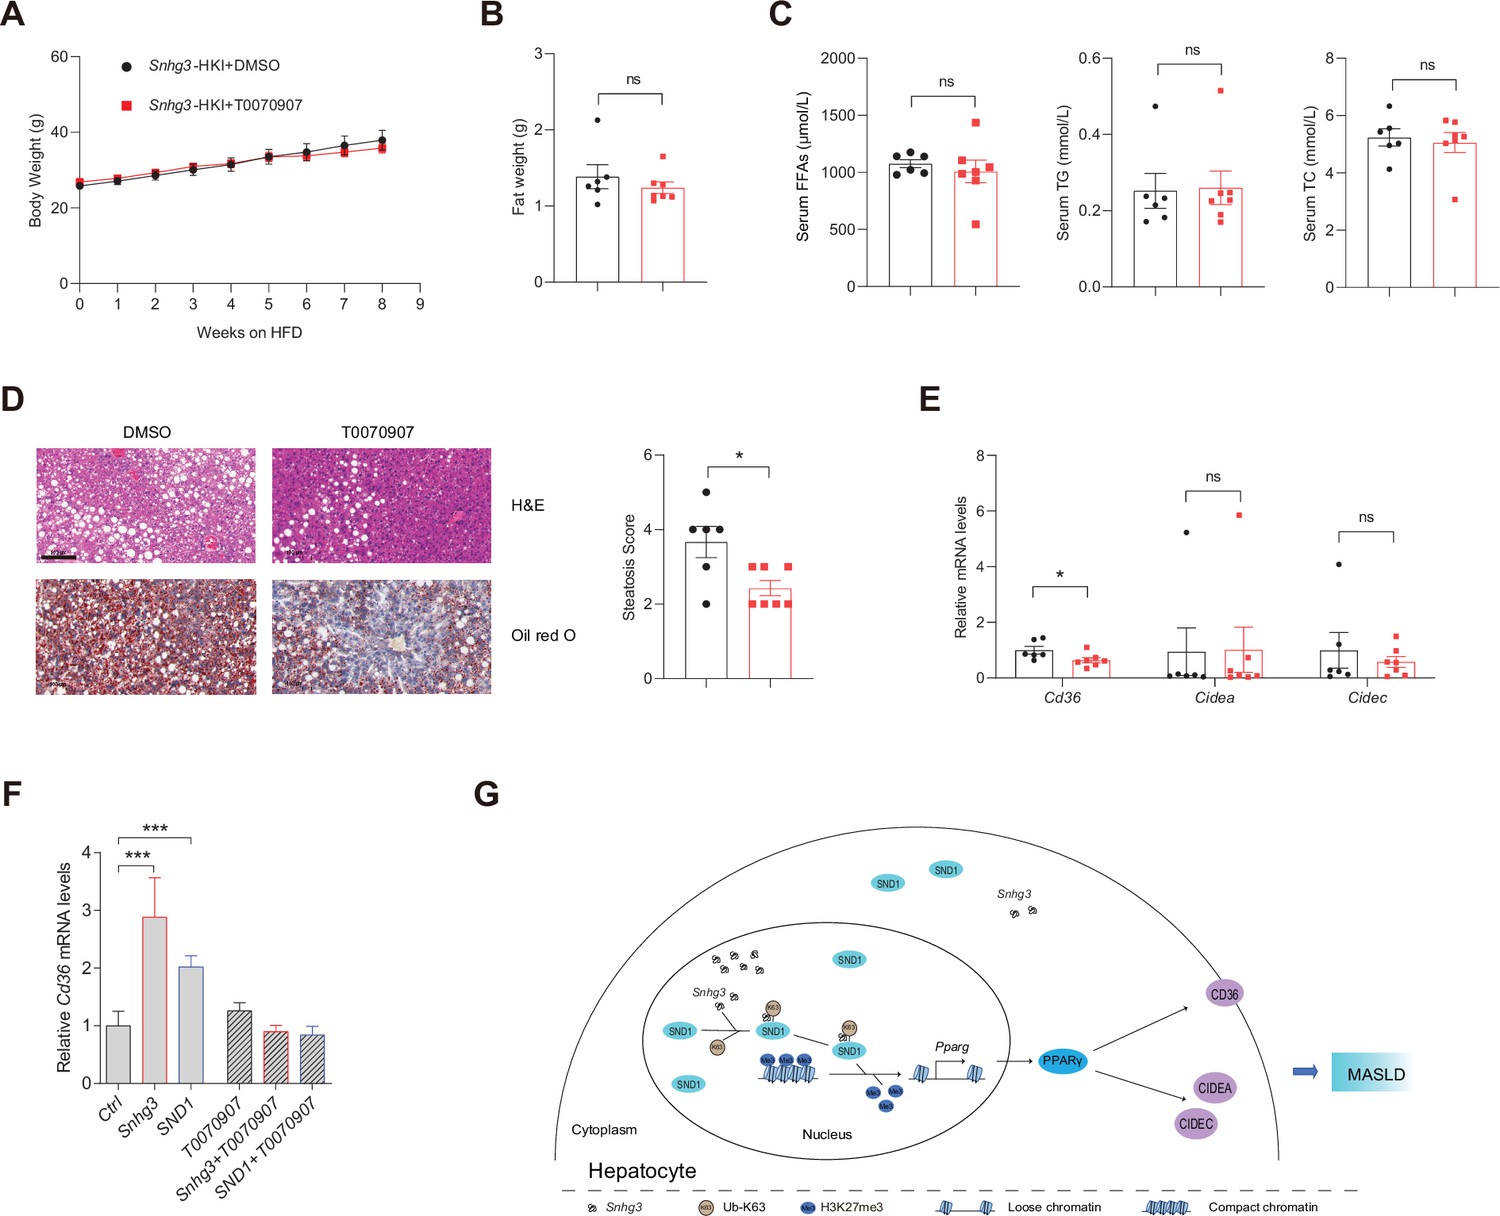
PPARγ mediates Snhg3-induced hepatic steatosis.
(A and B) Body weight (A) and liver weight (B) of Snhg3-HKI mice without (n=6) or with (n=7) T0070907 treatment for 8weeks. (C) Serum FFAs, TG and TG concentrations of mice as indicated in (A). (D) Hepatic H&E and oil red O staining (left) and NASH score (right) of mice as indicated in A. Scale bars, 100μm. (E) T0070907 mitigated the hepatic Cd36 and Cidea/c increase in Snhg3-HKI mice. (F) T0070907 disrupted Snhg3- and SND1-induced Cd36 increase in Hepa1-6 cells. (G) Model of how Snhg3 and SND1 interacting and influencing chromatin remodeling via H3K27me3, and promoting PPARγ expression thereby resulting in hepatic steatosis. Data are represented as mean ± SEM. *p<0.05and ***p<0.001 by two-way ANOVA (A) or by Student’s t test for the others.
Figure 8—figure supplement 1

Fat weight of Snhg3-HKI mice without (n=6) or with (n=7) T0070907 treatment for 8weeks.
Data are represented as mean ± SEM and are analyzed by Student’s t test.
Tables
Appendix 1—key resources table
| Reagent type (species) or resource | Designation | Source or reference | Identifiers | Additional information |
|---|---|---|---|---|
| Gene (M. musculus) | LncRNA Snhg3 | GenBank | NR_003270.2 | |
| Gene (M. musculus) | Snd1 | GenBank | NM_019776.2 | |
| Strain, strain background (Escherichia coli) | Trans5α | TransGen Biotech | Cat#CD201 | |
| Strain, strain background (M. musculus) | Snhg3flox/flox mice | This paper | Snhg3flox/flox mice were created using the CRISPR-Cas9 system at Cyagen Biosciences. | |
| Strain, strain background (M. musculus) | Hepatocyte-specific knock-in Snhg3 (Snhg3-HKI) mice | This paper | Snhg3-HKI mice were created using the CRISPR-Cas9 system at Cyagen Biosciences. | |
| Strain, strain background (M. musculus) | Alb-Cre transgenic mice | Cyagen | Cat#C001006 | |
| Strain, strain background (M. musculus) | C57BL/6 (Wild type) | HFK BIOSCIENCE | male | |
| Genetic reagent (Homo-sapiens) | Ad-SND1 (adenovirus) | WZ Biosciences | Cat#VH832073 | Adenovirus infect cells to express SND1 (human) |
| Genetic reagent (M. musculus) | Ad-Snhg3 (adenovirus) | This paper | N/A | Adenovirus infect cells to express Snhg3 (mouse) |
| Cell line (M. musculus) | Hepa 1–6 | ATCC | Cat#CRL-1830 | |
| Biological sample (M. musculus) | Primary hepatocytes | This paper | Freshly isolated from C57BL/6 | |
| Antibody | anti-GAPDH (Rabbit polyclonal) | CWBio | Cat#CW0100M; RRID: AB_2801390 | WB (1:1000) |
| Antibody | anti-β-Actin (Rabbit polyclonal) | Abclonal | Cat#AC026; RRID: AB_2768234 | WB (1:50000) |
| Antibody | anti-H3 (Rabbit polyclonal) | Abclonal | Cat#A17562; RRID: AB_2770395 | WB (1:1000) |
| Antibody | anti-H3K27me3 (Rabbit polyclonal) | Abclonal | Cat# A16199; RRID: AB_2763651 | WB (1:1000) IP (1:100) |
| Antibody | anti-SND1 (Rabbit polyclonal) | Abclonal | Cat#A5874; RRID: AB_2766623 | WB (1:1000) |
| Antibody | anti-SND1 (Mouse monoclonal) | Santa Cruz biotechnology | Cat#sc-166676; RRID: AB_2270808 | WB (1:500) IP (1:50) |
| Antibody | anti-PPARγ (Rabbit polyclonal) | Abclonal | Cat#A11183; RRID: AB_2758449 | WB (1:500) |
| Antibody | anti-CD36 (Rabbit polyclonal) | Abclonal | Cat#A14714; RRID: AB_2761590 | WB (1:1000) |
| Antibody | anti DDDDK-Tag (Mouse monoclonal) | Abclonal | Cat#AE005; RRID: AB_2770401 | WB (1:1000) IP (1:100) |
| Antibody | anti HA-Tag (Rabbit polyclonal) | Abclonal | Cat#AE036; RRID: AB_2771924 | WB (1:1000) |
| Antibody | anti-Ub (Rabbit polyclonal) | Abclonal | Cat#A19686; RRID: AB_2862735 | WB (1:1000) |
| Antibody | anti-Ub (K33) (Rabbit polyclonal) | Abclonal | Cat# A18199; RRID: AB_2861976 | WB (1:1000) |
| Antibody | anti-Ub (K48) (Rabbit polyclonal) | Abclonal | Cat#A18163; RRID: AB_2861948 | WB (1:1000) |
| Antibody | anti-Ub (K63) (Rabbit polyclonal) | Abclonal | Cat# A18164; RRID: AB_2861949 | WB (1:1000) |
| Antibody | Mouse Control IgG (Rabbit polyclonal) | Abclonal | Cat#AC011; RRID: AB_2770414 | WB (1:1000) IP (1:100) |
| Antibody | Rabbit Control IgG (Rabbit polyclonal) | Abclonal | Cat#AC005; RRID: AB_2771930 | WB (1:1000) IP (1:100) |
| Antibody | Goat anti-mouse IgG (H+L) (Rabbit polyclonal) | ZSGB-Bio | Cat#ZB-2305; RRID: AB_2747415 | WB (1:10000) |
| Antibody | Goat anti-rabbit IgG (H+L) (Rabbit polyclonal) | ZSGB-Bio | Cat#ZB-2306; RRID: AB_2868454 | WB (1:10000) |
| Recombinant DNA reagent | pcDNA3.1-mSnhg3 (Plasmid) | This paper | Plasmid construct to transfect and express the Snhg3 | |
| Recombinant DNA reagent | PGEM-Teasy-mSnhg3 (Plasmid) | This paper | Plasmid construct to cloning and amplification the Snhg3 | |
| Recombinant DNA reagent | pCMV3-Flag-mSND1 (Plasmid) | Sino Biological | Cat#MG52839-NF | Plasmid construct to transfect and express the SND1 |
| Recombinant DNA reagent | HA-Ub (Plasmid) | This paper | Plasmid construct to transfect and express the HA-UB | |
| Recombinant DNA reagent | HA-Ub (K48O) (Plasmid) | This paper | Plasmid construct to transfect and express the HA-UB (K48O) | |
| Recombinant DNA reagent | HA-Ub (K63O) (Plasmid) | This paper | Plasmid construct to transfect and express the HA-UB (K63O) | |
| Sequence-based reagent | Snhg3-F | This paper | verexpressing and adenoviral plasmid construction | ATATCGGGTACCGACTTCCGGGCGTTAC |
| Sequence-based reagent | Snhg3-R | This paper | verexpressing and adenoviral plasmid construction | ATGATCGAATTCAGACATTCAAATGCT |
| Sequence-based reagent | Snhg3-HKO-F | This paper | sgRNA target sequences for knockout mice construction | GTCGAATGGATGAGTTATGTGGG |
| Sequence-based reagent | Snhg3-HKO-R | This paper | sgRNA target sequences for knockout mice construction | GATATCCACGTTGGAATGTCTGG |
| Sequence-based reagent | Snhg3-HKO (mouse)-F | This paper | Primers for genotyping the transgenic mice | TCTGGAGTGTGAGATAGGAAACTG |
| Sequence-based reagent | Snhg3-HKO (mouse)-R | This paper | Primers for genotyping the transgenic mice | TCACTGAGGGTCTTAACTTTTCCAT |
| Sequence-based reagent | Snhg3-HKI (mouse)-F1 | This paper | Primers for genotyping the transgenic mice | CTCTACTGGAGGAGGACAAACTG |
| Sequence-based reagent | Snhg3-HKI (mouse)-F2 | This paper | Primers for genotyping the transgenic mice | GCATCTGACTTCTGGCTAATAAAG |
| Sequence-based reagent | Snhg3-HKI (mouse)-R | This paper | Primers for genotyping the transgenic mice | GTCTTCCACCTTTCTTCAGTTAGC |
| Sequence-based reagent | Alb-cre (mouse)-F1 | This paper | Primers for genotyping the transgenic mice | TGCAAACATCACATGCACAC |
| Sequence-based reagent | Alb-cre (mouse)-F2 | This paper | Primers for genotyping the transgenic mice | GAAGCAGAAGCTTAGGAAGATGG |
| Sequence-based reagent | Alb-cre (mouse)-R | This paper | Primers for genotyping the transgenic mice | TTGGCCCCTTACCATAACTG |
| Sequence-based reagent | siSnd1#1F | This paper | siRNA target sequences for knockdown cells construction | GAGAACAUGCGCAAUGACATT |
| Sequence-based reagent | siSnd1#1R | This paper | siRNA target sequences for knockdown cells construction | UGUCAUUGCGCAUGUUCUCTT |
| Sequence-based reagent | siSnd1#2F | This paper | siRNA target sequences for knockdown cells construction | GCAUGUCUUCUACAUCGACTT |
| Sequence-based reagent | siSnd1#2R | This paper | siRNA target sequences for knockdown cells construction | GUCGAUGUAGAAGACAUGCTT |
| Sequence-based reagent | siSnd1#3F | This paper | siRNA target sequences for knockdown cells construction | GUAUUGCCAGCUCAAGCCA CAGAGUAUTT |
| Sequence-based reagent | siSnd1#3R | This paper | siRNA target sequences for knockdown cells construction | AUACUCUGUGGCUUGAGCU GGCAAUACTT |
| Sequence-based reagent | siControl-F | This paper | siRNA target sequences for knockdown cells construction | UUCUCCGAACGUGUCACGUTT |
| Sequence-based reagent | siControl-R | This paper | siRNA target sequences for knockdown cells construction | ACGUGACACGUUCGGAGAATT |
| Sequence-based reagent | promoter region (+101 ~+ 420bp)-F | This paper | Primers of Pparγ promoter segment for ChIP-qPCR assay | TATTGGGTCGCGCGCAGCC |
| Sequence-based reagent | promoter region (+101 ~+ 420bp)-R | This paper | Primers of Pparγ promoter segment for ChIP-qPCR assay | ACACAGTCCTGTCAGAACG |
| Sequence-based reagent | Mouse β-Actin-F | This paper | Primers for qPCR | CCAGCCTTCCTTCTTGGGTAT |
| Sequence-based reagent | Mouse β-Actin-R | This paper | Primers for qPCR | TGCTGGAAGGTGGACAGTGAG |
| Sequence-based reagent | Mouse Gapdh-F | This paper | Primers for qPCR | GGAGAGTGTTTCCTCGTCCC |
| Sequence-based reagent | Mouse Gapdh-R | This paper | Primers for qPCR | ATGAAGGGGTCGTTGATGGC |
| Sequence-based reagent | Mouse Xist-F | This paper | Primers for qPCR | AGACTACAGGATGAATTTGGAGTC |
| Sequence-based reagent | Mouse Xist-R | This paper | Primers for qPCR | ATTGTTTGTCCCTTTGGGCTC |
| Sequence-based reagent | Mouse Neat1-F | This paper | Primers for qPCR | AGGAGTTAGTGACAAGGAGG |
| Sequence-based reagent | Mouse Neat1-R | This paper | Primers for qPCR | TGCCTTCCACACGTCCACTG |
| Sequence-based reagent | Mouse Snhg3-F | This paper | Primers for qPCR | CTCTCTAGGCGTCGCTCTCT |
| Sequence-based reagent | Mouse Snhg3-R | This paper | Primers for qPCR | CTTCTAATGGCCGAGGCTGT |
| Sequence-based reagent | Mouse Snd1-F | This paper | Primers for qPCR | CACCCTGACACTTCCAGTCC |
| Sequence-based reagent | Mouse Snd1-R | This paper | Primers for qPCR | ACAATTATGGCGCACCCAGA |
| Sequence-based reagent | Mouse Pparγ-F | This paper | Primers for qPCR | TCAGCTCTGTGGACCTCTCC |
| Sequence-based reagent | Mouse Pparγ-R | This paper | Primers for qPCR | ACCCCTTGCATCCTTCACAAG |
| Sequence-based reagent | Mouse Cd36-F | This paper | Primers for qPCR | GGAGCAACTGGTGGATGGTT |
| Sequence-based reagent | Mouse Cd36-R | This paper | Primers for qPCR | CTACGTGGCCCGGTTCTAAT |
| Sequence-based reagent | Mouse Cidea-F | This paper | Primers for qPCR | AGGCCGTGTTAAGGAATCTG |
| Sequence-based reagent | Mouse Cidea-R | This paper | Primers for qPCR | AACCAGCCTTTGGTGCTAGG |
| Sequence-based reagent | Mouse Cidec-F | This paper | Primers for qPCR | GTGTCCACTTGTGCCGTCTT |
| Sequence-based reagent | Mouse Cidec-R | This paper | Primers for qPCR | CTCGCTTGGTTGTCTTGATT |
| Sequence-based reagent | Mouse Scd1-F | This paper | Primers for qPCR | AGCTCTACACCTGCCTCTTCG |
| Sequence-based reagent | Mouse Scd1-R | This paper | Primers for qPCR | AGCCGTGCCTTGTAAGTTCTG |
| Sequence-based reagent | Mouse Scd2-F | This paper | Primers for qPCR | TACGGATATCGCCCCTACGA |
| Sequence-based reagent | Mouse Scd2-R | This paper | Primers for qPCR | GGAACTGCAAGACCCCACAC |
| Sequence-based reagent | Mouse Col1a1-F | This paper | Primers for qPCR | TTCAGCTTTGTGGACCTCCG |
| Sequence-based reagent | Mouse Col1a1-R | This paper | Primers for qPCR | GGACCCTTAGGCCATTGTGT |
| Sequence-based reagent | Mouse Il-1β-F | This paper | Primers for qPCR | ACAACTGCACTACAGGCTCC |
| Sequence-based reagent | Mouse Il-1β-R | This paper | Primers for qPCR | TGGGTGTGCCGTCTTTCATT |
| Sequence-based reagent | Mouse Tnf-α-F | This paper | Primers for qPCR | CGTCAGCCGATTTGCTATCT |
| Sequence-based reagent | Mouse Tnf-α-R | This paper | Primers for qPCR | CGGACTCCGCAAAGTCTAAG |
| Sequence-based reagent | Mouse Tgf-β1-F | This paper | Primers for qPCR | CCTCGAGACAGGCCATTTGT |
| Sequence-based reagent | Mouse Tgf-β1-R | This paper | Primers for qPCR | AAGGCCAGCTGACTGCTTT |
| Sequence-based reagent | Mouse Il-6-F | This paper | Primers for qPCR | AGTTGCCTTCTTGGGACTGA |
| Sequence-based reagent | Mouse Il-6-R | This paper | Primers for qPCR | TCCACGATTTCCCAGAGAAC |
| Sequence-based reagent | Mouse SnoRNA U17-F | This paper | Primers for qPCR | GTCCCTTTCCACAACGTTG |
| Sequence-based reagent | Mouse SnoRNA U17-R | This paper | Primers for qPCR | TTTCCTGCATGGTTTGTCTCC |
| Commercial assay or kit | BCA protein assay kit | LABLEAD | Cat#B5000 | |
| Commercial assay or kit | Lipofectamine 3000 Transfection Kit | Invitrogen | Cat#L3000-015 | |
| Commercial assay or kit | Seamless Assembly Cloning Kit | Abclonal | Cat#RM20523 | |
| Commercial assay or kit | High-Capacity cDNA Reverse Transcription Kit | Applied Biosystems | Cat#4368813 | |
| Commercial assay or kit | TIANprep Mini Plasmid Kit | TIANGEN | Cat#DP103-03 | |
| Commercial assay or kit | Endofree Maxi Plasmid Kit | TIANGEN | Cat#DP117 | |
| Commercial assay or kit | HiPure Gel Pure DNA Mini Kit | Magen | Cat#D2111-02 | |
| Commercial assay or kit | Equalbit 1x dsDNA HS Assay Kit | Vazyme | Cat#EQ121-01 | |
| Commercial assay or kit | Hyperactive Universal CUT&Tag Assay Kit for Illumina | Vazyme | Cat# TD903-01 | |
| Commercial assay or kit | TruePrep Index Kit V2 for Illumina | Vazyme | Cat#TD202 | |
| Commercial assay or kit | Sonication ChIP Kit | Abclonal | Cat#RK20258 | |
| Commercial assay or kit | RNA Immunoprecipitation(RIP) Kit | BersinBio | Cat#Bes5101 | |
| Commercial assay or kit | High Fatty Sample Total Cholesterol (TC) Content Assay Kit | APPLYGEN | Cat#E1026-105 | |
| Commercial assay or kit | High Fatty Sample Triglyceride(TG) Content Assay Kit | APPLYGEN | Cat#E1025-105 | |
| Commercial assay or kit | Mouse Insulin ELISA Kit | JINGMEI BIOTECHNOLOGY | JM-02862M1 | |
| Chemical compound, drug | Complete Tablets EDTA-free, EASYpack | Roche | Cat#4693132001 | |
| Chemical compound, drug | PMSF | Beyotime Biotechnology | Cat#ST506 | (1mM) |
| Chemical compound, drug | Palmitic acid (PA) | Sigma-Aldrich | Cat#P5585 | (1mM) |
| Chemical compound, drug | BSA (Fatty Acid & IgG Free, BioPremium) | Beyotime Biotechnology | Cat#ST025 | |
| Chemical compound, drug | Trizol | Invitrogen | Cat#15596018 | |
| Chemical compound, drug | Insulin | Sigma-Aldrich | Cat#I-5500 | |
| Chemical compound, drug | MG132 | AbMole | Cat#M1902 | (10μM) |
| Chemical compound, drug | Direct PCR Lysis Reagent (Tail) | Viagen Biotech | Cat#102T | |
| Chemical compound, drug | Collagenase II | Sigma-Aldrich | Cat#C6885-1G | (>100CDU/mL) |
| Chemical compound, drug | Oil Red O | Sigma-Aldrich | Cat#O0625 | |
| Chemical compound, drug | Biotin RNA Labelling Mix (Biotin-U) | Roche | Cat#11685597910 | |
| Chemical compound, drug | Yeast tRNA | Invitrogen | Cat#15401–011 | (100μg/mL) |
| Chemical compound, drug | Ribonucleoside Vanadyl Complexes (RVC) | Beyotime Biotechnology | Cat#R0107 | (400μM) |
| Chemical compound, drug | Recombinant RNase Inhibitor (RRI) | Takara | Cat#2313A | (100U/mL) |
| Chemical compound, drug | CA-630 (NP40) | Sigma-Aldrich | Cat#I3021 | (0.5%) |
| Chemical compound, drug | PPARγ antagonist (T0070907) | AbMole | Cat#M3044 | Primary hepatocytes were treated with T0070907 (15µM) mice injected intraperitoneally with T0070907 (1mg/kg) for 5days per week for 2months |
| Software, algorithm | SPSS statistics v17.0 | IBM Corporation | http://www.spss.com.hk/software/statistics/ | |
| Software, algorithm | ImageJ | ImageJ | https://imagej.nih.gov/ij/ | |
| Software, algorithm | GraphPad Prism 8 | GraphPad Software | https://www.graphpad.com/ | |
| Other | Mouse high fat diet | Research Diet | Cat#D12492 | Contain 60% fat for inducing obesity mice |
| Other | Disposable Iv indwelling needle | BD | Cat#381312 | For mouse liver perfusion vector |
Additional files
Download links
A two-part list of links to download the article, or parts of the article, in various formats.
Downloads (link to download the article as PDF)
Open citations (links to open the citations from this article in various online reference manager services)
Cite this article (links to download the citations from this article in formats compatible with various reference manager tools)
LncRNA Snhg3 aggravates hepatic steatosis via PPARγ signaling
eLife 13:RP96988.
https://doi.org/10.7554/eLife.96988.4


