The nanoscale organization of the Nipah virus fusion protein informs new membrane fusion mechanisms
- Institute of Parasitology, Faculty of Agricultural and Environmental Sciences, McGill University, Canada
- Mark Wainberg Center for Viral Diseases, Lady Davis Institute, Canada
Figures
Figure 1 with 2 supplements
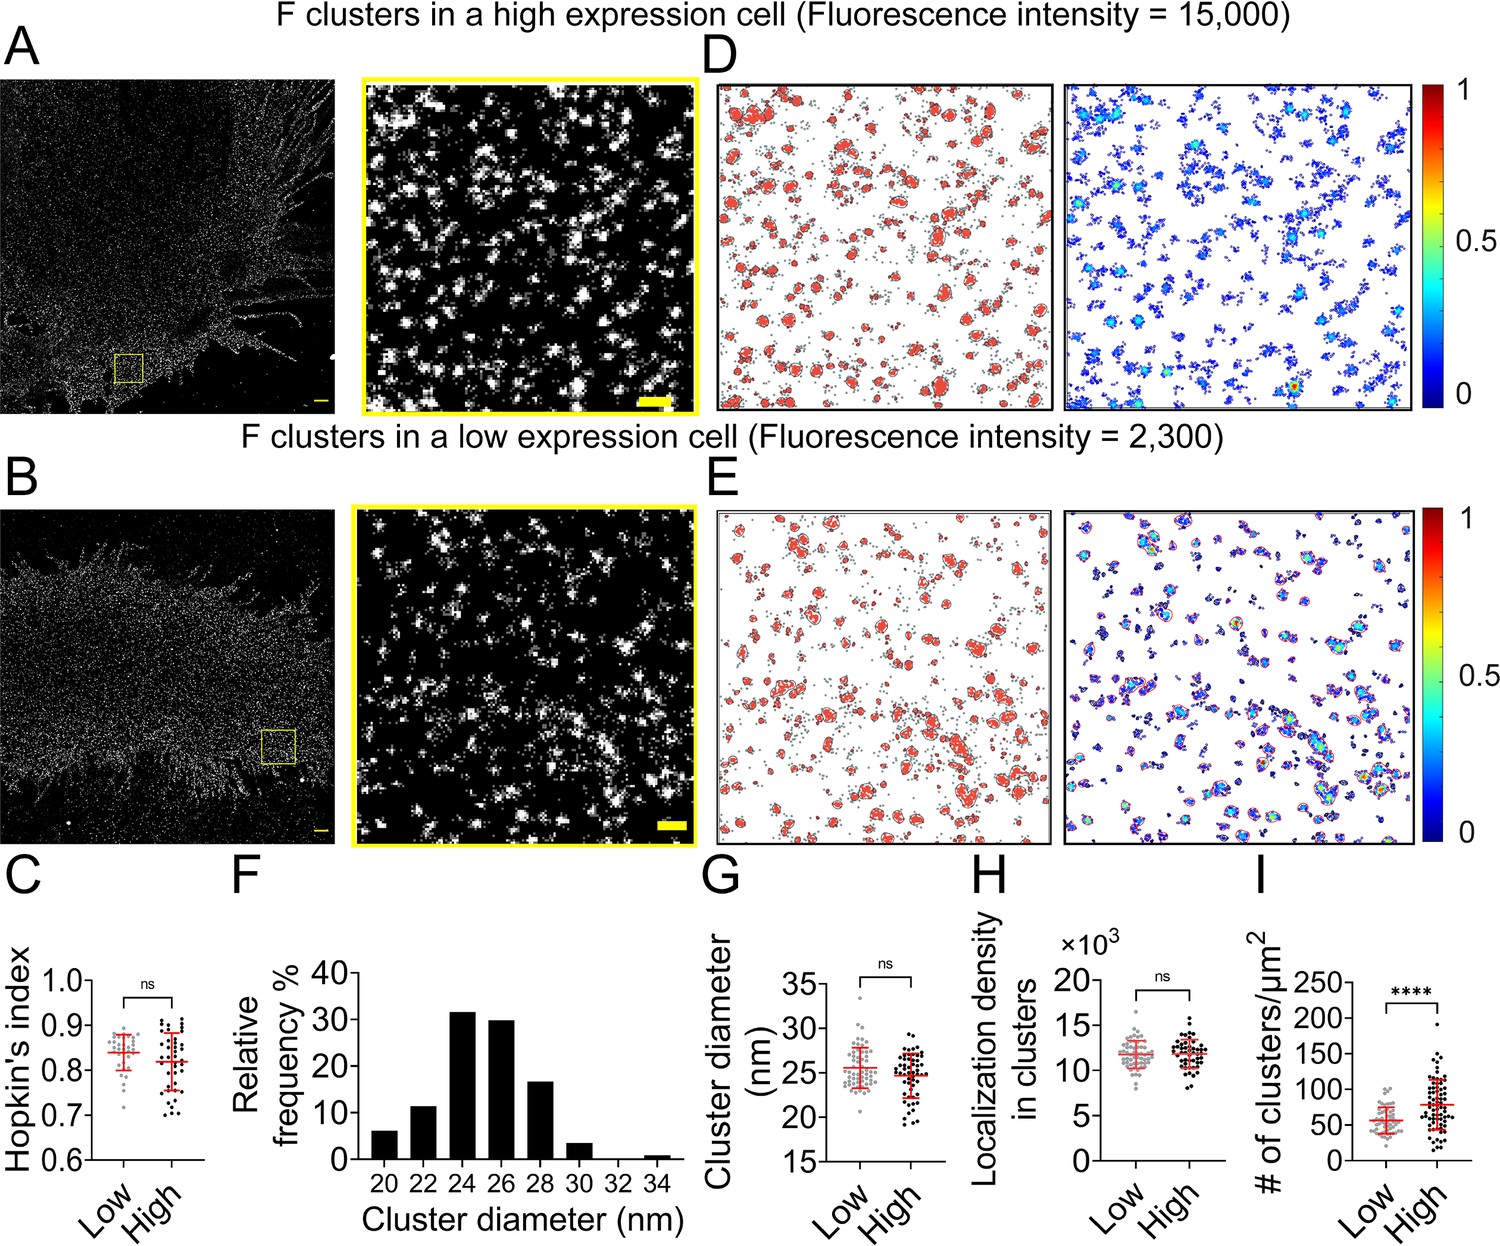
NiV-F forms regular-sized clusters that are not affected by the surface expression level.
Cross-section (Δz = 600 nm) of single-molecule localization microscopy (SMLM) images of NiV-F in high-expression (A) and low-expression (B) PK13 cells. Scale bar: 1 μm. The yellow boxed region is enlarged to show the detailed distribution pattern. Scale bar: 0.2 μm. (C) Hopkin’s index of the F localizations in low- and high-expression cells. p = 0.0927; n = 35 and 40. (D, E) Cluster maps (left) and localization density maps (right) of the enlarged regions in A and B. Cluster contours are highlighted with gray lines. Normalized relative density is pseudocolored according to the scale on the right. (F) The percentage distribution of the NiV-F cluster diameter from 13 cells. n = 114. (G) The cluster diameters in low- and high-expression cells. p = 0.2739; n = 58 and 56. (H) The localization density (# of localizations per μm2) within clusters in low- and high-expression cells. p = 0.7602; n = 58 and 50. (I) The number of clusters per μm2 in low- and high-expression cells. p < 0.0001; n = 59 and 74. The cut-off fluorescence intensity for low- and high-expression cells is 8000 (Arb. Unit). Sample size n is the number of total regions from six to eight cells. Bars represent mean ± SD. p value was obtained using the Mann–Whitney test. ns: p > 0.05; ****p < 0.0001.
-
Figure 1—source data 1
Related to Figure 1A.
- https://cdn.elifesciences.org/articles/97017/elife-97017-fig1-data1-v1.jpg
-
Figure 1—source data 2
Related to Figure 1B.
- https://cdn.elifesciences.org/articles/97017/elife-97017-fig1-data2-v1.jpg
-
Figure 1—source data 3
Related to Figure 1D.
- https://cdn.elifesciences.org/articles/97017/elife-97017-fig1-data3-v1.zip
-
Figure 1—source data 4
Related to Figure 1E.
- https://cdn.elifesciences.org/articles/97017/elife-97017-fig1-data4-v1.zip
-
Figure 1—source data 5
Related to Figure 1C–I.
- https://cdn.elifesciences.org/articles/97017/elife-97017-fig1-data5-v1.xlsx
Figure 1—figure supplement 1
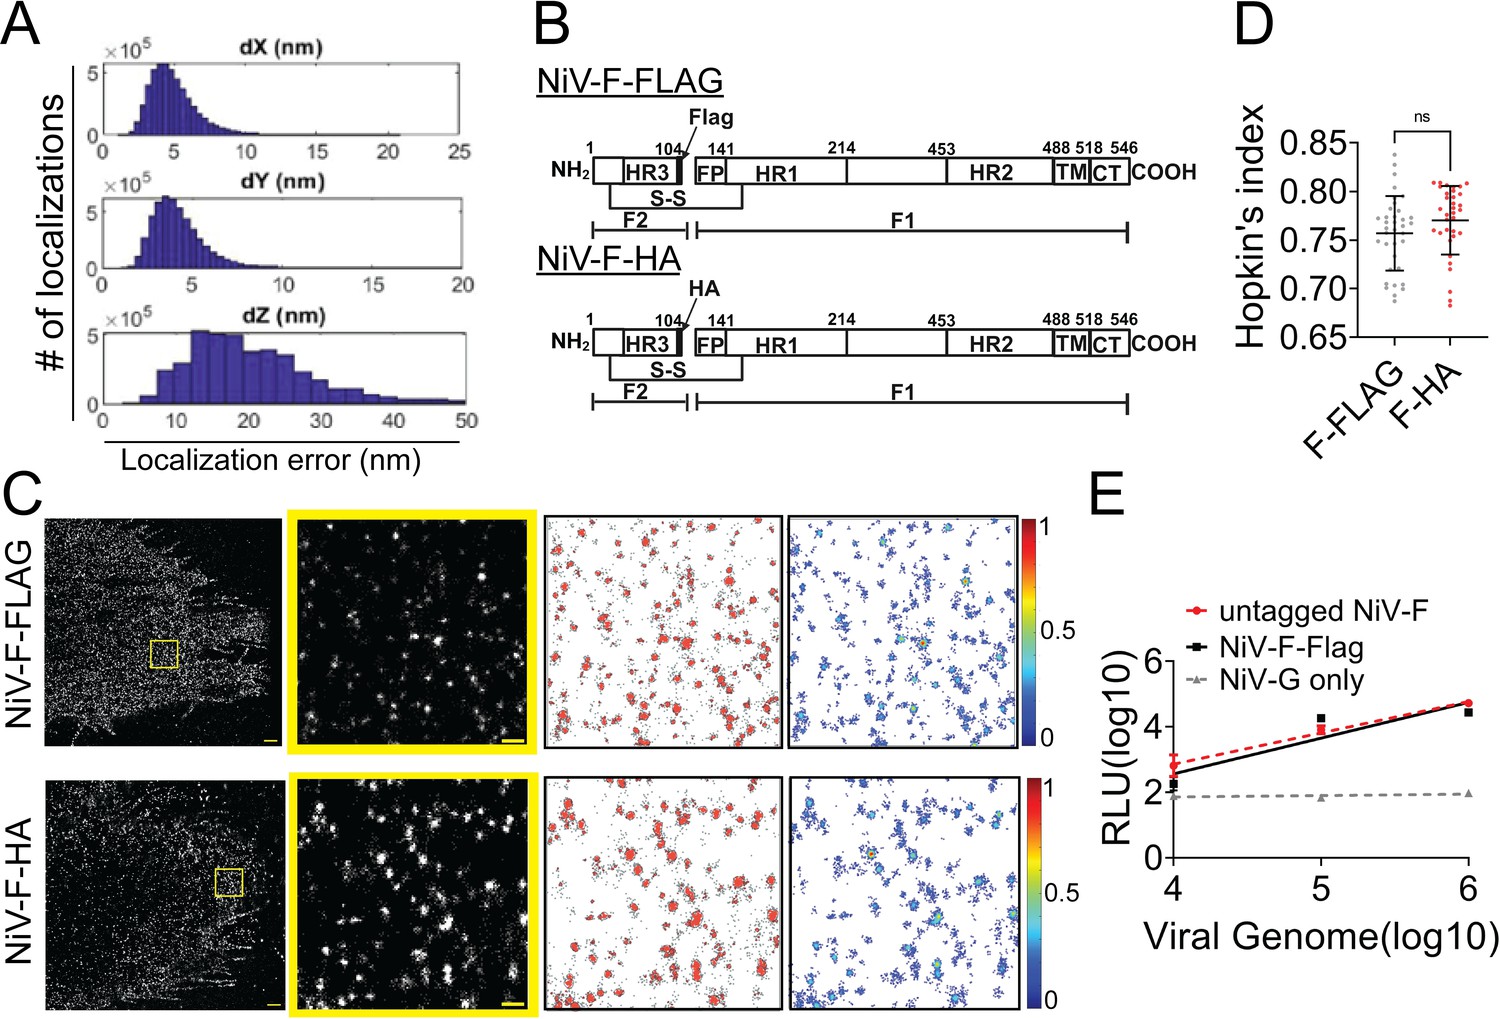
A comparison of clusters formed by NiV-F-FLAG and NiV-F-HA on PK13 cells and resolved by single-molecule localization microscopy (SMLM).
(A) The localization precision of the custom-built SMLM. The distribution of localization error at the x (dX), y (dY), and z (dZ) directions of blinks generated from Alexa Fluor 647 bound to NiV-F expressed on the plasma membrane of PK13 cells. The lateral precision is <10 nm and the axial precision is <20 nm. (B) A diagram of NiV-F-FLAG (top) and NiV-F-HA (bottom) constructs. Both tags were inserted after amino acid 104 of NiV-F. (C) First column: Cross-section (Δz = 600 nm) of SMLM images of NiV-F-FLAG (top) and NiV-F-HA (bottom) in PK13 cells. Scale bar: 1 μm. Second column: The yellow boxed region is enlarged to show the detailed distribution pattern. Scale bar: 0.2 μm. Third column: Cluster maps of the enlarged regions. Fourth column: Localization density maps show the normalized relative density of the enlarged regions. (D) Hopkin’s index of the NiV-F-FLAG and NiV-F-HA localizations in PK13 cells. p = 0.0675, n = 36 and 34. Sample size n is the number of total regions from four cells. Bars represent mean ± SD. p value was obtained using the Mann–Whitney test. ns: p > 0.05. (E) The entry of VSV/NiV pseudoviruses expressing NiV-G with untagged NiV-F (red), NiV-F-FLAG (black), and pcDNA 3 vector (NC; gray) in Vero cells. Data shown are mean ± SEM from one representative experiment (of three).
-
Figure 1—figure supplement 1—source data 1
Related to Figure 1—figure supplement 1C.
- https://cdn.elifesciences.org/articles/97017/elife-97017-fig1-figsupp1-data1-v1.zip
-
Figure 1—figure supplement 1—source data 2
Related to Figure 1—figure supplement 1D.
- https://cdn.elifesciences.org/articles/97017/elife-97017-fig1-figsupp1-data2-v1.xlsx
-
Figure 1—figure supplement 1—source data 3
Related to Figure 1—figure supplement 1E.
- https://cdn.elifesciences.org/articles/97017/elife-97017-fig1-figsupp1-data3-v1.xlsx
Figure 1—figure supplement 2
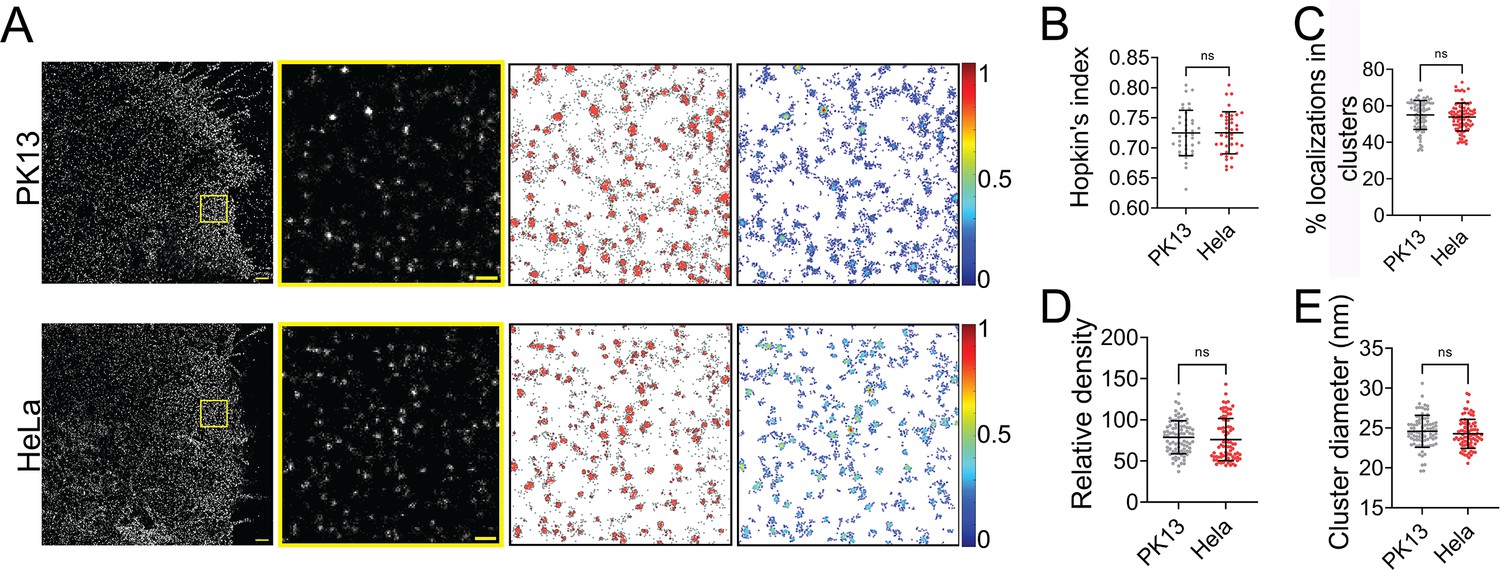
The nanoscale organization of NiV-F is similar in PK13 and HeLa cells.
(A) First column: Cross-section (Δz = 600 nm) of single-molecule localization microscopy (SMLM) images of NiV-F in PK13 (top) and HeLa (bottom) cells. Scale bar: 1 μm. Second column: The yellow boxed region is enlarged to show the detailed distribution pattern. Scale bar: 0.2 μm. Third column: Cluster maps of the localizations in the enlarged region. Fourth column: Localization density maps show the normalized relative density of the enlarged regions. Quantitative analyses of clustering of NiV-F in PK13 and HeLa: (B) Hopkin’s index, p = 0.9773; n = 38 and 38; (C) percentage of localizations in clusters, p = 0.1150; n = 84 and 90; (D) relative density, p = 0.1764; n = 83 and 82; (E) average cluster diameters, p = 0.1666; n = 84 and 84. Bars represent mean ± SD. Sample size n is the number of total regions from 4 to 10 cells. p value was obtained using the Mann–Whitney test. ns: p > 0.05.
-
Figure 1—figure supplement 2—source data 1
Related to Figure 1—figure supplement 2A.
- https://cdn.elifesciences.org/articles/97017/elife-97017-fig1-figsupp2-data1-v1.zip
-
Figure 1—figure supplement 2—source data 2
Related to Figure 1—figure supplement 2B–E.
- https://cdn.elifesciences.org/articles/97017/elife-97017-fig1-figsupp2-data2-v1.xlsx
Figure 2 with 1 supplement
Endosomal cleavage does not affect the nanoscale distribution of NiV-F.
(A) First column: Cross-section (Δz = 600 nm) of single-molecule localization microscopy (SMLM) images of NiV-F in HeLa cells untreated (NC) and treated with 20 μM E64d (E64d). HeLa cells were co-transfected by expression plasmids coding for NiV-G and NiV-F. Twenty μM E64d or the same volume of solvent methanol was added to cells at 2 hr post-transfection. Scale bar: 1 μm. Second column: The yellow boxed region in the first column is enlarged to show individual clusters. Scale bar: 0.2 μm. Third column: Cluster maps from the enlarged regions. Fourth column: Localization density maps show the normalized relative density of the enlarged regions. Quantitative analyses of NiV-F clusters formed in HeLa cells without (NC) and with (E64d) the E64d treatment: (B) Hopkin’s index, p = 0.1774; n = 40 and 40; (C) percentage of localizations in clusters, p = 0.7343; n = 101 and 101; (D) relative density, p = 0.6878; n = 100 and 103; (E) average cluster diameters, p = 0.5769; n = 100 and 101; (F) total density of the region, p = 0.5439; n = 101 and 102. Bars represent mean ± SD. p value was obtained using Mann–Whitney test. ns: p > 0.05. Sample size n is the number of total regions from 4 to 10 cells.
-
Figure 2—source data 1
Related to Figure 2A.
- https://cdn.elifesciences.org/articles/97017/elife-97017-fig2-data1-v1.zip
-
Figure 2—source data 2
Related to Figure 2B–F.
- https://cdn.elifesciences.org/articles/97017/elife-97017-fig2-data2-v1.xlsx
Figure 2—figure supplement 1
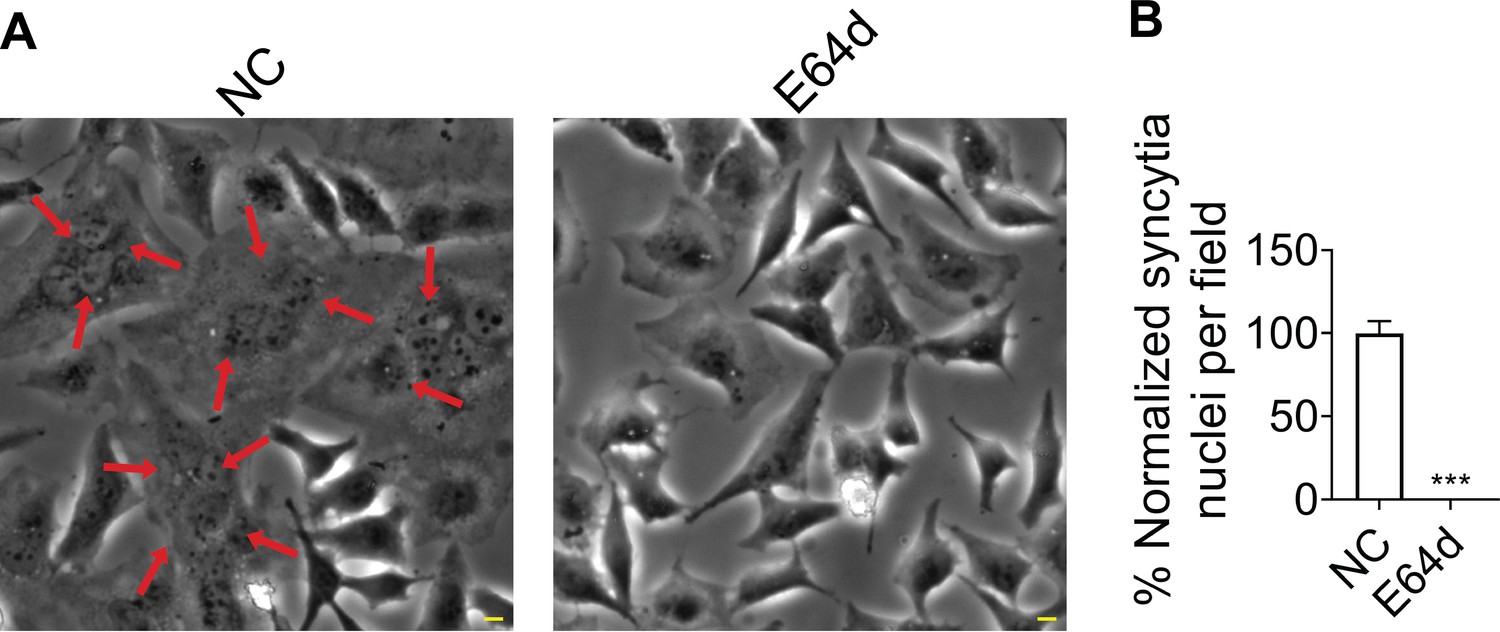
E64d treatment inhibits cell–cell fusion induced by NiV-F and -G.
(A) Representative images of cell–cell fusion induced by NiV-G and NiV-F without (NC) or with (E64d) the treatment of 20 μM E64d in HeLa cells. Cells were co-transfected by expression plasmids coding for NiV-G and NiV-F, at 3 hr post-transfection, 20 μM E64d or the same volume of solvent methanol was added to cells. Cells were fixed at 18 hr post-transfection and observed under ×20 magnification. Scale bar = 10 μm. (B) Cell–cell fusion levels normalized to that of the untreated HeLa cells (NC). Five fields per experiment were counted from three independent experiments. Bars represent mean ± SEM. ***p = 0.0002. p value was obtained using Welch’s t-test.
-
Figure 2—figure supplement 1—source data 1
Related to Figure 2—figure supplement 1A.
- https://cdn.elifesciences.org/articles/97017/elife-97017-fig2-figsupp1-data1-v1.zip
-
Figure 2—figure supplement 1—source data 2
Related to Figure 2—figure supplement 1B.
- https://cdn.elifesciences.org/articles/97017/elife-97017-fig2-figsupp1-data2-v1.xlsx
Figure 3 with 1 supplement
Mutations at the NiV-F hexameric interface affect its nano-organization.
(A) First column: Cross-section (Δz = 600 nm) of single-molecule localization microscopy (SMLM) images of the FLAG-tagged NiV-F-WT (WT), L53D, V108D, and Q393L on PK13 cell membrane. Scale bar: 1 μm. Second column: The yellow boxed regions in the first column are enlarged to show individual clusters. Scale bar: 0.2 μm. Third column: Cluster maps from enlarged regions. Fourth column: Localization density maps show normalized relative density of the enlarged regions. Quantitative analyses of the distribution of the FLAG-tagged NiV-F constructs: (B) Hopkin’s index, p = 0.0034, 0.0029, and 0.0448; n = 57–70; (C) percentage of localizations in clusters, p < 0.0001, <0.0001, and =0.9880; n = 106–198; (D) relative density, p = 0.0015, 0.0100, and 0.2244; n = 90–187; (E) average cluster diameters, p < 0.0001, <0.0001, and =0.0617; n = 106–198; (F) total density of the region (a ratio of total localizations in a region to the size of the region), p = 0.5726, 0.3097, and 0.8209; n = 106–243. Bars represent mean ± SD. Sample size n is the number of total regions from 11 to 20 cells. p value was obtained using Mann–Whitney test. ns: p > 0.05; *p < 0.05; **p < 0.01; ****p < 0.0001.
-
Figure 3—source data 1
Related to Figure 3A.
- https://cdn.elifesciences.org/articles/97017/elife-97017-fig3-data1-v1.zip
-
Figure 3—source data 2
Related to Figure 3B.
- https://cdn.elifesciences.org/articles/97017/elife-97017-fig3-data2-v1.xlsx
-
Figure 3—source data 3
Related to Figure 3C–F.
- https://cdn.elifesciences.org/articles/97017/elife-97017-fig3-data3-v1.xlsx
Figure 3—figure supplement 1
The fusion ability, expression levels, and processing of FLAG-tagged NiV-F and hexameric mutants.
(A) Representative images of 293T cell–cell fusion induced by NiV-G and NiV-F-WT, L53D, V108D, or Q393L. 293T cells were co-transfected with plasmids coding for NiV-G and empty vector (NC) or NiV-F constructs. Cells were fixed at 18 hr post-transfection. Arrows point to syncytia. Scale bar: 10 μm. (B) Relative levels of 293T cell–cell fusion in (A). Five fields per experiment were counted from three independent experiments. Data are presented as mean ± SEM. p value was obtained by Welch’s test. *p < 0.05; ****p < 0.0001. (C) The cell surface expression levels of NiV-F-WT, L53D, V108D, and Q393L on 293T cells were measured by flow cytometry. Mean fluorescence intensity (MFI) values were calculated by FlowJo and were normalized to that of F-WT. Data are presented as mean ± SEM of three independent experiments. Statistical significance was determined by the unpaired t-test with Welch’s correction (ns: p > 0.05). Values were compared to that of the NiV-F-WT. (D) NiV-F processing of F-WT, L53D, V108D, Q393L in 293T cells. 293T cells were transfected by F-WT and the mutants. The cell lysates were analyzed on sodium dodecyl sulfate–polyacrylamide gel electrophoresis (SDS–PAGE) followed by western blotting after 28 hr post-transfection. F0 and F2 were probed by M2 monoclonal mouse anti-FLAG antibody. GAPDH was probed by monoclonal mouse anti-GAPDH. (E) Relative entry levels of VSV/NiV pseudovirions expressing NiV-G-HA and NiV-F-FLAG (WT; solid black line) or FLAG-tagged NiV-F-L53D (L53D), V108D (V108D), or Q393L (Q393L; dotted red line). The negative control (NC), the recombinant VSV pseudoviruses without glycoproteins, is shown as a dotted gray line. The relative light units (RLUs) of the lysates of infected Vero cells were quantified 18–24 hr post-infection and plotted against the number of viral genomes/ml over 3 logs of viral input. Data shown are mean ± SEM from one representative experiment (of three). (F) The result of a representative western blot analysis of VSV/NiV pseudovirions. 4 × 10⁸ copies VSV/NiV pseudovirions were separated by a denaturing 10% SDS–PAGE and probed against NiV-G-HA (rabbit anti-HA) and NiV-F-FLAG (mouse anti-Flag). (G) The VLPs expressing NiV-M-Bla, G-HA, and the FLAG-tagged WT or mutant NiV-F were allowed to bind to the target HEK293T cells loaded with CCF2-AM dye at 4°C. The Blue/Green (B/G) ratio was measured at 37°C for 4 hr at a 3-min-interval. The average background was subtracted, and the results were normalized to the maximal B/G ratio of WT VLPs. Results from one representative experiment (of three) are shown. (H) The result of a representative western blot analysis of NiV VLPs. Equal volumes of VLPs were separated by a denaturing 10% SDS–PAGE and probed against NiV-G (rabbit anti-HA), NiV-F (mouse anti-Flag), and NiV-M (mouse anti-β-lactamase).
-
Figure 3—figure supplement 1—source data 1
Related to Figure 3—figure supplement 1A.
- https://cdn.elifesciences.org/articles/97017/elife-97017-fig3-figsupp1-data1-v1.zip
-
Figure 3—figure supplement 1—source data 2
Related to Figure 3—figure supplement 1B.
- https://cdn.elifesciences.org/articles/97017/elife-97017-fig3-figsupp1-data2-v1.xlsx
-
Figure 3—figure supplement 1—source data 3
Related to Figure 3—figure supplement 1C.
- https://cdn.elifesciences.org/articles/97017/elife-97017-fig3-figsupp1-data3-v1.xlsx
-
Figure 3—figure supplement 1—source data 4
Related to Figure 3—figure supplement 1D.
Original files for western blot analysis.
- https://cdn.elifesciences.org/articles/97017/elife-97017-fig3-figsupp1-data4-v1.zip
-
Figure 3—figure supplement 1—source data 5
Related to Figure 2—figure supplement 1D.
PPTX files indicating the relevant bands and treatments.
- https://cdn.elifesciences.org/articles/97017/elife-97017-fig3-figsupp1-data5-v1.pptx
-
Figure 3—figure supplement 1—source data 6
Related to Figure 3—figure supplement 1E.
- https://cdn.elifesciences.org/articles/97017/elife-97017-fig3-figsupp1-data6-v1.xlsx
-
Figure 3—figure supplement 1—source data 7
Related to Figure 3—figure supplement 1F.
Original files for western blot analysis.
- https://cdn.elifesciences.org/articles/97017/elife-97017-fig3-figsupp1-data7-v1.zip
-
Figure 3—figure supplement 1—source data 8
Related to Figure 3—figure supplement 1F.
PPTX files indicating the relevant bands and treatments.
- https://cdn.elifesciences.org/articles/97017/elife-97017-fig3-figsupp1-data8-v1.pptx
-
Figure 3—figure supplement 1—source data 9
Related to Figure 3—figure supplement 1G.
- https://cdn.elifesciences.org/articles/97017/elife-97017-fig3-figsupp1-data9-v1.xlsx
-
Figure 3—figure supplement 1—source data 10
Related to Figure 3—figure supplement 1H.
Original files for western blot analysis.
- https://cdn.elifesciences.org/articles/97017/elife-97017-fig3-figsupp1-data10-v1.zip
-
Figure 3—figure supplement 1—source data 11
Related to Figure 3—figure supplement 1H.
PPTX files indicating the relevant bands and treatments.
- https://cdn.elifesciences.org/articles/97017/elife-97017-fig3-figsupp1-data11-v1.pptx
Figure 4 with 1 supplement
The distribution and organization of NiV-F constructs in VLPs.
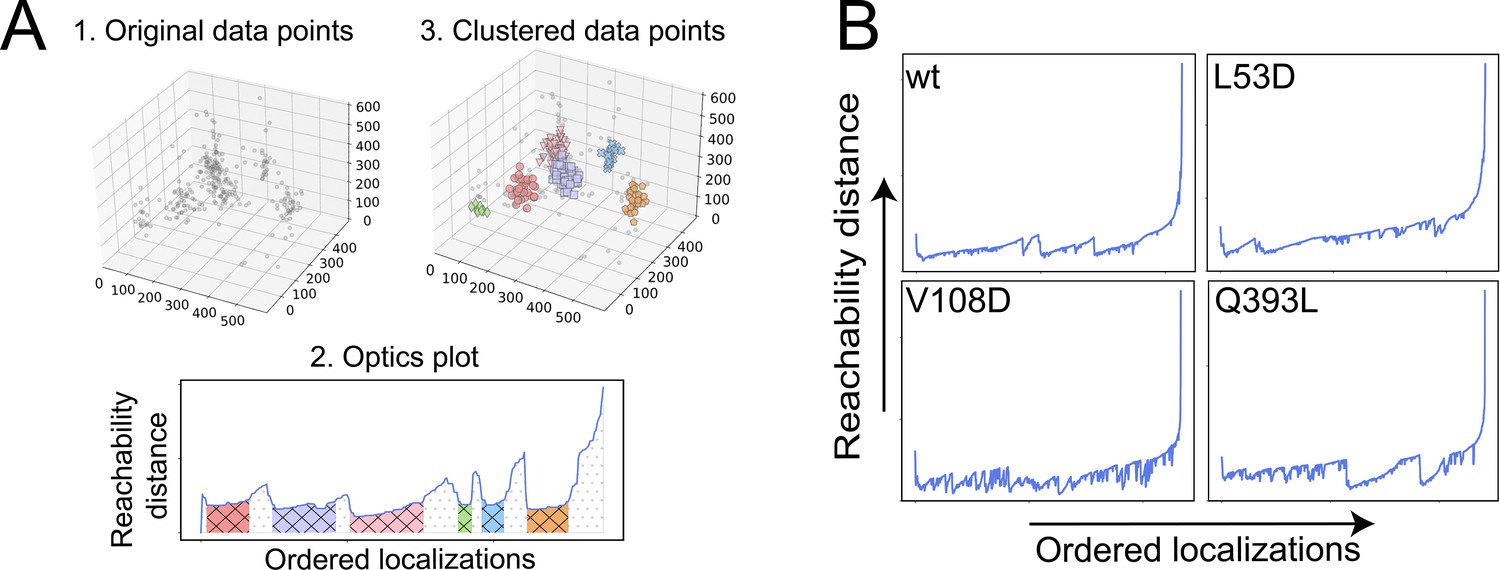
(A) The incorporation of F-WT and mutants in VLPs. NiV-M-GFP, G-HA, and FLAG-tagged F-WT or mutants were transfected to 293T cells. The supernatants were collected at 48 hr post-transfection and analyzed on sodium dodecyl sulfate–polyacrylamide gel electrophoresis (SDS–PAGE) followed by western blotting. NiV-M was probed by polyclonal goat anti-GFP, NiV-G polyclonal rabbit anti-HA, F0 and F2 M2 monoclonal mouse anti-FLAG antibody. (B) Cross-section (Δz = 100 nm) of single-molecule localization microscopy (SMLM) images of the FLAG-tagged NiV-F-WT (WT), L53D, V108D, and Q393L on individual VLPs. Scale bar: 0.2 μm. (C) The classification of the ordered sequence of reachability distances of the NiV-F constructs localizations. Orange: F-WT (n = 306) and Q393L (n = 323); blue: L53D (n = 310) and V108D (n = 329). n is the number of VLPs used for classification analysis.
-
Figure 4—source data 1
Related to Figure 4A.
Original files for western blot analysis.
- https://cdn.elifesciences.org/articles/97017/elife-97017-fig4-data1-v1.zip
-
Figure 4—source data 2
Related to Figure 4A.
PPTX files indicating the relevant bands and treatments.
- https://cdn.elifesciences.org/articles/97017/elife-97017-fig4-data2-v1.pptx
-
Figure 4—source data 3
Related to Figure 4B.
- https://cdn.elifesciences.org/articles/97017/elife-97017-fig4-data3-v1.zip
-
Figure 4—source data 4
Related to Figure 4C.
- https://cdn.elifesciences.org/articles/97017/elife-97017-fig4-data4-v1.csv
Figure 4—figure supplement 1
The OPTICS algorithm identifies the clusters of NiV-F-WT and constructs on 3D VLPs.
(A) The OPTICS plots for a simulated 3D single-molecule localization microscopy (SMLM) dataset containing clusters of different sizes and densities. (B) The OPTICS plots of the localizations of NiV-F constructs on individual VLPs. The OPTICS plot shows the correlation between the ordered localization sequence (x-axis) and the reachability distance (y-axis).
Figure 5 with 1 supplement
Mutations in the LI zipper of the NiV-F transmembrane domain disturb the NiV-F distribution.
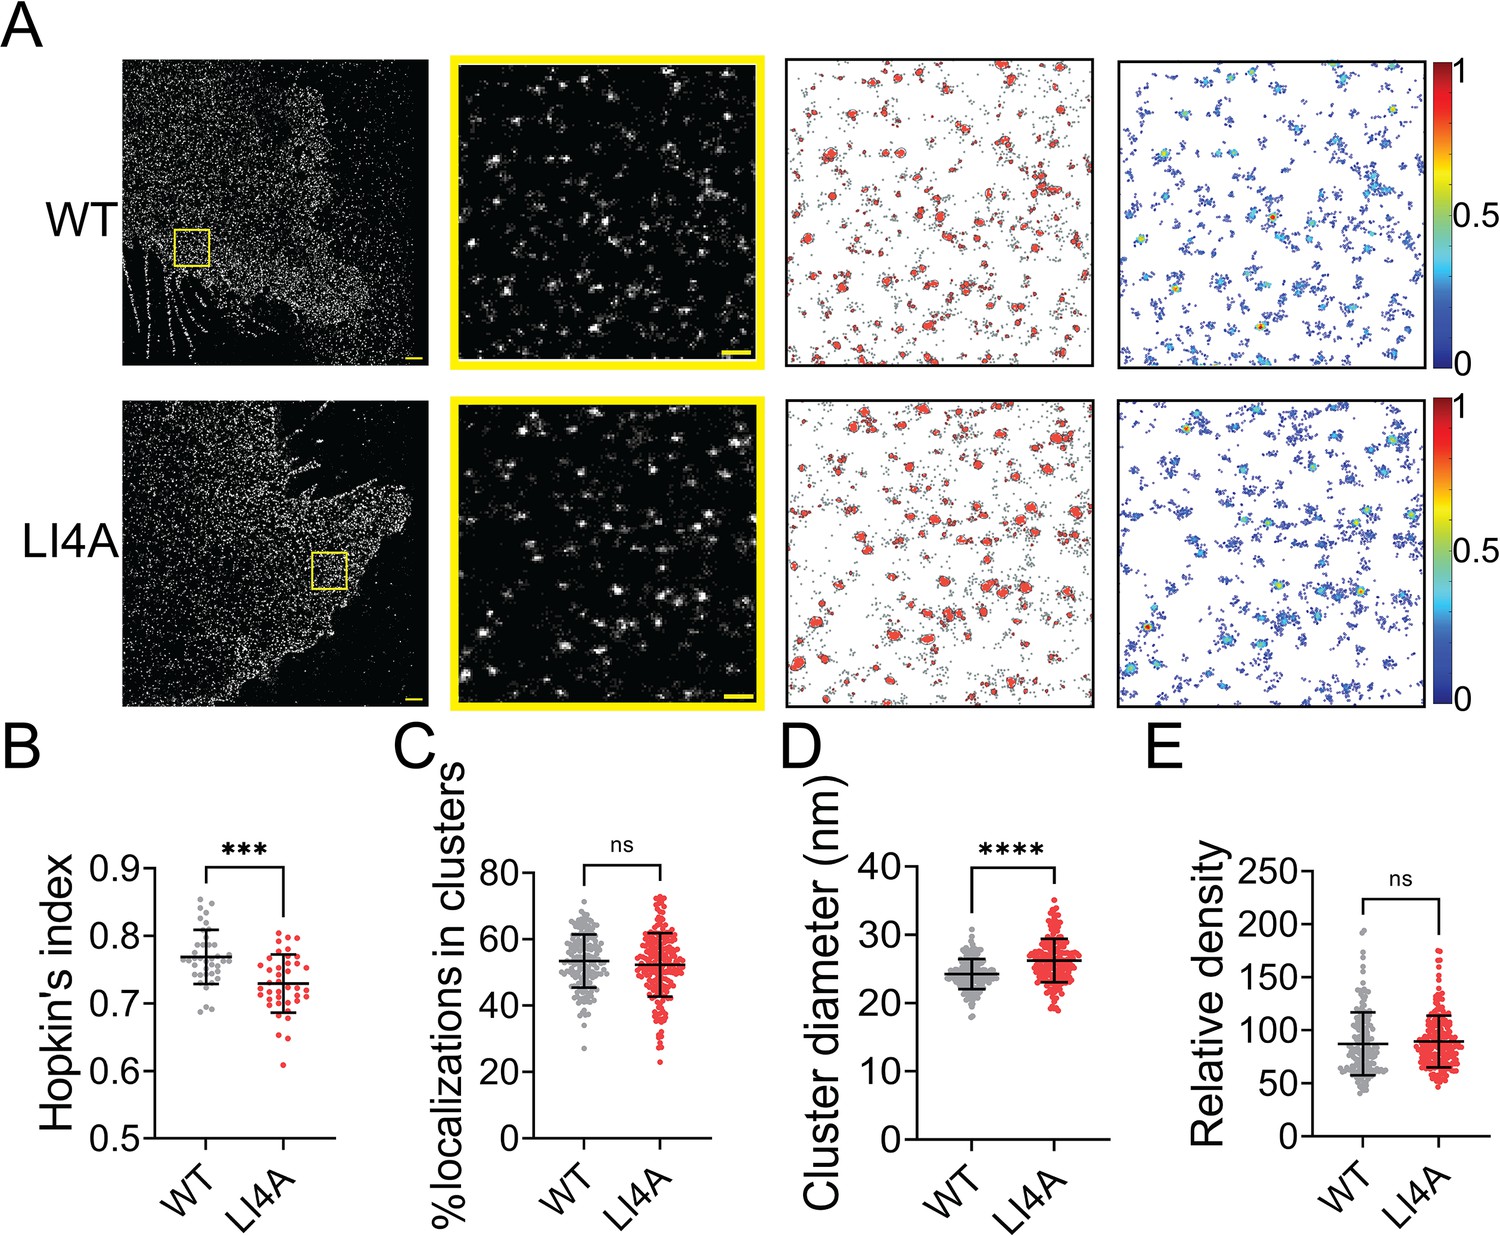
(A) First column: Cross-section (Δz = 600 nm) of single-molecule localization microscopy (SMLM) images of the FLAG-tagged NiV-F-WT (WT) and NiV-F-LI4A (LI4A) mutant on PK13 cell membrane. Scale bar: 1 μm. Second column: The yellow boxed region in the first column is enlarged to show individual clusters. Scale bar: 0.2 μm. Third column: Cluster maps from enlarged regions. Fourth column: Localization density maps show normalized relative density of the enlarged regions in the second column. Quantitative analyses of the WT and LI4A clusters: (B) Hopkin’s index, p = 0.0001; n = 40 and 40 (C) Percentage of localizations in clusters, p = 0.3058; n = 171 and 211; (D) Average cluster diameters, p < 0.0001; n = 171 and 210; (E) relative density, p = 0.1092; n = 166 and 211. Bars represent mean ± SD. p value was obtained using Mann–Whitney test. ns: p > 0.05; ***p = 0.0001; ****p < 0.0001. Sample size n is the number of total regions from 13 to 16 cells.
-
Figure 5—source data 1
Related to Figure 5A.
- https://cdn.elifesciences.org/articles/97017/elife-97017-fig5-data1-v1.zip
-
Figure 5—source data 2
Related to Figure 5B.
- https://cdn.elifesciences.org/articles/97017/elife-97017-fig5-data2-v1.xlsx
-
Figure 5—source data 3
Related to Figure 5C–E.
- https://cdn.elifesciences.org/articles/97017/elife-97017-fig5-data3-v1.xlsx
Figure 5—figure supplement 1
The NiV-F LI4A does not induce cell–cell fusion.
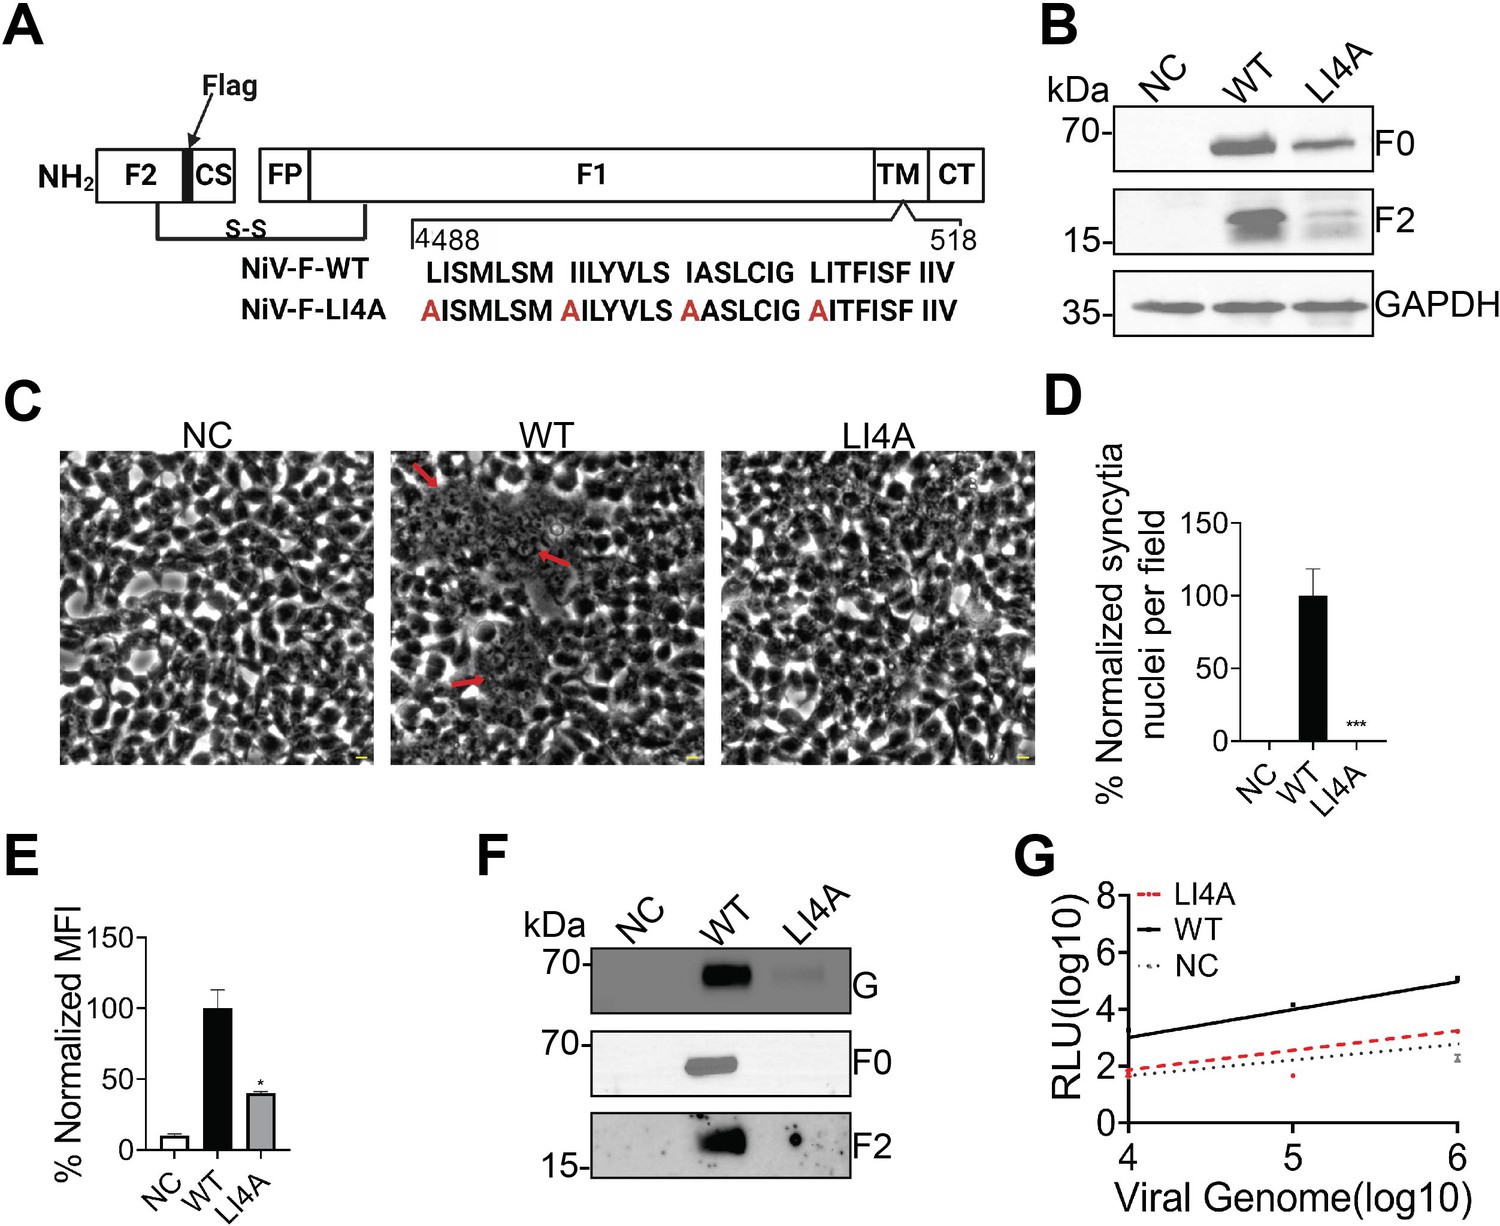
(A) A diagram of NiV-F-LI4A (LI4A) mutant that carries alanine mutations at the LI zipper (B) The processing of NiV-F-WT and F-LI4A in 293T cells. Expression plasmids of an empty vector (NC), NiV-F-WT (WT), and NiV-F-LI4A (LI4A) were transfected into 293T cells. At 28 hr posttransfection, cell lysates were collected and loaded on a 10% polyachrylamide gel for sodium dodecyl sulfate–polyacrylamide gel electrophoresis (SDS–PAGE). The F0 and F2 were detected using a mouse anti-FLAG antibody and a goat anti-mouse HRP (horseradish peroxidise). The GAPDH is a loading control. (C) Representative images of 293T cell–cell fusion induced by WT and LI4A. 293T cells were co-transfected using plasmids coding for NiV-G and an empty vector (NC), NiV-F-WT (WT), or NiV-F-LI4A. Cells were fixed at 18 hr post-transfection. Arrows point to syncytia. Scale bar: 10 μm. (D) Relative cell–cell fusion levels in (C). Five fields per experiment were counted from three independent experiments. Bars represent mean ± SEM. p value was obtained by the unpaired t-test with Welch’s correction. ***p = 0.0003. (E) The cell surface expression levels of WT and LI4A on 293T cells were measured by flow cytometry. Mean fluorescence intensity (MFI) values were calculated by FlowJo and were normalized to WT. Bars are presented as mean ± SEM of n = 3 independent experiments. Statistical significance was determined by the unpaired t-test with Welch’s correction (*p = 0.0156). Values were compared to that of WT. (F) The result of a representative Western blot analysis of VSV/NiV pseudovirions. 4 × 10⁸ copies of VSV/NiV pseudotyped virions were separated by a denaturing 10% SDS–PAGE and probed against NiV-G (rabbit anti-HA) and NiV-F (mouse anti-Flag). (G) Relative entry levels of VSV/NiV pseudovirions expressing NiV-G-HA and NiV-F-FLAG (solid black line) or LI4A (dotted red line). The negative control (NC), the recombinant VSV pseudoviruses without glycoproteins, is shown as a dotted gray line. The relative light units (RLUs) of lysates of infected Vero cells were quantified 18–24 hr post-infection and plotted against the number of viral genomes/ml over 3 logs of viral input. Data shown are averages ± SEM from one representative experiment (of three).
-
Figure 5—figure supplement 1—source data 1
Related to Figure 5—figure supplement 1B.
Original files for western blot analysis.
- https://cdn.elifesciences.org/articles/97017/elife-97017-fig5-figsupp1-data1-v1.zip
-
Figure 5—figure supplement 1—source data 2
Related to Figure 5—figure supplement 1B.
PPTX files indicating the relevant bands and treatments.
- https://cdn.elifesciences.org/articles/97017/elife-97017-fig5-figsupp1-data2-v1.pptx
-
Figure 5—figure supplement 1—source data 3
Related to Figure 5—figure supplement 1C.
- https://cdn.elifesciences.org/articles/97017/elife-97017-fig5-figsupp1-data3-v1.zip
-
Figure 5—figure supplement 1—source data 4
Related to Figure 5—figure supplement 1D, E.
- https://cdn.elifesciences.org/articles/97017/elife-97017-fig5-figsupp1-data4-v1.xlsx
-
Figure 5—figure supplement 1—source data 5
Related to Figure 5—figure supplement 1F.
Original files for western blot analysis.
- https://cdn.elifesciences.org/articles/97017/elife-97017-fig5-figsupp1-data5-v1.zip
-
Figure 5—figure supplement 1—source data 6
Related to Figure 5—figure supplement 1F.
PPTX files indicating the relevant bands and treatments.
- https://cdn.elifesciences.org/articles/97017/elife-97017-fig5-figsupp1-data6-v1.pptx
-
Figure 5—figure supplement 1—source data 7
Related to Figure 5—figure supplement 1G.
- https://cdn.elifesciences.org/articles/97017/elife-97017-fig5-figsupp1-data7-v1.xlsx
Figure 6 with 1 supplement
The NiV-F nanoclusters are stabilized by endocytosis components.
(A) First column: Cross-section (Δz = 600 nm) of single-molecule localization microscopy (SMLM) images of the FLAG-tagged NiV-F-WT (WT) and NiV-F-YA (YA) mutant on PK13 cell membrane. Scale bar: 1 μm. Second column: The yellow boxed region in the first column is enlarged to show individual clusters. Scale bar: 0.2 μm. Third column: Cluster maps from enlarged regions. Fourth column: Localization density maps show normalized relative density of the enlarged regions in the second column. Quantitative analyses of the WT and YA clusters: (B) Hopkins index of WT and YA, p < 0.0001; n = 40 and 40; (C) percentage of localizations in clusters, p < 0.0001; n = 72 and 77; (D) average cluster diameters, p < 0.0001; n = 72 and 77; (E) relative density, <0.0001; n = 71 and 76; (F) total density of the region, p = 0.3560; n = 72 and 77. (G) First column: Cross-section (Δz = 600 nm) of SMLM images of the FLAG-tagged NiV-F-WT treated without (NC) and with pitstop2 (pitstop2) on HeLa cell membrane. Scale bar: 1 μm. Second column: The yellow boxed region in the first column is enlarged to show individual clusters. Scale bar: 0.2 μm. Third column: Cluster maps from enlarged regions. Fourth column: Localization density maps show normalized relative density of the enlarged regions in the second column. Quantitative analyses of NiV-F without (NC) and with pitstop2 (pitstop2): (H) Hopkins index, p = 0.0054; n = 40 and 40; (I) percentage of localizations in clusters, p = 0.0060; n = 82 and 85; (J) average cluster diameters, p = 0.0057; n = 82 and 81; (K) relative density, p = 0.4235; n = 79 and 78; (L) total density of the region, p = 0.0607; n = 82 and 85. Bars represent mean ± SD. p value was obtained using Mann–Whitney test. ns: p > 0.05; **p < 0.01; ****p < 0.0001. Sample size n is the number of total regions from four to nine cells.
-
Figure 6—source data 1
Related to Figure 6A.
- https://cdn.elifesciences.org/articles/97017/elife-97017-fig6-data1-v1.zip
-
Figure 6—source data 2
Related to Figure 6B.
- https://cdn.elifesciences.org/articles/97017/elife-97017-fig6-data2-v1.xlsx
-
Figure 6—source data 3
Related to Figure 6C–F.
- https://cdn.elifesciences.org/articles/97017/elife-97017-fig6-data3-v1.xlsx
-
Figure 6—source data 4
Related to Figure 6G.
- https://cdn.elifesciences.org/articles/97017/elife-97017-fig6-data4-v1.zip
-
Figure 6—source data 5
Related to Figure 6H.
- https://cdn.elifesciences.org/articles/97017/elife-97017-fig6-data5-v1.xlsx
-
Figure 6—source data 6
Related to Figure 6I–L.
- https://cdn.elifesciences.org/articles/97017/elife-97017-fig6-data6-v1.xlsx
Figure 6—figure supplement 1
The FLAG-tagged NiV-F-YA mutant inhibits NiV-F cleavage, cell–cell fusion, and the NiV-F-AP-2 interaction in 293T cells.
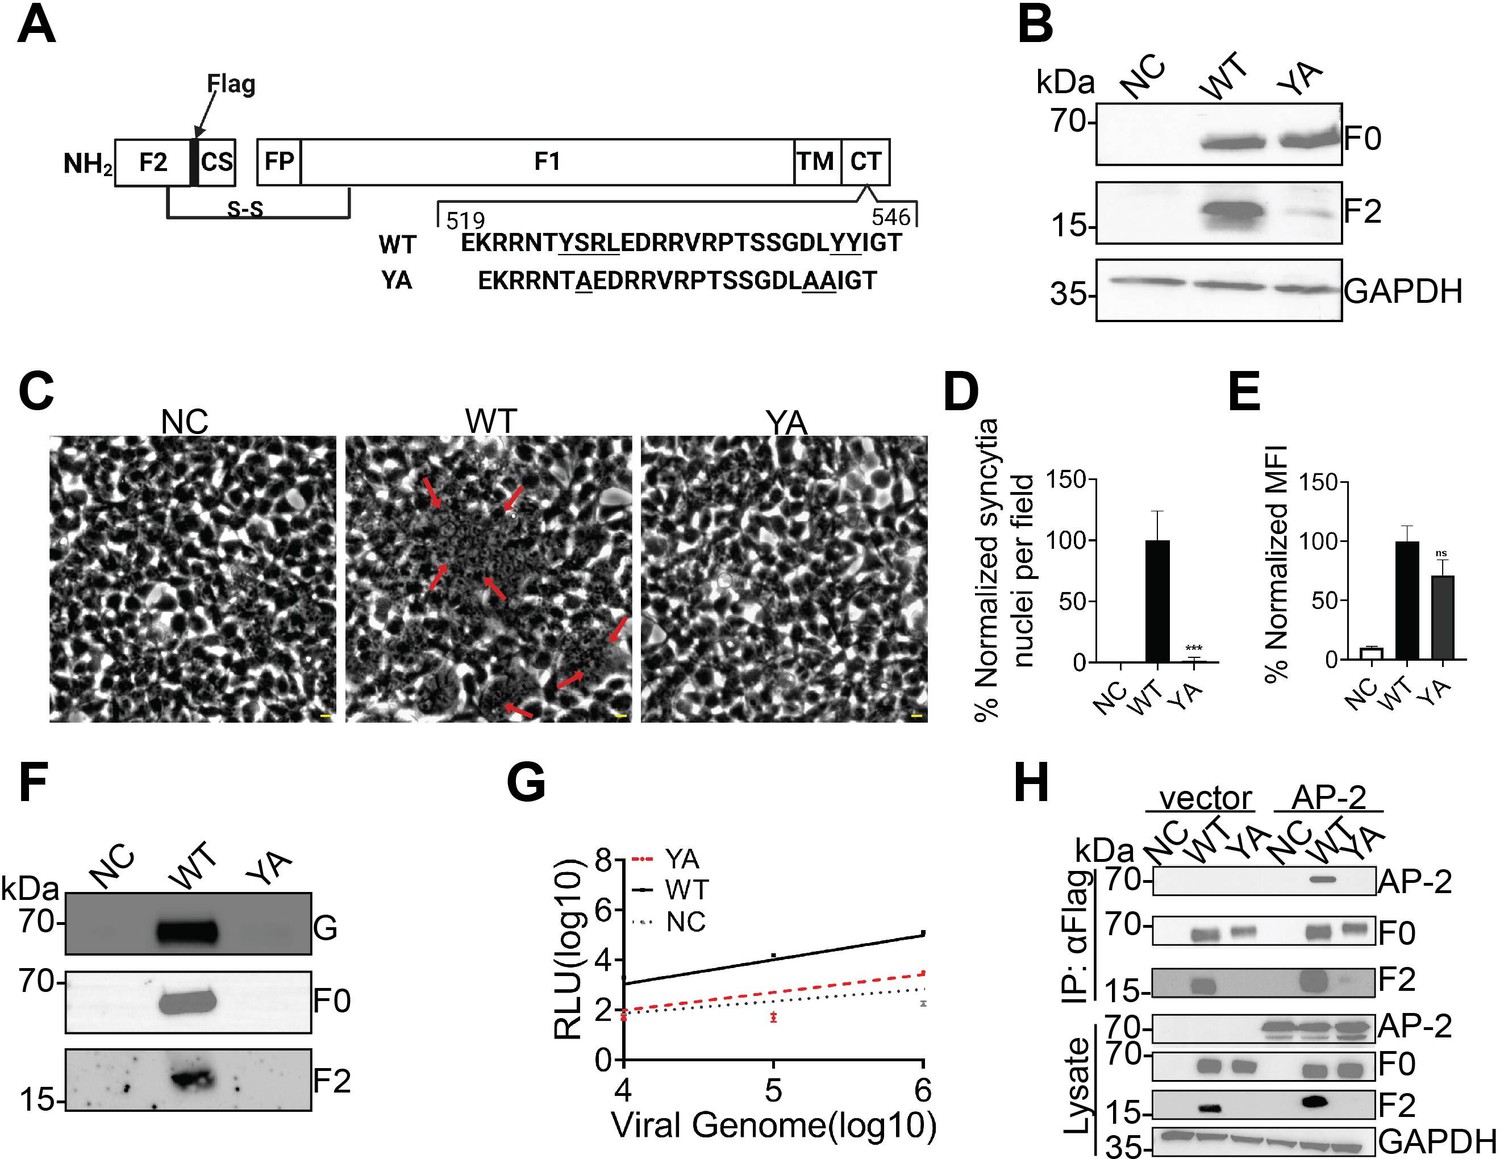
(A) A diagram of NiV-F-YA (YA) mutant which carries alanine mutations of a tyrosine residue at the endosomal sorting signal YSRL and two additional tyrosine residues at the cytoplasmic tail. (B) The processing of NiV-F-WT and F-YA in 293T cells. Expression plasmids of an empty vector (NC), NiV-F-WT (WT), and NiV-F-YA (YA) were transfected into 293T cells. At 28 hr posttransfection, cell lysates were collected and loaded on a 10% polyachrylamide gel for sodium dodecyl sulfate–polyacrylamide gel electrophoresis (SDS–PAGE). The F0 and F2 were detected using a mouse anti-FLAG antibody and a goat anti-mouse HRP. The GAPDH is a loading control. (C) Representative images of 293T cell-cell fusion induced by WT and YA. 293T cells were cotransfected using plasmids coding for NiV-G and an empty vector (NC), NiV-F-WT (WT), or NiV-F-YA (YA). Cells were fixed at 18 hr post-transfection. Arrows point to syncytia. Scale bar: 10 μm. (D) Relative cell–cell fusion levels in (C). Five fields per experiment were counted from three independent experiments. Bars represent mean ± SEM. p value was obtained by the unpaired t-test with Welch’s correction. ***p = 0.0007. (E) The cell surface expression levels of WT and YA on 293T cells were measured by flow cytometry. Mean fluorescence intensity (MFI) values were calculated by FlowJo and were normalized to WT. Bars are presented as mean ± SEM of n = 3 independent experiments. Statistical significance was determined by the unpaired t-test with Welch’s correction. Values were compared to that of WT. ns: p = 0.0558. (F) The result of a representative western blot analysis of VSV/NiV pseudovirions. 4 × 10⁸ copies of NiV/VSV pseudovirions were separated by a denaturing 10% SDS–PAGE and probed against NiV-G (rabbit anti-HA) and NiV-F (mouse anti-Flag). (G) Relative entry levels of VSV pseudovirions containing NiV-G-HA and the FLAG-tagged-NiV-F (solid black line) or YA (dotted red line). The negative control (NC), the recombinant VSV pseudoviruses without glycoproteins (VSV/pcDNA3), is shown as a dotted gray line. The relative light units (RLUs) of lysates of infected Vero cells were quantified 18–24 hr post-infection and plotted against the number of viral genomes/ml over 3 logs of viral input. Data shown are mean ± SEM from one representative experiment (of three) are shown. (H) 293T cells were transfected with the indicated combinations of NiV-F-WT, YA, and AP-2. At 48 hpt, cells were lysed and NiV-F constructs were immunopreciptated by using μMACS. Anti-FLAG magnetic beads were used. Total cell lysate (Lysate) and immunoprecipiated proteins (IP:αFLAG) were separated by 10% SDS–PAGE and immunoblotted with mouse α-FLAG (F detection) or rabbit α-mcherry (AP-2 detection). Proteins were detected using HRP-conjugated secondary antibodies.
-
Figure 6—figure supplement 1—source data 1
Related to Figure 6—figure supplement 1B.
Original files for western blot analysis.
- https://cdn.elifesciences.org/articles/97017/elife-97017-fig6-figsupp1-data1-v1.zip
-
Figure 6—figure supplement 1—source data 2
Related to Figure 6—figure supplement 1B.
PPTX files indicating the relevant bands and treatments.
- https://cdn.elifesciences.org/articles/97017/elife-97017-fig6-figsupp1-data2-v1.pptx
-
Figure 6—figure supplement 1—source data 3
Related to Figure 6—figure supplement 1C.
- https://cdn.elifesciences.org/articles/97017/elife-97017-fig6-figsupp1-data3-v1.zip
-
Figure 6—figure supplement 1—source data 4
Related to Figure 6—figure supplement 1D, E.
- https://cdn.elifesciences.org/articles/97017/elife-97017-fig6-figsupp1-data4-v1.xlsx
-
Figure 6—figure supplement 1—source data 5
Related to Figure 6—figure supplement 1F.
Original files for western blot analysis.
- https://cdn.elifesciences.org/articles/97017/elife-97017-fig6-figsupp1-data5-v1.zip
-
Figure 6—figure supplement 1—source data 6
Related to Figure 6—figure supplement 1F.
PPTX files indicating the relevant bands and 995 treatments.
- https://cdn.elifesciences.org/articles/97017/elife-97017-fig6-figsupp1-data6-v1.pptx
-
Figure 6—figure supplement 1—source data 7
Related to Figure 6—figure supplement 1G.
- https://cdn.elifesciences.org/articles/97017/elife-97017-fig6-figsupp1-data7-v1.xlsx
-
Figure 6—figure supplement 1—source data 8
Original files for the immunoprecipitation assay.
- https://cdn.elifesciences.org/articles/97017/elife-97017-fig6-figsupp1-data8-v1.zip
-
Figure 6—figure supplement 1—source data 9
PPTX files indicating the relevant bands in Figure 6—figure supplement 1H.
- https://cdn.elifesciences.org/articles/97017/elife-97017-fig6-figsupp1-data9-v1.pptx
Author response image 1

The localization precision of the custom-built SMLM.
Shows the distribution of localization error at the x (dX), y (dY), and z (dZ) direction in nanometer of blinks generated from Alexa Flour 647 labeled to NiV-F expressed on the plasma membrane of PK13 cells. The lateral precision is <10 nm and the axial precision is < 20 nm.
Author response image 2
Viral entry is not affected by labeling of NiV-F.
(A) Western blot analysis of NiV-M-Bla in NiV-VLPs generated by HEK293T cells expressing NiV-M-Bla, NiV-G-HA and NiV-F-FLAG, untagged NiV-F, or NiV-F-AU1. Equal volume of VLPs were separated by a denaturing 10% SDS–PAGE and probed against β-lactamase (SANTA CRUZ, sc-66062). (B) NiV-VLPs expressing NiV-M-BLa, NiV-G-HA, and NiV-F-FLAG, untagged NiV-F or NiV-F-AU1 expression plasmids were bond to the target HEK293T cells loaded with CCF2-AM dye at 4°C. The Blue/Green (B/G) ratio was measured at 37°C for 4 hrs at a 3-min interval. Results were normalized to the maximal B/G ratio of NiV-F-FLAG-NiV VLPs. Results from one representative experiment out of three independent experiments are shown.
Author response image 3
The expression and fusion activity of Flag-tagged NiV-F and NiV-F L53D-V108D (LV).
(A) Representative western blot analysis of NiV-F-WT, LV in the cell lysate of 293T cells. 293T cells were transfected by NiV-F-WT or the LV mutant. The empty vector was used as a negative control. The cell lysates were analyzed on SDS-PAGE followed by western blotting after 28hrs post-transfection. F0 and F2 were probed by the M2 monoclonal mouse antiFLAG antibody. GAPDH was probed by monoclonal mouse anti-GAPDH. (B) Representative images of 293T cell-cell fusion induced by NiV-G and NiV-F-WT or NiV-F-LV. 293T cells were co-transfected with plasmids coding for NiV-G and empty vector (NC) or NiV-F constructs. Cells were fixed at 18 hrs post-transfection. Arrows point to syncytia. Scale bar: 10um. (C) Relative cell-cell fusion levels in 293T cells in (B). Five fields per experiment were counted from three independent experiments. Data are presented as mean ± SEM. (D) The cell surface expression levels of NiV-F-WT, NiV-F-LV in 293T cells measured by flow cytometry. Mean fluorescence Intensity (MFI) values were calculated by FlowJo and normalized to that of F-WT. Data are presented as mean ± SEM of three independent experiments. Statistical significance was determined by the unpaired t-test with Welch’s correction (*P<0.05, **P<0.01, ***P<0.001, ****P<0.0001). Values were compared to that of the NiV-F-WT.
Tables
Key resources table
| Reagent type (species) or resource | Designation | Source or reference | Identifiers | Additional information |
|---|---|---|---|---|
| Cell line (Homo sapiens) | HEK293T | ATCC | CRL-3216 | |
| Cell line (Sus scrofa, pig) | PK13 | ATCC | CRL-6489 | |
| Cell line (Homo sapiens) | HeLa | ATCC | CCL-2 | |
| Cell line (Cercopithecus aethiops) | Vero | ATCC | CCL-81 | |
| Recombinant DNA reagent | pcDNA 3 plasmids containing cDNA for NiV-F-FLAG and mutants | This paper | The FLAG tag was inserted after residue 104 of the codon-optimized NiV-F (GenBank accession no. AY816748.1). The hexameric interface mutants (Figure 3; Xu et al., 2015), LI4A mutant (Figure 5; Webb et al., 2017), and YA mutant (Figure 6; Diederich et al., 2005) were constructed as previously published. | |
| Recombinant DNA reagent | pcDNA 3 plasmid containing cDNA for NiV-F-HA | This paper | The HA tag was inserted after residue 104 of the codon-optimized NiV-F (GenBank accession no. AY816748.1). | |
| Recombinant DNA reagent | pcDNA 3 plasmid containing cDNA for NiV-G-HA | Liu et al., 2018 | ||
| Recombinant DNA reagent | pcDNA 3 plasmid containing cDNA for NiV-M-GFP | Liu et al., 2018; Wang et al., 2010 | The GFP gene was fused to the N-terminus of NiV-M gene (GenBank accession no. EU480491.1) | |
| Recombinant DNA reagent | pcDNA 3 plasmid containing cDNA for AP2μ2-mCherry | Christien Merrifield | RRID:Addgene_27672 | |
| Recombinant DNA reagent | pcDNA 3 plasmid containing cDNA for untagged NiV-F | Liu et al., 2018 | Codon-optimized NiV-F (GenBank accession no. AY816748.1). | |
| Recombinant DNA reagent | pcDNA 3 plasmid containing cDNA for NiV-F-AU1 | The AU1 tag was inserted at the C terminal of the codon-optimized NiV-F (GenBank accession no. AY816748.1). | ||
| Recombinant DNA reagent | pCAGGs plasmid containing cDNA for NiV-M-β-lactamase | Wolf et al., 2009, Landowski et al., 2014 | The β-lactamase gene was fused to the N-terminus of NiV-M gene (GenBank accession no. EU480491.1) | |
| Sequence-based reagent | NiV-F-L53D-F1 | This paper | PCR primers | GAGCAACCCCgacACCAAGGACATCGTG |
| Sequence-based reagent | NiV-F-L53D-R1 | This paper | PCR primers | TTGGTgtcGGGGTTGCTCTTGATC |
| Sequence-based reagent | NiV-F-V108D-F2 | This paper | PCR primers | ATAAGGTGGGCGACGacCGGCTGGCCG |
| Sequence-based reagent | NiV-F-V108D-R2 | This paper | PCR primers | gtCGTCGCCCACCTTATCGTCGTCA |
| Sequence-based reagent | NiV-F-Q393L-F3 | This paper | PCR primers | CGTGACCTGCCtGTGCCAGACCAC |
| Sequence-based reagent | NiV-F-Q393L-R3 | This paper | PCR primers | GTGGTCTGGCAcagGCAGGTCACG |
| Sequence-based reagent | NiV-F-FLAG-G/L-F | This paper | PCR primers | GCCTGTGCATCctgCTGATCACCTTC |
| Sequence-based reagent | NiV-F-FLAG-G/L-R | This paper | PCR primers | CAGcagGATGCACAGGCTGGCGATGC |
| Sequence-based reagent | NiV-F-LI-A-F1 | This paper | PCR primers | ATCCTGTACGTGCTGAGCgccGCCAGCCTGTGCATCGGCgccATCACCTTCA |
| Sequence-based reagent | NiV-F-LI-A-R1 | This paper | PCR primers | GCTCAGCACGTACAGGATggcCATGGACAGCATGCTGATggcGCTGGGGTTCACGGTGTC |
| Sequence-based reagent | NiV-F-YA-F | This paper | PCR primers | GCACCCGCCGGTCCTCCAGCCGGCTGgcGGTGTTCCGC |
| Sequence-based reagent | NiV-F-YA-R | This paper | PCR primers | AGGACCGGCGGGTGCGGCCCACCAGCAGCGGCGACCTGGCCGCCATCGGCACCTGATAA |
| Chemical compound, drug | E64d | Sigma-Aldrich | E8640-250UG | 20 µM final concentration for treatment |
| Chemical compound, drug | Pitstop2 | Sigma-Aldrich | SML1169-5MG | 30 µM final concentration for treatment |
| Chemical compound, drug | Tris | EMD Millipore | 648311-1KG | 50 mM for TN buffer |
| Chemical compound, drug | NaCl | Sigma-Aldrich | S9888-1KG | 10 mM for TN buffer |
| Chemical compound, drug | Glucose oxidase | Sigma-Aldrich | G2133-50KU | 0.5 mg/ml for imaging buffer |
| Chemical compound, drug | Catalase | Sigma-Aldrich | C100 | 40 μg/ml for imaging buffer |
| Chemical compound, drug | Mercapto ethylamine (MEA) | Sigma-Aldrich | 30070-10G | 50 mM for SMLM imaging buffer |
| Chemical compound, drug | HEPES | Fisher Scientific | 15-630-080 | 25 mM for fusion buffer |
| Chemical compound, drug | Glutamine | Fisher Scientific | 25-030-081 | 2 mM for fusion buffer |
| Chemical compound, drug | CaCl2 | Sigma-Aldrich | C7902 | 1 mM for fusion buffer |
| Chemical compound, drug | Probenecid | Sigma-Aldrich | P8761-25G | 2.5 mM for fusion buffer |
| Chemical compound, drug | Solution D | Fisher Scientific | K1156 | 1:20 for Entry kinetics loading solution |
| Antibody | Anti-FLAG mouse monoclonal | Sigma-Aldrich | F1804 | IF, SMLM: 1:100, Flow: 1:200; WB: 1:500–1:5000 |
| Antibody | Anti-HA rabbit polyclonal antibody | Biolegend | 902301 | IF: 1:900 WB: 1:2000 |
| Antibody | Anti-GFP goat polyclonal antibody | Abcam | Ab5450 | WB: 1:1000 |
| Antibody | Anti-mCherry rabbit polyclonal antibody | Abcam | Ab167453 | WB: 1:2000 |
| Antibody | Anti-β-lactamase mouse monoclonal | Santa Cruz Biotechnology | Sc-66062 | WB: 1:1000 |
| Antibody | Anti-mouse donkey polyclonal antibody, Alexa Fluor 647 conjugated | Invitrogen | A31571 | IF and SMLM: 1:400 |
| Antibody | Anti-rabbit donkey polyclonal antibody, Alexa Fluor 488 conjugated | Invitrogen | A21206 | IF: 1:400 |
| Antibody | Anti-mouse donkey polyclonal antibody, Alexa Fluor 488 conjugated | Invitrogen | A21202 | Flow: 1:400 |
| Antibody | Anti-goat donkey polyclonal antibody, HRP conjugated | Jackson Immunoresearch | 705-035-147 | WB: 1:5000 |
| Antibody | Anti-mouse goat polyclonal antibody, HRP conjugated | Bio-Rad | 1705047 | WB: 1:5000 |
| Antibody | Anti-rabbit goat polyclonal antibody, HRP conjugated | Bio-Rad | 1706515 | WB: 1:5000 |
| Commercial assay or kit | μMACS anti-DYKDDDDK starting kit | Miltenyi Biotec | 130-101-636 | |
| Commercial assay or kit | Renilla Luciferase Assay System | Promega | E2820 | |
| Commercial assay or kit | LiveBLAzer FRET-B/G Loading Kit with CCF2-AM | Invitrogen | K1032 | |
| Commercial assay or kit | QIAamp Viral RNA Kits for RNA Extraction | QIAGEN | 52904 | |
| Commercial assay or kit | SuperScript III First-Strand Synthesis System | Invitrogen | 18080051 | |
| Software | SMLM image reconstruction | Liu et al., 2018 | MATLAB Codes are available upon request. | |
| Software | ClusDoc | Pageon et al., 2016 | Codes were modified to process the data generated in the custom-built SMLM microscope. | |
| Software | OPTICS | This paper; Ankerst et al., 1999 | C++ Codes are available on GitHub, copy archived at QLlab, 2024 | |
| Software | One-dimensional convolutional neural network (1D CNN) | This paper | PYTHON Codes are available on GitHub, copy archived at QLlab, 2024 | |
| Software | Prism GraphPad | Dotmatics | RRID:SCR_002798 | |
| Software | Flowjo | BD | RRID:SCR_008520 |
Author response table 1
The comparison of imaging methods, analysis methods, and sample size in the current study to other studies conducted from 2015 to 2024.
| Study | Acquisition | Analysis | |||
|---|---|---|---|---|---|
| Ref. | Year | Target | Methods | Sample size | |
| Wang et al. (this study) | 2024 | NiV fusion protein in PK13, HeLa cells | dSTORM | DBSCAN, Hopkins | 4–20 cells, ROI 40–242 per condition from 3 independent experiments. |
| Wang et al. (this study) | 2024 | NiV fusion protein in VLPs | dSTORM | OPTICS | 40–200 VLPs from three independent experiments |
| Rubin-Delancy et al.13 | 2015 | CD3 in T cells | PALM, dSTORM | Ripley, Bayesian | 30 ROIs per condition. |
| Griffe et al.14 | 2017 | LAT vesicles in T cells | iPALM | Ripley, Bayesian | 5 cells per condition |
| Griffie et al.15 | 2017 | CD4 in T cells | Live-cell PALM | 6 cells | |
| Caetano et al.16 | 2015 | PACS, LAMP1 in HeLa cells | Ground State Depletion Microscopy | Density-based, Ripley | 5 cells per experiment (3 exp.) |
| Malkusch and Heilemann17 | 2016 | HIV, gag, env in T cells | SMLM | DBSCAN, Ripley, OPTICS | 1 cell |
| Zhang et al.18 | 2017 | Salmonella typhimurium mutants in bacterial cells | FPALM | DBSCAN | 58–60 bacterial cells. |
| Tobin et al.19 | 2018 | HER2 receptor in breast cancer cells | dSTORM | Density pair correlation | 17–23 cells |
| Levet et al.20 | 2015 | Microtubules in Cos-7 cells, GluA1, tubulin, integrin-β3 in neuron cells | PALM, dSTORM | Voronoi | 3 cells per condition |
| Peters et al.21 | 2018 | F-actin in T cells, microtubule network in HeLa cells | dSTORM | Voronoi, Ripley | 3–5 cells |
| Levet et al.22 | 2019 | Nuclear pore complex; microtubule, and actin cytoskeleton regulators | DNA-PAINT, dSTORM, and PALM | Voronoi | 3–18 cells per condition. |
| Banerjee et al.23 | 2023 | ULK in autophagy formation in HeLa cells | PALM | Spatial cross correlation | 7–34 cells per condition |
| Pageon et al.24 | 2016 | CD3ζ–PSCFP2 in Jurkat–OT-I cells | PALM | DBSCAN | 4–6 cells |
| Cresens et al.25 | 2023 | Flat clathrin lattces in KM12L4a cell | PALM | DBSCAN | 35 cells |
| Seeling et al.26 | 2023 | Decγn-1 in FγRIIb cell | dSTORM | DBSCAN | 6–10 cells |
Additional files
Download links
A two-part list of links to download the article, or parts of the article, in various formats.
Downloads (link to download the article as PDF)
Open citations (links to open the citations from this article in various online reference manager services)
Cite this article (links to download the citations from this article in formats compatible with various reference manager tools)
The nanoscale organization of the Nipah virus fusion protein informs new membrane fusion mechanisms
eLife 13:RP97017.
https://doi.org/10.7554/eLife.97017.3


