SIRT2-mediated ACSS2 K271 deacetylation suppresses lipogenesis under nutrient stress
- Department of Chemistry and Chemical Biology, Cornell University, United States
- Howard Hughes Medical Institute; Department of Chemistry and Chemical Biology; Department of Molecular Biology and Genetics, Cornell University, United States
- Howard Hughes Medical Institute; Department of Medicine and Department of Chemistry, The University of Chicago, United States
Figures
Figure 1 with 5 supplements
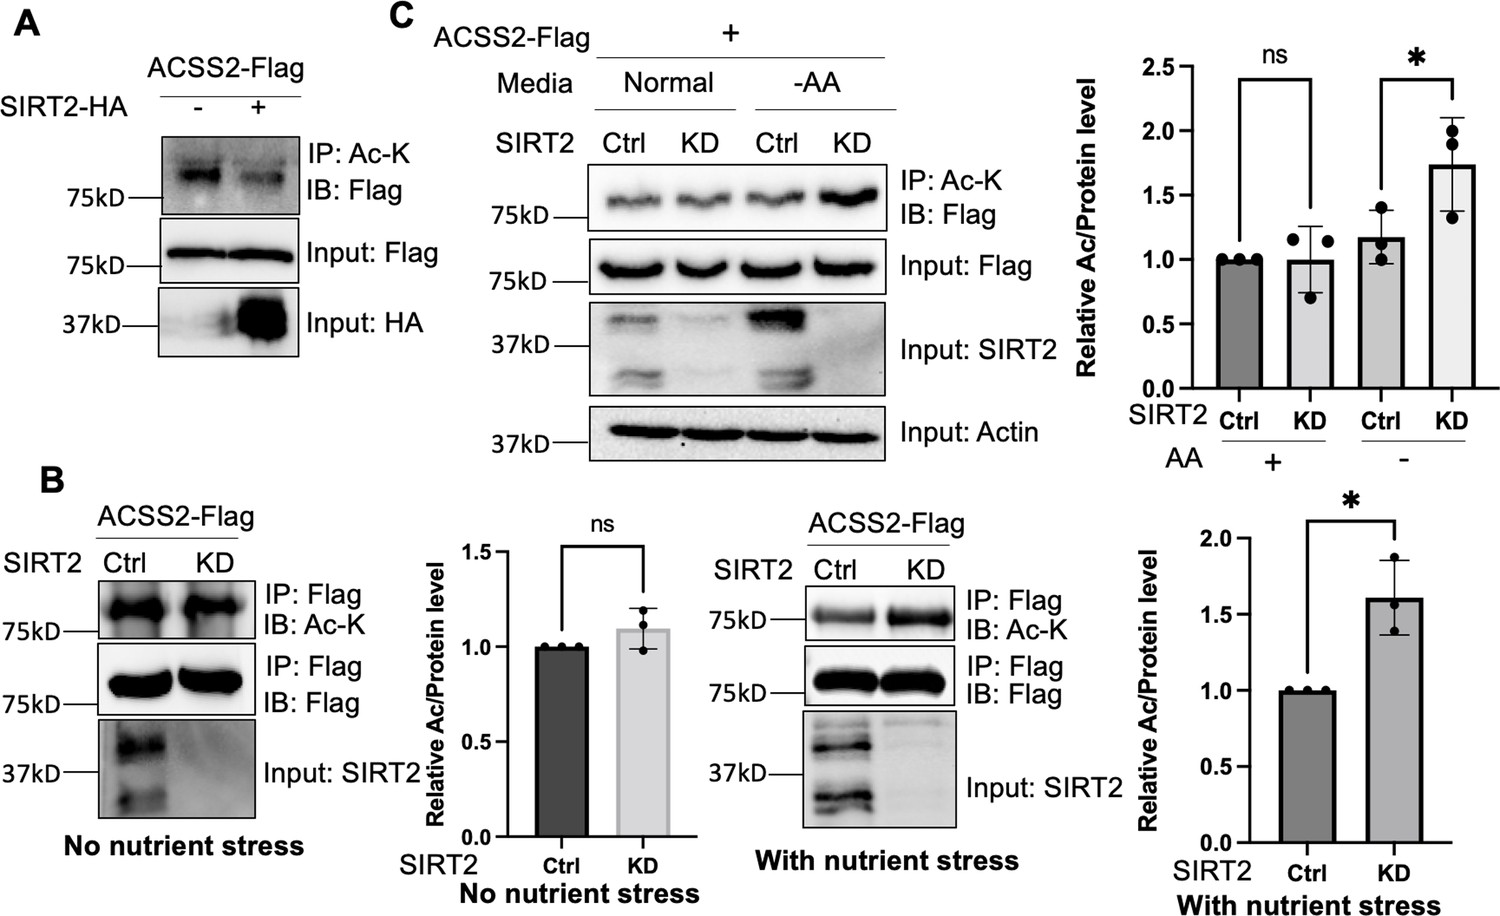
Deacetylation of ACSS2 by SIRT2 under nutrient and amino acid stress.
(A) Overexpression of SIRT2 decreases ACSS2 acetylation. Flag-tagged ACSS2 was co-transfected with HA-tagged SIRT2 into HEK293T cells. Acetylation was determined using acetyl lysine IP and then western blot for Flag-ACSS2. (B) ACSS2 is deacetylated by SIRT2 under nutrient stress. Flag-tagged ACSS2 was ectopically expressed in control and SIRT2 knockdown HEK293T cells. SIRT2 knockdown only increased ACSS2 acetylation under nutrient stress. Relative acetylation/Flag ratios were quantified. Error bars represent ± SD for experiments performed in n=3, with ** indicating p<0.01. (C) ACSS2 is deacetylated by SIRT2 under amino acid deprivation. Flag-tagged ACSS2 was ectopically expressed in control and SIRT2 knockdown HEK293T cells. One set was grown in normal media and one set in Earle's balanced salt solution (EBSS) media (no amino acids). Changes in ACSS2 acetylation was determined by acetyl lysine IP and western blot for Flag. Relative acetylation/Flag ratios were quantified. Error bars represent ± SD for experiments performed in n=3, with ** indicating p<0.01.
-
Figure 1—source data 1
PDF file containing original western blots for Figure 1, indicating the relevant bands.
- https://cdn.elifesciences.org/articles/97019/elife-97019-fig1-data1-v1.zip
-
Figure 1—source data 2
Original files for western blot analysis displayed in Figure 1.
- https://cdn.elifesciences.org/articles/97019/elife-97019-fig1-data2-v1.zip
-
Figure 1—source data 3
Excel file containing the numeric data for Figure 1.
- https://cdn.elifesciences.org/articles/97019/elife-97019-fig1-data3-v1.xlsx
Figure 1—figure supplement 1

SIRT2 removes ARF6 myristylation.
Alk12 labeling results of overexpressed ARF6 in SIRT2 control and knockdown cells showing that SIRT2 demyristylates ARF6 in HEK293T cells as indicated by the increased myristylation signal with SIRT2 knockdown.
-
Figure 1—figure supplement 1—source data 1
PDF file containing original western blots for Figure 1—figure supplement 1, indicating the relevant bands.
- https://cdn.elifesciences.org/articles/97019/elife-97019-fig1-figsupp1-data1-v1.zip
-
Figure 1—figure supplement 1—source data 2
Original files for western blot analysis displayed in Figure 1—figure supplement 1.
- https://cdn.elifesciences.org/articles/97019/elife-97019-fig1-figsupp1-data2-v1.zip
Figure 1—figure supplement 2

Western blot showing nutrient exhaustion increases endogenous level of SIRT2.
-
Figure 1—figure supplement 2—source data 1
PDF file containing original western blots for Figure 1—figure supplement 2, indicating the relevant bands.
- https://cdn.elifesciences.org/articles/97019/elife-97019-fig1-figsupp2-data1-v1.zip
-
Figure 1—figure supplement 2—source data 2
Original files for western blot analysis displayed in Figure 1—figure supplement 2.
- https://cdn.elifesciences.org/articles/97019/elife-97019-fig1-figsupp2-data2-v1.zip
Figure 1—figure supplement 3
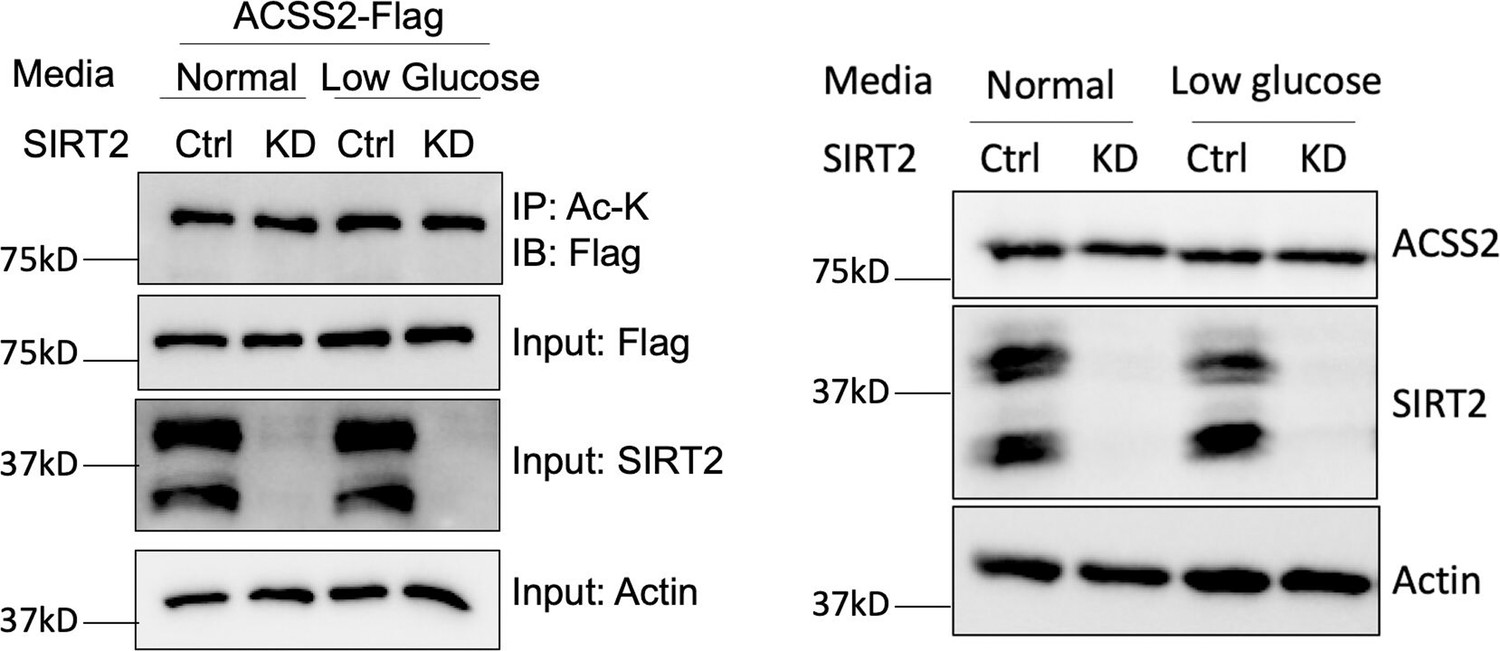
Western blot showing low glucose has no effect on ACSS2 acetylation or endogenous level of ACSS2.
-
Figure 1—figure supplement 3—source data 1
PDF file containing original western blots for Figure 1—figure supplement 3, indicating the relevant bands.
- https://cdn.elifesciences.org/articles/97019/elife-97019-fig1-figsupp3-data1-v1.zip
-
Figure 1—figure supplement 3—source data 2
Original files for western blot analysis displayed in Figure 1—figure supplement 3.
- https://cdn.elifesciences.org/articles/97019/elife-97019-fig1-figsupp3-data2-v1.zip
Figure 1—figure supplement 4

Inhibition of SIRT2 increases ACSS2 acetylation under amino acid deprivation.
HEK293T cells were treated with and without thiomyristoyllysine (TM) (SIRT2 inhibitor) and grown in normal or Earle's balanced salt solution (EBSS) media. Acetylation of ACSS2 was analyzed by acetyl lysine IP and western blot for Flag.
-
Figure 1—figure supplement 4—source data 1
PDF file containing original western blots for Figure 1—figure supplement 3, indicating the relevant bands.
- https://cdn.elifesciences.org/articles/97019/elife-97019-fig1-figsupp4-data1-v1.zip
-
Figure 1—figure supplement 4—source data 2
Original files for western blot analysis displayed in Figure 1—figure supplement 4.
- https://cdn.elifesciences.org/articles/97019/elife-97019-fig1-figsupp4-data2-v1.zip
Figure 1—figure supplement 5

Endogenous ACSS2 acetylation decreases under amino acid deprivation.
-
Figure 1—figure supplement 5—source data 1
PDF file containing original western blots for Figure 1—figure supplement 5, indicating the relevant bands.
- https://cdn.elifesciences.org/articles/97019/elife-97019-fig1-figsupp5-data1-v1.zip
-
Figure 1—figure supplement 5—source data 2
Original files for western blot analysis displayed in Figure 1—figure supplement 5.
- https://cdn.elifesciences.org/articles/97019/elife-97019-fig1-figsupp5-data2-v1.zip
Figure 2 with 9 supplements
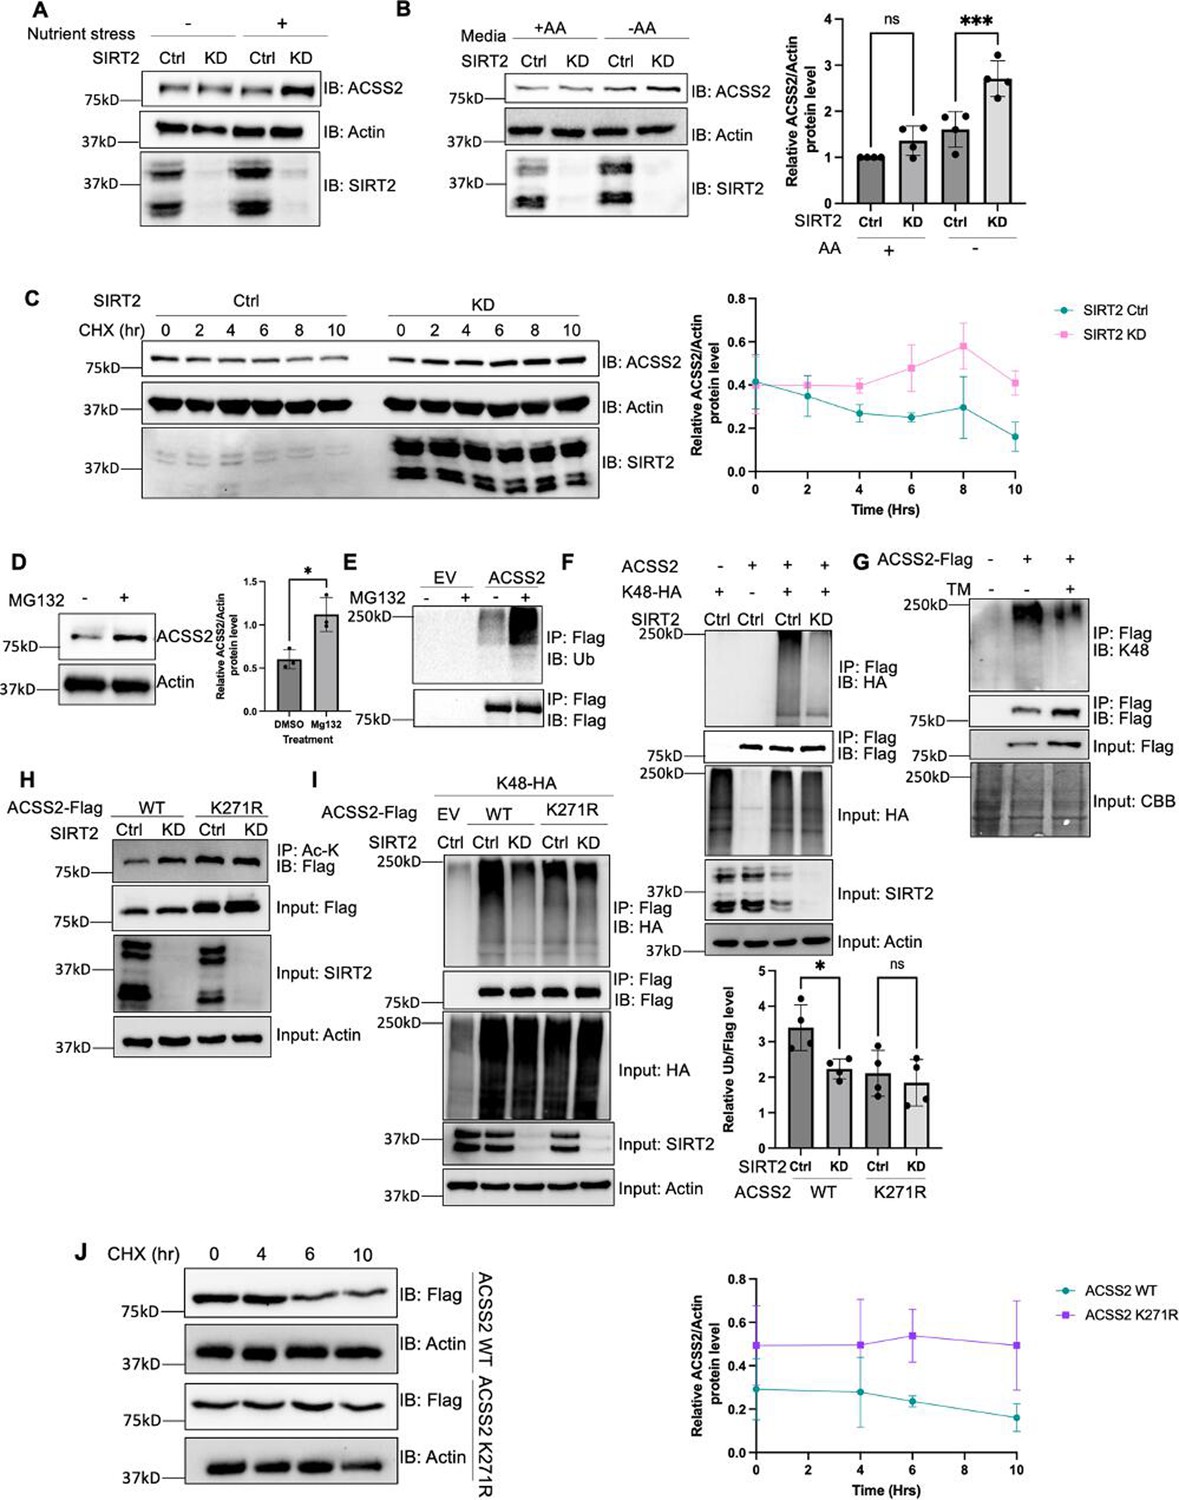
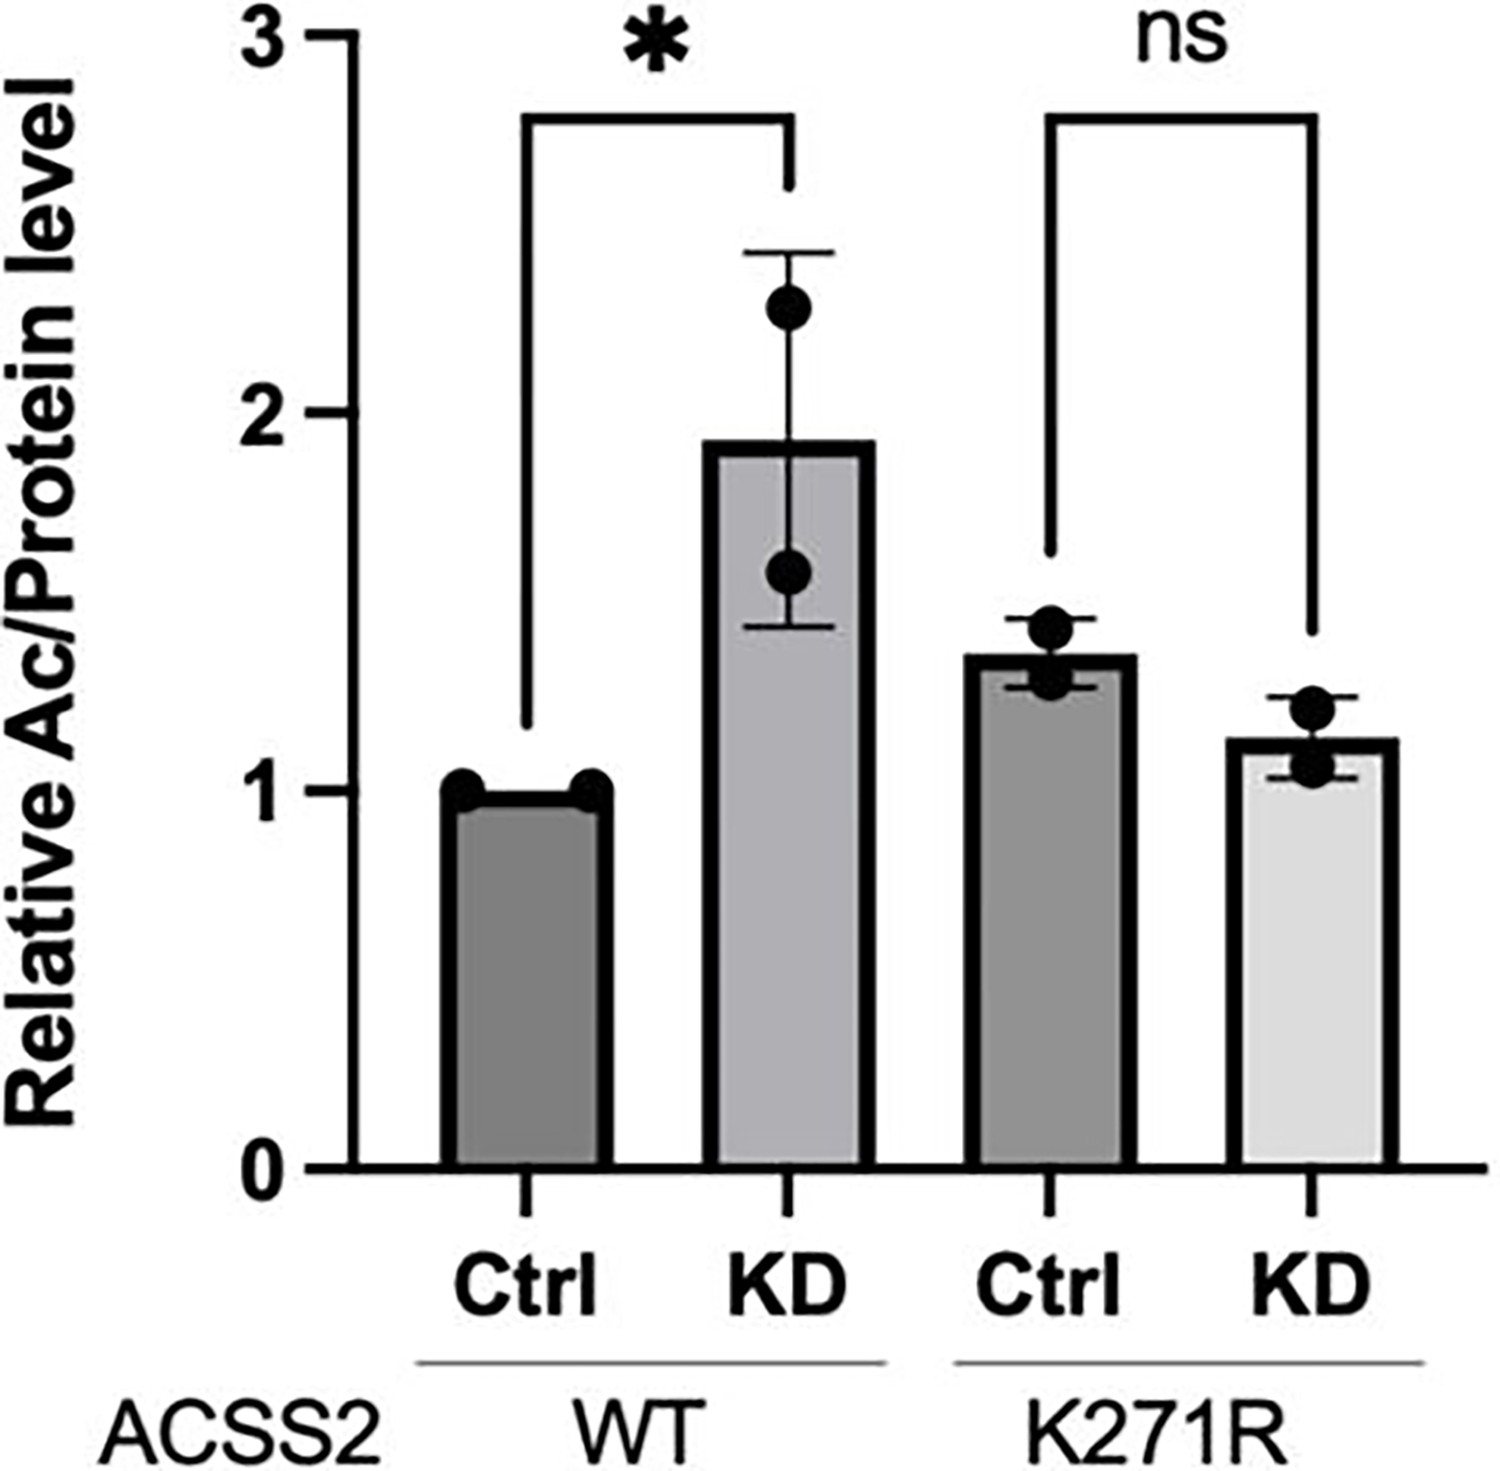
K271 acetylation shields ACSS2 from proteasomal degradation by impeding K271 ubiquitination.
(A and B) Endogenous ACSS2 levels increase when SIRT2 was knocked down under nutrient and amino acid stress. SIRT2 control and knockdown HEK293T cells were maintained in normal and nutrient deprived (A) or Earle's balanced salt solution (EBSS) (B) media and endogenous ACSS2 protein levels were determined by western blot. Relative ACSS2/actin ratios were quantified. ACSS2 level quantification was relative to actin. Error bars represent ± SD for experiments performed in triplicate. (C) Knockdown of SIRT2 stabilizes ACSS2 in amino acid deprived media. SIRT2 control and knockdown HEK293T cells were maintained under EBSS media and treated with cycloheximide (CHX) at the indicated time points. Endogenous ACSS2 level was determined by western blot and quantified. Error bars represent SD for experiments performed in n=3. (D) Endogenous ACSS2 accumulated by treatment of proteasome inhibitor MG132. HEK293T cells were treated with or without MG132. Cells were treated with EBSS media. Endogenous ACSS2 level was determined by western blot and quantified. Error bars represent SD for experiments performed in triplicate. (E) ACSS2 is ubiquitinated. Flag-tagged ACSS2 was transfected into HEK293T cells. The cells were then treated with MG132. Ubiquitination of immunoprecipitated ACSS2 was determined using a pan-ubiquitin antibody. (F) Knockdown of SIRT2 decreases ACSS2 ubiquitination. Flag-ACSS2 was co-transfected with HA-tagged K48 ubiquitin into SIRT2 control and knockdown HEK293T cells. Cells were maintained in EBSS media. Ubiquitination of purified Flag-ACSS2 was analyzed by western blot. (G) Inhibition of SIRT2 with thiomyristoyllysine (TM) decreases ACSS2 ubiquitination. Flag-tagged ACSS2 was transfected into HEK293T cells with or without TM treatment. Cells were maintained in EBSS media. Ubiquitination of immunoprecipitated protein was detected using K48 ubiquitin antibody. (H) SIRT2 deacetylates ACSS2 at K271. Flag-tagged ACSS2 wild-type (WT) and K271R mutant were ectopically expressed in control and SIRT2 knockdown HEK293T cells. Cells were maintained in EBSS media. Acetylation levels were detected by western blot. (I) Knockdown of SIRT2 does not change K271R ACSS2 ubiquitination. Flag-tagged WT and K271R ACSS2 were co-transfected with HA-tagged K48 ubiquitin into SIRT2 control and knockdown HEK293T cells. Ubiquitination of purified proteins was analyzed by western blot and quantified. Ubiquitination quantification is relative to Flag tag. Error bars represent SD for experiments performed in triplicate. (J) ACSS2 K271R mutant is more stable than WT. Flag-tagged ACSS2 WT or K271R mutant were ectopically expressed in HEK293T cells. Cells were treated with CHX to inhibit protein synthesis. The levels of the WT and K271R mutant ACSS2 at different time points were determined by western blot and quantified. Error bars represent SD for experiments performed in triplicate.
-
Figure 2—source data 1
PDF file containing original western blots for Figure 2, indicating the relevant bands.
- https://cdn.elifesciences.org/articles/97019/elife-97019-fig2-data1-v1.zip
-
Figure 2—source data 2
Original files for western blot analysis displayed in Figure 2.
- https://cdn.elifesciences.org/articles/97019/elife-97019-fig2-data2-v1.zip
-
Figure 2—source data 3
Excel file containing the numeric data for Figure 2.
- https://cdn.elifesciences.org/articles/97019/elife-97019-fig2-data3-v1.xlsx
Figure 2—figure supplement 1

Inhibition of SIRT2 using thiomyristoyllysine (TM) results in an increase in endogenous ACSS2 in amino acid deprived media but not normal media.
-
Figure 2—figure supplement 1—source data 1
PDF file containing original western blots for Figure 2—figure supplement 1, indicating the relevant bands.
- https://cdn.elifesciences.org/articles/97019/elife-97019-fig2-figsupp1-data1-v1.zip
-
Figure 2—figure supplement 1—source data 2
Original files for western blot analysis displayed in Figure 2—figure supplement 1.
- https://cdn.elifesciences.org/articles/97019/elife-97019-fig2-figsupp1-data2-v1.zip
Figure 2—figure supplement 2
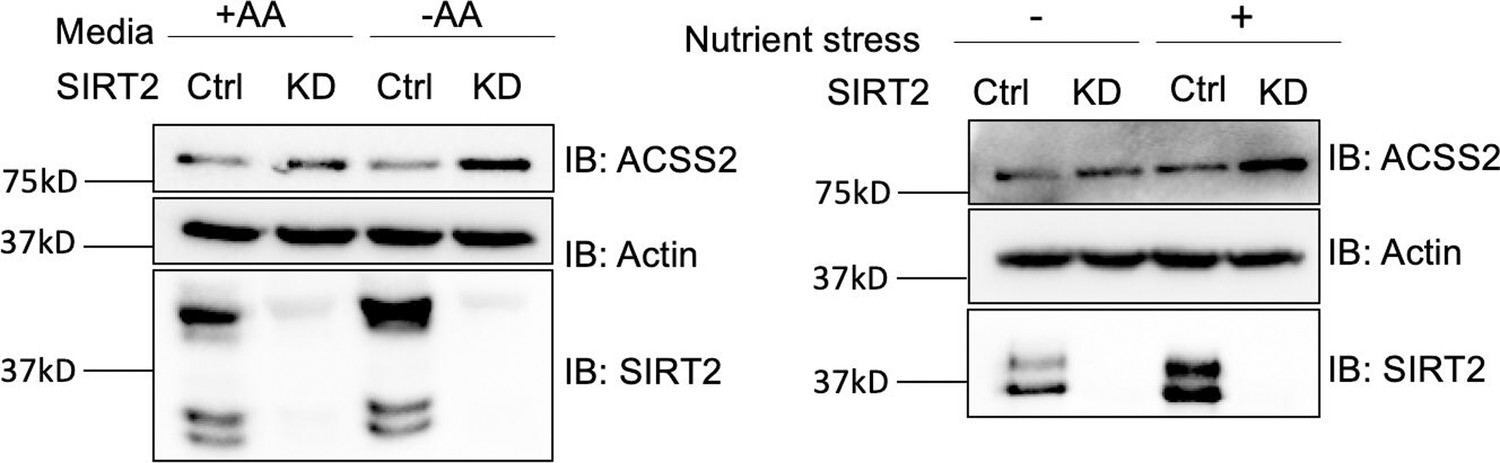
Endogenous ACSS2 levels increase when SIRT2 is knocked down under nutrient and amino acid stress.
SIRT2 control and knockdown A549 cells were maintained in Earle's balanced salt solution (EBSS) or normal and nutrient deprived media and endogenous ACSS2 protein levels were determined by western blot.
-
Figure 2—figure supplement 2—source data 1
PDF file containing original western blots for Figure 2—figure supplement 2, indicating the relevant bands.
- https://cdn.elifesciences.org/articles/97019/elife-97019-fig2-figsupp2-data1-v1.zip
-
Figure 2—figure supplement 2—source data 2
Original files for western blot analysis displayed in Figure 2—figure supplement 2.
- https://cdn.elifesciences.org/articles/97019/elife-97019-fig2-figsupp2-data2-v1.zip
Figure 2—figure supplement 3
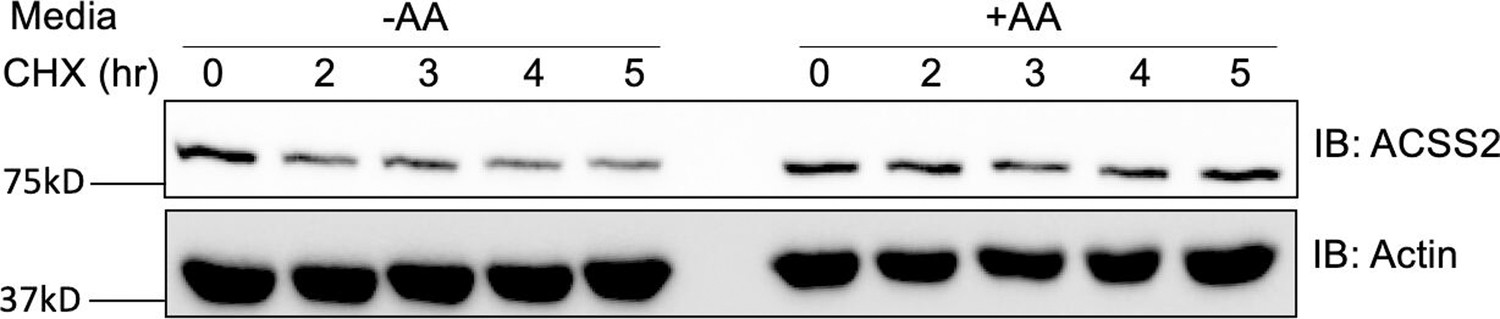
ACSS2 is destabilized in amino acid deprived media.
HEK293T cells were maintained in normal and Earle's balanced salt solution (EBSS) media and treated with cycloheximide (CHX) and for various time points. Endogenous ACSS2 protein levels were analyzed by western blot.
-
Figure 2—figure supplement 3—source data 1
PDF file containing original western blots for Figure 2—figure supplement 3, indicating the relevant bands.
- https://cdn.elifesciences.org/articles/97019/elife-97019-fig2-figsupp3-data1-v1.zip
-
Figure 2—figure supplement 3—source data 2
Original files for western blot analysis displayed in Figure 2—figure supplement 3.
- https://cdn.elifesciences.org/articles/97019/elife-97019-fig2-figsupp3-data2-v1.zip
Figure 2—figure supplement 4
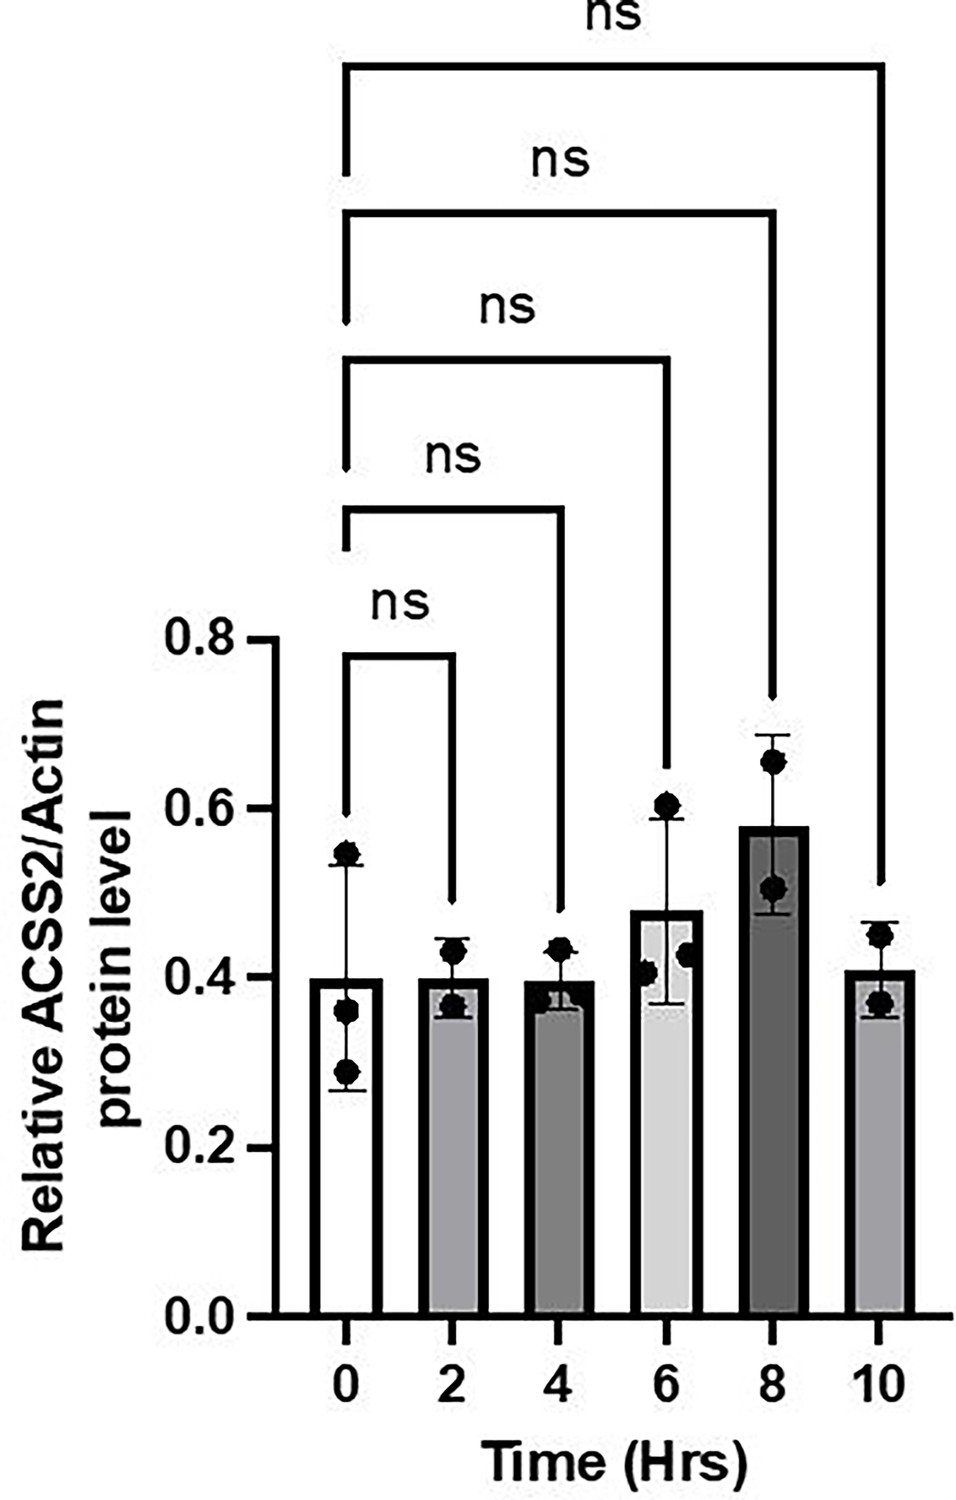
Graph of ACSS2 level for each time point for SIRT2 knockdown samples (data from Figure 2C).
There are no significant changes in ACSS2 levels.
-
Figure 2—figure supplement 4—source data 1
Excel file containing the numeric data for Figure 2—figure supplement 4.
- https://cdn.elifesciences.org/articles/97019/elife-97019-fig2-figsupp4-data1-v1.xlsx
Figure 2—figure supplement 5
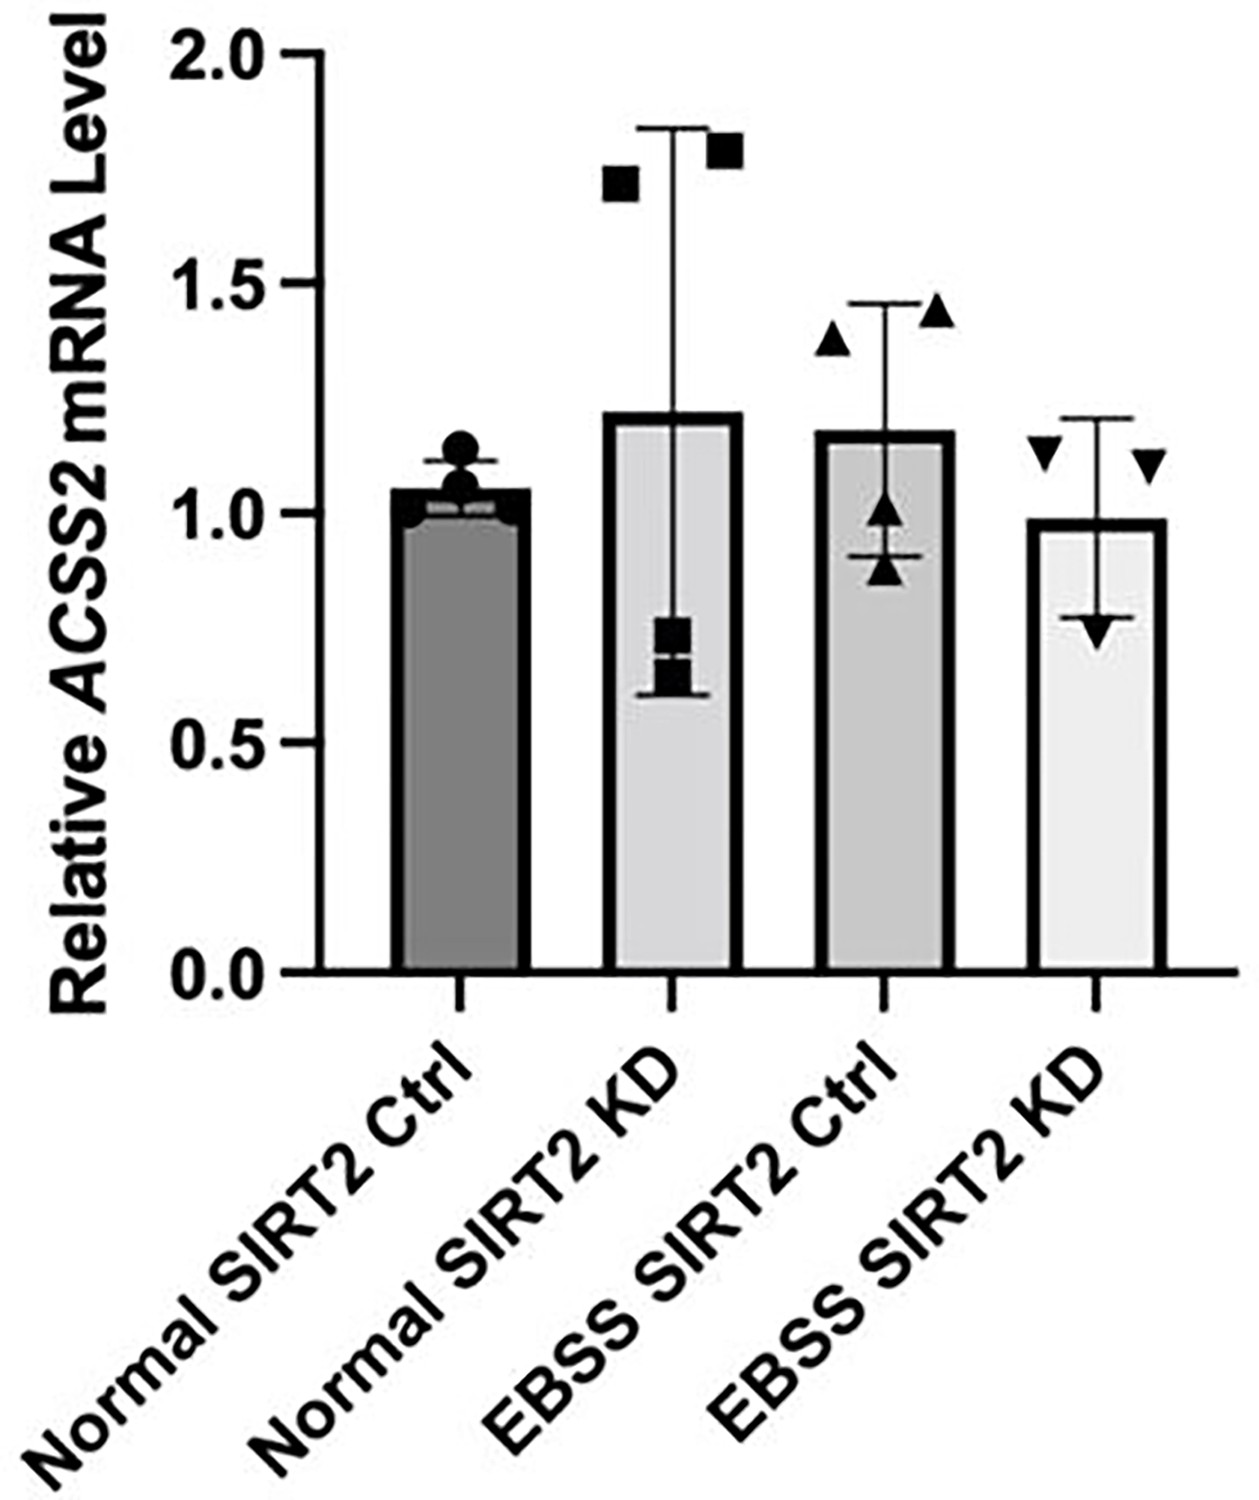
qPCR showing ACSS2 transcript levels do not change with SIRT2 knockdown or amino acid deprivation.
Each data point is a biological replicate.
-
Figure 2—figure supplement 5—source data 1
Excel file containing the numeric data for Figure 2—figure supplement 5.
- https://cdn.elifesciences.org/articles/97019/elife-97019-fig2-figsupp5-data1-v1.xlsx
Figure 2—figure supplement 6
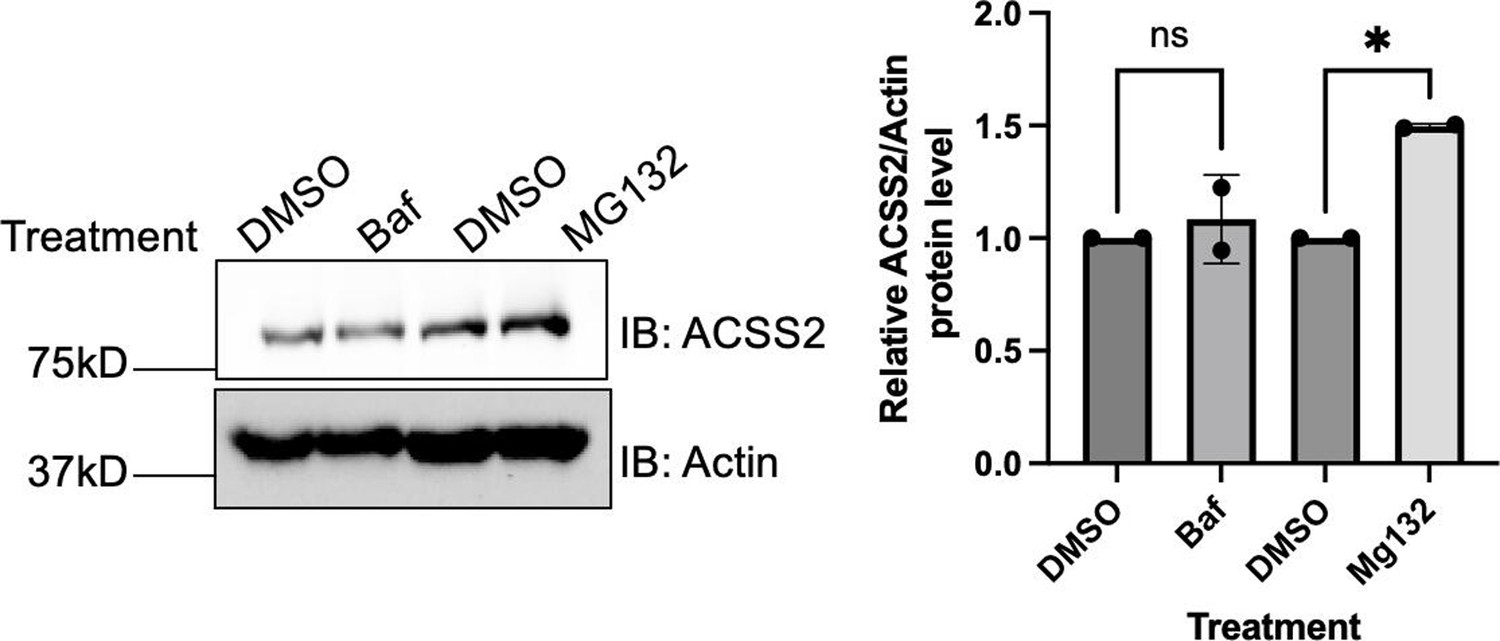
ACSS2 is degraded by the proteasome pathway.
Each data point is a biological replicate.
-
Figure 2—figure supplement 6—source data 1
PDF file containing original western blots for , indicating the Figure 2—figure supplement 6 relevant bands.
- https://cdn.elifesciences.org/articles/97019/elife-97019-fig2-figsupp6-data1-v1.zip
-
Figure 2—figure supplement 6—source data 2
Original files for western blot analysis displayed in Figure 2—figure supplement 6.
- https://cdn.elifesciences.org/articles/97019/elife-97019-fig2-figsupp6-data2-v1.zip
Figure 2—figure supplement 7
Quantification of the relative acetylation levels of wild-type (WT) and K271R ACSS2 in SIRT2 control and knockdown cells.
-
Figure 2—figure supplement 7—source data 1
Excel file containing the numeric data for Figure 2—figure supplement 7.
- https://cdn.elifesciences.org/articles/97019/elife-97019-fig2-figsupp7-data1-v1.xlsx
Figure 2—figure supplement 8

Western blot showing SIRT2 does not deacetylate ACSS2 at K661.
-
Figure 2—figure supplement 8—source data 1
PDF file containing original western blots for Figure 2—figure supplement 8, indicating the relevant bands.
- https://cdn.elifesciences.org/articles/97019/elife-97019-fig2-figsupp8-data1-v1.zip
-
Figure 2—figure supplement 8—source data 2
Original files for western blot analysis displayed in Figure 2—figure supplement 8.
- https://cdn.elifesciences.org/articles/97019/elife-97019-fig2-figsupp8-data2-v1.zip
Figure 2—figure supplement 9

Mutation of K271 decreases ACSS2 ubiquitylation.
-
Figure 2—figure supplement 9—source data 1
PDF file containing original western blots for Figure 2—figure supplement 9, indicating the relevant bands.
- https://cdn.elifesciences.org/articles/97019/elife-97019-fig2-figsupp9-data1-v1.zip
-
Figure 2—figure supplement 9—source data 2
Original files for western blot analysis displayed in Figure 2—figure supplement 9.
- https://cdn.elifesciences.org/articles/97019/elife-97019-fig2-figsupp9-data2-v1.zip
Figure 3 with 2 supplements
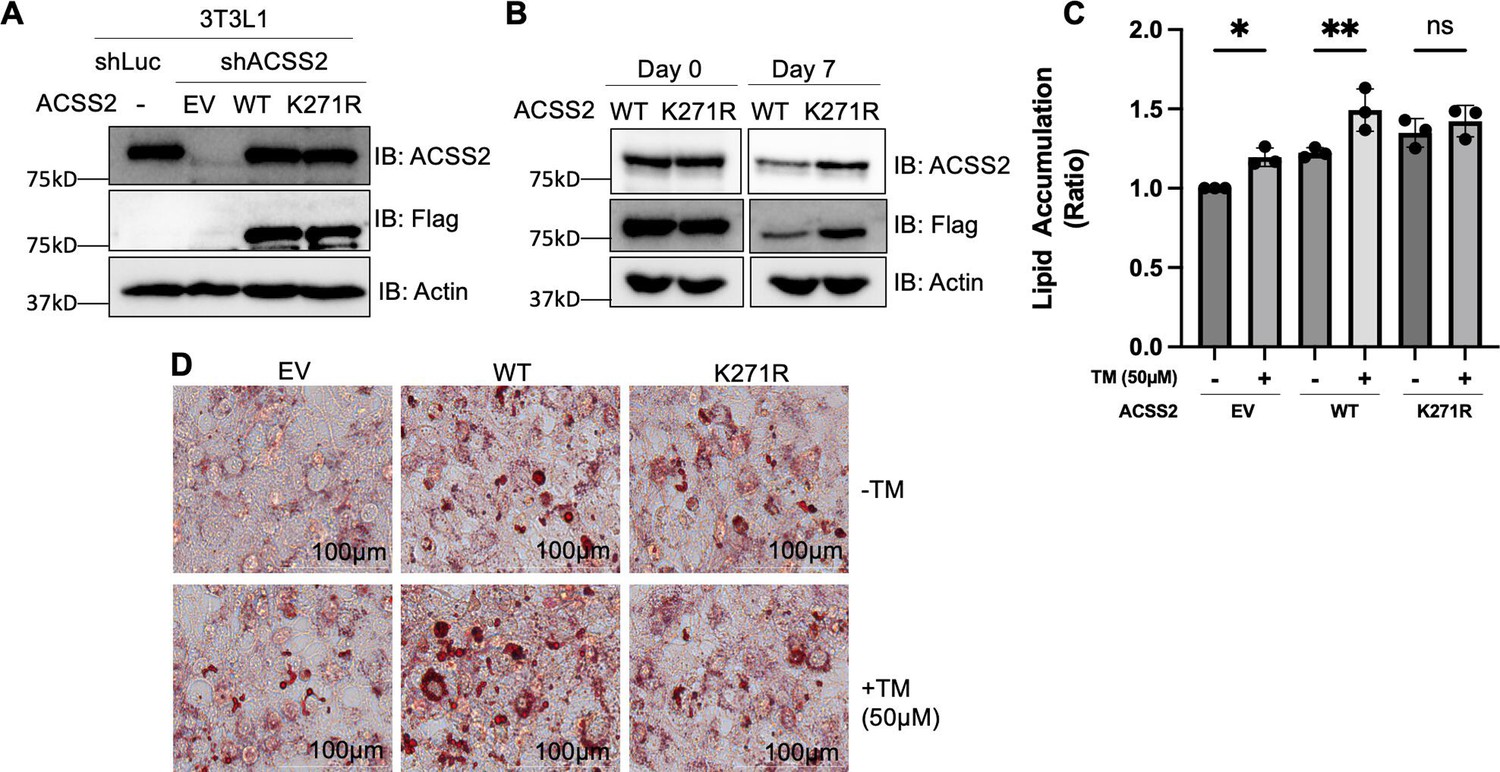
Acetylation of ACSS2 at K271 promotes lipid accumulation.
(A) Endogenous ACSS2 was stably knocked down with short hairpin RNA (shRNA) in 3T3L1 cells and then wild-type (WT) or K271R mutant of ACSS2 was re-expressed in the knockdown cells to a level that is compatible with endogenous ACSS2. ACSS2 knockdown efficiency and re-expression levels were determined by western blot. (B) The cell lysate at days 0 and 7 were collected and ACSS2 level was measured by western blot. (C, D) Inhibition of SIRT2 with thiomyristoyllysine (TM) results in increased neutral lipid accumulation in cells expressing ACSS2 WT but not in cells expressing ACSS2 K271R mutant. The differentiation media was supplemented with 1.5 mM acetate. Accumulation of neutral lipids in differentiated adipocytes was measured using Oil Red O. Neutral lipid accumulation is quantified (C) by measuring the absorbance of stained neutral lipids at 500 nm on a plate reader. Representative cell imaging is shown in (D). Statistical analysis was performed using an unpaired two-tailed Student’s t-test, with * indicating p<0.05 and ** indicating p<0.01.
-
Figure 3—source data 1
PDF file containing original western blots for Figure 3, indicating the relevant bands.
- https://cdn.elifesciences.org/articles/97019/elife-97019-fig3-data1-v1.zip
-
Figure 3—source data 2
Original files for western blot analysis displayed in Figure 3.
- https://cdn.elifesciences.org/articles/97019/elife-97019-fig3-data2-v1.zip
-
Figure 3—source data 3
Excel file containing the numeric data for Figure 1.
- https://cdn.elifesciences.org/articles/97019/elife-97019-fig3-data3-v1.xlsx
Figure 3—figure supplement 1
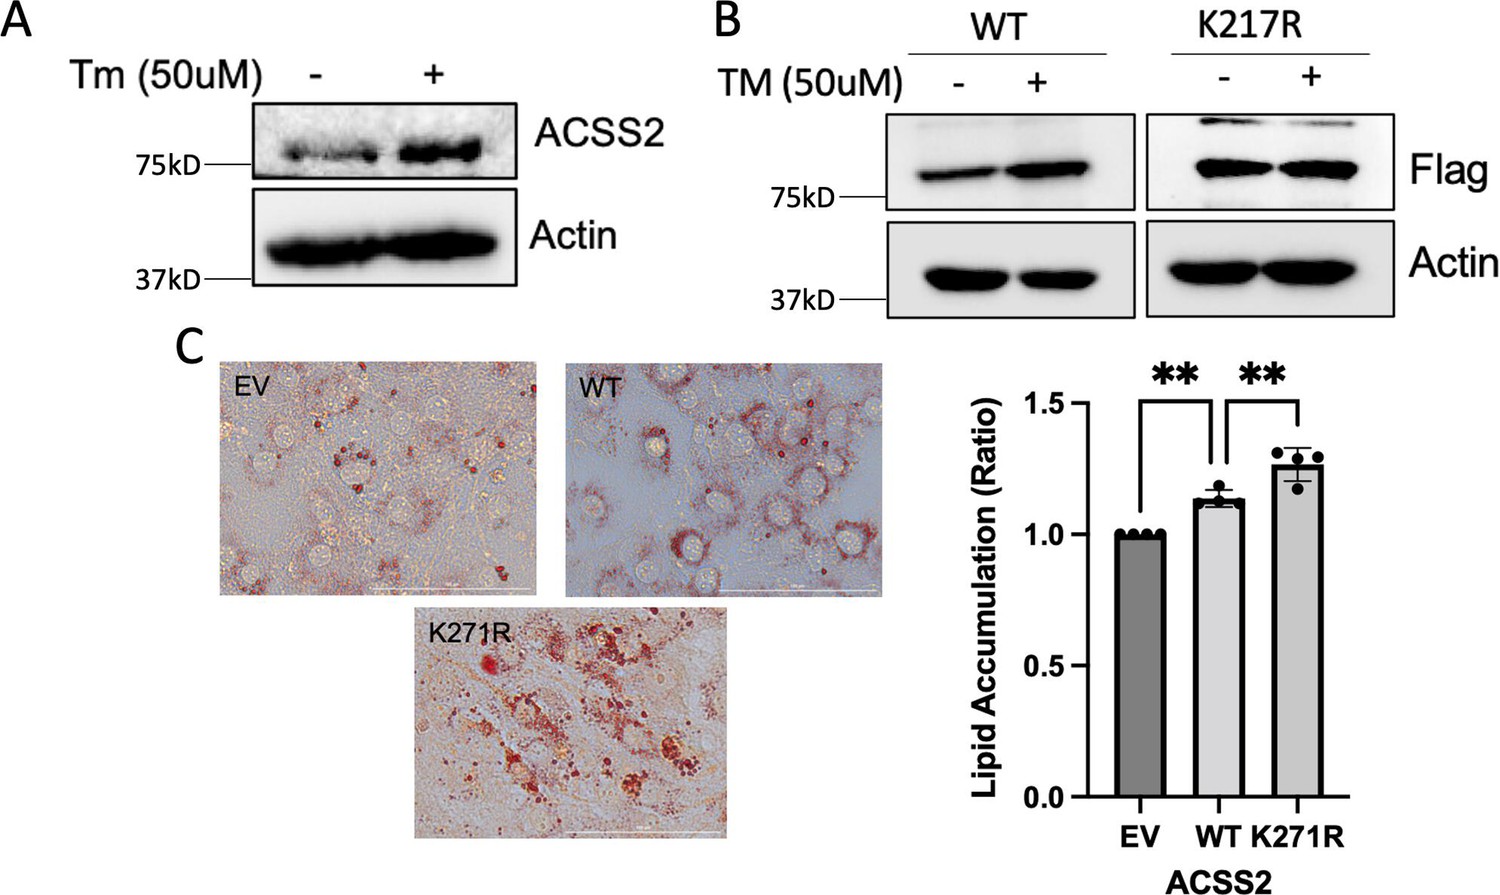
Acetylation at K271 promotes increased lipid accumulation.
(A) Thiomyristoyllysine (TM) treatment in 3T3-L1 cells results in increased levels of endogenous ACSS2. (B) Inhibition of SIRT2 with TM leads to an increase in wild-type (WT) ACSS2 levels but does not affect the levels of the K271R mutant. (C) Oil Red O quantification shows that cells expressing the K271R mutant accumulate higher levels of lipids.
-
Figure 3—figure supplement 1—source data 1
PDF file containing original western blots for Figure 3—figure supplement 1, indicating the relevant bands.
- https://cdn.elifesciences.org/articles/97019/elife-97019-fig3-figsupp1-data1-v1.zip
-
Figure 3—figure supplement 1—source data 2
Original files for western blot analysis displayed in Figure 3—figure supplement 1.
- https://cdn.elifesciences.org/articles/97019/elife-97019-fig3-figsupp1-data2-v1.zip
Figure 3—figure supplement 2
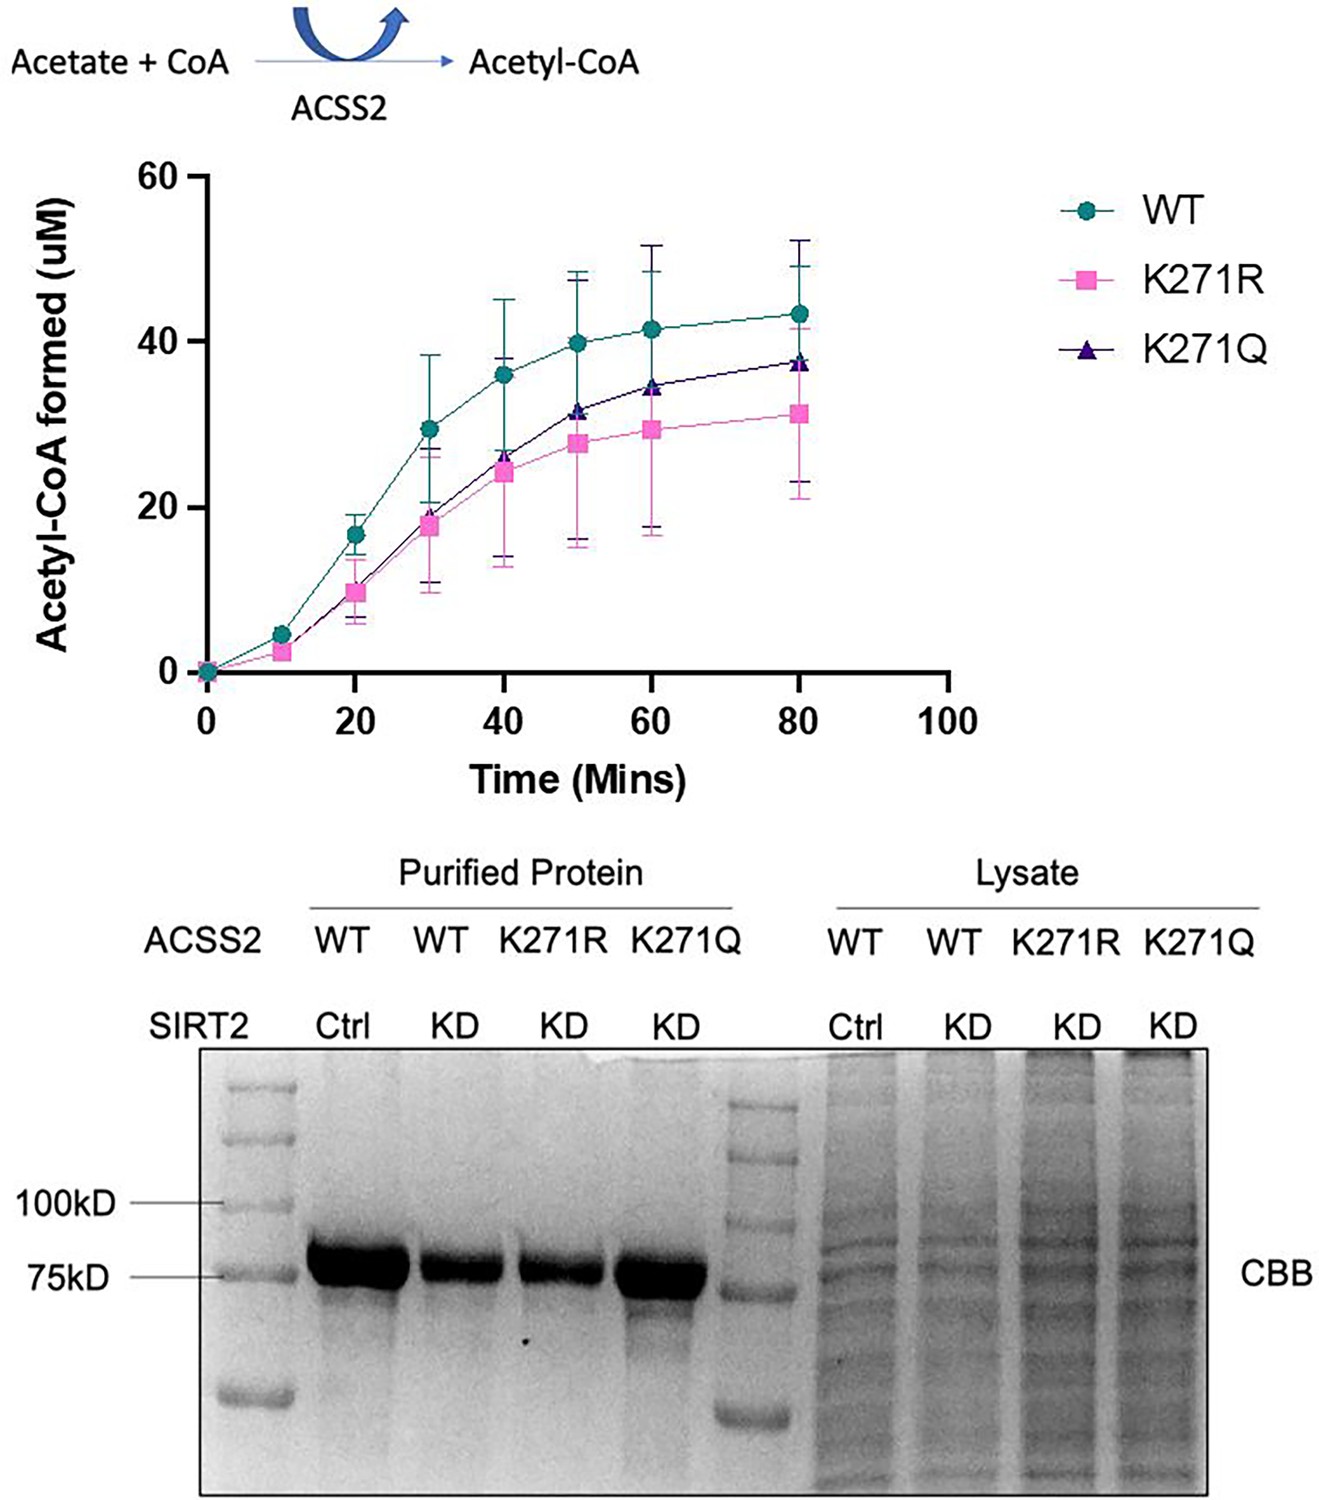
ACSS2 wild-type (WT) and mutant activity assay.
Overexpressed ACSS2-Flag WT, K271R, and K271Q was purified from SIRT2 knockdown HEK293T cells. ACSS2 activity was determined by measuring the formation of acetyl coenzyme A (acetyl-CoA) from acetate and CoA over time.
-
Figure 3—figure supplement 2—source data 1
PDF file containing original western blots for Figure 3—figure supplement 1, indicating the relevant bands.
- https://cdn.elifesciences.org/articles/97019/elife-97019-fig3-figsupp2-data1-v1.zip
-
Figure 3—figure supplement 2—source data 2
Original files for western blot analysis displayed in Figure 3—figure supplement 1.
- https://cdn.elifesciences.org/articles/97019/elife-97019-fig3-figsupp2-data2-v1.zip
Figure 4
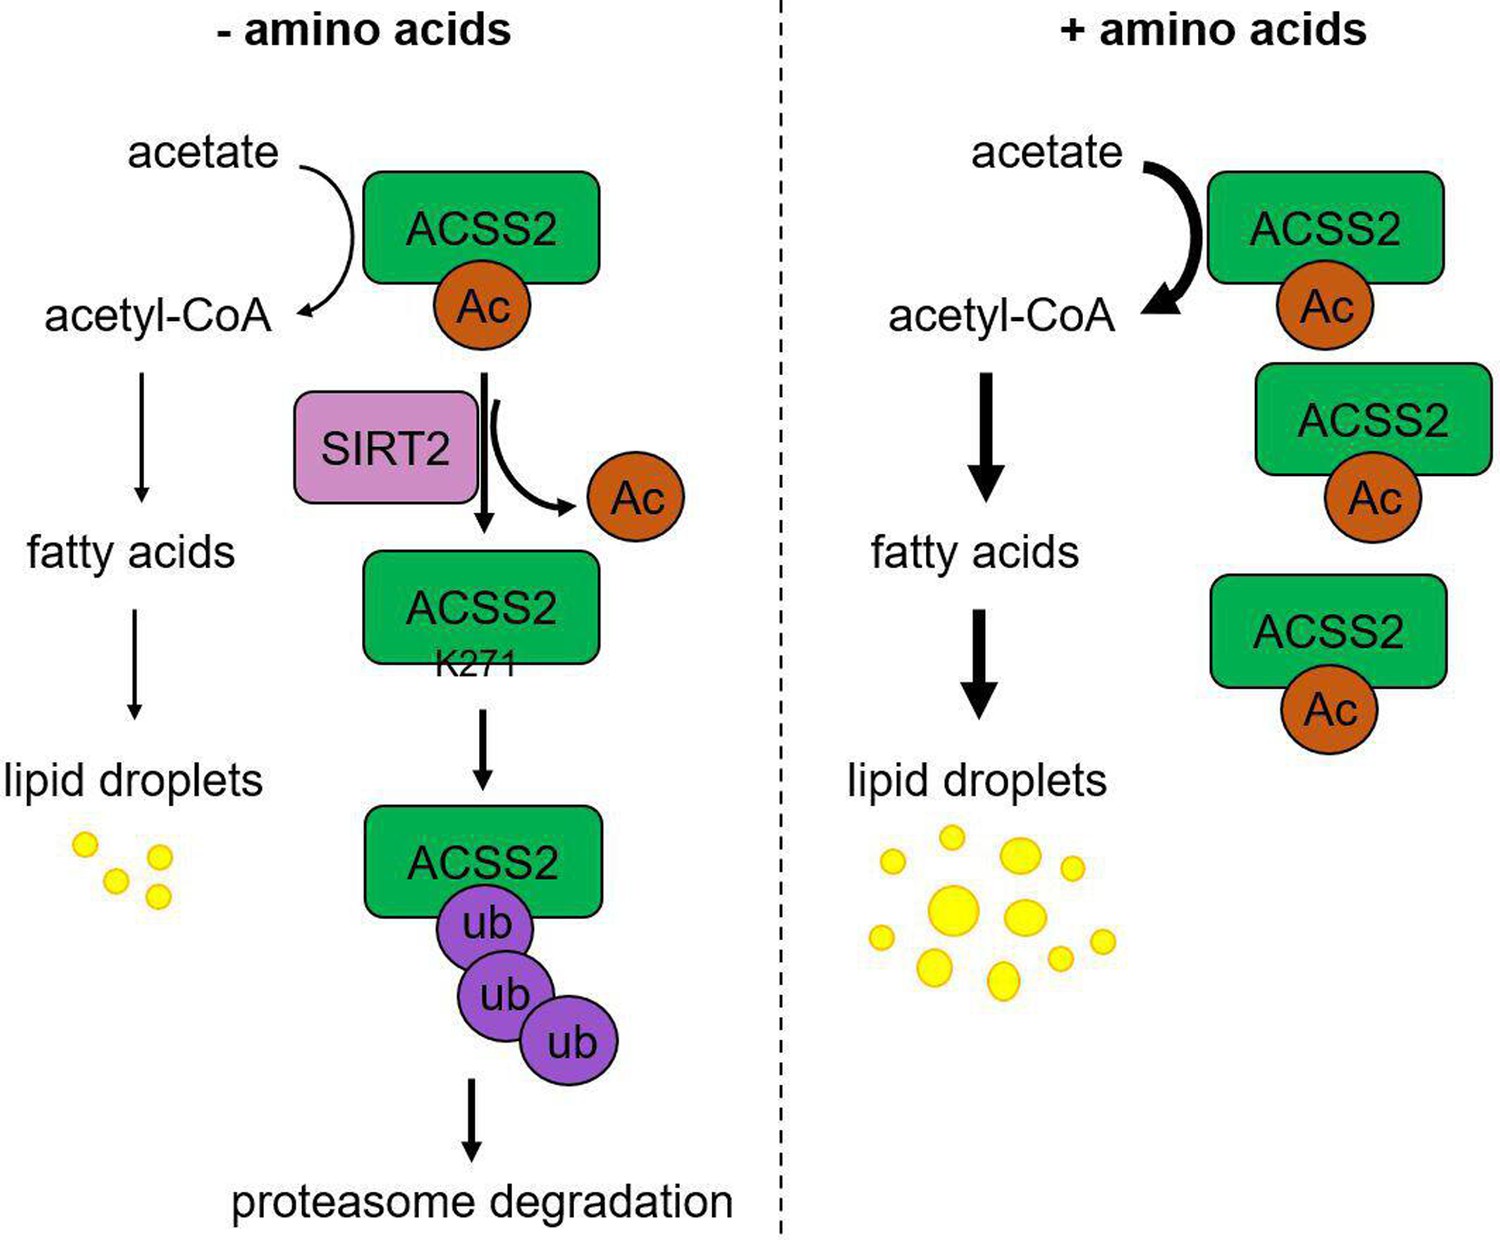
Working model.
Under amino acid stress, SIRT2 actively deacetylates ACSS2 at K271, which reveals the site for ubiquitination and leads to the degradation of ACSS2. This downregulation of ACSS2 protein level results in decreased de novo lipogenesis (DNL). On the contrary, without amino acid stress, acetylation at K271 protects ACSS2 from degradation resulting in higher DNL.
Additional files
-
Supplementary file 1
Sites on ACSS2 identified by mass spectrometry to change with SIRT2 knockdown.
- https://cdn.elifesciences.org/articles/97019/elife-97019-supp1-v1.docx
-
MDAR checklist
- https://cdn.elifesciences.org/articles/97019/elife-97019-mdarchecklist1-v1.docx
Download links
A two-part list of links to download the article, or parts of the article, in various formats.
Downloads (link to download the article as PDF)
Open citations (links to open the citations from this article in various online reference manager services)
Cite this article (links to download the citations from this article in formats compatible with various reference manager tools)
SIRT2-mediated ACSS2 K271 deacetylation suppresses lipogenesis under nutrient stress
eLife 13:RP97019.
https://doi.org/10.7554/eLife.97019.3


