Iron-sulfur cluster loss in mitochondrial CISD1 mediates PINK1 loss-of-function phenotypes
- University Medical Center of the Johannes Gutenberg-University Mainz, Institute for Molecular Medicine, Germany
- Institute for Occupational, Social and Environmental Medicine, RWTH Aachen University, Germany
- Comprehensive Cancer Center Mainfranken, University Hospital Würzburg, Germany
- Research Unit Analytical BioGeoChemistry, Helmholtz Zentrum München-German, Research Center for Environmental Health GmbH, Germany
- Experimental and Translational Research, Department of Otorhinolaryngology, University Hospital Essen, Germany
- University of Luxembourg, Luxembourg Centre for Systems Biomedicine, Luxembourg
- Luxembourg Institute of Health (LIH), Luxembourg
- Centre Hospitalier de Luxembourg (CHL), Luxembourg
Figures
Figure 1
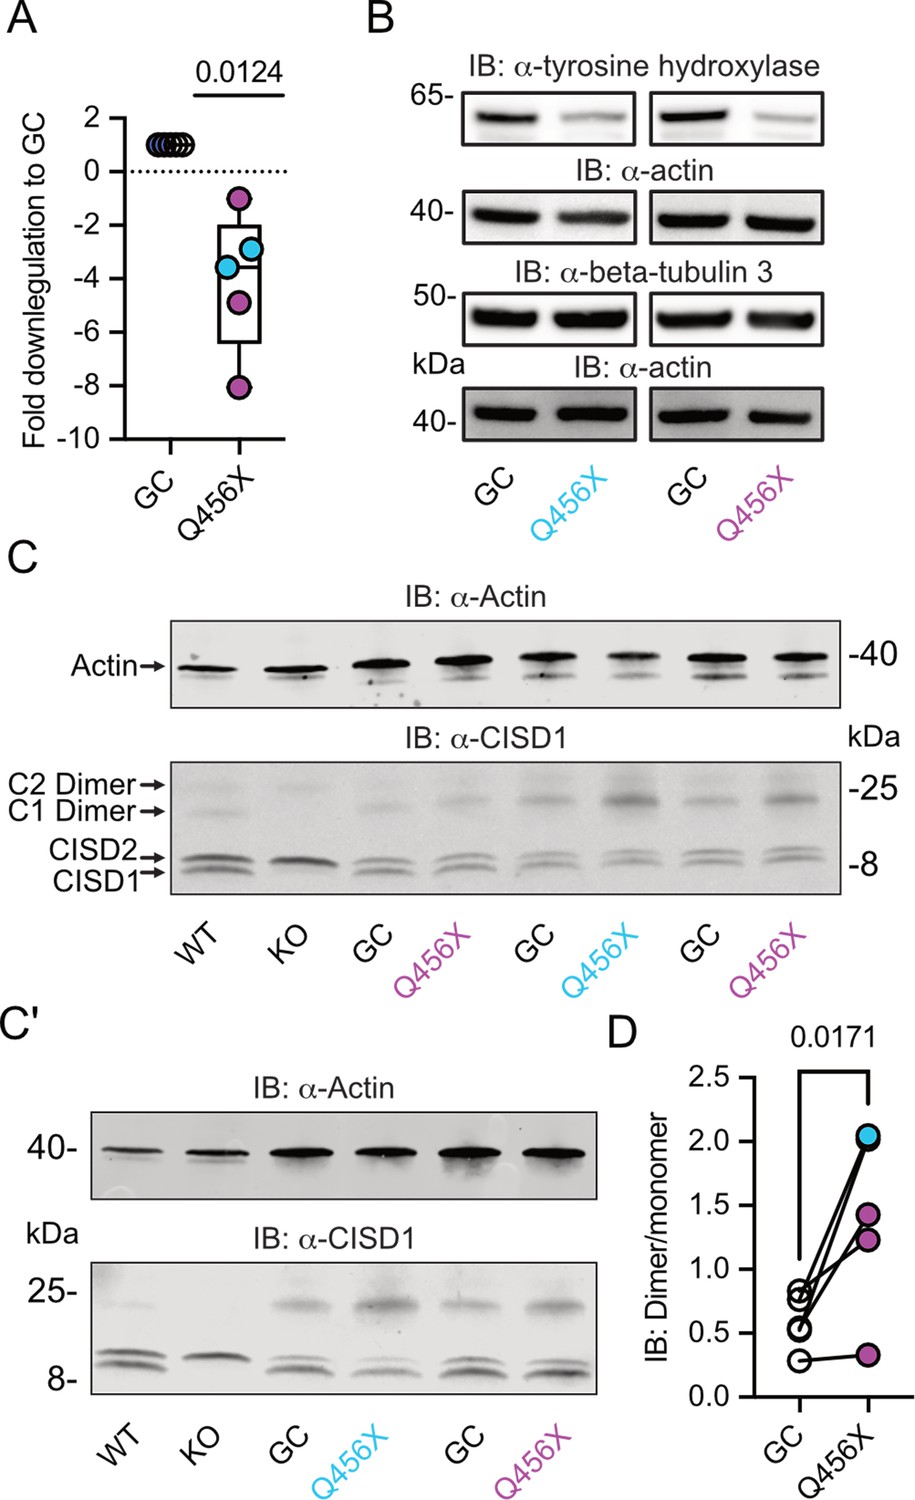
Increased CISD1 dimer formation in human dopaminergic neurons from Parkinson’s disease (PD) patients with a PINK1 Q456X mutation.
(A) Quantitative PCR analysis of PINK1 mRNA expression in induced pluripotent stem cell (iPSC)-derived dopaminergic neurons from PD patients carrying the PINK1 Q456X mutation, colors indicate two different patients. ACTB served as housekeeping control. Expression levels were normalized to gene-corrected (GC) controls. (B) Immunoblots of tyrosine hydroxylase as a marker for dopaminergic neurons and beta-tubulin 3 as a general neuronal marker. Actin served as loading control, size is indicated. (C, C’) Immunoblots of CISD1 and CISD2 with lysates from different patients, GC controls, and independent differentiations over 28 days in vitro. Monomeric and dimeric forms of both proteins are indicated by arrows. CISD1 knockout (KO) and wildtype (WT) mouse embryonic fibroblasts served to identify the correct bands. Actin served as loading control, size is indicated. (D) Quantification of the CISD1 dimer/monomer ratio reveals an increased ratio in PINK1 Q456X dopaminergic neurons over gene-corrected controls. Each data point corresponds to an independent differentiation over 28 days and the colors designate the two different patients. Data in A were normalized to the respective gene-corrected control and are presented as box and whisker plots with the box extending from the 25th to the 75th percentile and the whiskers from the minimum to the maximum value depicting all individual data points. Data points in D correspond to the mean of two independent technical replicates of five independent differentiations from two patients and are unnormalized. Statistical analysis was done using the one-sided t test in A and a nested t test in D, p values are indicated.
-
Figure 1—source data 1
Raw and labeled blots of iPSC-derived dopaminergic neurons from PD patients carrying the PINK1 Q456X with their gene corrected controls.
- https://cdn.elifesciences.org/articles/97027/elife-97027-fig1-data1-v2.zip
-
Figure 1—source data 2
Raw data of PCR and immunoblot quantifications of Figure 1.
- https://cdn.elifesciences.org/articles/97027/elife-97027-fig1-data2-v2.zip
Figure 2
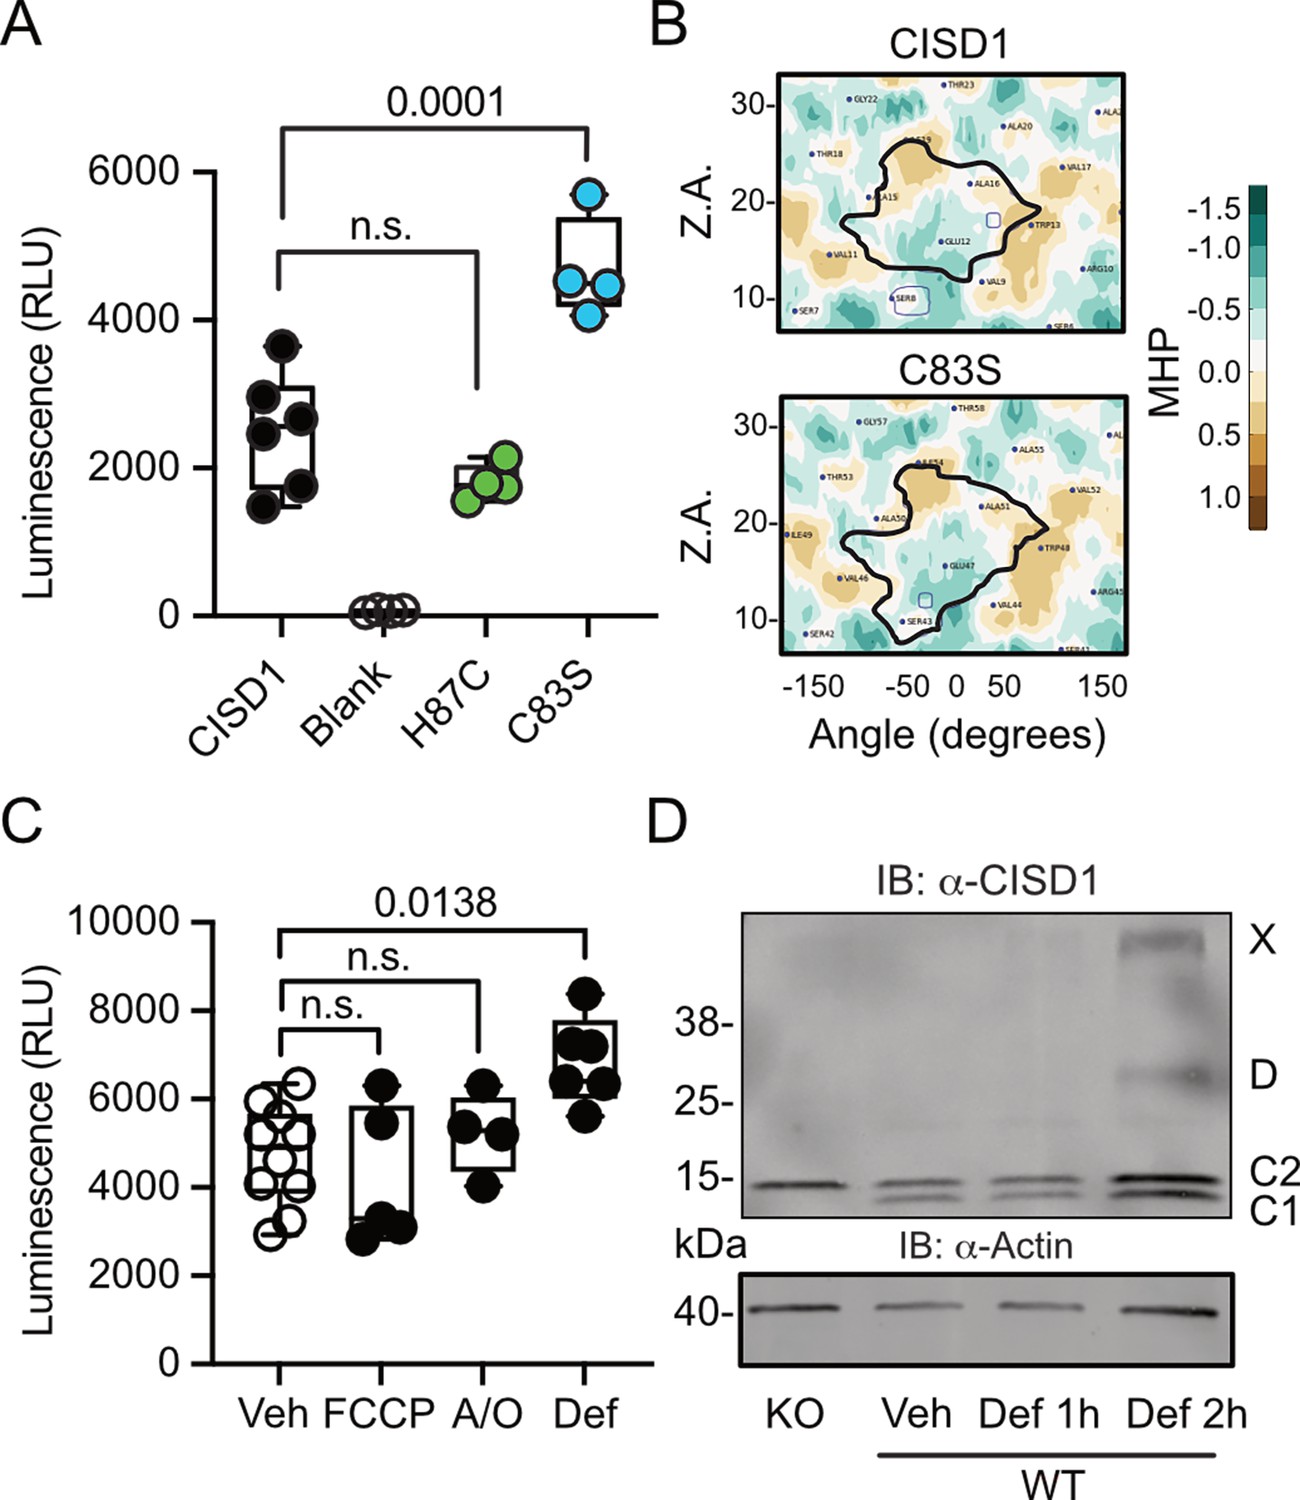
CISD1 lacking its iron-sulfur cluster has a higher propensity to dimerize.
(A) Cells were transiently transfected with wildtype (WT) or point-mutated CISD1 tagged with split NanoLuc fragments. Luminescence was quantified after 48 hr. (B) 2D maps of the molecular hydrophobicity potential (MHP) on the peptide surfaces in two CISD1 models or two C83S models. Dimerization interfaces are outlined. Axis values correspond to the rotation angle around the helical axis (α) and the distance along the latter (Z), 2D maps are colored according to MHP arbitrary units. The surface-surface area is indicated by a solid line. (C) Cells were transiently transfected with WT CISD1 tagged with split NanoLuc fragments and treated for 2 hr with 1 µM carbonyl cyanide-p-trifluoromethoxyphenylhydrazone (FCCP), 2.5 µM antimycin and oligomycin (A/O), or 1 mM deferiprone (Def) before addition of substrate and quantification of luminescence. (D) Immunoblot of WT mouse embryonic fibroblast (MEF) cells treated for the indicated period of time with 1 mM Def or vehicle (Veh). Knockout (KO) cells served as control for antibody specificity and actin as loading control. Each data point in A and C is from five independent experiments done in triplicates. Data are presented as box and whisker plots with the box extending from the 25th to the 75th percentile and the whiskers from the minimum to the maximum value depicting all individual data points. Statistical analysis was done using one-way ANOVA, p values are indicated.
-
Figure 2—source data 1
Immunoblots of WT MEF cells treated with deferiprone or vehicle.
- https://cdn.elifesciences.org/articles/97027/elife-97027-fig2-data1-v2.zip
-
Figure 2—source data 2
Raw data of the dimerization assays in Figure 2.
- https://cdn.elifesciences.org/articles/97027/elife-97027-fig2-data2-v2.zip
Figure 3 with 1 supplement
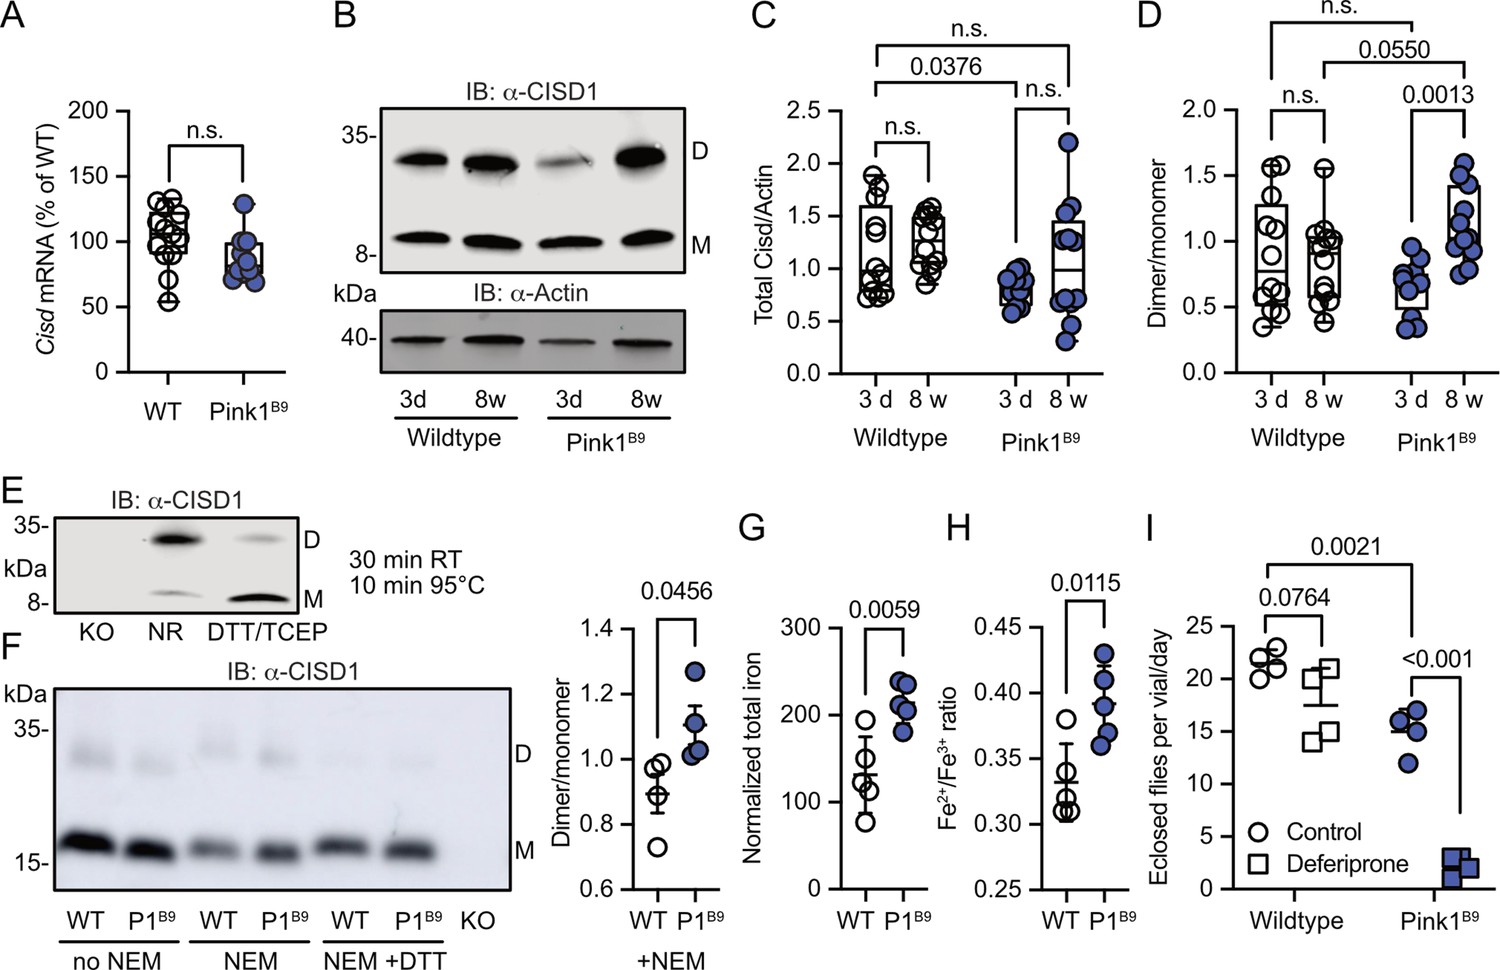
Increased Cisd dimer levels and altered redox and iron homeostasis in Pink1 mutant flies.
(A) Quantitative PCR analysis of Cisd mRNA levels in Pink1B9 flies. RpL32/Rp49 served as housekeeping control. Each dot represents the mean relative transcriptional level of a sample of five flies. The values were normalized to the mean value of wildtype (WT) flies. (B) Immunoblot analysis of Cisd abundance in the indicated fly strains at different ages, 3 days (d) and 8 weeks (w). Actin served as loading control, size is indicated. (M) Cisd monomers and (D) dimers. (C) Total Cisd (D+M) normalized to actin. Each dot represents the mean of two technical replicates from n=12 independent samples of two male flies. (D) Dimer/monomer ratio of the same samples. (E) Immunoblot analysis of Cisd protein levels in w1118 flies. Samples were exposed to a non-reducing buffer (NR) or reducing buffer containing 100 mM dithiothreitol (DTT) and 50 mM TCEP. Cisd knockout (KO) lysates served as negative control for the Cisd bands. Actin served as loading control, size is indicated. (M) Cisd monomers and (D) dimers. (F) Cisd immunoblot analysis in the absence and presence of N-ethylmaleimide (NEM) and the reducing agent DTT and quantification of the dimer/monomer ratio in the presence of NEM. (G) Total iron content and (H) Fe2+/Fe3+ ratio measured via electrophoresis-inductively coupled plasma mass spectrometry (CE-ICP-MS) in WT and Pink1B9 flies. Each dot represents a group of three male flies. n=5. (I) Flies of the same age, number, and sex ratio were allowed to mate and lay eggs in normal food or food prepared with a 65 µM final concentration of deferiprone. Each dot represents the average number of eclosed flies per vial and day for 3 consecutive days. Data are presented in A/C/D as box and whisker plots with the box extending from the 25th to the 75th percentile and the whiskers from the minimum to the maximum value depicting all individual data points and as scatter plots with the mean and SD in F–I. Statistical analysis was done using one-way ANOVA in A, two-way ANOVA in C/D, and Student’s t test in F–I, p values are indicated.
-
Figure 3—source data 1
Raw and labeled blots of young and old wildtype and Pink1B9 flies blotted against CISD1 or actin as well as flies treated with or without NEM or DTT.
- https://cdn.elifesciences.org/articles/97027/elife-97027-fig3-data1-v2.zip
-
Figure 3—source data 2
Raw data of PCR and immublotting and iron measurments quantification as well as flies eclosion from Figure 3.
- https://cdn.elifesciences.org/articles/97027/elife-97027-fig3-data2-v2.zip
Figure 3—figure supplement 1
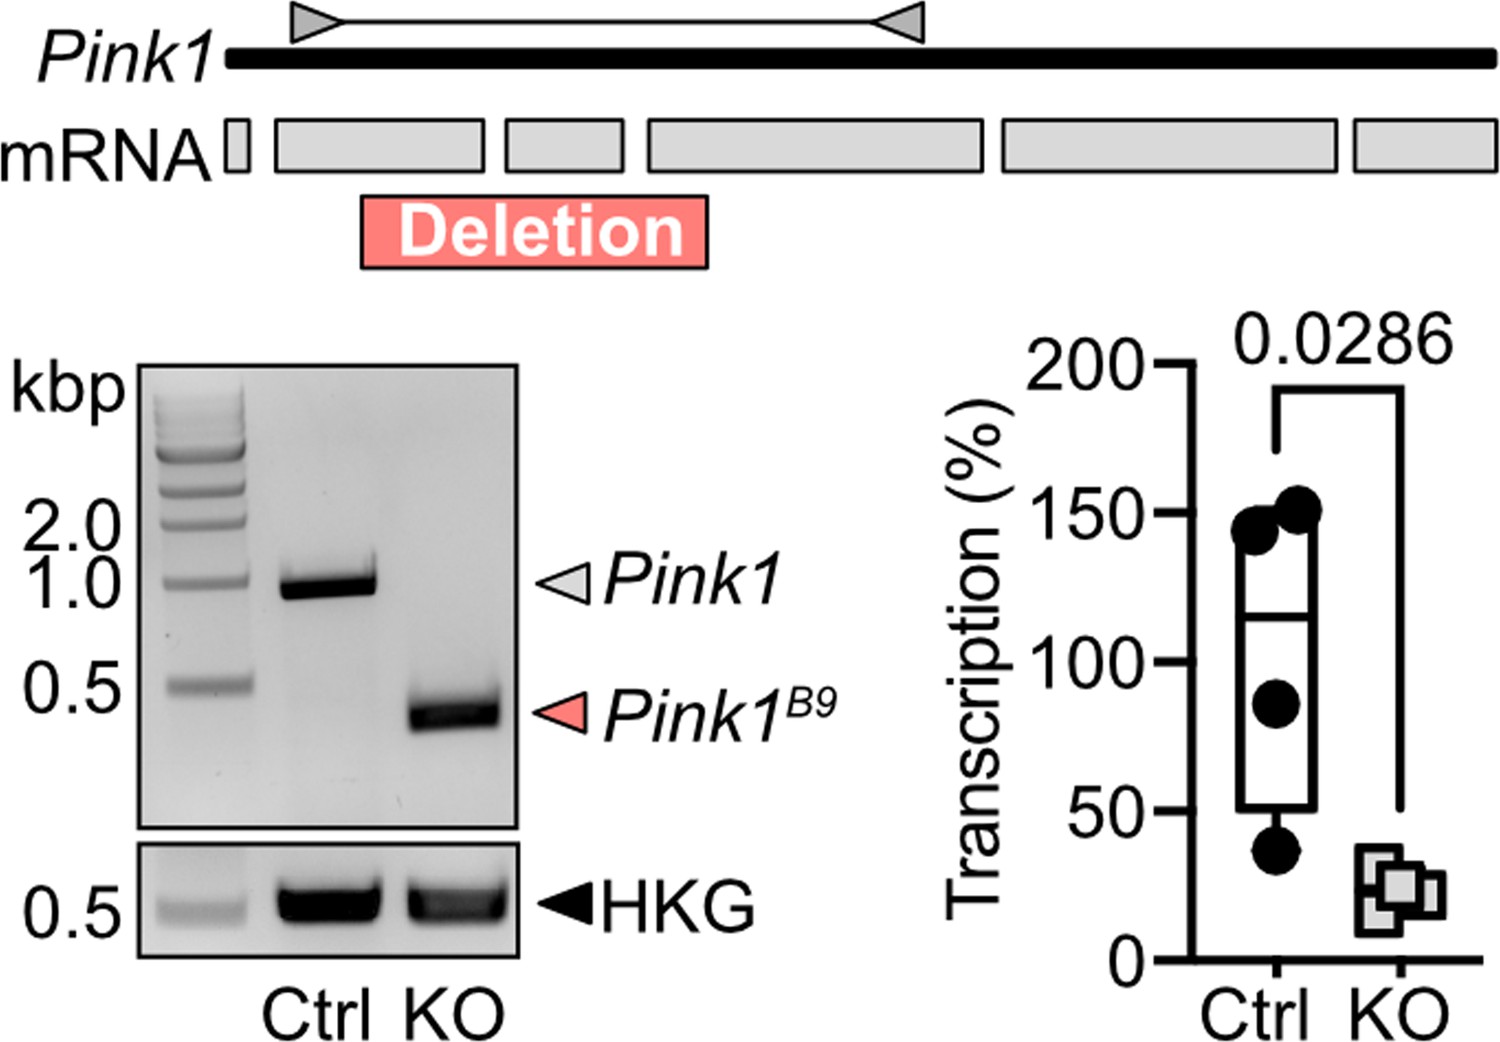
Validation of Pink1 knockout flies.
Pink1 genomic organization with mRNA/exons represented as light gray boxes. A 571 nt deletion extending from the 2nd to 4th exon is shown in orange. Validation PCR, using indicated primers (dark gray triangles), results in a 917 nt product for wildtype Pink1 and 246 nt for knockout Pink1. mRNA levels were assessed using quantitative PCR (qPCR) with primers at the 4th and 5th exon junction. HKG: housekeeping gene, Rp49; Ctrl: control flies, w1118; KO: Pink1 mutant flies (Pink1B9).
-
Figure 3—figure supplement 1—source data 1
Raw and labeled gels from a gel electrophoresis validating Pink1 knockout flies.
- https://cdn.elifesciences.org/articles/97027/elife-97027-fig3-figsupp1-data1-v2.zip
-
Figure 3—figure supplement 1—source data 2
Raw data of the quantification of the Pink1 knockout flies.
- https://cdn.elifesciences.org/articles/97027/elife-97027-fig3-figsupp1-data2-v2.zip
Figure 4
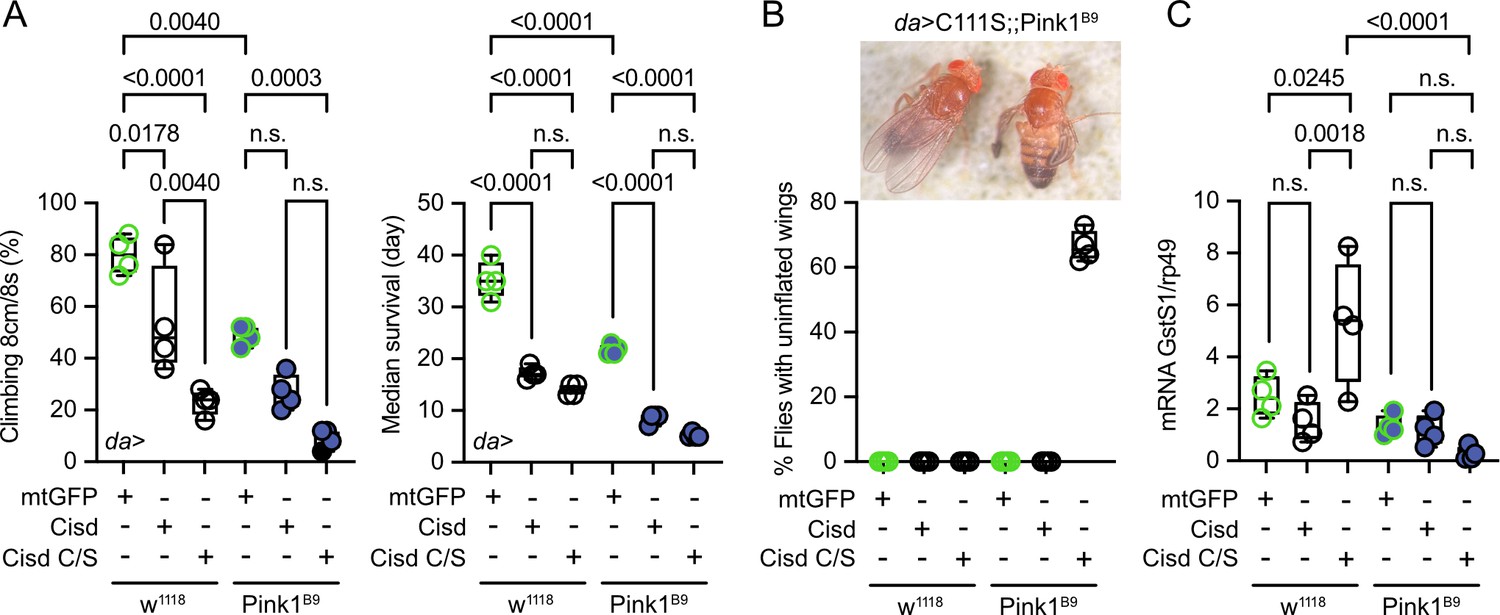
Overexpression of Cisd and apo-Cisd in Drosophila is detrimental.
(A) Climbing assay and median survival of flies overexpressing mitochondrially targeted GFP (mtGFP), Cisd, or Cisd C/S (all Fe/S coordinating cysteines mutated to serines) on standard food. Overexpression was achieved using the UAS-Gal4 system and the mild ubiquitous daughterless (Da) driver line on a w1118 or PinkB9 background. In the climbing assay, each dot represents the percentage of a group of 25 flies that successfully climbed more than 8 cm within 8 s. For the median survival, the number of dead flies was scored every 2 days and fresh food was supplied. Each dot represents the median lifespan of a group of 25 flies. (B) Representative image and quantification of the % of eclosed flies with non-inflated wings overexpressing Cisd C/S on a PinkB9 background 3 days after eclosion. (C) Quantitative PCR analysis of GstS1 mRNA levels in newly eclosed flies. Rp49 served as housekeeping control. Each dot represents the mean relative transcriptional level of a sample of five flies. The values were normalized to the mean value of control flies (da-Gal4>mtGFP). Statistical analysis was done using one-way ANOVA, p values are indicated.
-
Figure 4—source data 1
Raw data of the quantification of climbing and lifespan and wing phenotype as well as quantitative PCR anaylsis of flies overexpressing Cisd or CS mutant on wildtype or Pink1B9 background.
- https://cdn.elifesciences.org/articles/97027/elife-97027-fig4-data1-v2.zip
-
Figure 4—source data 2
Image of flies under the microscope to show the uninflated wing phenotype in the flies overexpressing the CS mutant on a Pink1B9 background.
- https://cdn.elifesciences.org/articles/97027/elife-97027-fig4-data2-v2.zip
Figure 5 with 4 supplements
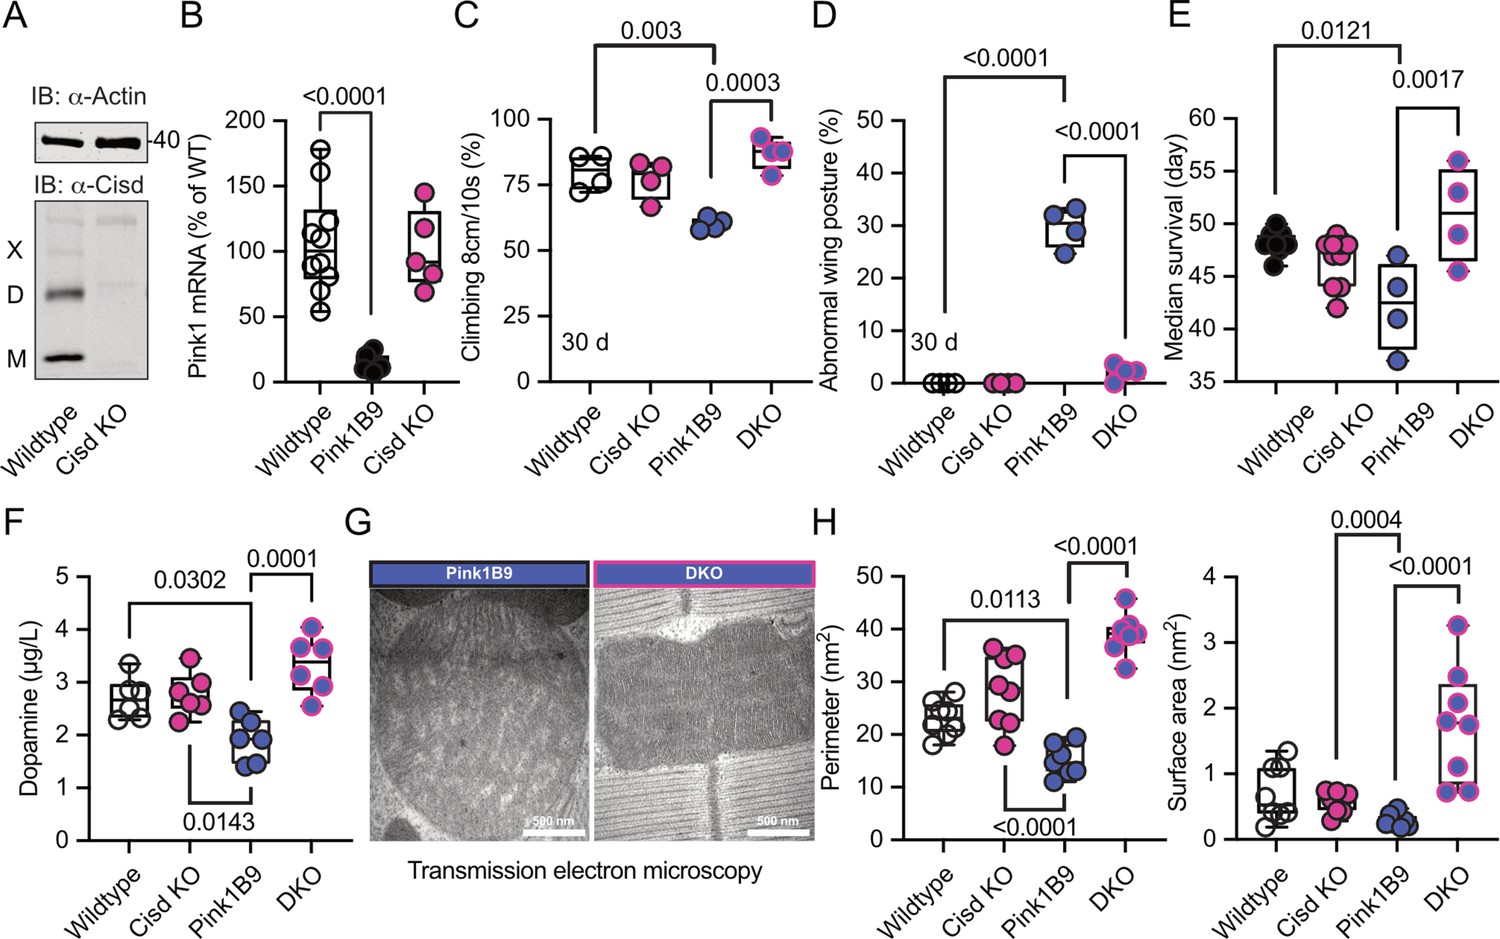
Cisd depletion rescues Pink1 mutant phenotypes.
(A) Immunoblot analysis of Cisd protein levels in wildtype and Cisd knockout (KO) flies, actin served as loading control. Note the presence of Cisd monomers (M), dimers (D), and multimers (X). (B) Quantitative PCR (qPCR) analysis of Pink1 mRNA levels. RpL32/Rp49 served as housekeeping control. Each dot represents the mean relative transcriptional level of a sample of five flies. The values were normalized to the mean value of wildtype flies. (C) Climbing ability. DKO, double-knockout flies. Each dot represents the percentage of a group of 25 flies that climbed more than 8 cm within 10 s. (D) Abnormal wing posture evaluation. Percentage of flies with an abnormal wing posture. Each dot represents an individual trial of a group of 25 flies. (E) Median survival on standard food. Fresh food was supplied and the number of dead flies was scored every 2 days. Each dot represents the median lifespan of a group of 25 flies. (F) Dopamine levels quantified by HPLC. Each dot represents a group of 4 flies sampled at different days. (G) Representative transmission electron microscopy of flight muscle morphology from Pink1 mutant and DKO. Scale bar as indicated. Exemplary pictures from wildtype and Cisd KO flies are shown in Figure 5—figure supplement 4. (H) Quantification of the indicated parameters. Each dot represents the average values from one image from 2 flies per genotype that were used for the analysis. Data are presented as box and whisker plots with the box extending from the 25th to the 75th percentile and the whiskers from the minimum to the maximum value depicting all individual data points. Statistical analysis was done using one-way ANOVA, p values are indicated.
-
Figure 5—source data 1
Raw and labeled blots of wildtype and Cisd knockout flies probed against CISD1 and Actin.
- https://cdn.elifesciences.org/articles/97027/elife-97027-fig5-data1-v2.zip
-
Figure 5—source data 2
Raw data of quantifications of climbing and wing posture and survival and dopamine levels and mitochondrial EM parameters of wildtype and CisdKO and Pink1B9 and doubleknockout flies.
- https://cdn.elifesciences.org/articles/97027/elife-97027-fig5-data2-v2.zip
Figure 5—figure supplement 1
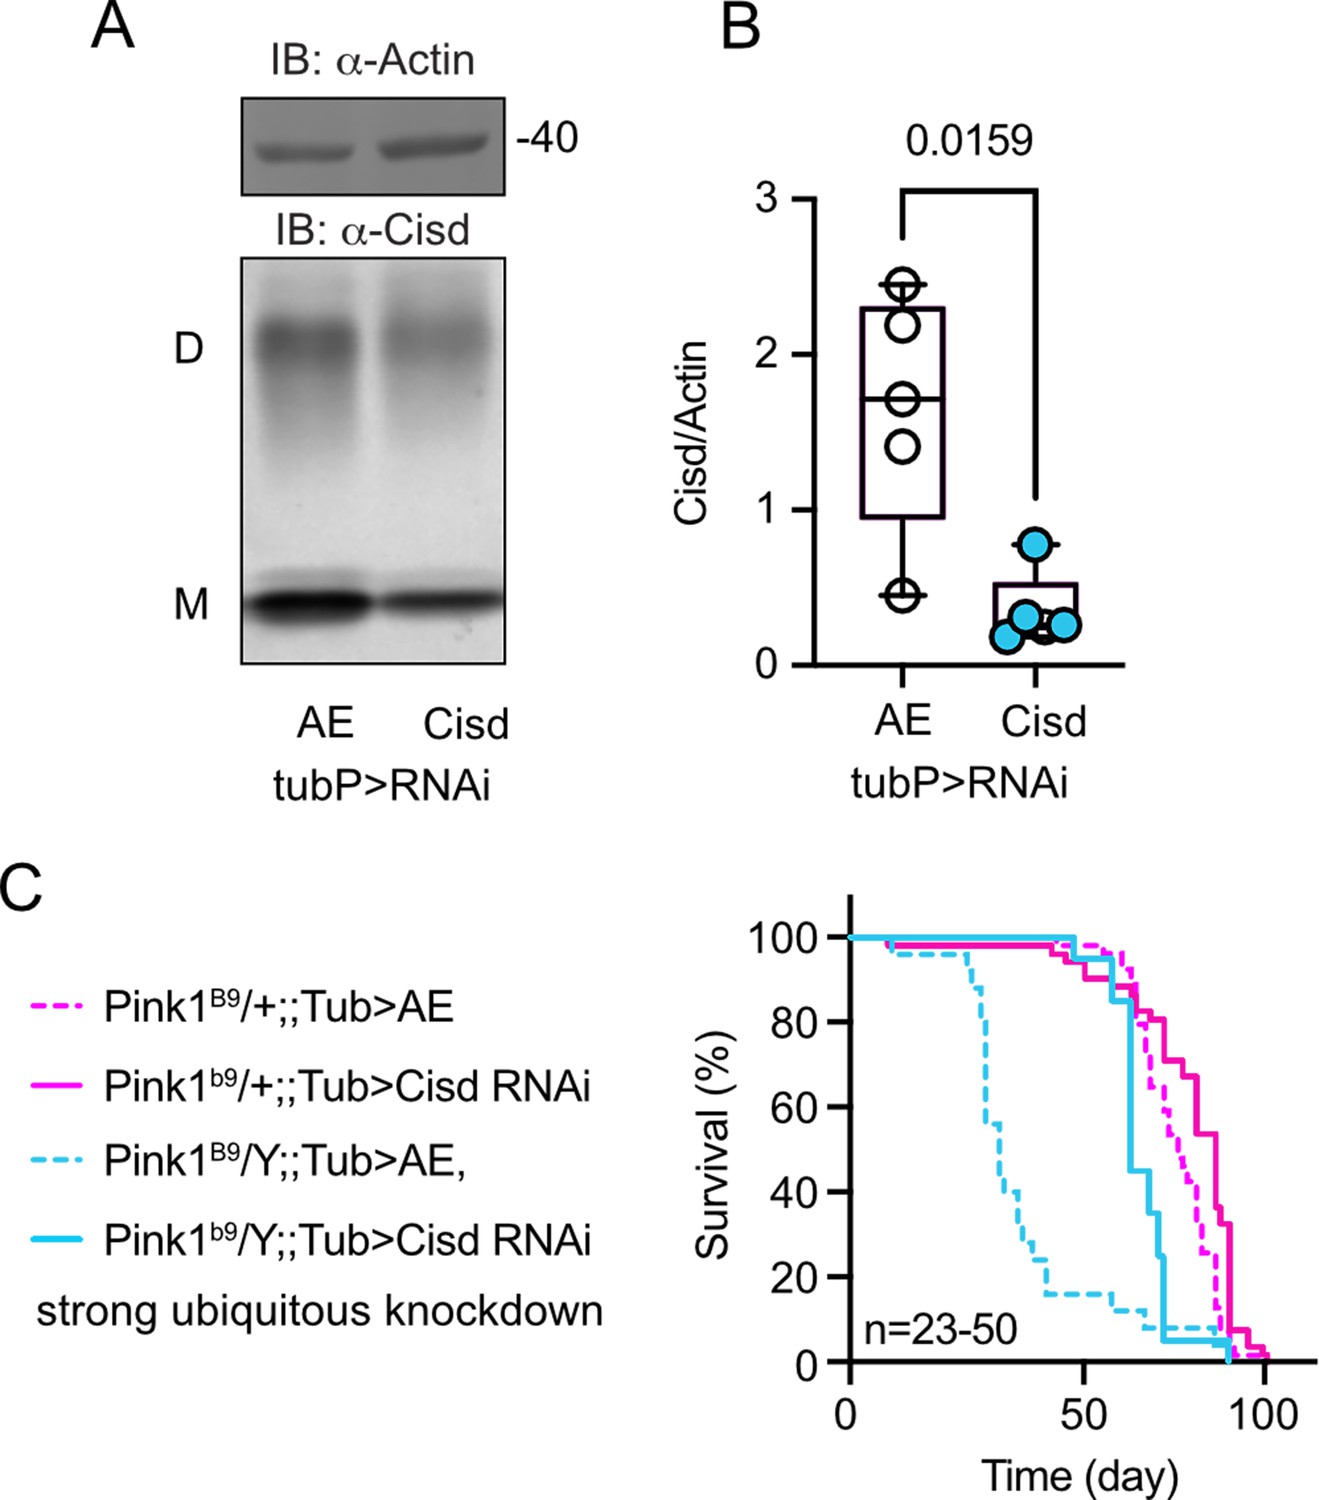
RNAi-mediated knockdown of Cisd protects against Pink1 loss of function.
(A) Immunoblot demonstrating Cisd knockdown, always-early RNAi served as control, and actin as loading control. Note the presence of Cisd monomers (M) and dimers (D) even in reducing gels. (B) Quantification of five independent immunoblots. Statistical analysis was done using the Student’s t test, p value is indicated. (C) Survival of hemizygous Pink1B9 on standard food. Fresh food was supplied and the number of dead flies was scored every 2 days, n is indicated.
-
Figure 5—figure supplement 1—source data 1
Raw and labeled blots showing Cisd knockdown in flies.
- https://cdn.elifesciences.org/articles/97027/elife-97027-fig5-figsupp1-data1-v2.zip
-
Figure 5—figure supplement 1—source data 2
Excel file containing raw data of the quantification of the blot showing Cisd KD as well as survival curve of Pink1B9 hemizygous flies.
- https://cdn.elifesciences.org/articles/97027/elife-97027-fig5-figsupp1-data2-v2.zip
Figure 5—figure supplement 2
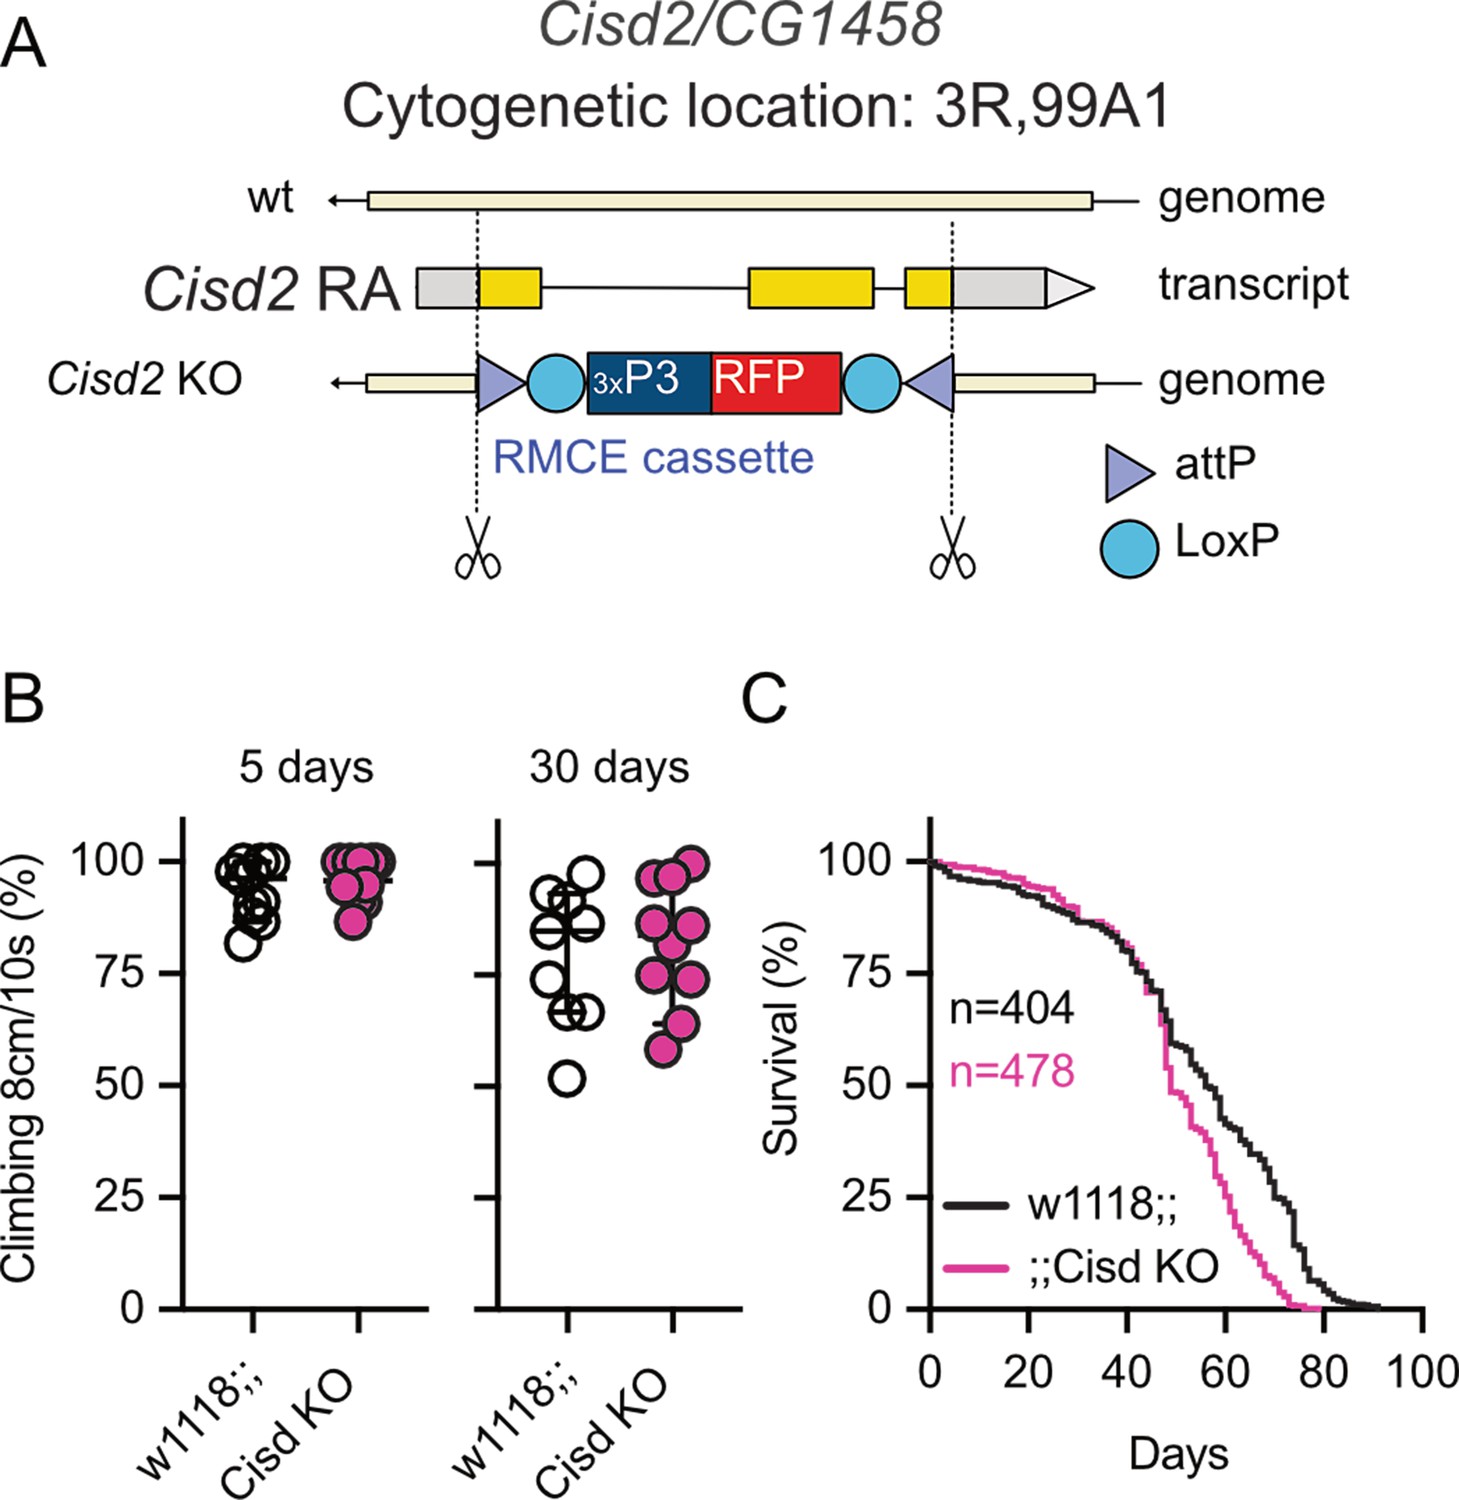
Phenotypes of Cisd knockout (KO) flies.
(A) Scheme depicting the construction of Cisd KO flies. (B) Climbing ability assessment. Each dot represents the percentage of a group of 25 flies that climbed more than 8 cm within 10 s. (C) Survival of wildtype (w1118) and Cisd KO flies on standard food. Fresh food was supplied and the number of dead flies was scored every 2 days, n is indicated.
-
Figure 5—figure supplement 2—source data 1
Raw data from climbing and survival of wildtype and CisdKO flies.
- https://cdn.elifesciences.org/articles/97027/elife-97027-fig5-figsupp2-data1-v2.zip
Figure 5—figure supplement 3
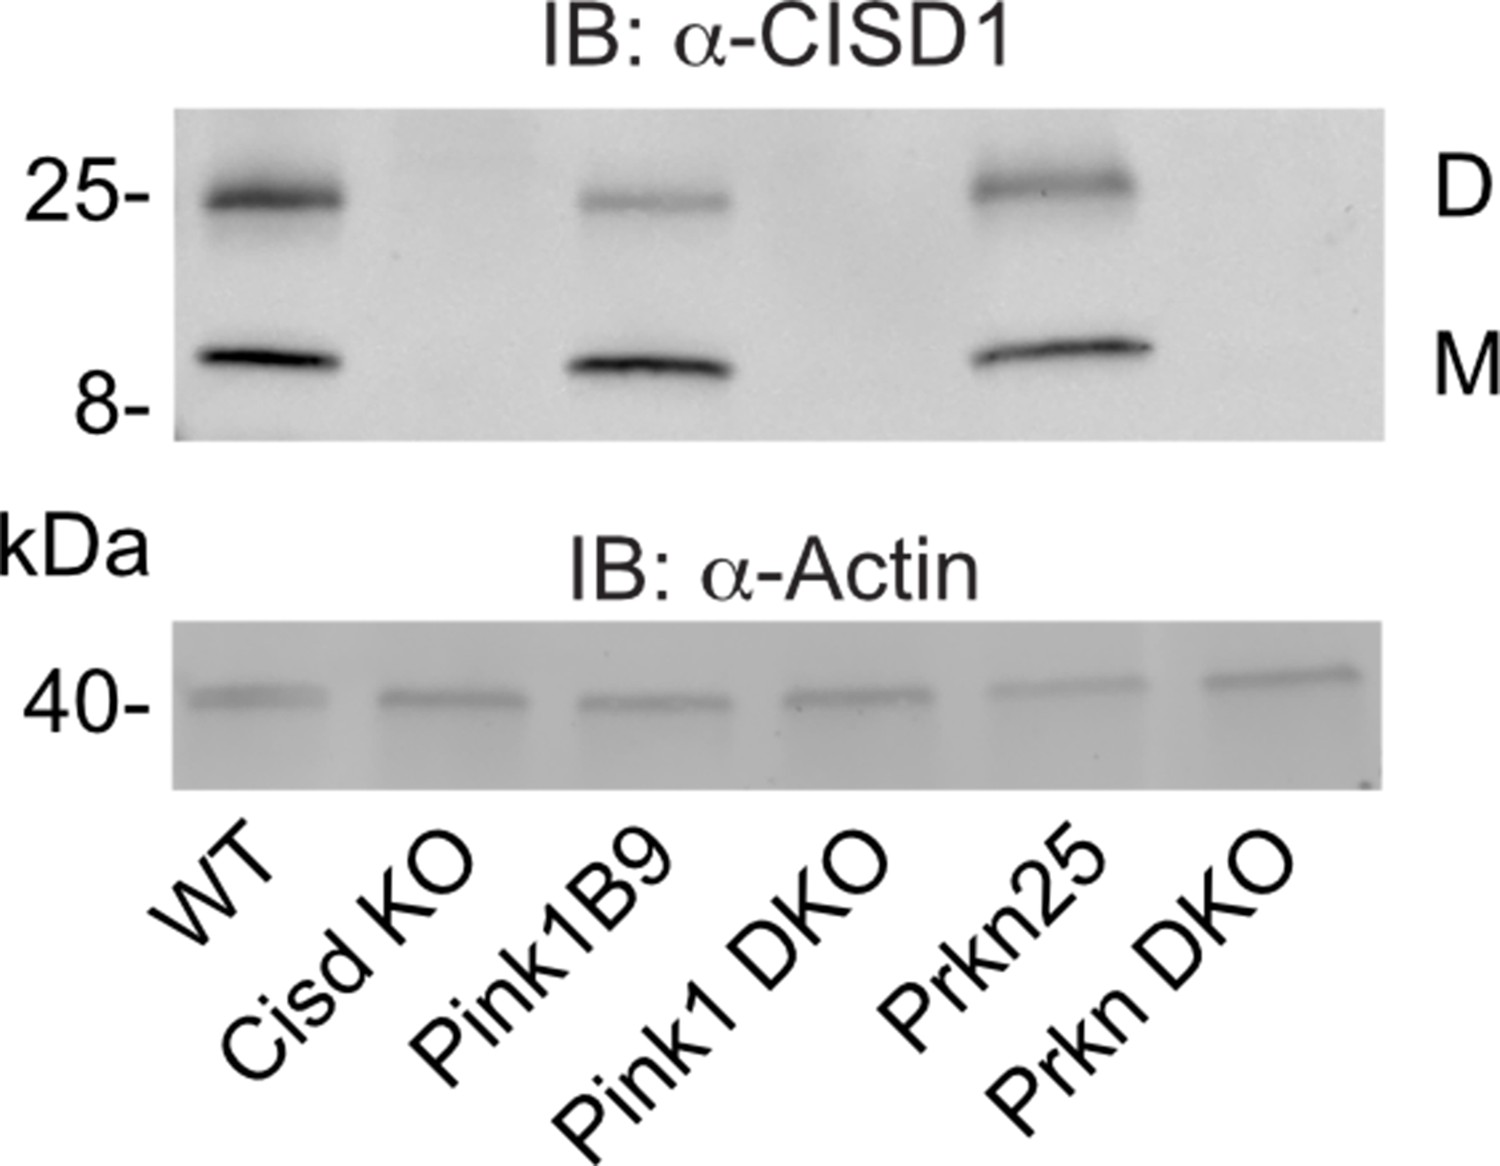
Double-knockout flies lack Cisd protein expression.
Immunoblot analysis of Cisd abundance in the indicated fly strains 3 days after eclosion. Actin served as loading control, size is indicated. (M) Cisd monomers and (D) dimers.
-
Figure 5—figure supplement 3—source data 1
Raw and labeled blots against CISD1 in fly strains wildtype and CisdKO and Pink and Park mutant flies and double knockout flies.
- https://cdn.elifesciences.org/articles/97027/elife-97027-fig5-figsupp3-data1-v2.zip
-
Figure 5—figure supplement 3—source data 2
Raw and labeled blots of indicated fly strains blotted against CISD1.
- https://cdn.elifesciences.org/articles/97027/elife-97027-fig5-figsupp3-data2-v2.zip
Figure 5—figure supplement 4
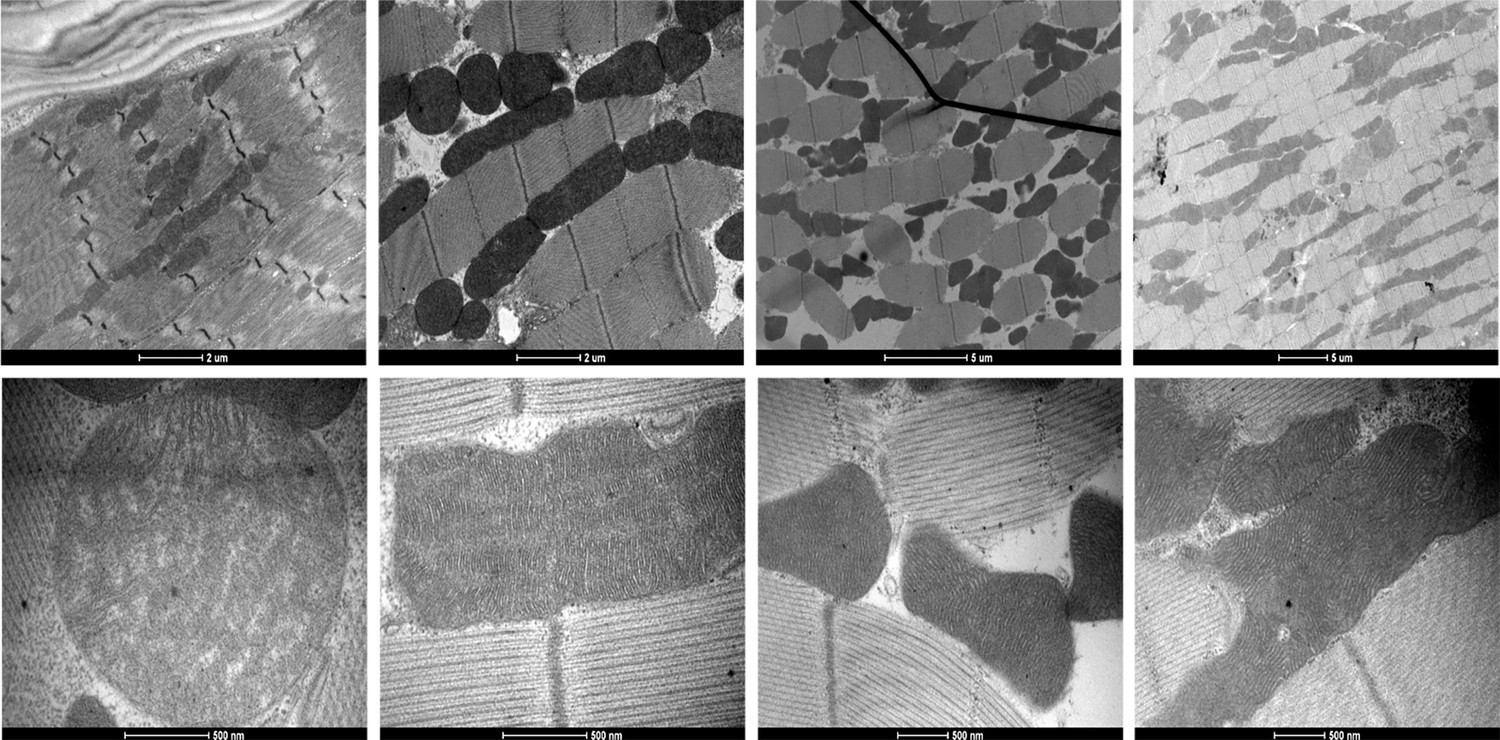
Exemplary transmission electron microscopy pictures.
Representative transmission electron microscopy of flight muscle morphology from the indicated fly strains. Scale bar as indicated.
-
Figure 5—figure supplement 4—source data 1
Labeled image of transmission electron microscopy from flies’ flight muscle of indicated strains.
- https://cdn.elifesciences.org/articles/97027/elife-97027-fig5-figsupp4-data1-v2.zip
-
Figure 5—figure supplement 4—source data 2
Raw transmission electron microscopy images with scale bar from flight muscle of indicated strains.
- https://cdn.elifesciences.org/articles/97027/elife-97027-fig5-figsupp4-data2-v2.zip
Figure 6
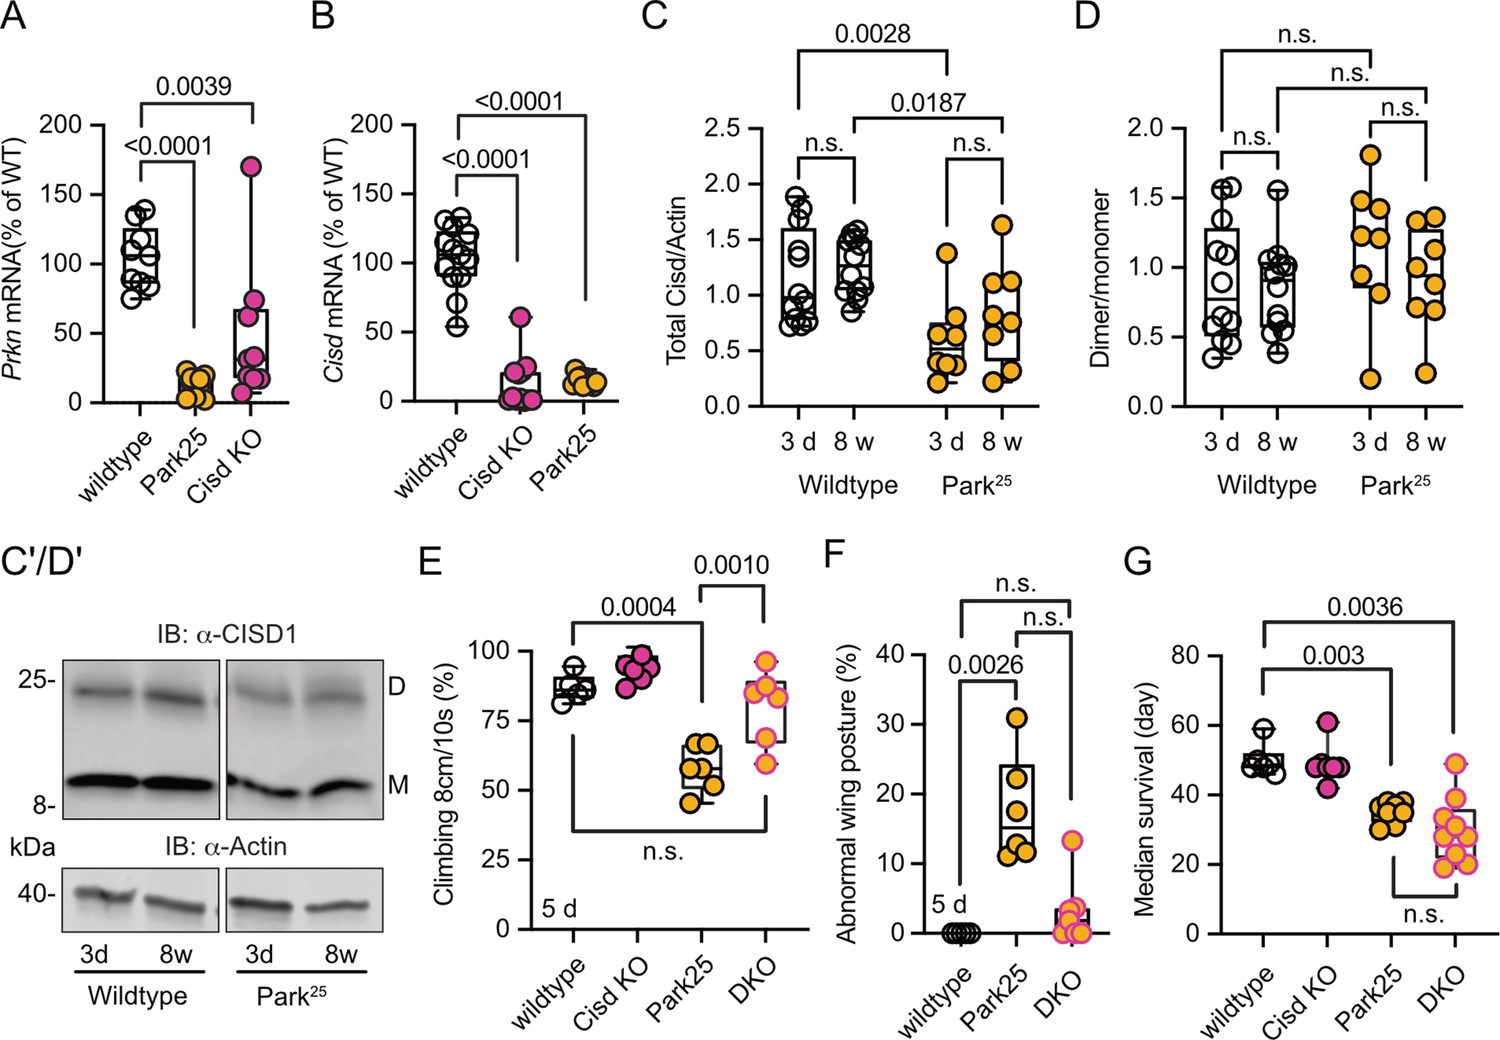
Cisd gene reduction partially protects Prkn mutant flies.
(A, B) Quantitative PCR analysis of Prkn and Cisd mRNA levels in Cisd knockout (KO) and Park25 flies. RpL32/Rp49 served as housekeeping control. Each dot represents the relative transcriptional level of a sample of five flies. The values were normalized to the mean value of wildtype flies. (C) Total Cisd (D+M) normalized to actin. Each dot represents the mean of two technical replicates from n=12 wildtype and n=8 Park25 independent samples of two male flies. The wildtype samples shown for comparison are the same as in Figure 5C/D. (D) Dimer/monomer ratio of the same samples. (C’, D’) Immunoblot analysis of Cisd abundance in the indicated fly strains at different ages, 3 days (d) and 8 weeks (w). Actin served as loading control, size is indicated. (M) Cisd monomers and (D) dimers. The gap indicates the removal of the Pink1B9 samples shown in Figure 5 that were run on the same blot. (E) Climbing ability assessment. Each dot represents the percentage of a group of 25 flies that successfully climbed more than 8 cm within 10 s. (F) Abnormal wing posture evaluation. Percentage of flies with an abnormal wing posture. Each dot represents an individual trial of a group of 25 flies. (G) Median survival on standard food. Fresh food was supplied and the number of dead flies was scored every 2 days. Each dot represents the median lifespan of a group of 25 flies. Data are presented as box and whisker plots with the box extending from the 25th to the 75th percentile and the whiskers from the minimum to the maximum value depicting all individual data points. Statistical analysis was done using one-way ANOVA in A/B/F/G and two-way ANOVA in C/D, p values are indicated.
-
Figure 6—source data 1
Raw and labeled blots of CISD1 expression in wildtype and Park25 flies.
- https://cdn.elifesciences.org/articles/97027/elife-97027-fig6-data1-v2.zip
-
Figure 6—source data 2
Raw data of the quantification of quantitative PCR anaylsis and immunoblot analysis and climbing assay and wing posture and survival of wildtype and Park25 and dKO flies.
- https://cdn.elifesciences.org/articles/97027/elife-97027-fig6-data2-v2.zip
Additional files
Download links
A two-part list of links to download the article, or parts of the article, in various formats.
Downloads (link to download the article as PDF)
Open citations (links to open the citations from this article in various online reference manager services)
Cite this article (links to download the citations from this article in formats compatible with various reference manager tools)
Iron-sulfur cluster loss in mitochondrial CISD1 mediates PINK1 loss-of-function phenotypes
eLife 13:e97027.
https://doi.org/10.7554/eLife.97027


