Synthesis and biological assessment of chalcone and pyrazoline derivatives as novel inhibitor for ELF3-MED23 interaction
- College of Pharmacy and Graduate School of Pharmaceutical Sciences, Ewha Womans University, Republic of Korea
- College of Pharmacy, CHA University, Republic of Korea
Figures
Figure 1
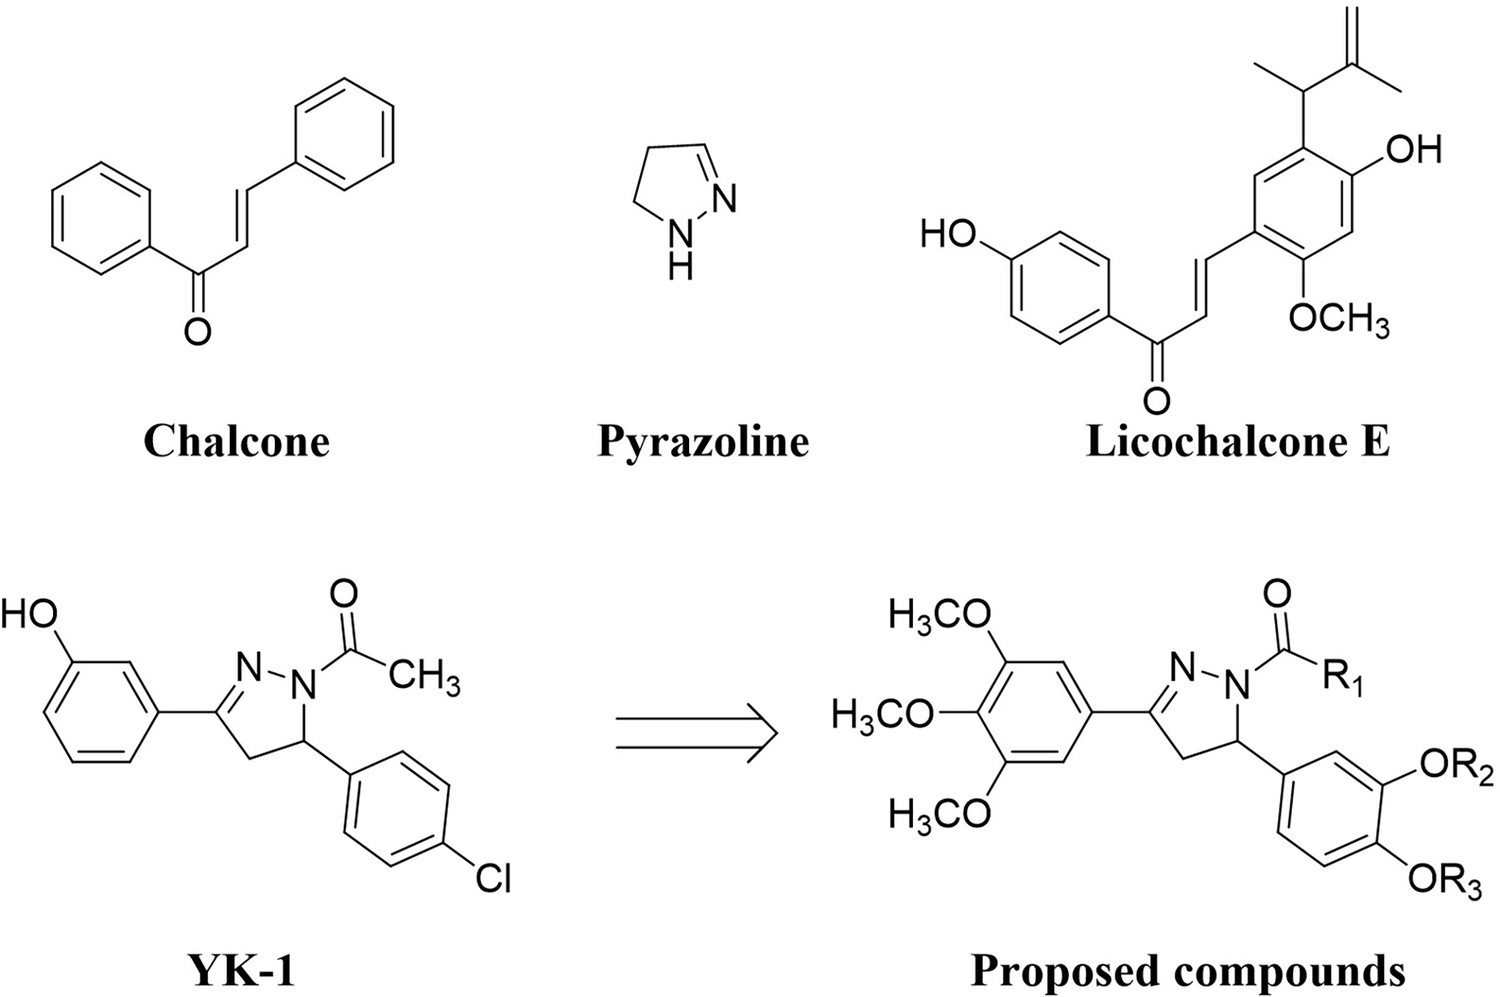
Structure of proposed compounds.
Figure 2
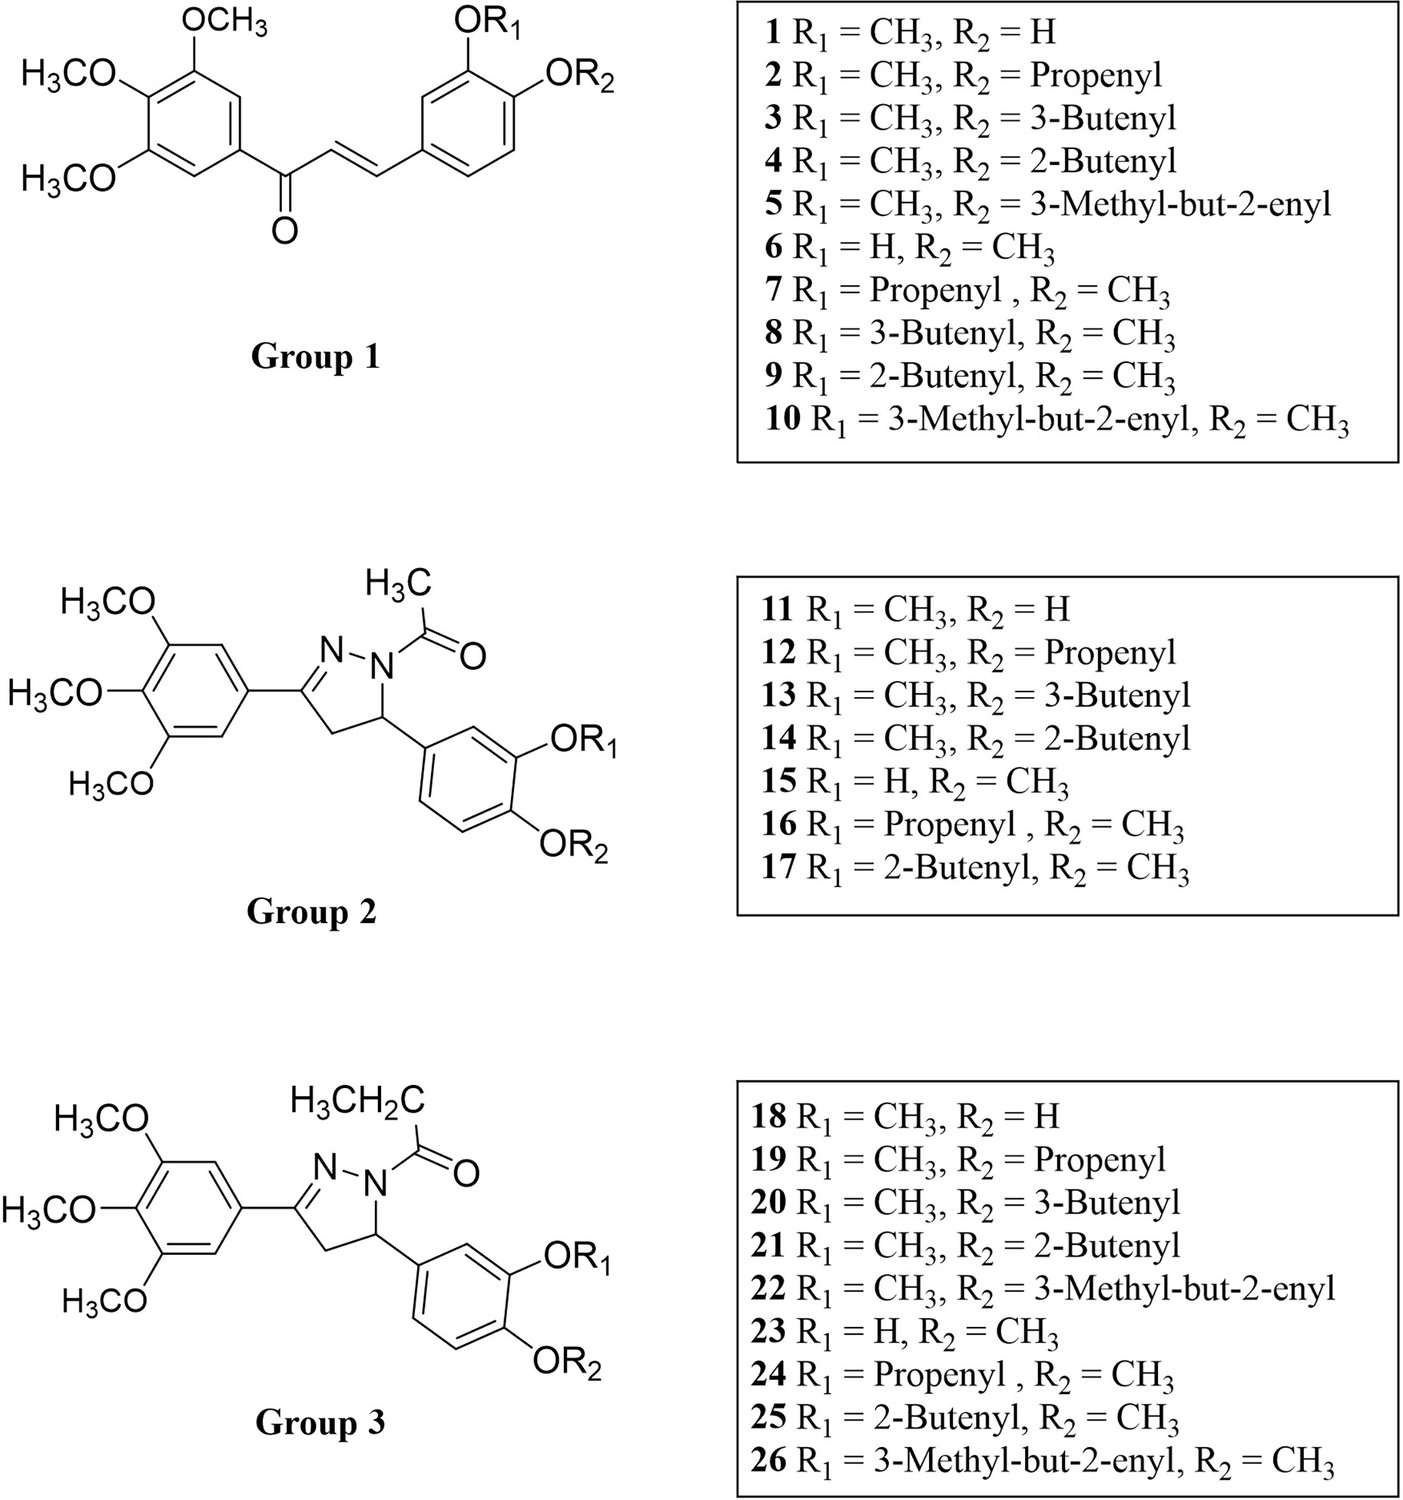
Structures of the prepared compounds.
Figure 3
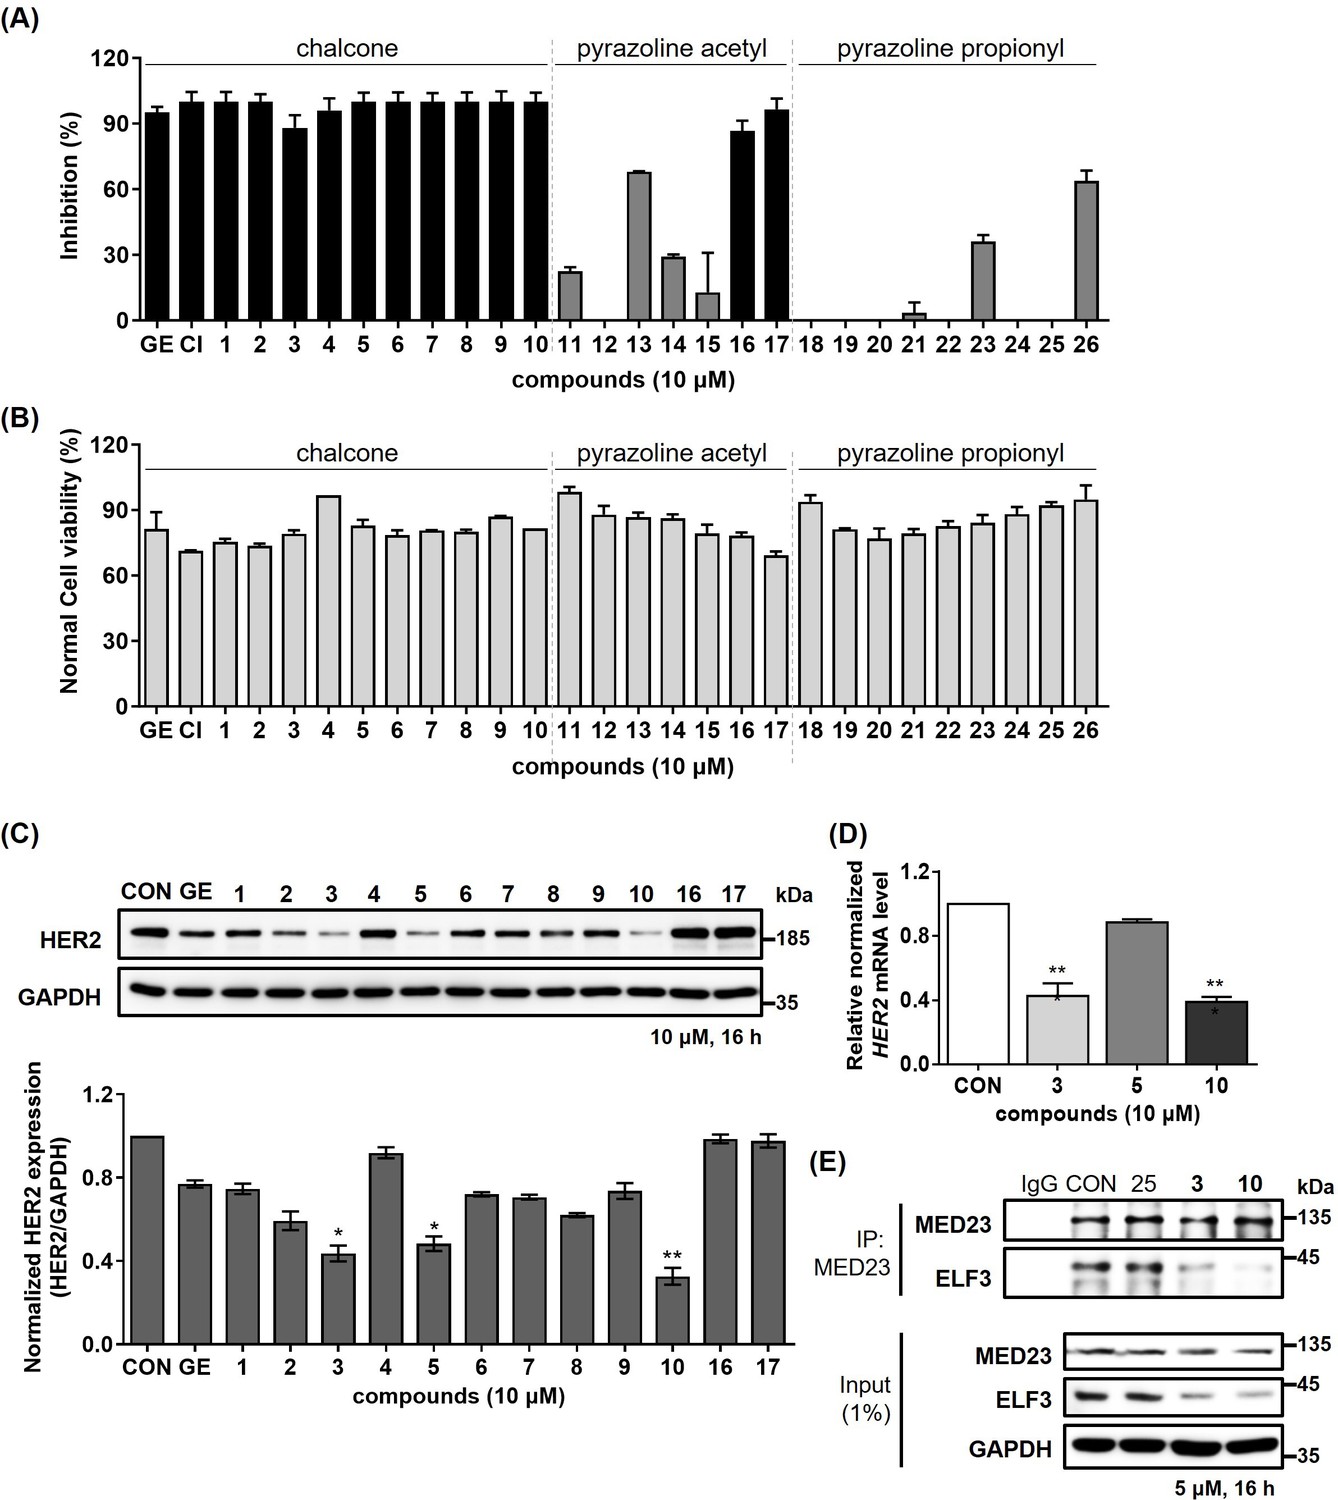
Identification of compound 10 as potent ELF3-MED23 PPI inhibitor.
(A) Synthesized compounds were screened to evaluate their inhibitory activity against ELF3–MED23 PPI. All compounds were used at 10 μM for 12 h (n=3, mean ± S.D.). (B) Cell viability was also measured in parallel using the same conditions as for the reporter gene assay in (A) (n=3, mean ± S.D.). (C) Changes in the HER2 levels were evaluated by treating NCI-N87 cells with the compounds that exhibited high SEAP inhibitory activity in (A). (D) Effect of compound 3, 5, and 10 on mRNA level of HER2 in NCI-N87 was assessed (16 hr treatment at 10 μM, n=3, mean ± S.D., ANOVA, ***p<0.001 vs. CON). (E) PPI inhibitory activities of compounds 3 and 10 were evaluated against endogenous ELF3 and MED23.Compound 25 was used as negative control.
-
Figure 3—source data 1
Raw unedited gels for Figure 3C.
- https://cdn.elifesciences.org/articles/97051/elife-97051-fig3-data1-v1.zip
-
Figure 3—source data 2
Uncropped and labelled gels for Figure 3C.
- https://cdn.elifesciences.org/articles/97051/elife-97051-fig3-data2-v1.zip
-
Figure 3—source data 3
Raw unedited gels for Figure 3E.
- https://cdn.elifesciences.org/articles/97051/elife-97051-fig3-data3-v1.zip
-
Figure 3—source data 4
Uncropped and labelled gels for Figure 3E.
- https://cdn.elifesciences.org/articles/97051/elife-97051-fig3-data4-v1.zip
Figure 4
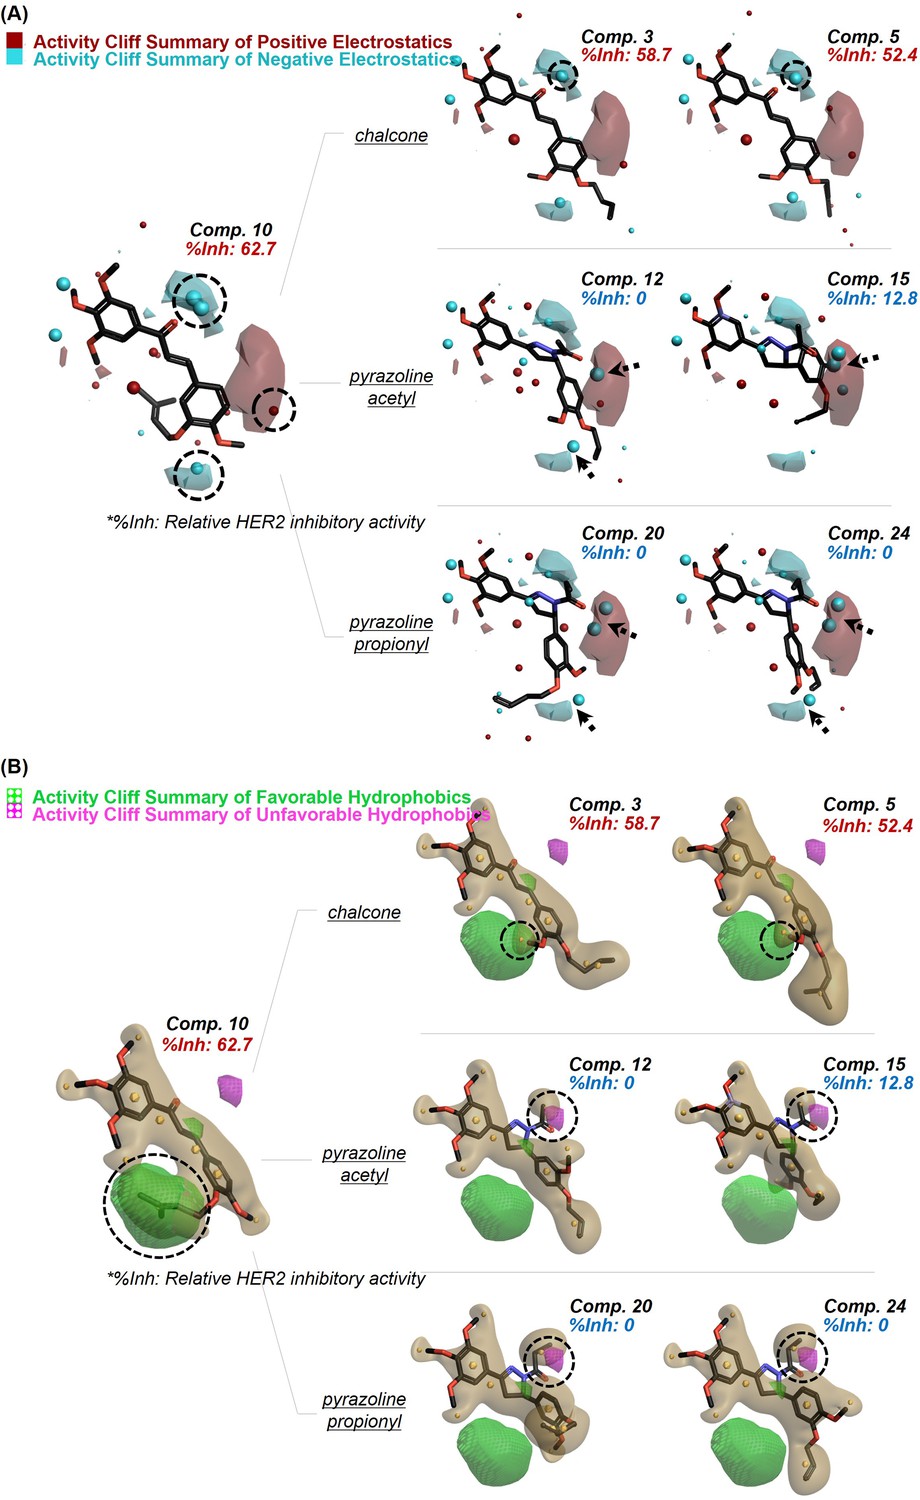
Qualitative SAR of prepared compounds.
Activity cliff summary for the prepared compound series were plotted regarding the contributions of electrostatic (A) and hydrophobic (B) fields. The field point pattern was depicted as spheres (Red, positive electrostatics; Cyan, negative electrostatics; Yellow brown, hydrophobic fields).
Figure 5
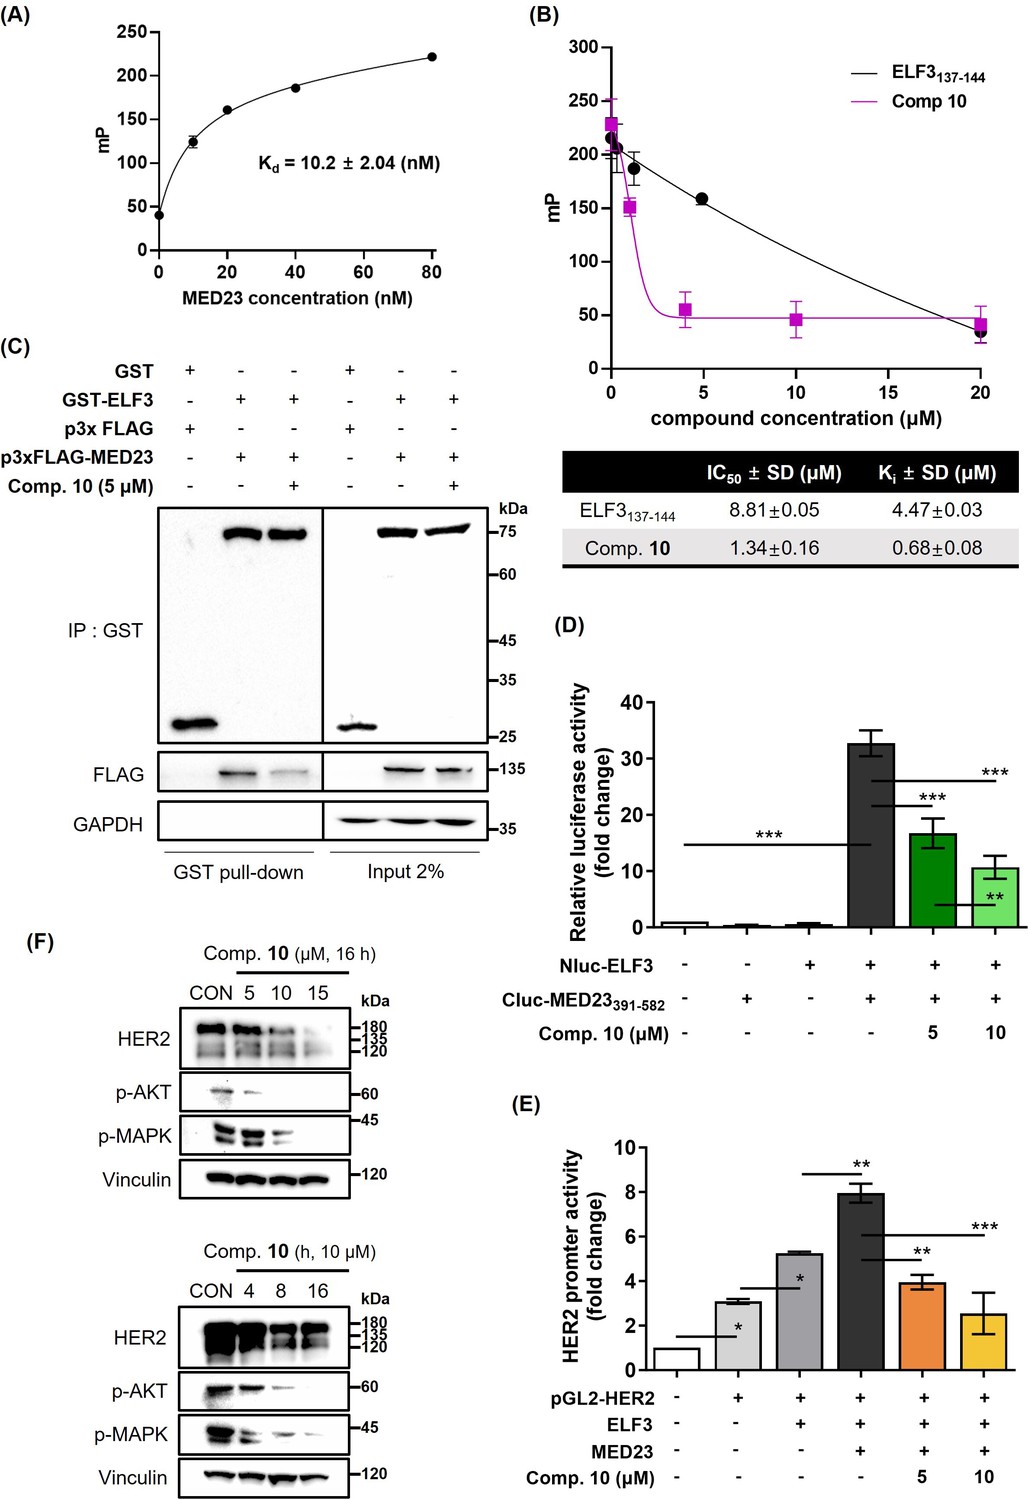
Compound 10 as a transcriptional regulator of HER2 by inhibiting ELF3-MED23 PPI.
(A) Titration curve of MED23391-582 protein FITC-labeled ELF3129-145 peptide. Binding of the MED23391-582 protein and ELF3-FITC peptide (17 a.a.) was validated via cell-free FP assay. Kd value was measured as 10.2±0.82 (nM) using the least squares non-linear fit method (n=3, mean ± S.D). (B) Effect of compound 10 on the FP (mP) induced by the binding of FITC-ELF3129-145 peptide to (His)6-MED23391-582 protein was evaluated in cell-free system. Unlabeled ELF3137-144 peptide was used as positive control. IC50 and Ki values were calculated from the FP assay results (n=3, mean ±S.D.). (C) Intracellular PPI inhibitory effect of compound 10 (5 μM, 12 h treatment) against ELF3-MED23 was evaluated through GST-pull down assay using GST-ELF3WT and 3xFLAG-MED23. (D) Impact of compound 10 on the relative luciferase activity generated by Nluc-ELF3WT and Cluc-MED23391-582 interaction was evaluated (20 hr treatment at indicated concentrations, n=3, mean ± S.D., ANOVA, ***p<0.001). (E) Effect of compound 10 on the overall ERBB2 promoter activity was assessed (20 hr treatment at indicated concentrations, n=3, mean ± S.D., ANOVA, *p<0.05, **p<0.01, and ***p<0.001). (F) Changes in the HER2 and its downstream signaling pathway were evaluated by treating compound 10 in dose- and time-dependent manner.
-
Figure 5—source data 1
Raw unedited gels for Figure 5C.
- https://cdn.elifesciences.org/articles/97051/elife-97051-fig5-data1-v1.zip
-
Figure 5—source data 2
Uncropped and labeled gels for Figure 5C.
- https://cdn.elifesciences.org/articles/97051/elife-97051-fig5-data2-v1.zip
-
Figure 5—source data 3
Raw unedited gels for Figure 5F.
- https://cdn.elifesciences.org/articles/97051/elife-97051-fig5-data3-v1.zip
-
Figure 5—source data 4
Uncropped and labelled gels for Figure 5F.
- https://cdn.elifesciences.org/articles/97051/elife-97051-fig5-data4-v1.zip
Figure 6
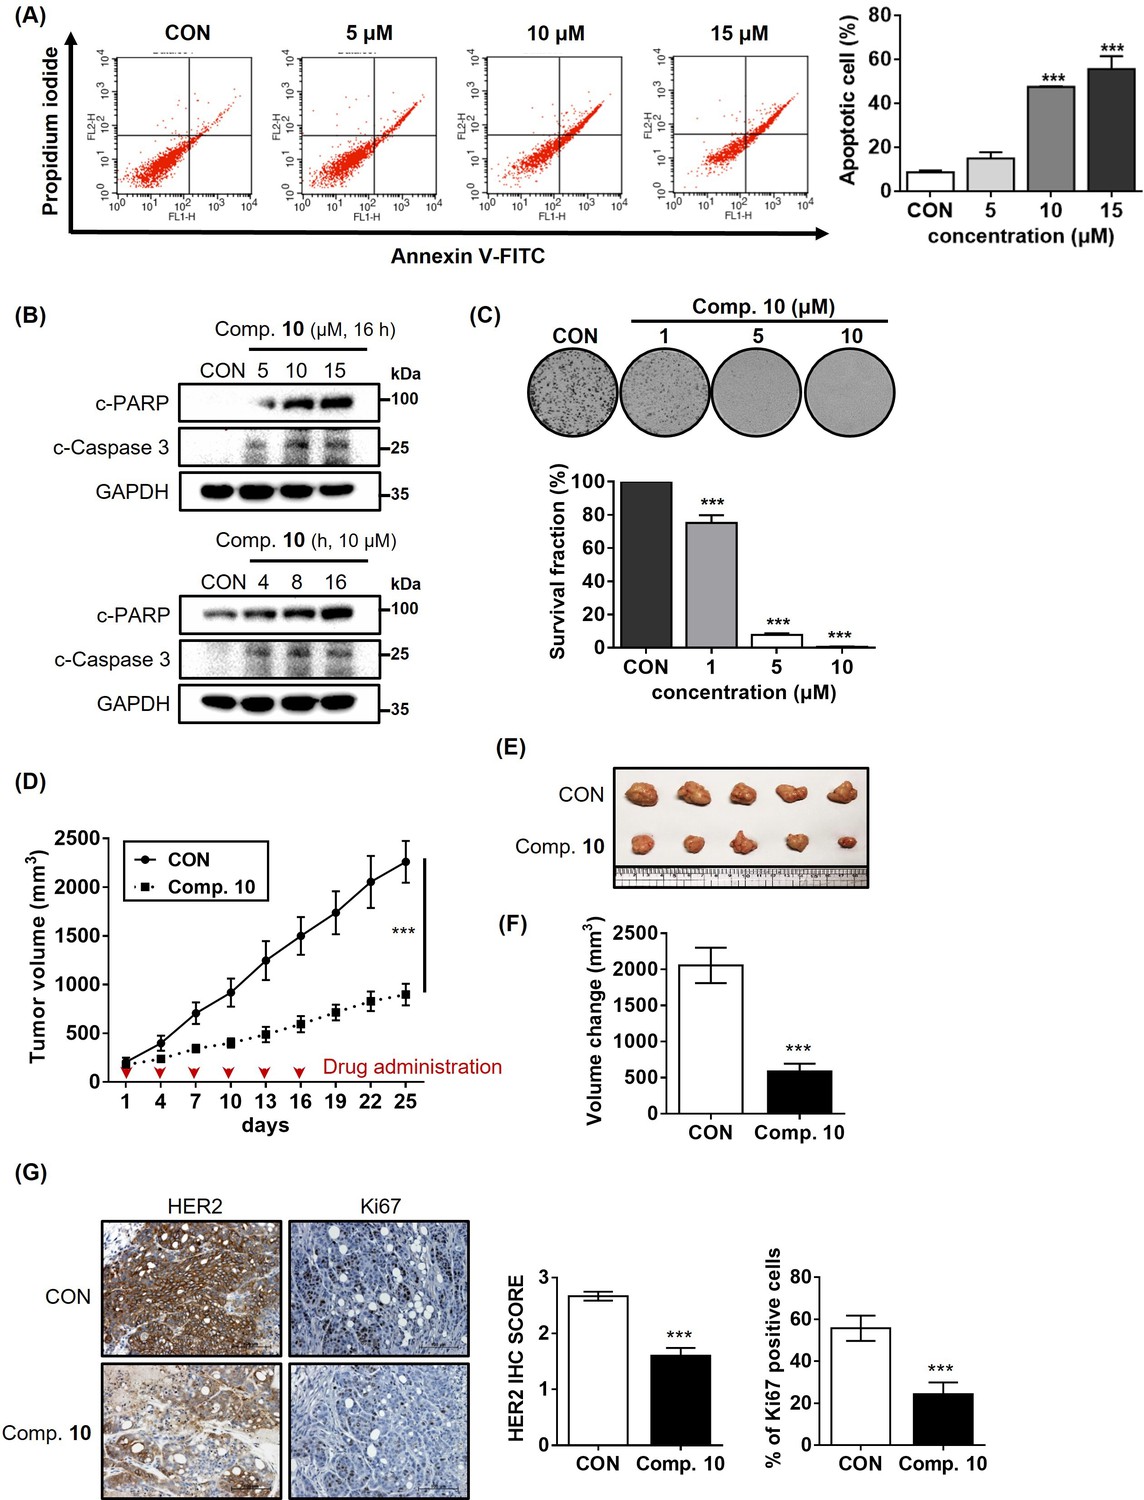
Compound 10 as a potent anticancer agent for HER2-positive gastric cancer cells.
(A) Apoptosis induced by compound 10 in parental NCI-N87 was assessed by treatment with the compound in a dose-dependent manner (24 hr treatment at indicated concentrations, n=3, mean ± S.D., ANOVA, ns = non-significant, ***p<0.001 vs. CON). (B) Changes in the pro-apoptotic markers were evaluated by treating compound 10 in dose- and time-dependent manner. (C) Anti-proliferative effect of compound 10 (10 μM) was evaluated against NCI-N87 cell line (10 days of treatment at indicated concentrations, n=3, mean ± S.D., ANOVA, ***p<0.001 vs. CON). (D) Tumor growth inhibitory effect of compound 10 was evaluated using NCI-N87 xenograft mouse model (n=5 per group; intravenous (IV) injection at 4 mg/kg every 3 days, indicated by red arrows). Tumor volumes were evaluated at the indicated time points by measuring the length and width of the tumor with calipers using the equation (length x width2)/2. Data was indicated as mean ± S.E.M. (E) Photograph of the tumors collected from the vehicle- and compound 10-treated mice. (F) Final volume changes were assessed for the tumors excised from each experimental group (n=5, mean ± S.E.M., Student’s t-test, ***p<0.001 vs. CON) (G) IHC analysis was conducted against HER2 and Ki67 in the tumors (scale bar = 100 μm). Score quantification was performed using Image J software (10 independent fields per sample were evaluated, mean ± S.D., Student’s t test, ***p<0.001 vs. CON).
-
Figure 6—source data 1
Raw unedited gels for Figure 6B.
- https://cdn.elifesciences.org/articles/97051/elife-97051-fig6-data1-v1.zip
-
Figure 6—source data 2
Uncropped and labelled gels for Figure 6B.
- https://cdn.elifesciences.org/articles/97051/elife-97051-fig6-data2-v1.zip
Figure 7
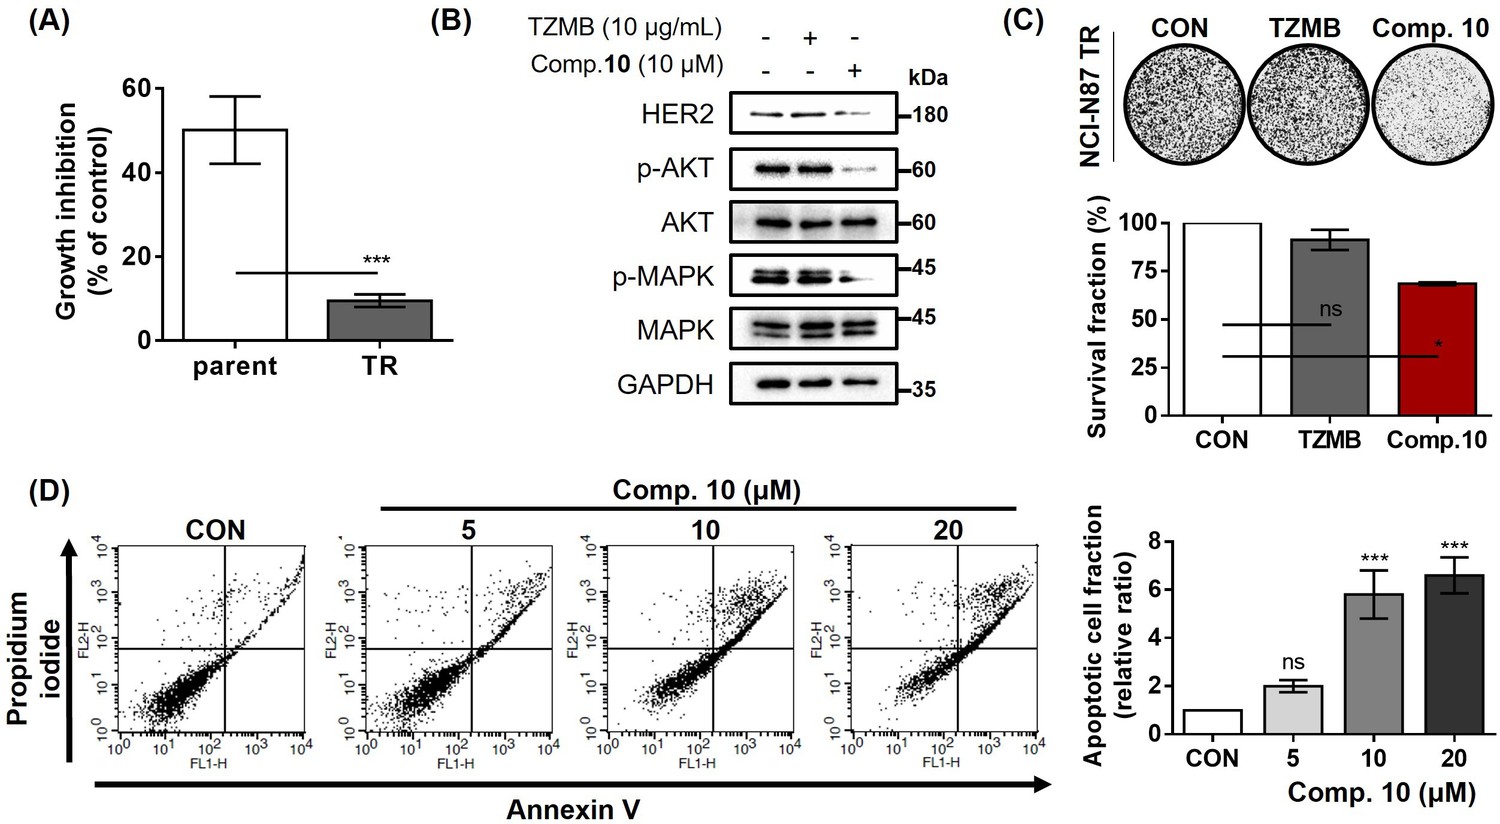
Compound 10 as a novel strategy to overcome trastuzumab resistance.
(A) Trastuzumab (10 μg/ml, 24 hr)-induced growth inhibitory effects were assessed against parental and TR NCI-N87 cell lines (n=3, mean ± S.D., Student’s t-test, ***p<0.001 vs. parent). (B) Trastuzumab- and compound 10-mediated changes of HER2 and its downstream signaling pathway were evaluated (16 hr treatment at indicated concentrations). (C) Anti-proliferative effects of trastuzumab (10 μg/mL) and compound 10 (10 μM) were evaluated against NCI-N87 TR cell line. Each compound was treated for 10 days (n=3, mean ± S.D., ANOVA, ns = non-significant, *p<0.05 vs. CON). (D) Apoptosis induced by compound 10 in NCI-N87 TR was assessed by FACS analysis with treatment of the compound in a dose-dependent manner (24 hr treatment at indicated concentrations, n=3, mean ± S.D., ANOVA, ns = non-significant, ***p<0.001 vs. CON).
-
Figure 7—source data 1
Raw unedited gels for Figure 7B.
- https://cdn.elifesciences.org/articles/97051/elife-97051-fig7-data1-v1.zip
-
Figure 7—source data 2
Uncropped and labelled gels for Figure 7B.
- https://cdn.elifesciences.org/articles/97051/elife-97051-fig7-data2-v1.zip
Scheme 1
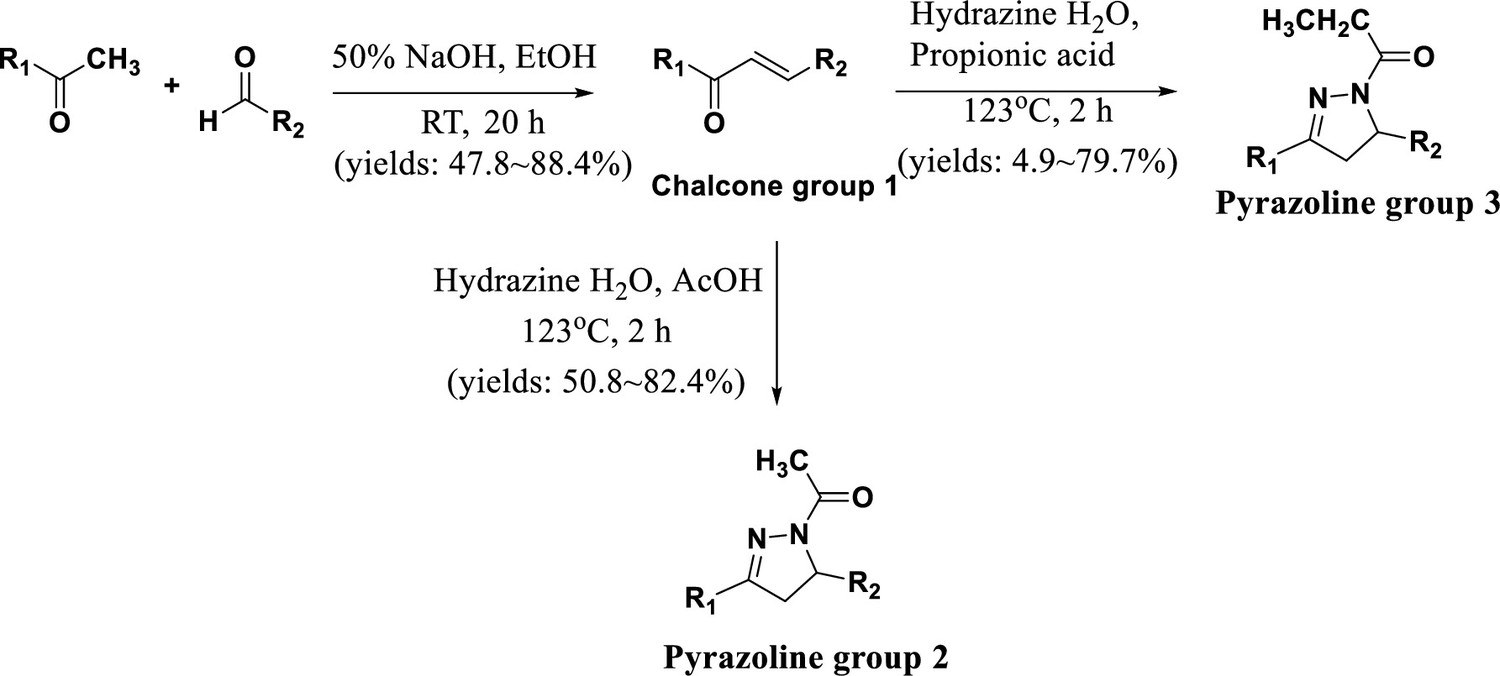
General synthesis methods for the target compounds.
Author response image 1

HER2 downregulatory effect of compound 10 in HER2-positive breast cancer cell lines, AU565 and BT474.
Author response image 2

Docking analysis of compound 10.
Author response image 3
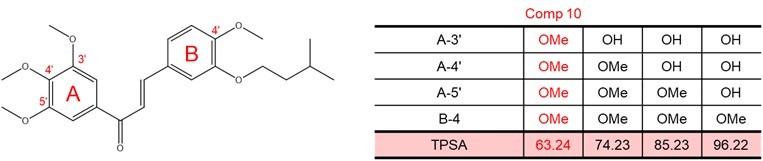
Impact of methoxy group introduction on TPSA (total polar surface area) of each molecule.
TPSA of each molecule containing chalcone structure were calculated using the Molinspiration webserver.
Author response image 4

HER2 downregulatory effect of compound 10 in HER2-positive gastric cancer cell line, SNU216.
(A) Expression levels of HER2 and ELF3 in various gastric cancer cell lines. (B) HER2 downregulation in the SNU216 cell line following treatment with compound 10.
Tables
Table 1
Summary of the antibody lists used in this study.
| Antibody | Vendor | Catalogue number | Application | Dilution |
|---|---|---|---|---|
| AKT | Cell signaling | #9272 | WB | 1:2000 |
| c-PARP | Cell signaling | #9541 | WB | 1:2000 |
| ELF3 | Thermo Fisher | PA5-21293 | WB | 1:2000 |
| FLAG | MBL | M185-3L | WB | 1:1000 |
| GAPDH | MBL | M171-3 | WB | 1:10000 |
| GST | MBL | M209-3 | WB | 1:1000 |
| HER2 | Thermo Fisher | MA5-13105 | WB | 1:1000 |
| IHC | 1:100 | |||
| Ki67 | Dako | M7240 | IHC | 1:200 |
| MAPK | Cell signaling | #9102 | WB | 1:2000 |
| MED23 | Novus | NB200-338 | WB | 1:2000 |
| p-AKT (S473) | Santa cruz | sc-7985 | WB | 1:2000 |
| p-MAPK (T202/Y204) | Cell signaling | #9101 | WB | 1:2000 |
| Cleaved caspase-3 | Cell signaling | #9661 | WB | 1:1000 |
Table 2
Information of utilized qRT-PCR primers.
| Gene | Sequence | |
|---|---|---|
| Actin | Forward | 5' AGCCATGTACGTAGCCATCC 3' |
| Reverse | 5' CTCTCAGCTGTGGTGGTGAA 3' | |
| ERBB2 | Forward | 5' GGTGGTCTTTGGGATCCTCA 3' |
| Reverse | 5' ACCTTCACCTTCCTCAGCTC 3' | |
| ELF3 | Forward | 5' GTGATGCTGAGCTTGGGATG 3' |
| Reverse | 5' TTAGGTTAGAAGCGCCCACA 3' | |
| GAPDH | Forward | 5' GAGTCAACGGATTTGGTCGT 3' |
| Reverse | 5' GACAAGCTTCCCGTTCTCAG 3' |
Additional files
-
MDAR checklist
- https://cdn.elifesciences.org/articles/97051/elife-97051-mdarchecklist1-v1.docx
-
Supplementary file 1
1H NMR and 13C NMR Spectra of compounds 1–26.
- https://cdn.elifesciences.org/articles/97051/elife-97051-supp1-v1.xlsx
Download links
A two-part list of links to download the article, or parts of the article, in various formats.
Downloads (link to download the article as PDF)
Open citations (links to open the citations from this article in various online reference manager services)
Cite this article (links to download the citations from this article in formats compatible with various reference manager tools)
Synthesis and biological assessment of chalcone and pyrazoline derivatives as novel inhibitor for ELF3-MED23 interaction
eLife 13:RP97051.
https://doi.org/10.7554/eLife.97051.3


