Differential functions of the dorsal and intermediate regions of the hippocampus for optimal goal-directed navigation in VR space
- Department of Brain and Cognitive Sciences, Seoul National University, Republic of Korea
- Department of Psychiatry and Behavioral Sciences, University of Washington, United States
Figures
Figure 1
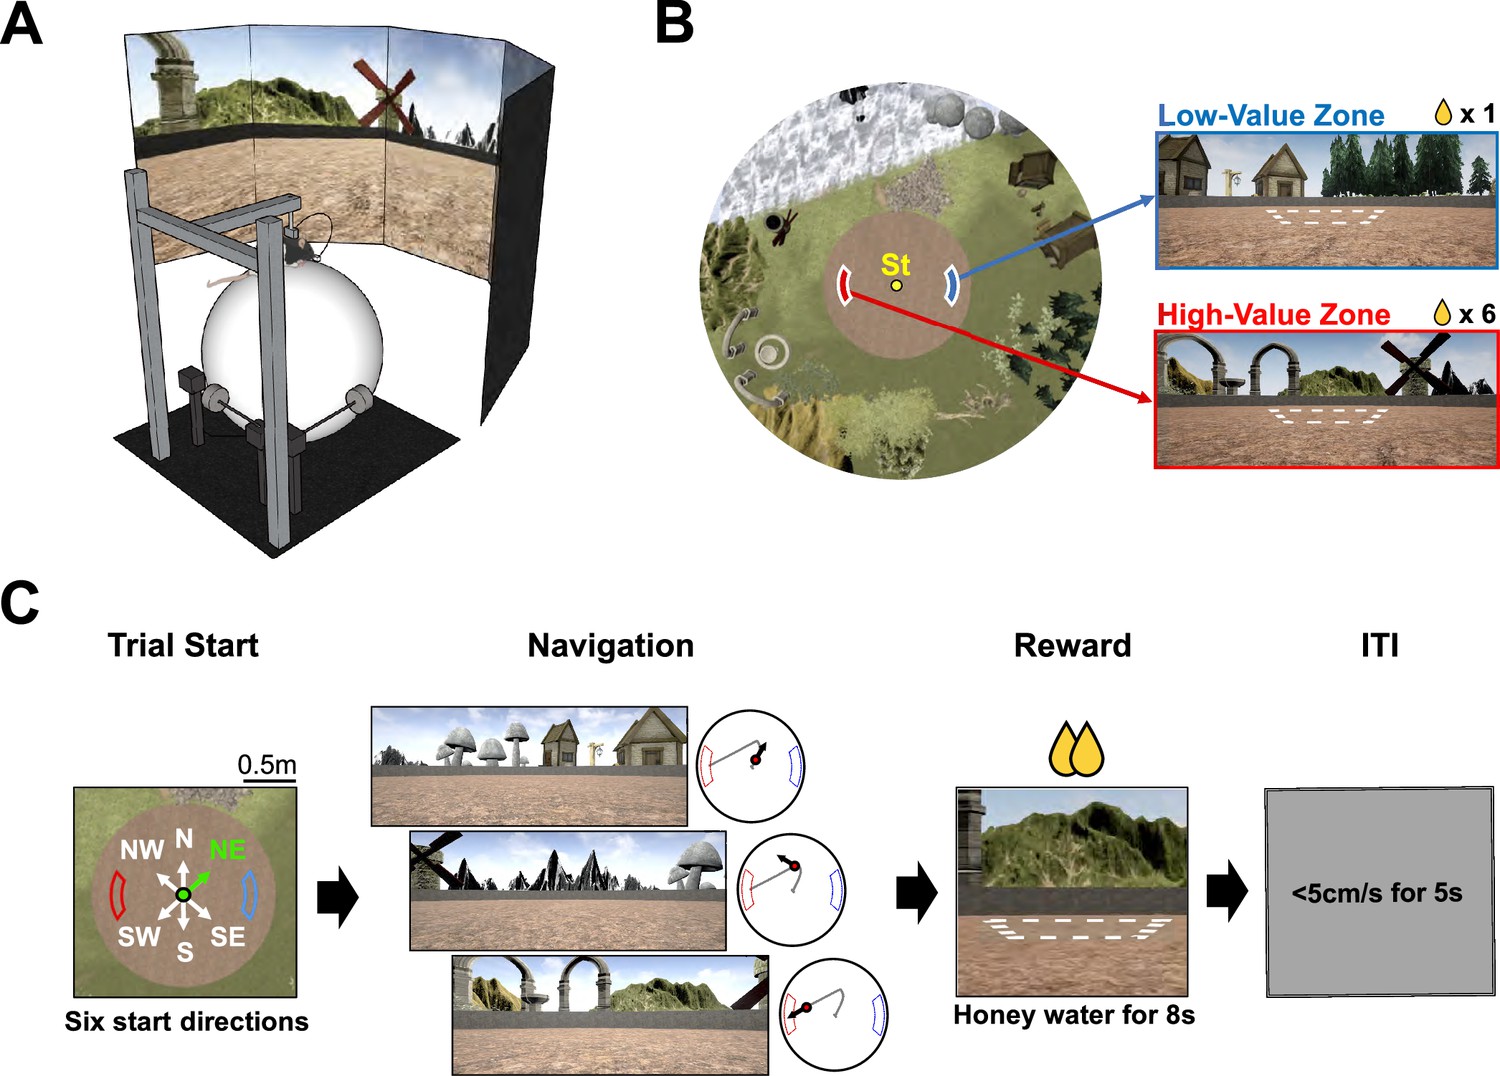
Place-preference task in a 2D virtual reality (VR) environment.
(A) 2D VR setup. (B) Bird’s-eye view of the virtual environment. Various landmarks surrounded a circular arena, and a fixed start location (‘St’) was at the center. Reward zones are illustrated with white dashed lines for visualization purposes. (C) Place-preference task paradigm. A trial started with one of six pseudorandomly chosen start directions (‘Trial Start’). In this example, the rat started the trial facing the northeast (NE) direction, highlighted in green. Subsequent navigation is illustrated here with the associated scene (‘Navigation’). A dot on the gray trajectory indicates the rat’s current location, and the black arrow describes the head direction. When the rat arrived at a reward zone, honey water was delivered within 8 s, with the visual scene frozen (‘Reward’). Finally, a gray screen appeared, denoting an inter-trial interval; if the rat remained still (<5 cm/s) for 5 s, the subsequent trial began (‘ITI’).
Figure 2
Common body-turning behavior of rats after learning.
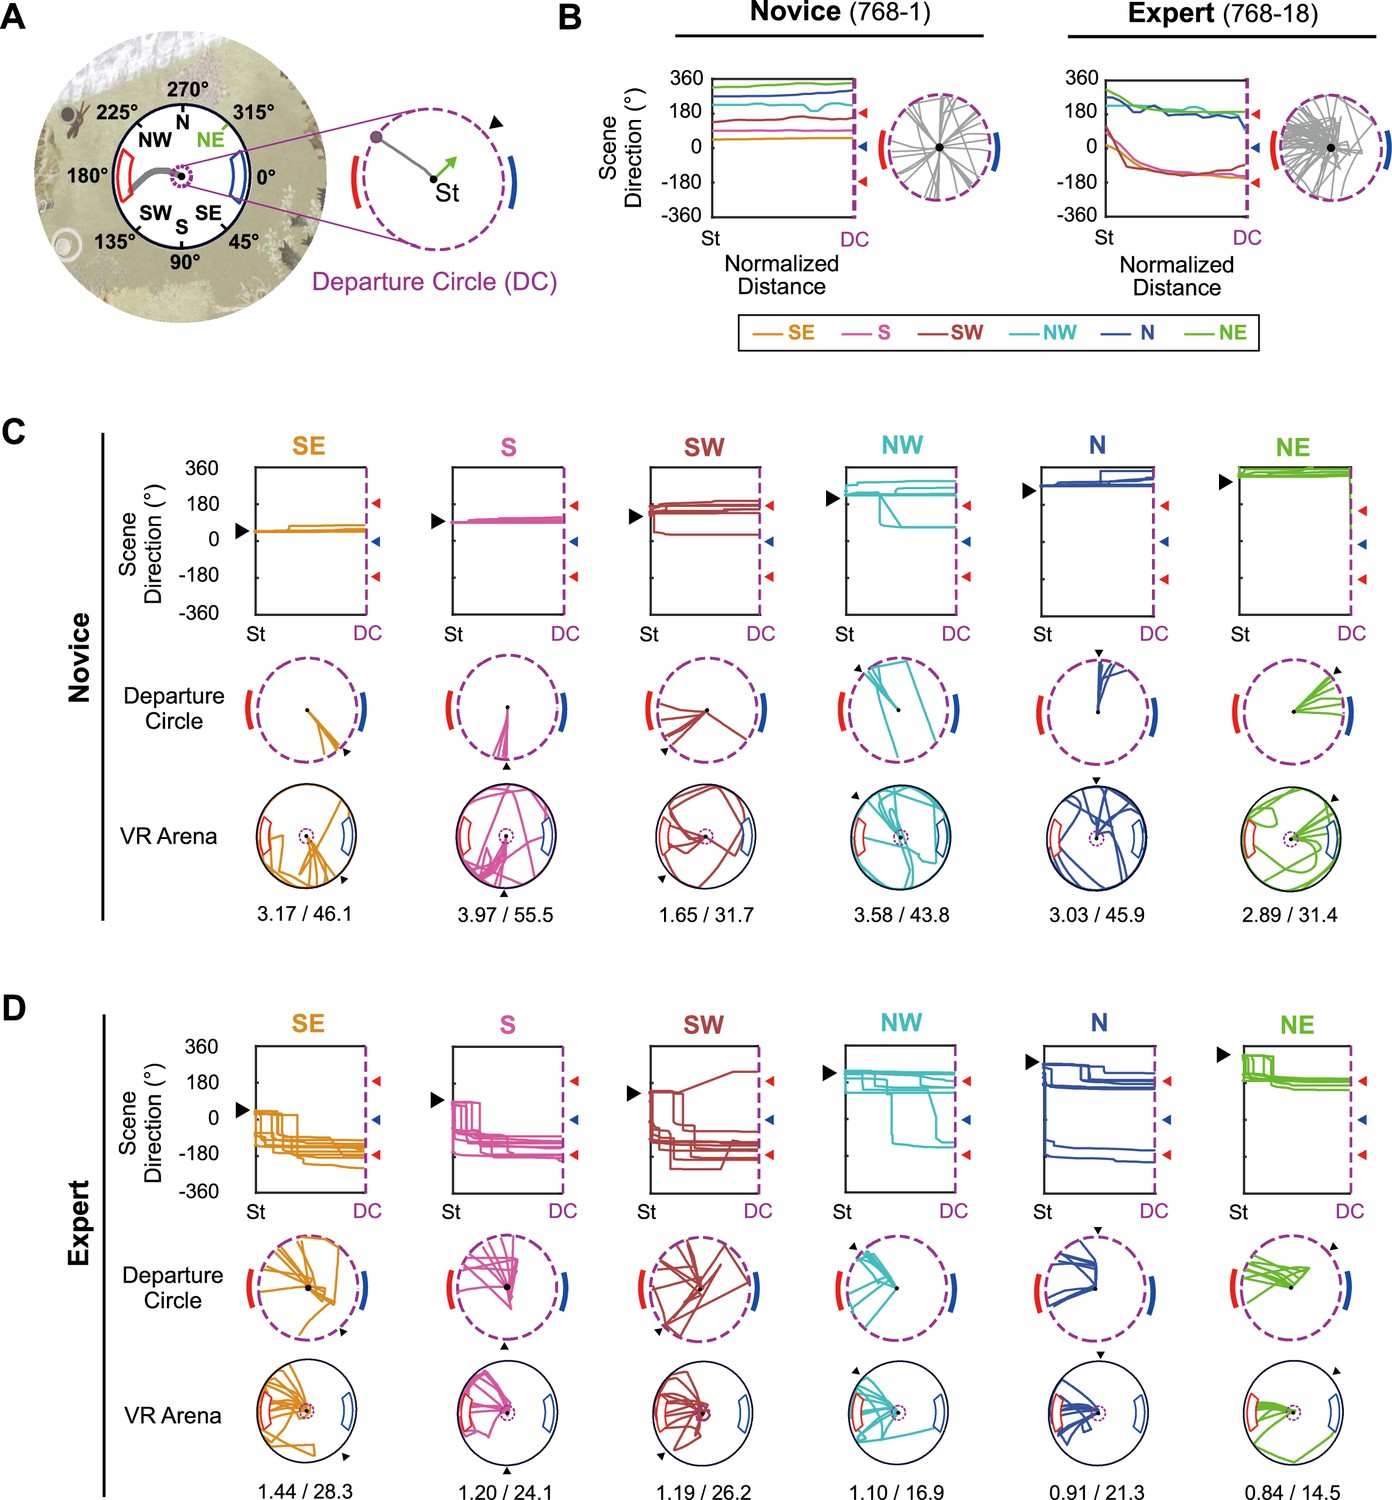
(A) The reference frame of the virtual environment. The six start directions are illustrated with the red high-value zone (180°) and blue low-value zone (0°). On the right, the departure circle (DC) is denoted with a purple dashed line, and the start direction is marked with a black arrowhead and a green arrow. (B) Overall changes in scene direction over the normalized distance between the start location and the DC (left). Each colored line indicates the median change of scene direction in trials with each start location, and red and blue arrowheads mark high- and low-value zone centers, respectively. The 0°-to-360° range was repeated in the ordinate of the plot to capture rotational movements in opposite directions (positive and negative directions for clockwise and counterclockwise rotations, respectively). The gray lines on the right show the rat’s trajectory within the DC. These examples were excerpted from the first and last days of pre-training of a single rat. The numbers after ‘Novice’ and ‘Expert’ indicate the rat and session number of the example. (C) Individual examples of scene directions and trajectories in the novice session. Scene direction change for each direction is drawn separately (top) for individual trials. The black arrowhead indicates that specific start direction. Trajectories within the DC (middle) and the whole arena (bottom) are also illustrated according to the indicated color code. Mean travel distance in meters and latency in seconds are shown below the virtual reality (VR) arena trajectory. (D) Same as (C), but for the expert session.
Figure 3
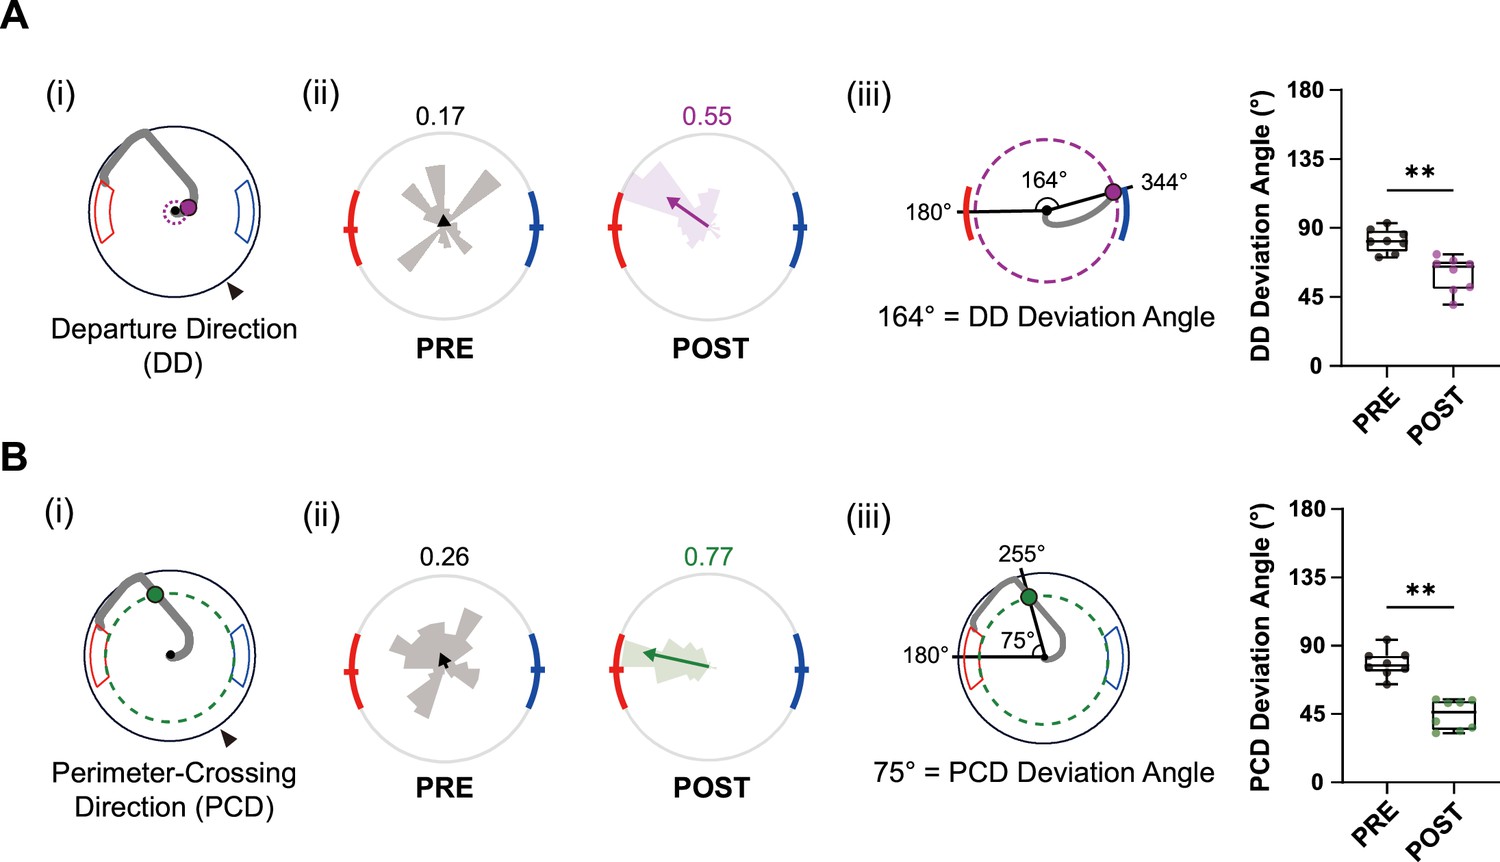
Learning index for efficient navigation during pre-surgical training.
(A) Changes in departing direction (DD) with learning. (i) Schematic of DD (purple dot), with the departure circle shown as a dashed line. (ii) Distribution of DDs in pre- and post-learning sessions from all rats (rose plots). Gray denotes the pre-learning session, whereas purple indicates the post-learning session. Mean vectors are illustrated as arrows with the same color scheme, and their lengths are indicated at the upper right side of the plot. (iii) Schematic of the DD-deviation angle (angle between the high-value zone center and the DD) and comparisons of DD-deviation angles between pre- and post-learning sessions. Each dot represents data from one rat (n=8). (B) Same as (A), but for perimeter-crossing direction (PCD; green dot). The perimeter is drawn as a green dashed circle. Data are shown as box plots (**p<0.01, Wilcoxon signed-rank test), and the significance level was set at α = 0.05.
Figure 4
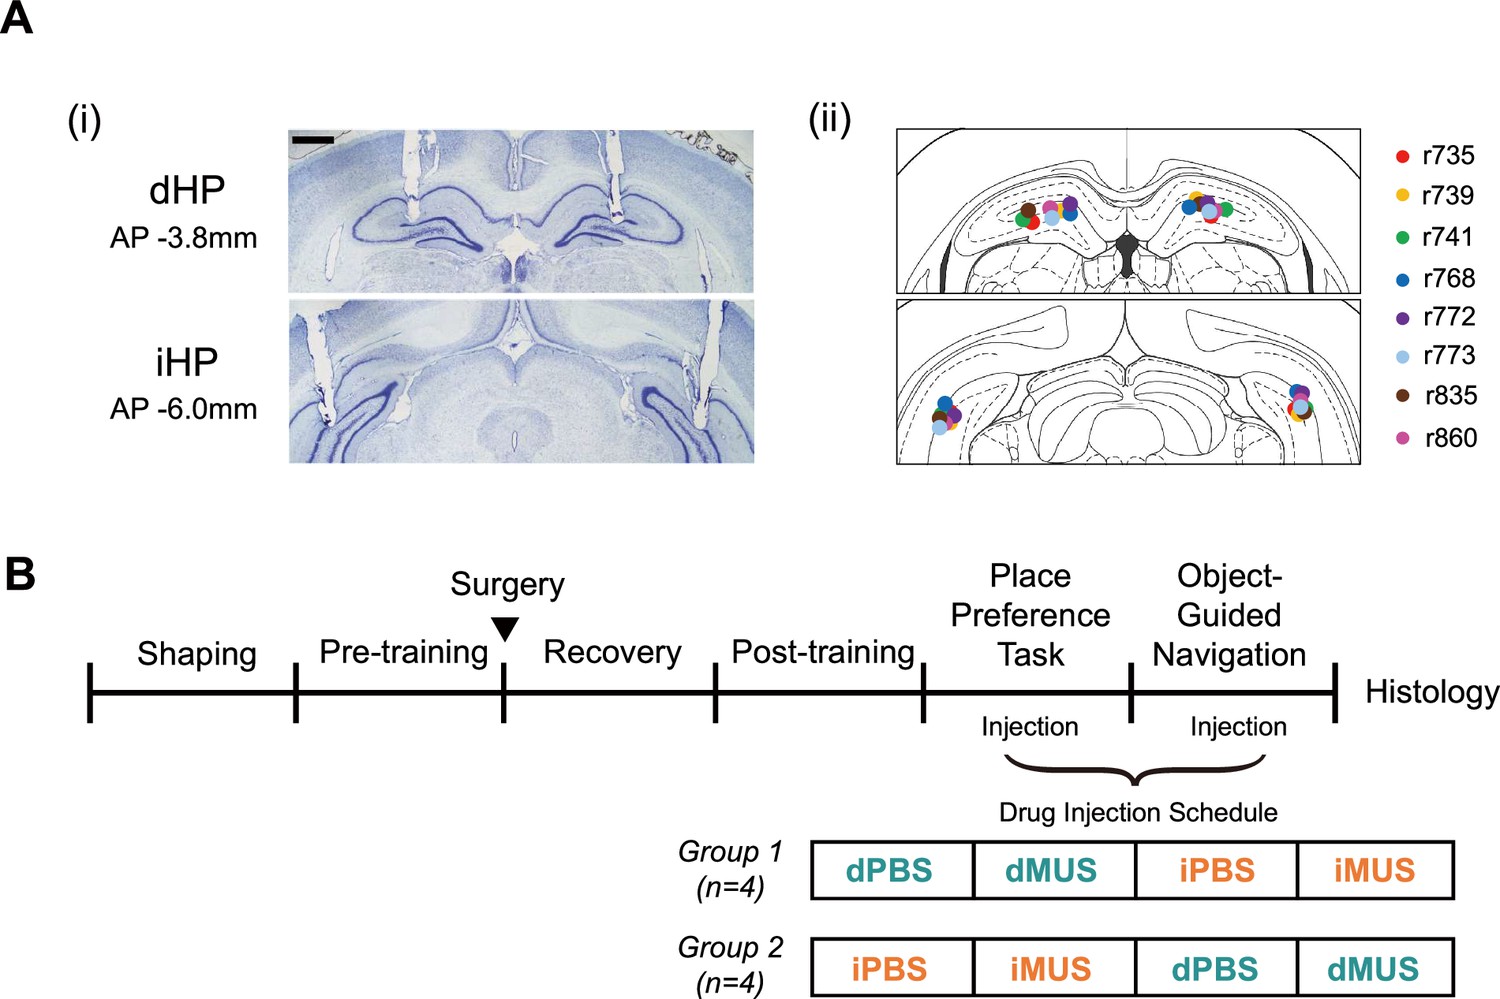
Cannula implantation locations and schedules for training and drug injection.
(A) Cannula positions marked. The scale bar at the upper left indicates 1mm. (i) Example of bilaterally implanted cannula tracks in Nissl-stained sections in the dorsal hippocampal (dHP) and intermediate hippocampal (iHP). (ii) Tip locations illustrated in the atlas, with different colors for individual rats (n = 8). (B) Training schedule. Rats were divided into two groups (n = 4/group) to counterbalance the injection order for the main task and probe test.
Figure 5
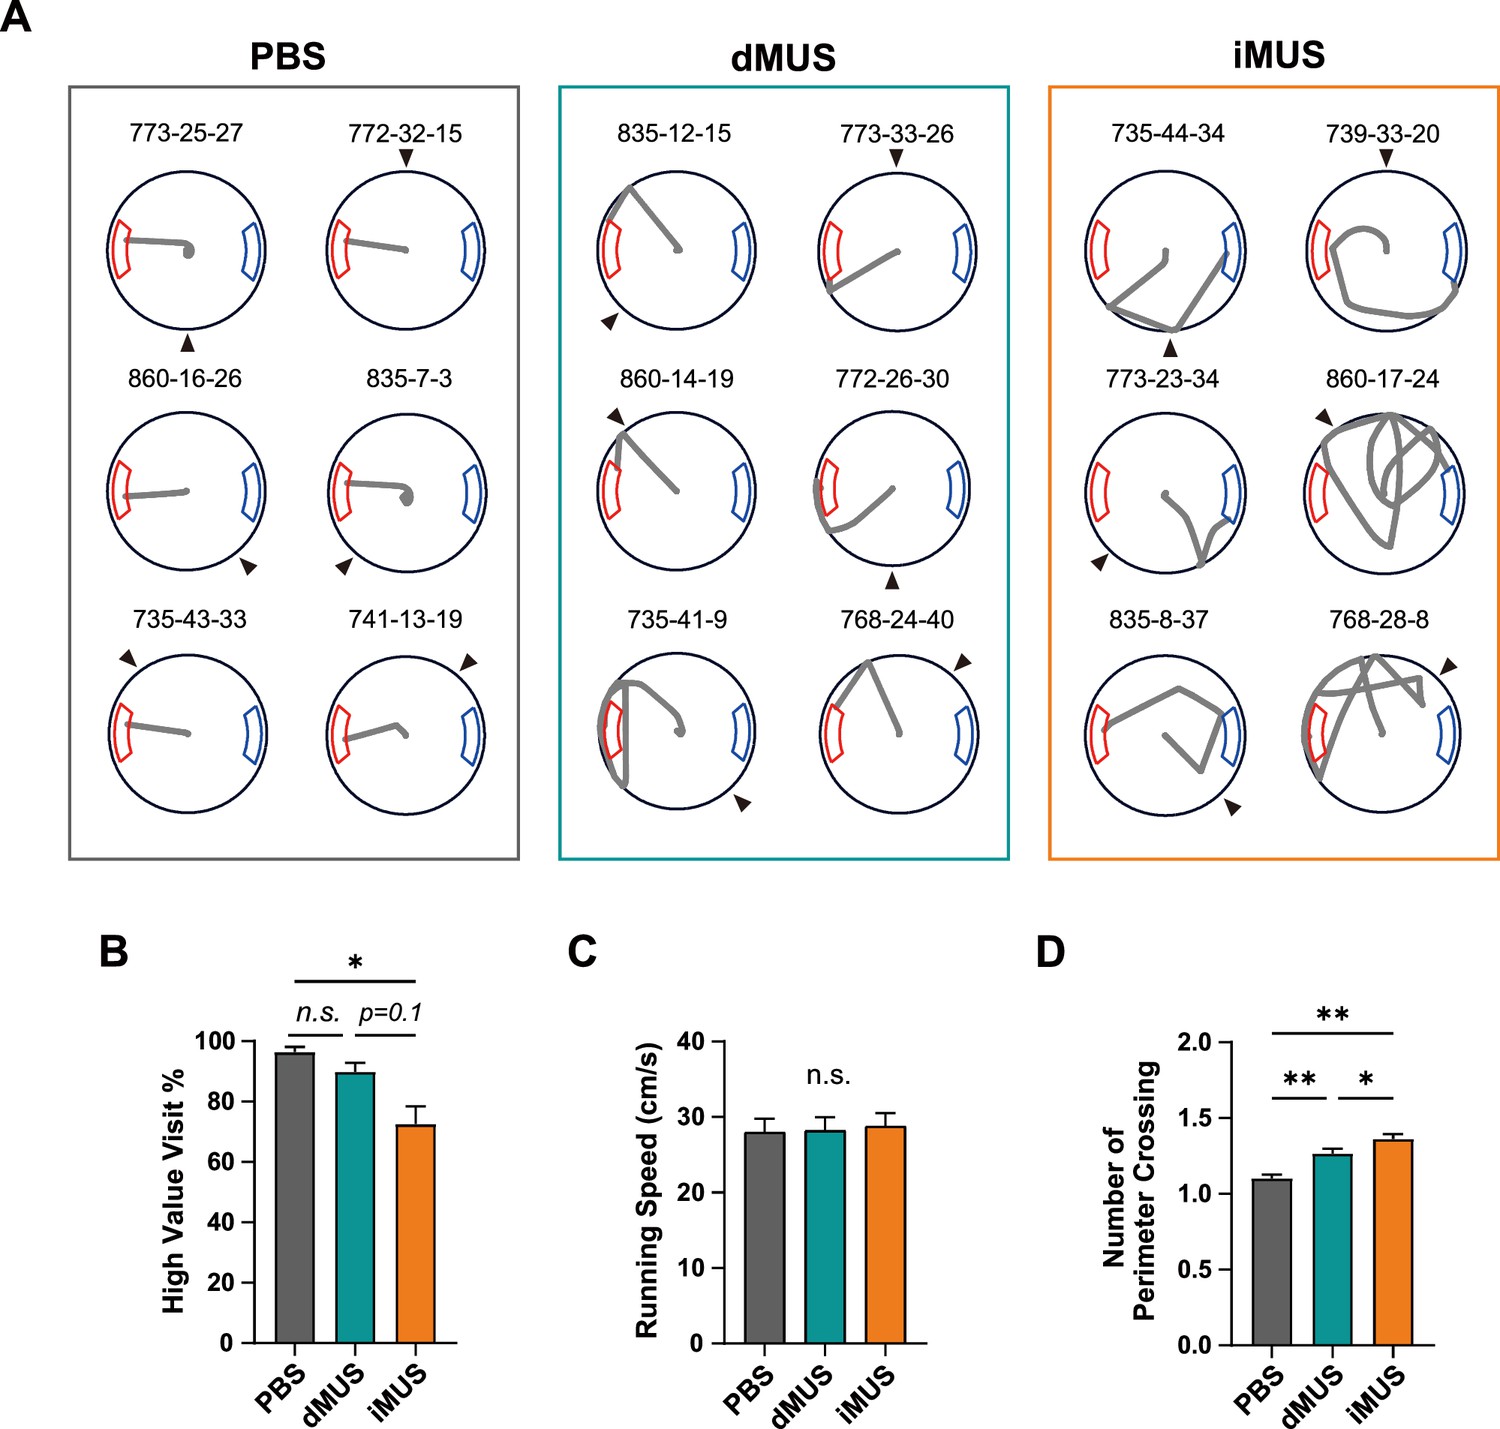
Changes in navigational pattern with each drug condition.
(A) Sample trajectories in each drug condition. Black arrowheads indicate the start direction and the gray line shows the trajectory for each trial. Numbers above each trajectory indicate the identification numbers for rat, session, and trial. (B) Mean high-value zone visit percentage for each drug condition (F(2,14) = 10.56, p<0.01, one-way repeated-measures ANOVA; p=0.2 for PBS vs. dMUS, p<0.05 for PBS vs. iMUS, p=0.1 for dMUS vs. iMUS, Bonferroni-corrected post hoc test). Gray, green, and orange each indicate PBS, dMUS, and iMUS sessions, respectively. (C) Average running speed (F(2,14) = 0.99, p=0.37, one-way repeated-measures ANOVA). (D) Number of perimeter crossings (F(1.16, 8.13)=1.34, p=0.29, one-way repeated-measures ANOVA with Greenhouse–Geisser correction; p<0.01 for PBS vs. dMUS, p<0.01 for PBS vs. iMUS, p<0.05 for dMUS vs. iMUS, Bonferroni-corrected post hoc test). For the PBS session, dPBS and iPBS sessions were first tested for significant differences between sessions; if they were not different, they were averaged to one PBS session for analysis purposes. The significance level was set at α = 0.05, and all error bars indicate SEMs (n=8). *p<0.05, **p<0.01.
Figure 6
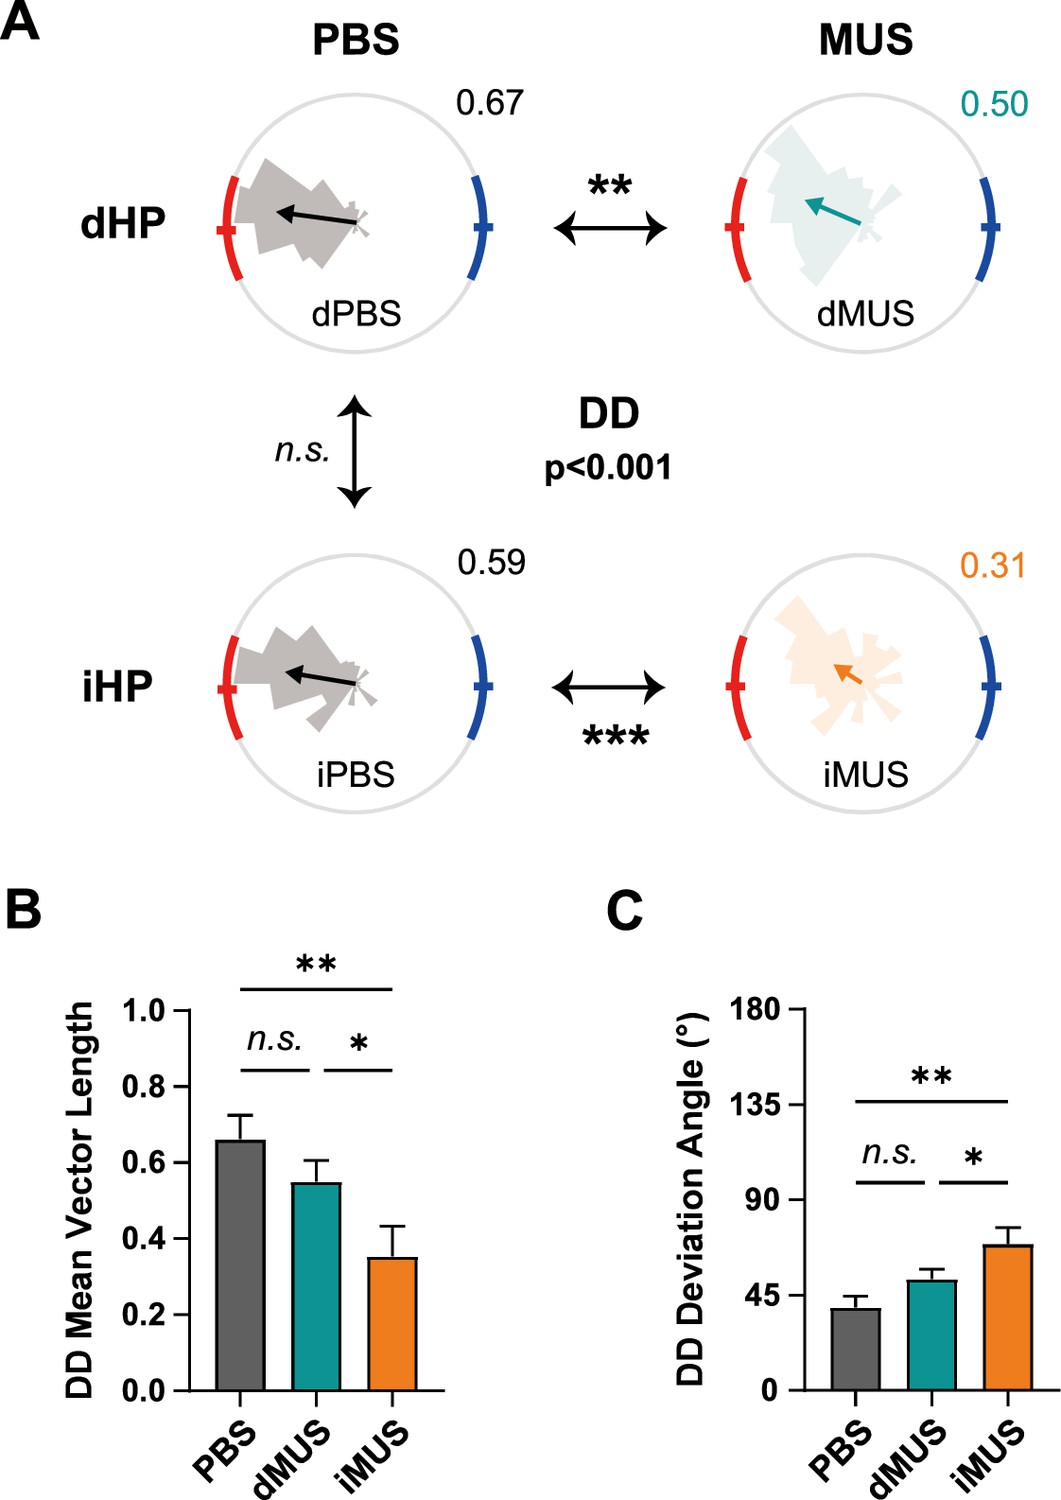
Dorsal hippocampal (dHP) and intermediate hippocampal (iHP) inactivation differentially affect efficient goal-directed navigation.
(A) Grouped comparison of departing direction (DD) in each drug condition. Distributions of DDs in each drug condition (rose plots) and a comparison of their mean directions. Gray plots, PBS sessions; green plots, dHP inactivation; orange plots, iHP inactivation. Red and blue arcs indicate high- and low-value zones, respectively. Statistically significant differences in mean vectors, illustrated as arrows, are indicated with asterisks. The mean directions of all four conditions were first compared together (F(3,1253) = 7.78, p<0.001, Watson–Williams test); a post hoc pairwise comparison was subsequently applied if the average mean vector length of the two sessions was greater than 0.45 (p<0.05 for dPBS vs. dMUS; p<0.001 for iPBS vs. iMUS; p=0.66 for dPBS vs. iPBS; Watson–Williams test). The number on the upper-right side of the plot shows the length of the mean vector. (B, C) Changes in mean vector length (F(2,14) = 12.64, p<0.001, one-way repeated-measures ANOVA; p=0.24 for PBS vs. dMUS, p<0.01 for PBS vs. iMUS, p<0.05 for dMUS vs. iMUS, Bonferroni-corrected post hoc test) (B) and deviation angles from the high-value zone center (F(2,14) = 13.37, p<0.001, one-way repeated-measures ANOVA; p=0.19 for PBS vs. dMUS, p<0.01 for PBS vs. iMUS, p<0.05 for dMUS vs. iMUS) (C) of the DD in each drug session. Error bars indicate SEMs (n=8), and the significance level was set at α = 0.05. *p<0.05, **p<0.01, ***p<0.001.
Figure 7
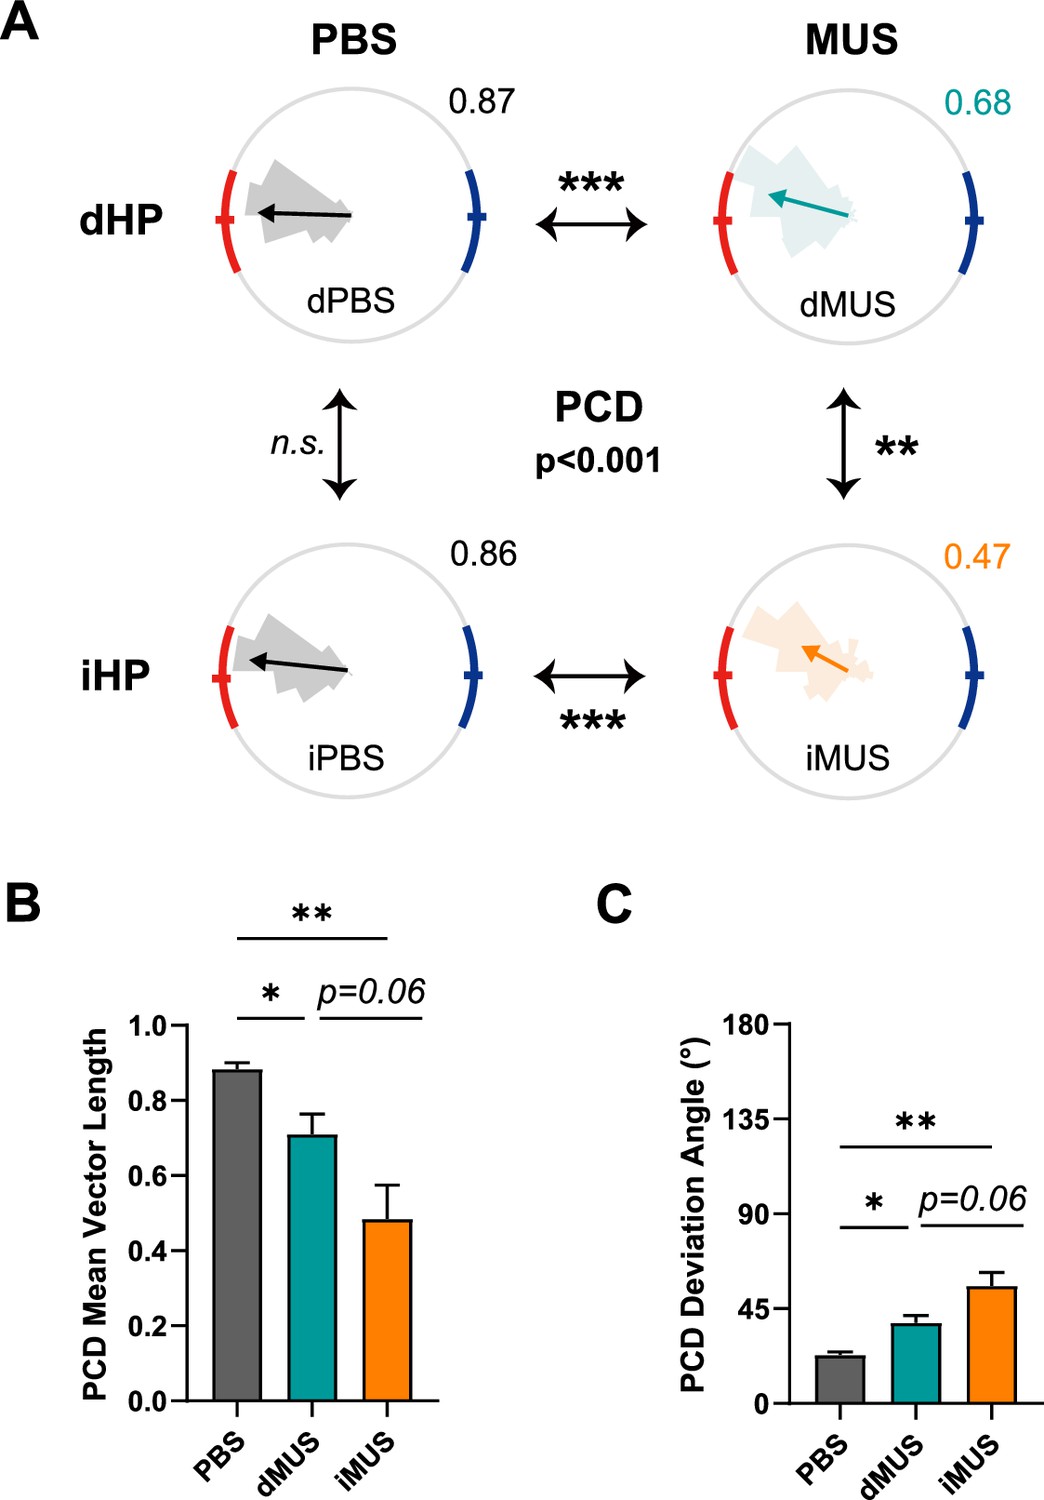
Precision of goal-directed navigation is more severely impaired with intermediate hippocampal (iHP) inactivation.
(A–C) Same as Figure 6, except showing perimeter-crossing direction (PCD). (A) Grouped comparison of PCD in each drug condition.(F(3,1253) = 16.22, p<0.001; p<0.001 for dPBS vs. dMUS, p<0.001 for iPBS vs. iMUS, p<0.01 for dMUS vs. iMUS, Watson-Williams test) . (B) Changes in mean vector length of the PCD in each drug condition (F(2,14) = 15.67, p<0.001, one-way repeated-measures ANOVA; p<0.05 for PBS vs. dMUS; p<0.01 for PBS vs. iMUS; p=0.06 for dMUS vs. iMUS, Bonferroni-corrected post hoc test). (C) Deviation angles from the high-value zone center of the PCD in each drug condition (F(2,14) = 17.24, p<0.001, one-way repeated-measures ANOVA; p<0.05 for PBS vs. dMUS, p<0.01 for PBS vs. iMUS; p=0.06 for dMUS vs. iMUS, Bonferroni-corrected post hoc test). Data are plotted as means ± SEMs (n=8), and the significance level was set at α = 0.05. *p<0.05, **p<0.01, ***p<0.001.
Figure 8
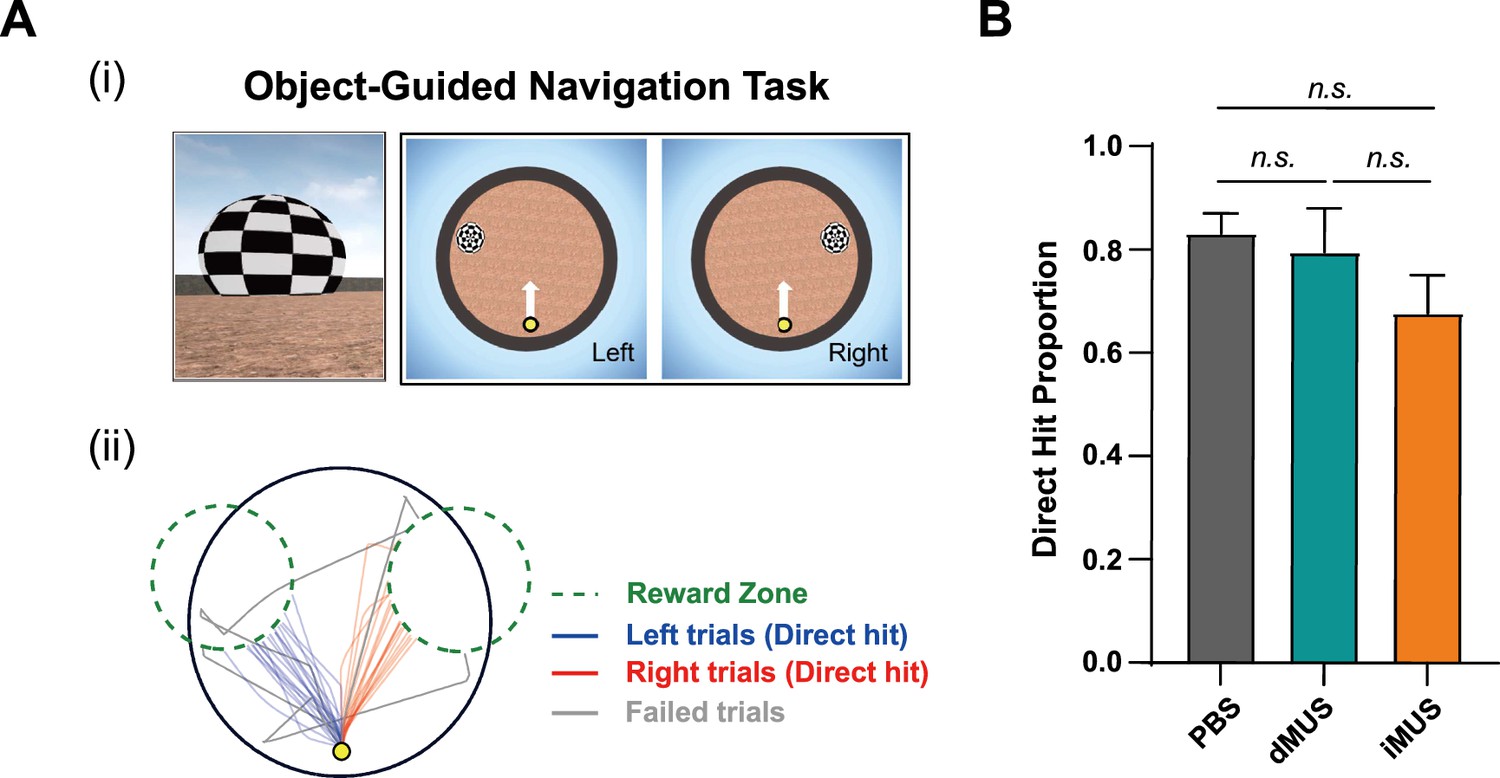
Goal-directedness and navigational capacity are unaffected by drug infusion.
(A) Object-guided navigation task as a probe test. (i) A flickering object appeared on either the left (‘Left trial’) or right (‘Right trial’) side of the screen. The start location is marked with a yellow dot, with a white arrow indicating the start direction, which remained the same for both trial types. (ii) Example of trajectories in one session. Blue and red lines represent trajectories from left and right trials that directly arrived at the reward zones, whereas gray lines indicate failed trials. Green dashed lines denote reward zones. (B) Comparison of the proportion of each drug condition’s direct hit trials (both left and right; F(2,8) = 1.60, p=0.26, one-way repeated-measures ANOVA). Error bars indicate SEMs (n=5), and the significance level was set at α = 0.05.
Author response image 1

Author response image 2

Author response image 3

Tables
Author response table 1
Comparison of our study with those from prior studies.
| Target regions | Within animal comparison | Manipulation | Value difference | Detailed,analysis,on,trajectory | |
|---|---|---|---|---|---|
| Jarzebowski et al., 2022 | Dorsal, intermediate | No | No | No | No |
| Bast et al., 2009 | Dorsal, intermediate, ventral | No | Lesion | No | No |
| Moser et al., 1995 | Dorsal, ventral | No | Lesion | No | No |
| De Hoz et al., 2003 | Dorsal, ventral | No | Lesion | No | No |
| Ferbinteanu and McDonald, 2001 | Dorsal, ventral | No | Lesion | No | Yes (heading angle) |
| De Saint Blanquat et al., 2013 | Dorsal, intermediate- ventral | No | Reversible inactivation (Muscimol) | No | No |
| Tabuchi et al., 2003 | Dorsal, ventral | Yes | No | Yes | No |
| Jin and Lee, 2021 (previous study) | Dorsal, intermediate | Yes | No | Yes | No |
| Hwang et al., 2024 (current study) | Dorsal, intermediate | Yes | Reversible inactivation (Muscimol) | Yes | Yes |
Additional files
Download links
A two-part list of links to download the article, or parts of the article, in various formats.
Downloads (link to download the article as PDF)
Open citations (links to open the citations from this article in various online reference manager services)
Cite this article (links to download the citations from this article in formats compatible with various reference manager tools)
Differential functions of the dorsal and intermediate regions of the hippocampus for optimal goal-directed navigation in VR space
eLife 13:RP97114.
https://doi.org/10.7554/eLife.97114.3


