Enteric glia regulate Paneth cell secretion and intestinal microbial ecology
- Division of Gastroenterology, Department of Pediatrics, Boston Children’s Hospital and Harvard Medical School, United States
- Division of Infectious Diseases, Department of Pediatrics, Boston Children’s Hospital and Harvard Medical School, United States
- Department of Microbiology, Harvard Medical School, United States
- Research Computing, Department of Information Technology, Boston Children’s Hospital, United States
- Department of Pathology, Beth Israel Deaconess Medical Center, United States
- Institute of Human Nutrition, Columbia University Irving Medical Center, United States
- Department of Surgery, Beth Israel Deaconess Medical Center, United States
Figures
Figure 1 with 2 supplements
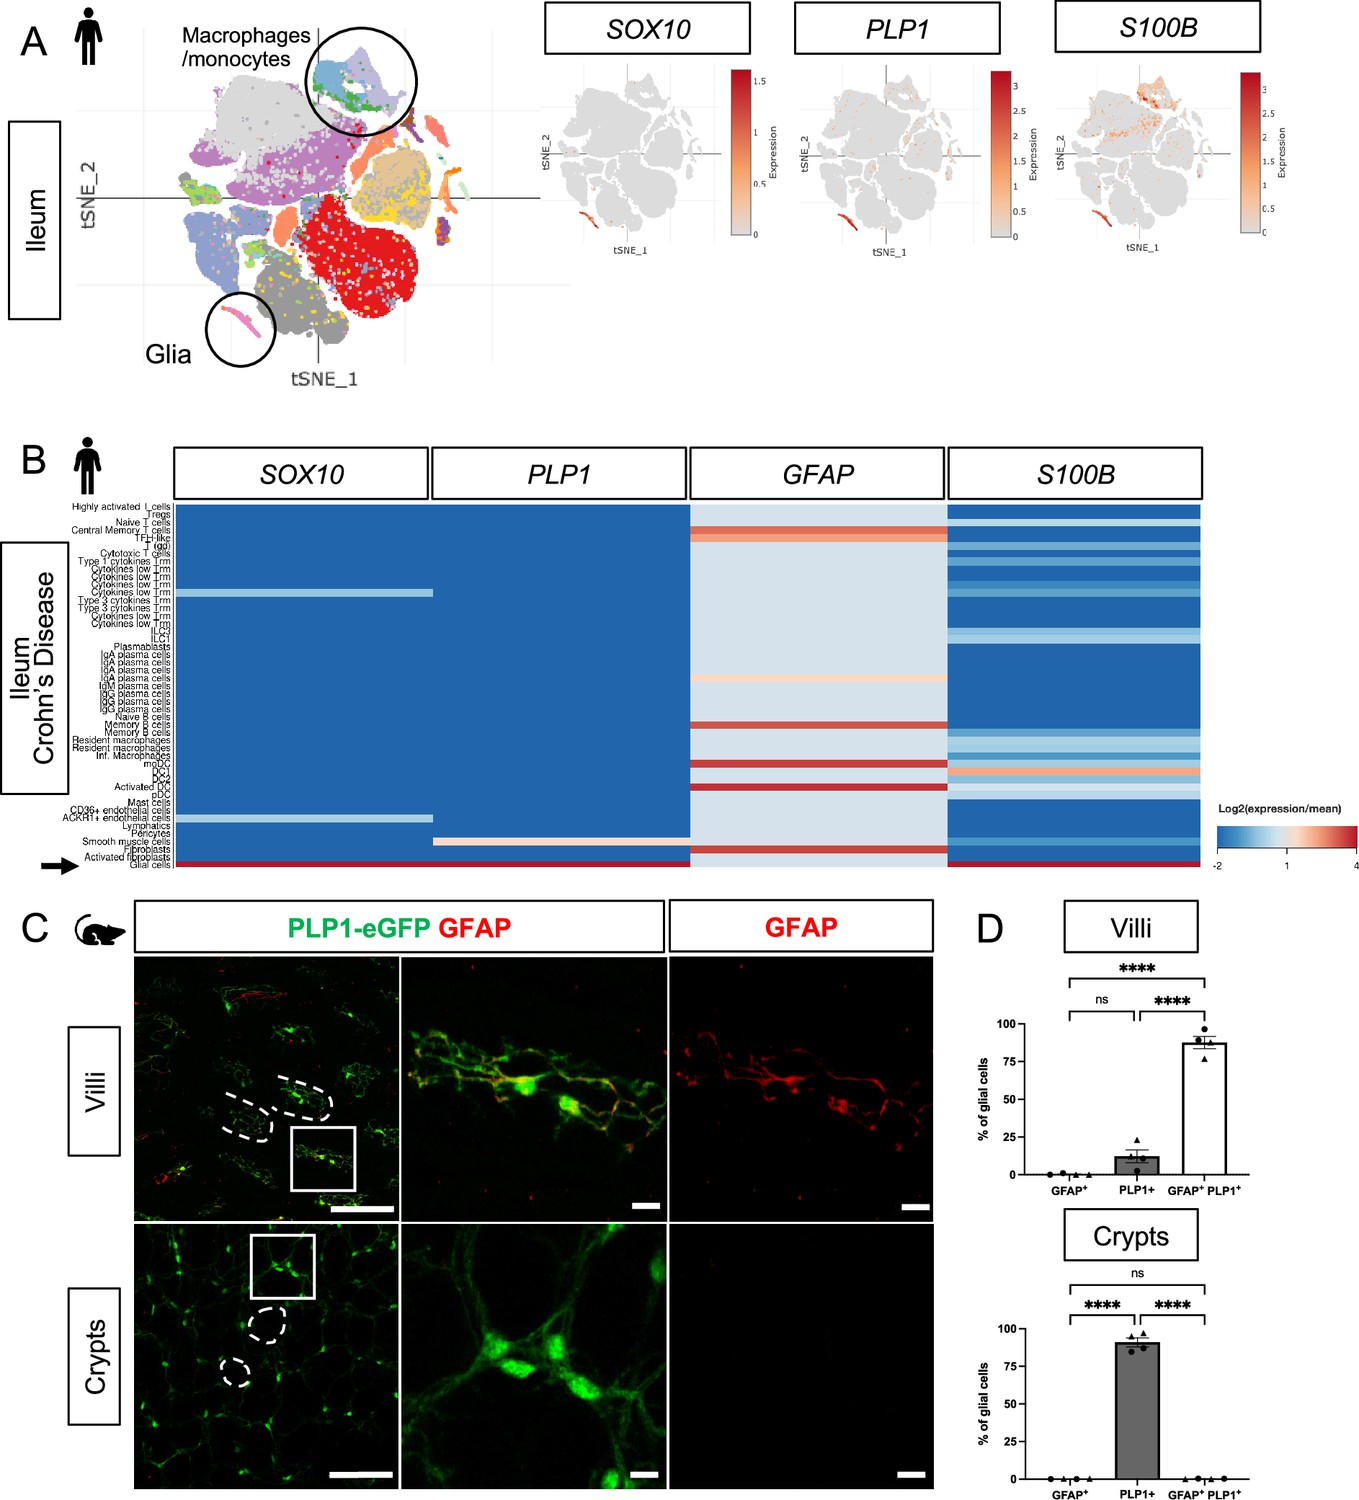
Mucosal glia in human and mouse small intestines widely express Plp1.
(A) t-SNE plot of 94,451 cells isolated from terminal ileal mucosal biopsies from 13 children with non-inflammatory, functional gastrointestinal disorders (Zheng et al., 2023), colored by annotated cell identity. PLP1 and SOX10 expression exhibit relative specificity to glia; the cells express high levels of these transcripts. S100B is expressed by glia as well as non-glial cells such as macrophages and monocytes. GFAP is undetectable in this dataset. (B) Heatmap of gene expression from 82,417 cells obtained by scRNAseq of mucosal biopsies from inflamed and non-inflamed segments of terminal ileum obtained from 11 adults with Crohn’s disease (Martin et al., 2019). In contrast to PLP1, SOX10, and S100B, which are most highly expressed in glia (arrow), GFAP expression is highest in non-glial cells. (C) Whole-mount immunostaining of ileum from an adult Plp1-eGFP mouse for GFAP imaged at the level of the villus- (top panels) and crypt-associated mucosa (bottom panels). Most glia in the villi express both Plp1 and GFAP while virtually all glia in the mucosa surrounding epithelial crypts are Plp1+ and not immunoreactive for GFAP. (D) Quantification of the percentages of GFAP+, PLP1+, GFAP+ PLP1+ cells in the mucosa. Each data point represents an individual mouse, with triangles representing males and circles representing females (n=4). Scale bars = 100 μm (large panels) and 20 μm (magnified images). Error bars represent SEM. **** p<0.0001 by one-way ANOVA with Tukey multiple comparisons test.
Figure 1—figure supplement 1
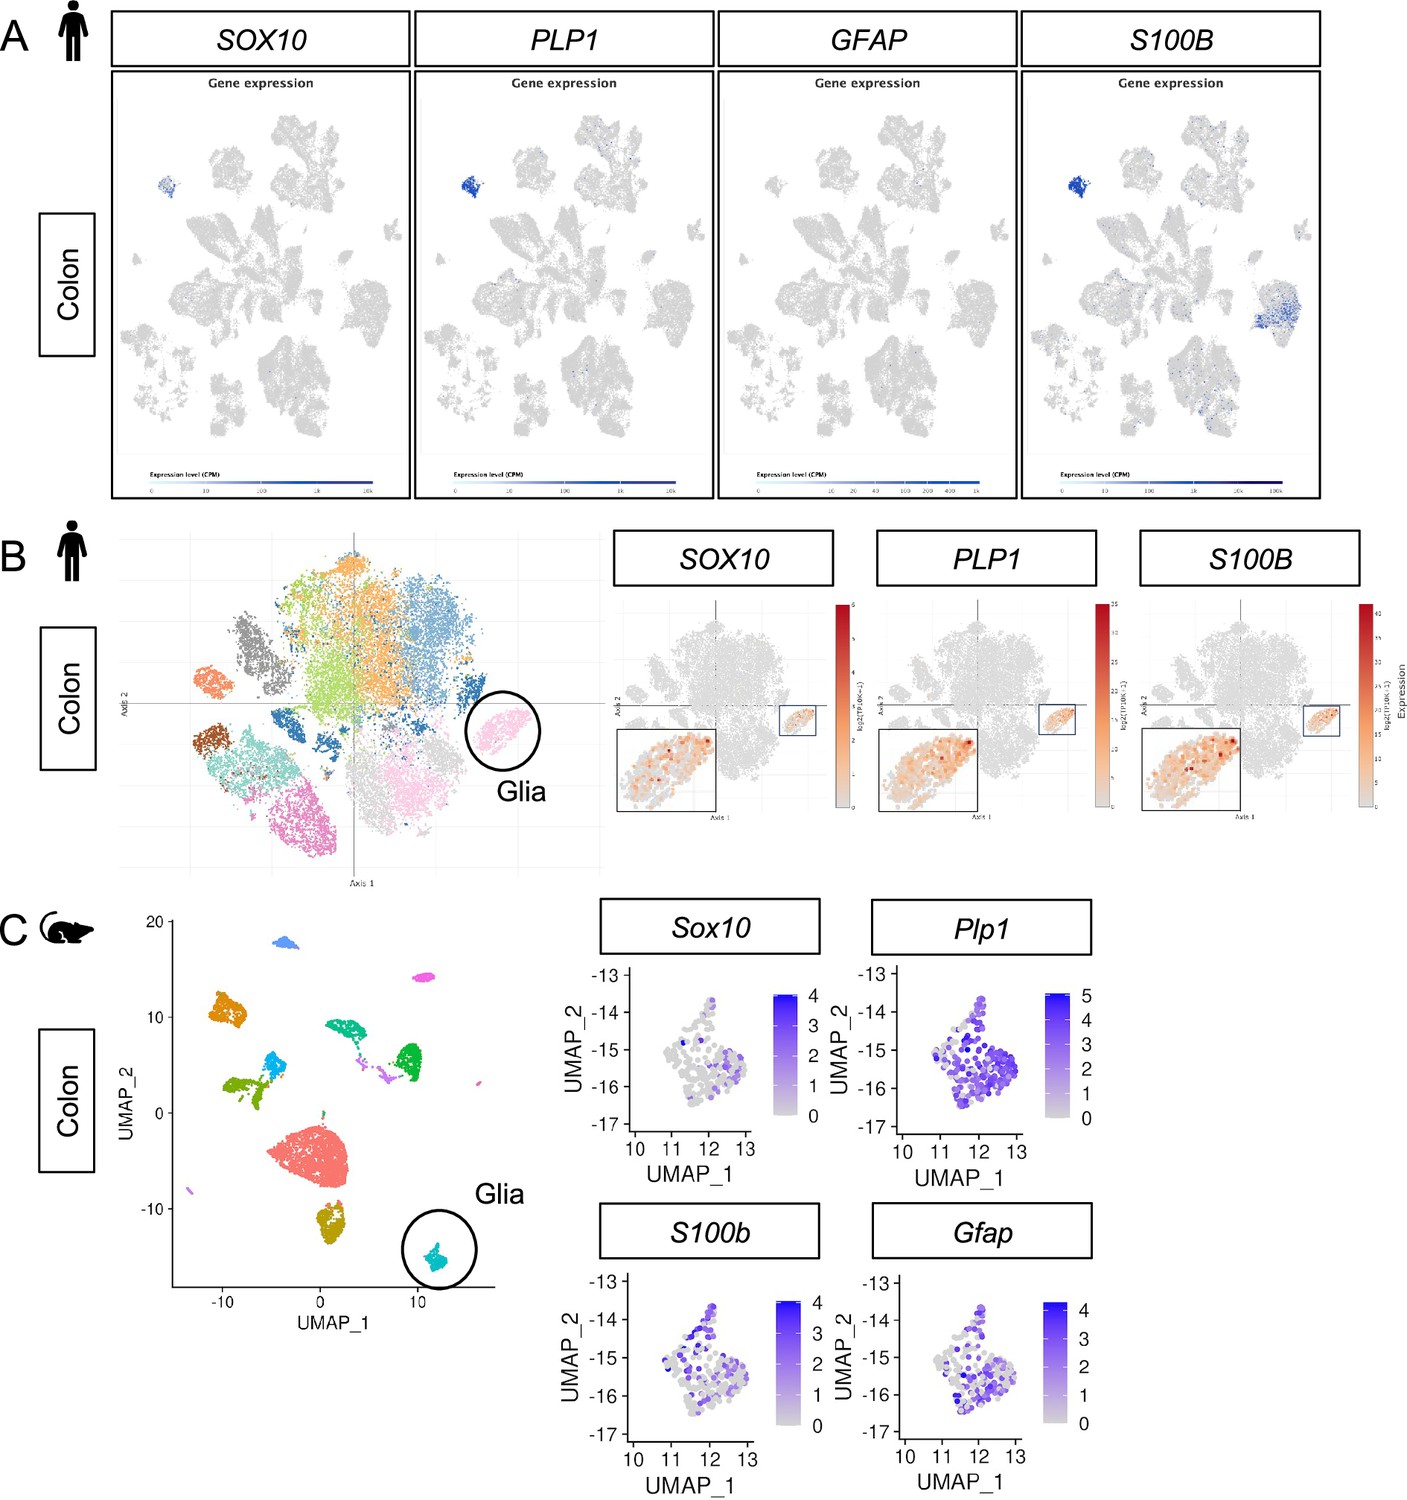
Plp1 is the most specific and widely expressed marker of enteric glia in human and mouse colonic mucosa.
(A) UMAP plots of 91,103 cells isolated from non-malignant colon tissues from 29 adult colorectal cancer patients (Lee et al., 2020). PLP1 marks most of the cells in the putative glial cluster while no GFAP is detected. S100B is robustly expressed by glia but also detectable in non-glial cells. SOX10 is highly specific to the putative glial cluster but is not as universally detected within this cluster as PLP1 and S100B. (B) t-SNE plot of 31,872 stromal cells isolated from 12 healthy individuals (8,480 cells) and 18 Ulcerative Colitis patients (10,245 cells from inflamed regions and 13,147 cells from non-inflamed regions) (Smillie et al., 2019). SOX10, PLP1, and S100B expression is restricted to the putative glial cluster while GFAP is undetectable in this dataset. Insets show expression of the indicated genes in the putative enteric glia cluster. (C) UMAP plots of Drop-seq data from 6,603 mouse colonic mesenchymal/lamina propria cells (Roulis et al., 2020). Plp1 is widely expressed in the putative glial cluster (330 cells) while Sox10, S100b, and Gfap exhibit narrower expression.
Figure 1—figure supplement 2
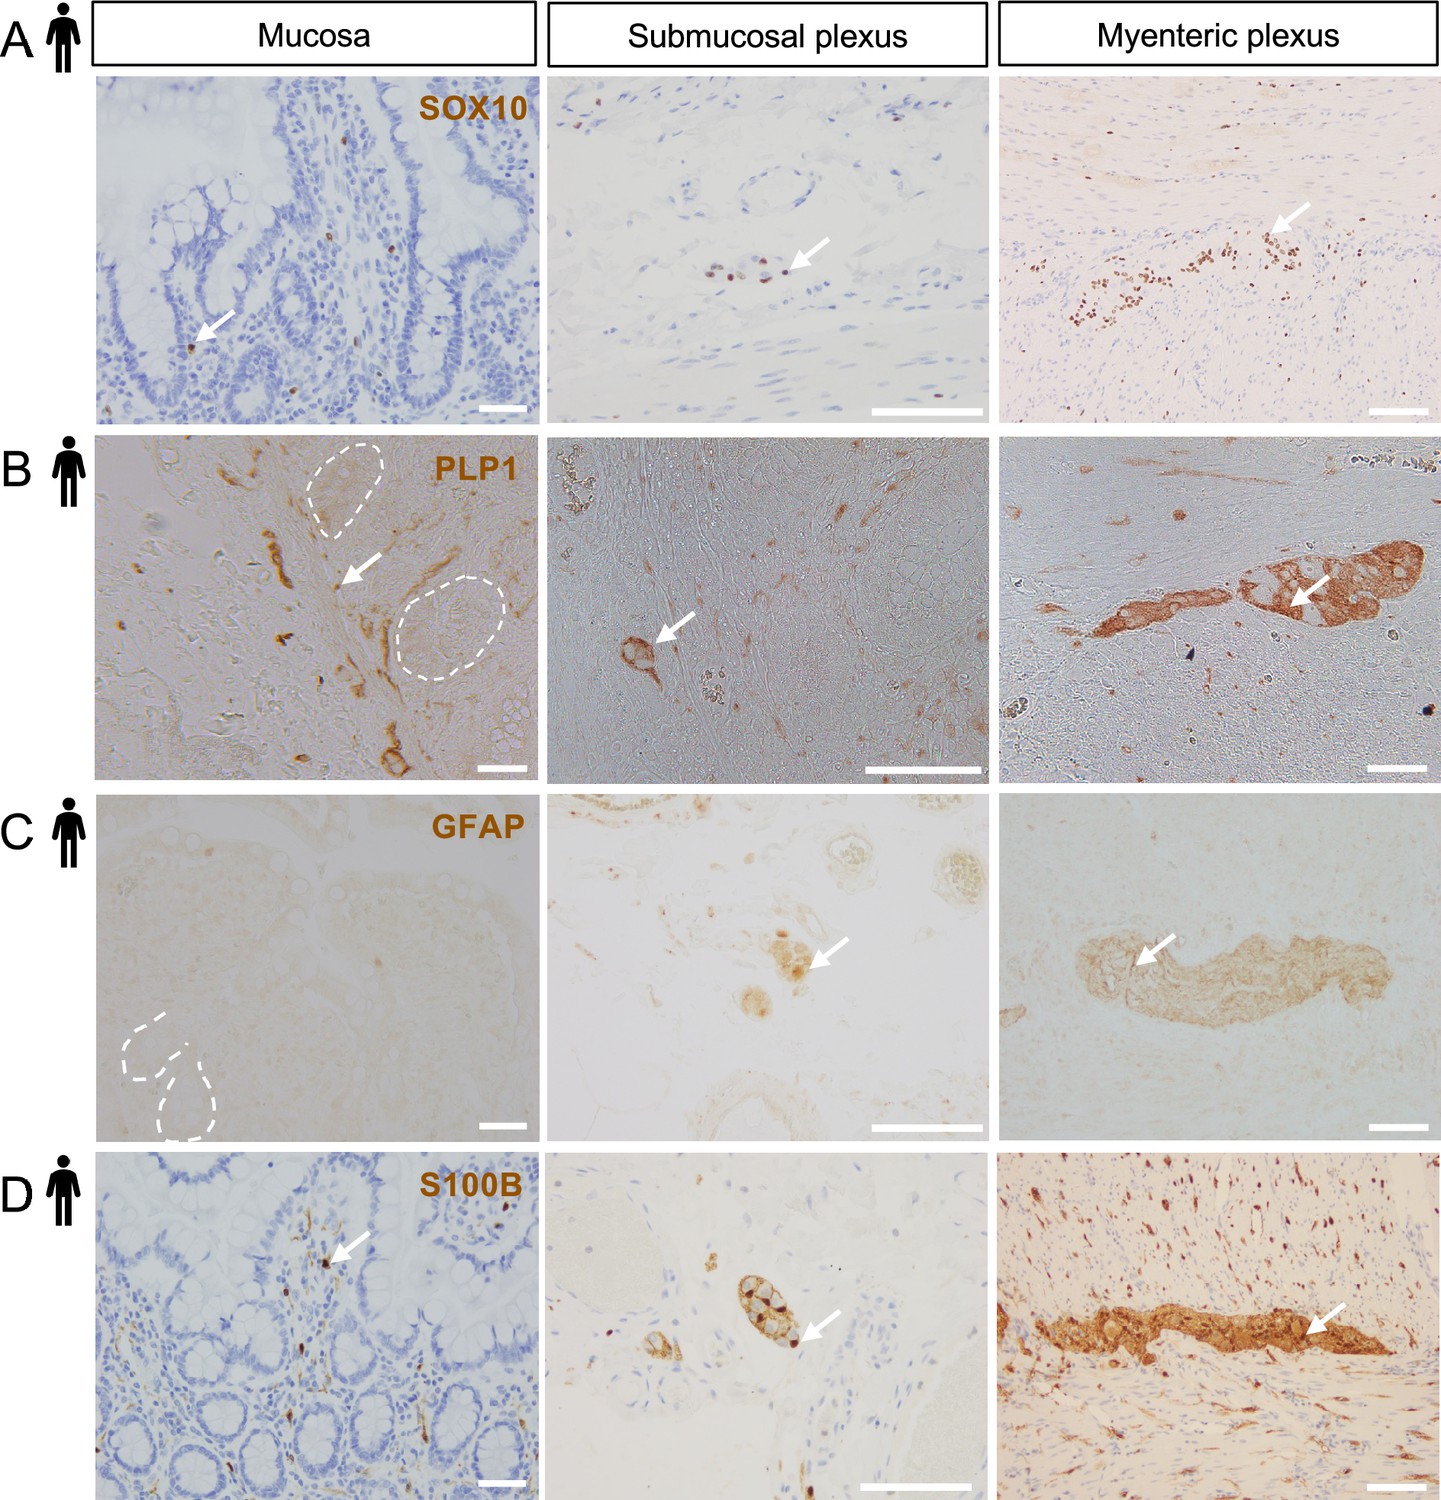
S100B, SOX10, PLP1, and GFAP expression across the radial axis of the human small intestine.
(A–D) Representative DAB IHC images of SOX10 (A), PLP1 (B), GFAP (C), and S100B (D) staining in non-diseased small intestinal tissue from adult females shown in three compartments: mucosa (left panels; selected crypts outlined in white for clarity), submucosal ganglia and the surrounding connective tissue and muscle (middle panels), and the myenteric plexus with surrounding circular and longitudinal muscle (right panels). SOX10, PLP1, and S100B were detected in all three compartments. GFAP immunoreactivity was detected in submucosal ganglia (middle panel) and myenteric ganglia (right panel), but not the mucosa. Images are representative of observations made in five of five subjects for SOX10 and S100B, three of four subjects for PLP1, and three of three subjects for GFAP. Arrows indicate representative immunoreactive cells. Scale bars = 100 μm (left and right panels) and 50 μm (middle panels).
Figure 2 with 2 supplements
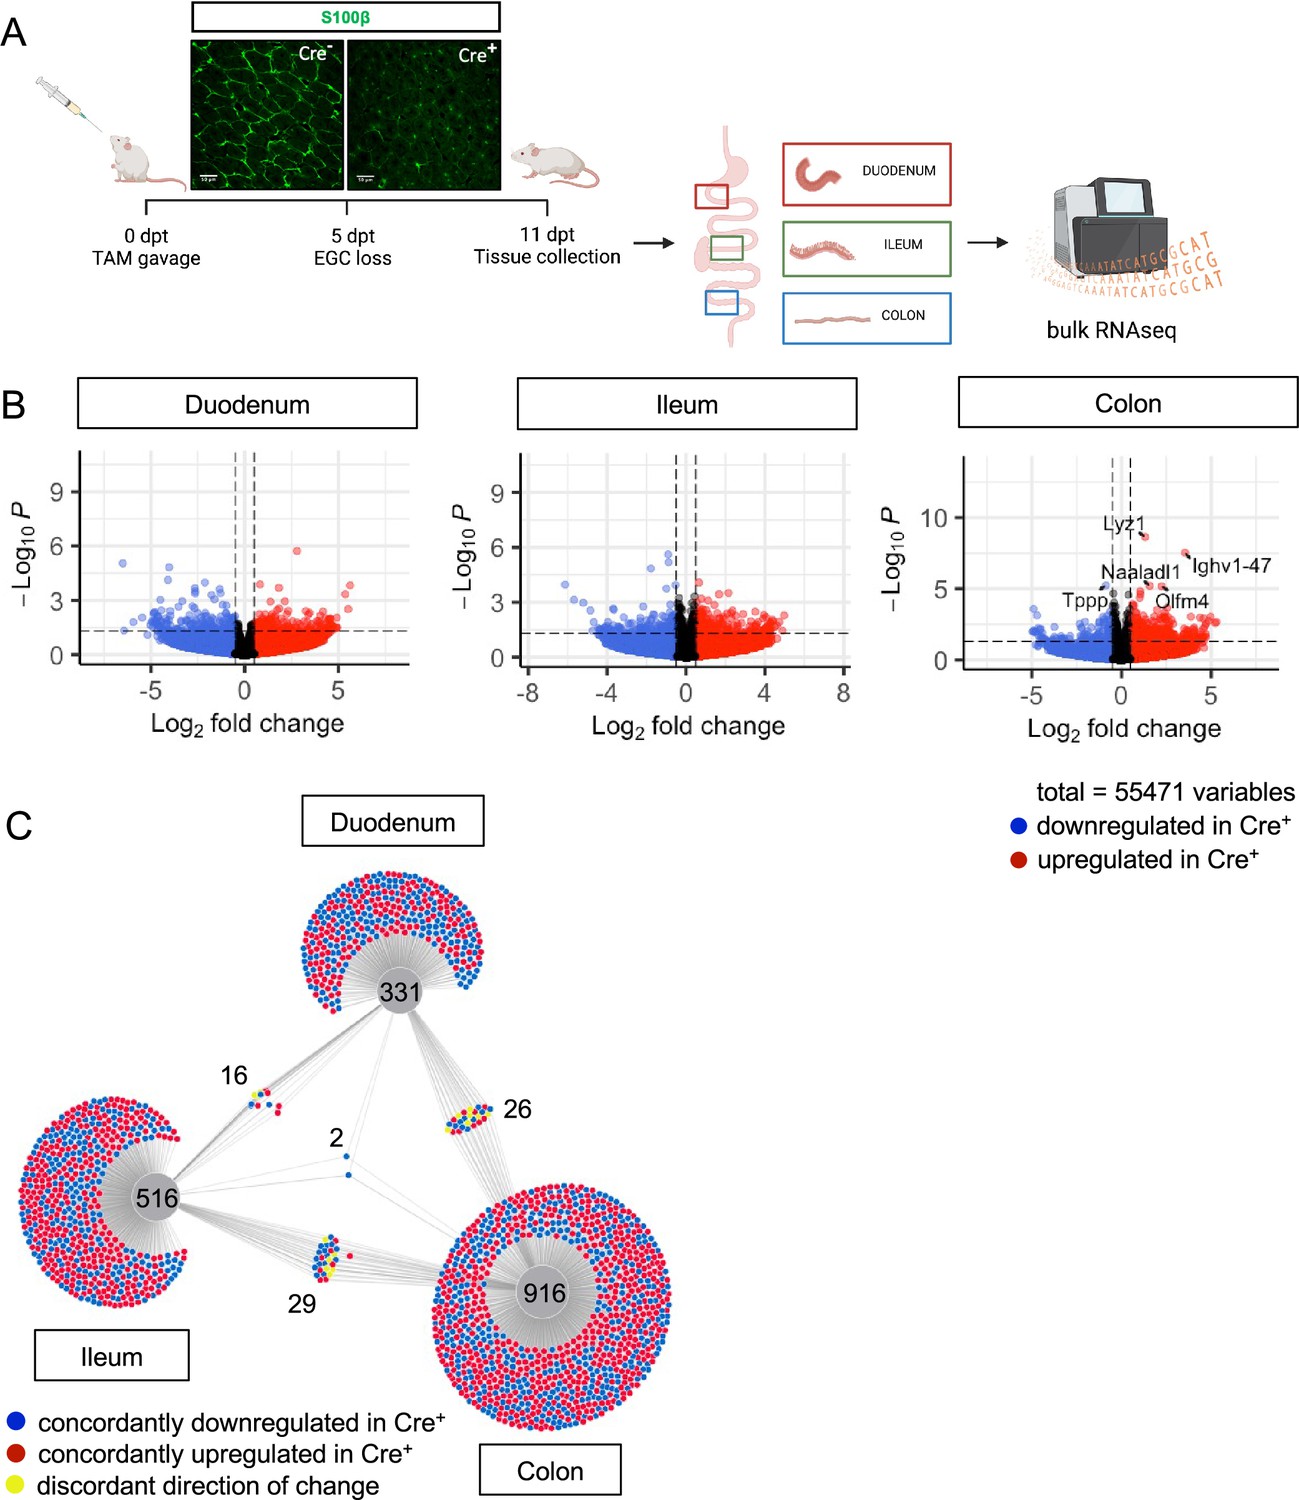
Glial ablation induces muted, region-specific transcriptional changes along the longitudinal axis of the intestine.
(A) Schematic of the experimental timeline for bulk RNA-sequencing of intestinal tissue segments from male Plp1CreER Rosa26DTA/+ mice (annotated as Cre+) and Rosa26DTA/+ littermate controls (annotated as Cre-). Tissues were collected 11 days after administration of tamoxifen (11dpt; n=4 per genotype). In this model, the majority of enteric glial cells (EGC) are eliminated by 5dpt, as seen on the representative IHC image of S100B staining in Cre+ and Cre- small intestinal mucosa. Glial depletion is stable through at least 14dpt (Rao et al., 2017). Panel A created with BioRender.com. (B) Volcano plots showing differentially expressed genes in duodenum, ileum, and colon of Cre- and Cre+ mice. Genes that reached statistical significance cutoff of padj <0.05 are labeled. Red and blue colors denote up- and down-regulated genes in Cre+ mice compared to Cre- mice with p-value <0.05, respectively. Differential analysis was conducted using DESeq2. (C) DiVenn analysis illustrates genes that were up- (red) or down-regulated (blue) in the duodenum, ileum, and colon of Cre+ mice compared to Cre- controls at 11dpt with p<0.05 threshold for significance. Nodes linking tissues constitute genes that were differentially expressed in Cre+ mice compared to Cre- controls in both of those tissues. Yellow color marks genes with discordant direction of change between the different tissue regions. Numbers indicate the number of genes at each node or tissue segment that were identified as differentially expressed. Overall, this analysis illustrates that most differentially expressed genes in Cre+ mice were region-specific with little overlap between duodenum, ileum, and colon.
Figure 2—figure supplement 1
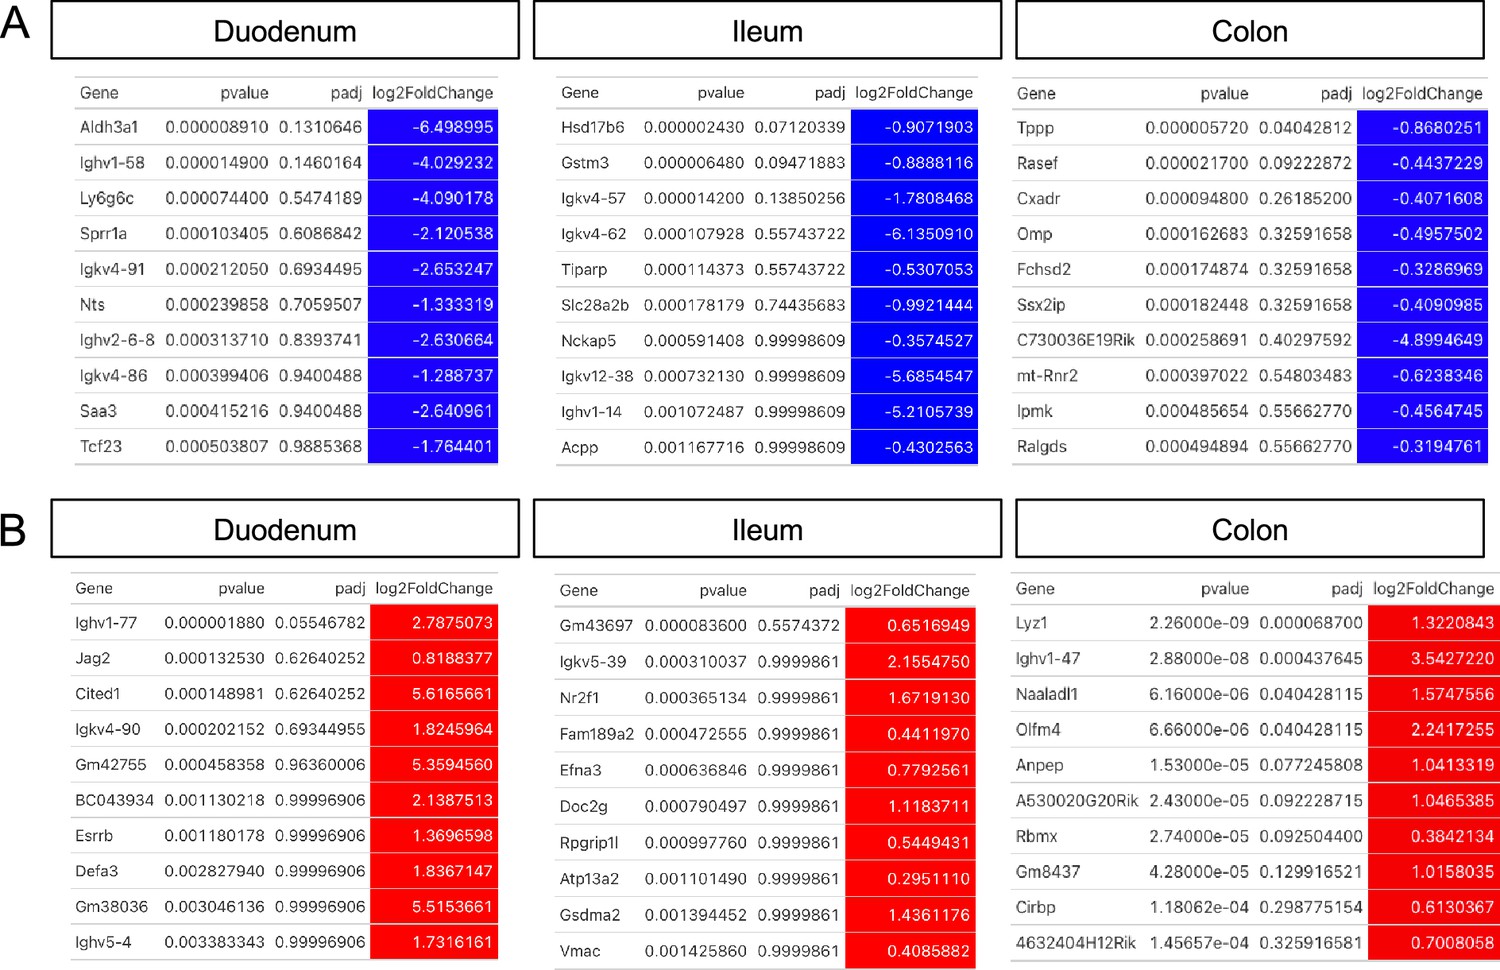
Changes to whole tissue transcriptomes resulting from glial ablation.
(A, B) Top 10 most down- (A, blue) and upregulated (B, red) genes in the duodenum, ileum, and colon of Cre+ mice compared to Cre- controls, ordered by p-value. Differential gene expression analysis was performed using DESeq2.
Figure 2—figure supplement 2
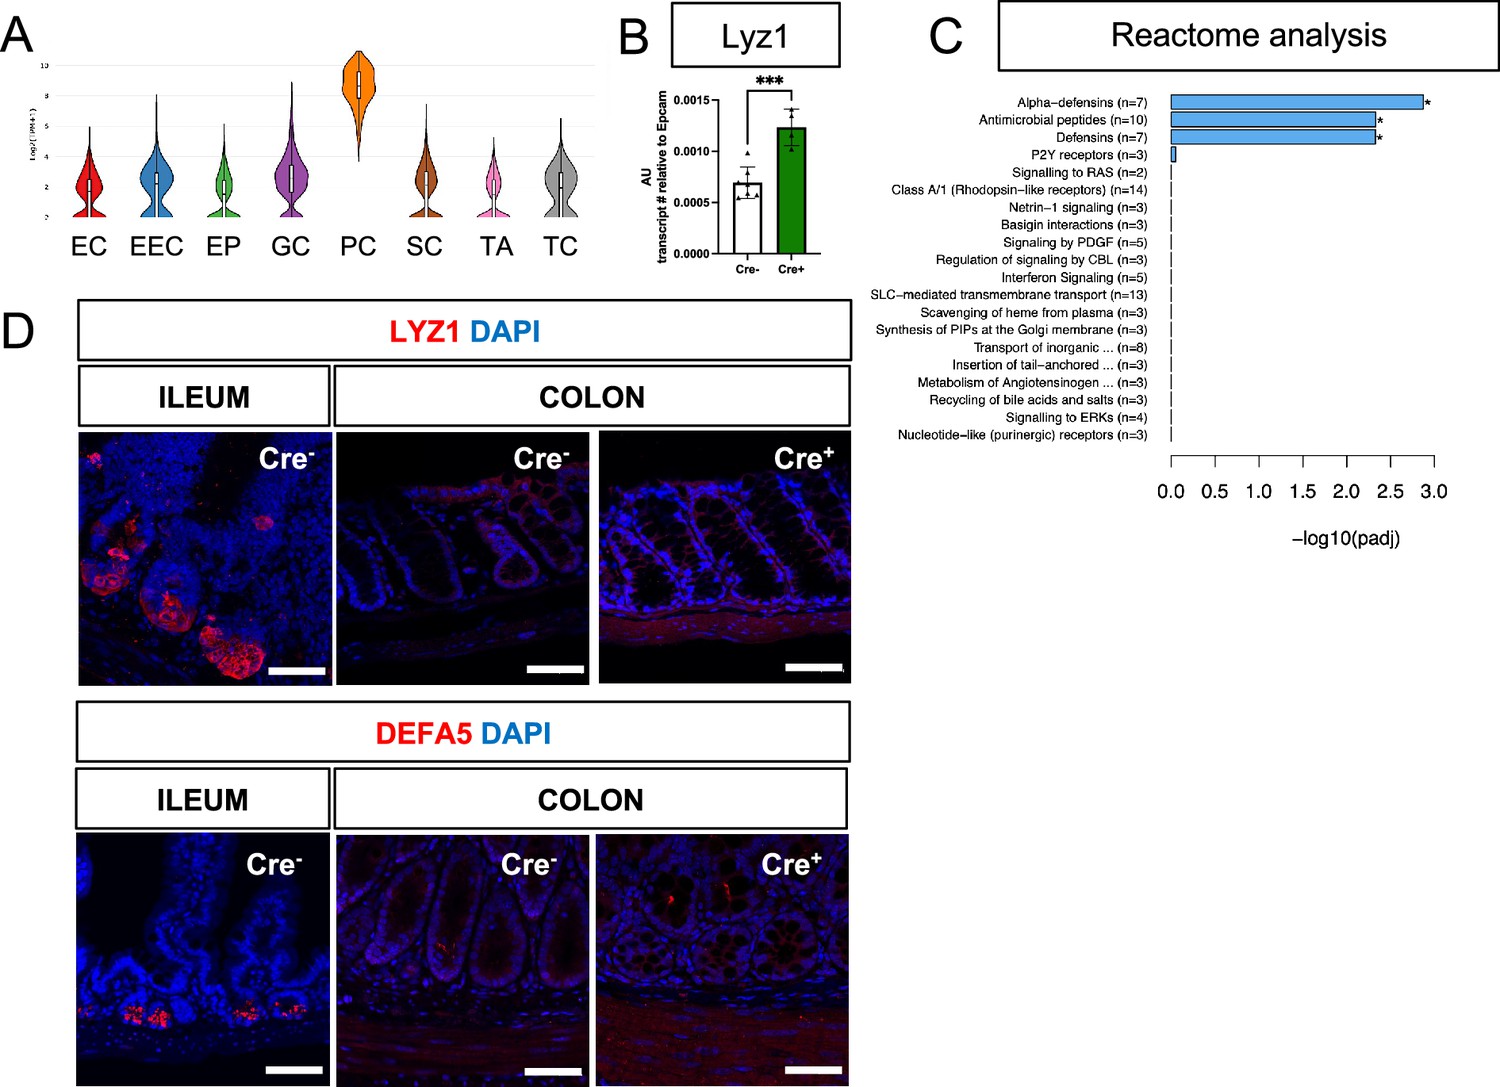
Glial ablation induces colonic expression of Lyz1 at the transcript, but not protein, level.
(A) Violin plots of Lyz1 expression in small intestine epithelial cells show enrichment of expression in Paneth cells (data from scRNAseq of mouse small intestine; Haber et al., 2017). EC – enterocyte, EEC – enteroendocrine cell, EP – enterocyte progenitor, GC – Goblet cell, PC – Paneth cell, SC – Stem cell, TA – Transient Amplifying cell, TC – Tuft cell. (B) Quantitative RT-PCR analysis of Lyz1 expression in proximal colons of male Cre- and Cre + mice. Each data point represents one mouse (n=7 for Cre-, n=4 for Cre+). Error bars represent SEM. ***p<0.001 by unpaired parametric t-test. (C) Reactome analysis of differentially expressed genes (significance threshold p<0.05) in colons of Cre+ mice compared to Cre- mice. (D) Representative IHC images of LYZ1 and DEFA5 staining in the distal ileums of Cre- mice (positive control) compared to the proximal colons of Cre+ and Cre- mice (n=3 per genotype; >100 crypts/mouse assessed). No ectopic LYZ1+ or DEFA5+ cells were detected in the large intestines of glial-depleted mice. Scale bar = 50 μm.
Figure 3 with 1 supplement
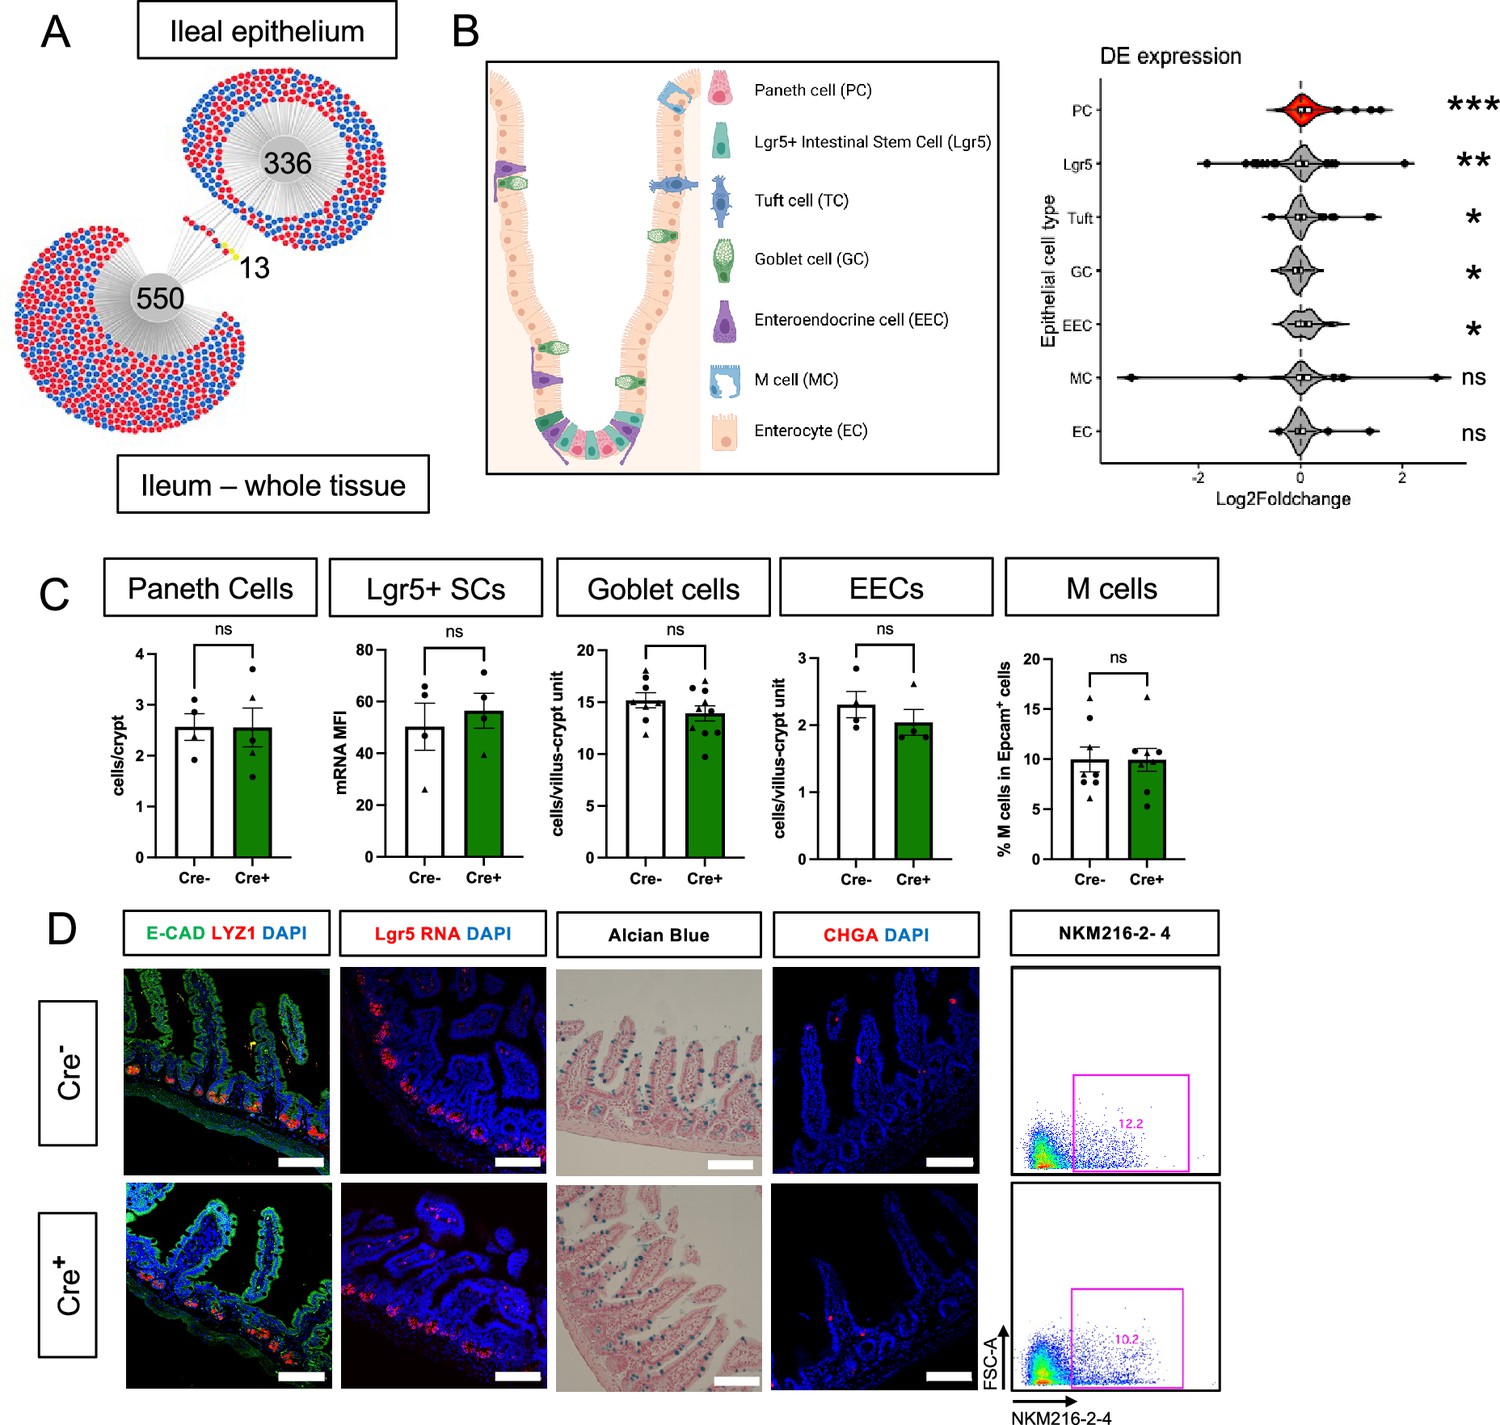
Glial ablation causes enrichment of specific epithelial cell type signatures without altering epithelial composition.
(A) DiVenn analysis illustrates genes that were consistently up- (red) or down-regulated (blue) in the ileal epithelia and full-thickness ileal segments of Cre+ mice compared to Cre- controls at 11dpt with p<0.05 threshold for significance. Yellow color marks genes with discordant direction of change between the ileal epithelia and full-thickness ileal segments. (B) Gene set enrichment analysis (GSEA) of gene expression data from Cre+ vs. Cre- ileal epithelium using single-cell gene signatures for epithelial cell types (schematic representation of component cell types on the left) derived from Haber et al., 2017, Supplementary file 1. The Paneth cell signature was most significantly enriched in the ileal epithelium of glia-depleted mice. Red color denotes the significant enrichment consistent across two independent GSEA. Thresholds for DE analysis: p-value <0.05. *** p<0.001, FDR <0.001, ** p<0.001, FDR <0.01, * p<0.05, FDR <0.05, ns – non-significant. Panel B created with BioRender.com. (C, D) Quantification of epithelial subtypes in the small intestines of Cre- and Cre+ mice with representative IHC images and flow cytometry plots below each graph showing the marker and approach used for cell identification. Each data point represents an individual mouse, with triangles representing males and circles representing females (Paneth cells: n=4 for Cre-, n=5 for Cre+; Lgr5+ SCs: n=4 for Cre- and Cre+; Goblet Cells: n=8 for Cre-, n=10 for Cre+; EECs: n=4 for Cre- and Cre+, M cells: n=8 for Cre- and Cre+). Error bars represent SEM. ns - not significant by unpaired parametric t-test. Scale bar = 100 μm. E-Cadherin (E-CAD) labels cell borders, LYZ1 marks Paneth cells, Lgr5 transcript expression marks intestinal stem cells (SCs), Alcian blue marks goblet cells, Chromogranin A (CHGA) marks enteroendocrine cells, and NKM216-2-4 identifies microfold (M) cells by flow cytometry. Cell nuclei are labeled with DAPI (blue) in the IHC panels.
Figure 3—figure supplement 1
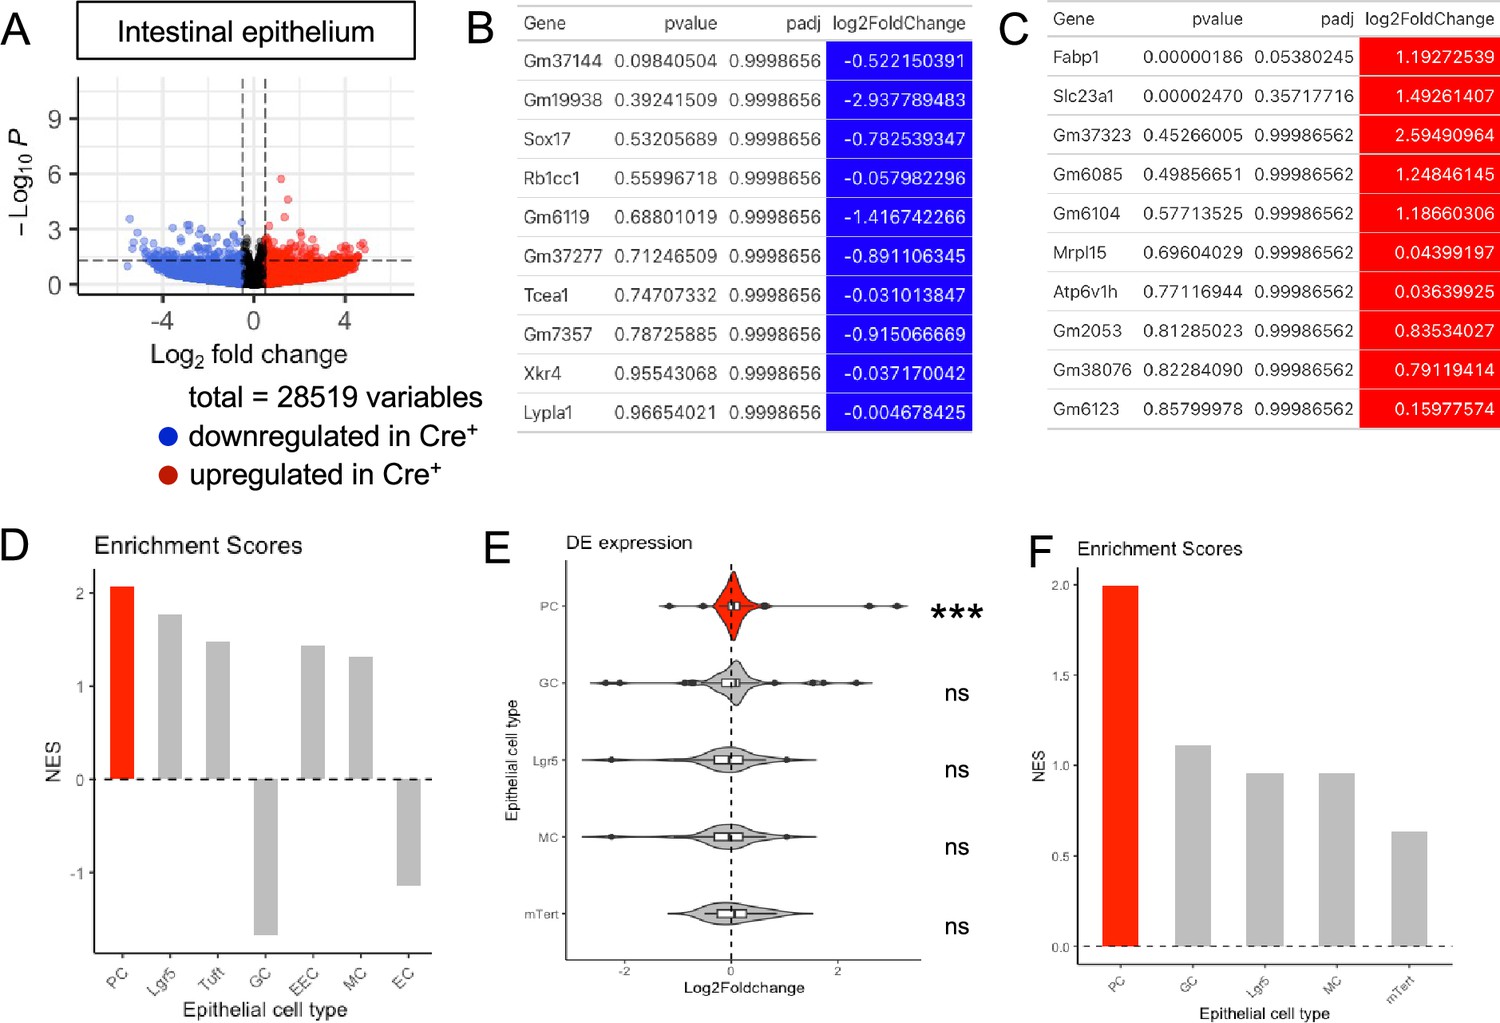
Transcriptional profiling of the ileal epithelium in glial-ablated mice reveals enrichment of Paneth cell signatures.
(A) Volcano plots showing differentially expressed genes in ileal epithelia of Cre- and Cre+ mice. Red and blue colors denote up- and down-regulated genes in Cre+ mice compared to Cre- mice with p-value <0.05, respectively. No genes reached statistical significance cutoff of padj <0.05. Differential analysis was conducted using DESeq2. (B, C) Top 10 down- (B) and upregulated (C) genes in the ileal epithelia of Cre+ mice compared to Cre- controls, ordered by p-value. Differential analysis was conducted using DESeq2. (D) Related to Main Figure 3B. Normalized enrichment scores from GSEA performed using cell-type-specific signatures derived from scRNAseq study of the ileal epithelium (Haber et al., 2017, Supplementary file 1). Red color denotes the significant enrichment consistent across two independent GSEAs. (E) GSEA gene expression data from Cre+ vs. Cre- ileal epithelium using cell signatures curated from transcriptional profiling of individual cell types purified by genetic reporter expression (see Supplementary file 2 for gene lists). The Paneth cell signature was most significantly enriched in the ileal epithelium of glia-depleted mice. Thresholds for DE analysis: p-value <0.05. *** p<0.001, FDR <0.001. (F) Related to (E), normalized enrichment scores from GSEA.
Figure 4 with 1 supplement
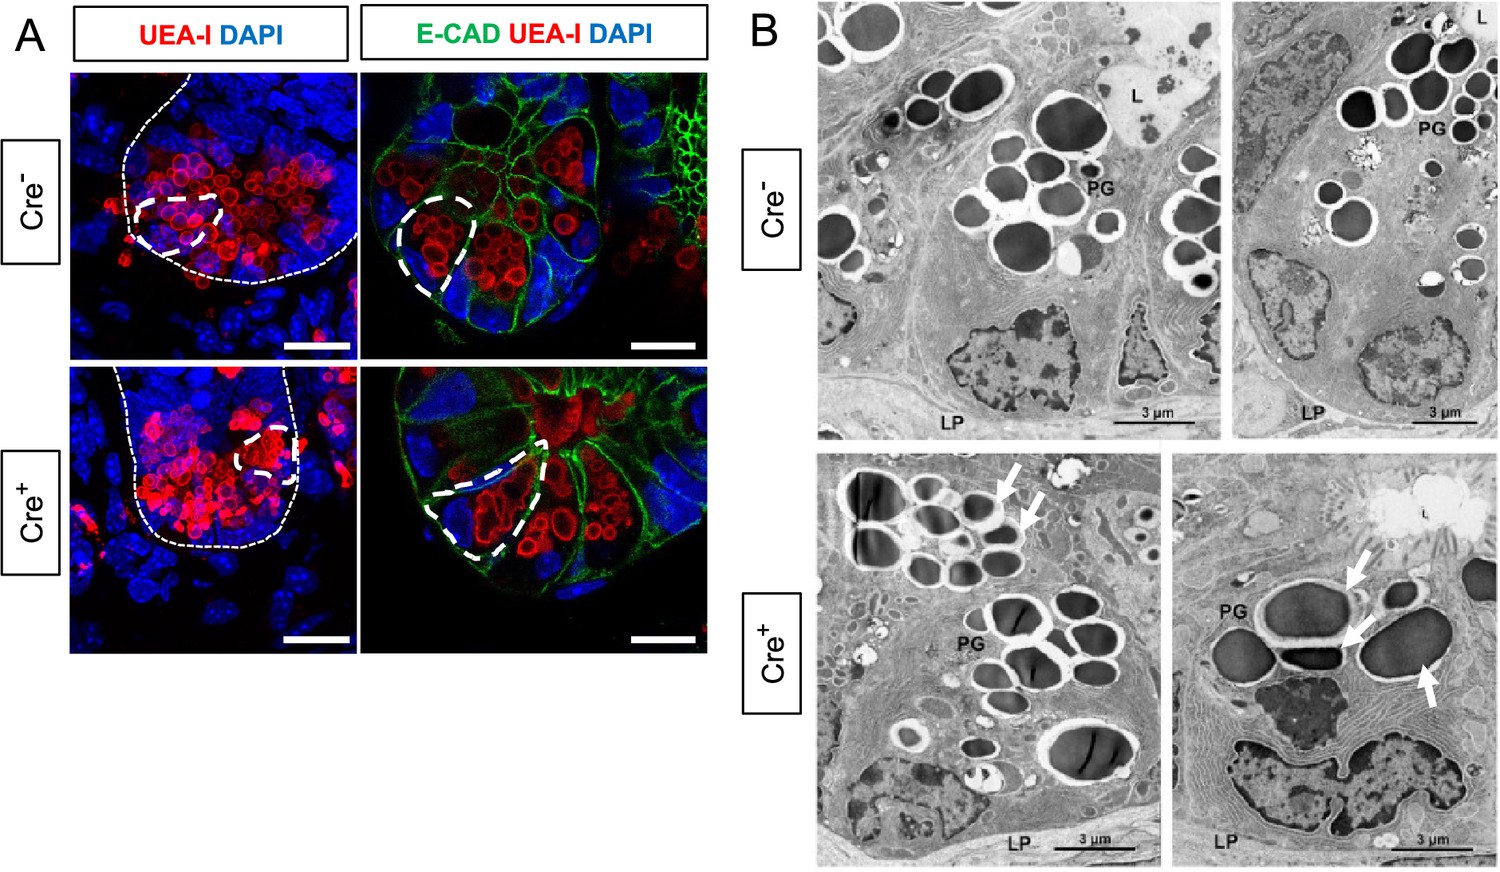
Glial depletion triggers morphological changes in Paneth cells.
(A) Representative images of UEA-I staining of Paneth cell granules in the small intestine of Cre- and Cre+ mice (observed in at least three mice per genotype). Scale bar = 10 μm. (B) Representative transmission electron microscopy images of Paneth cells (n=2 mice per genotype from independent cohorts). Paneth cells in Cre+ mice are globular, exhibit loss of polarity, and have heterogeneous granules (arrows indicate errant granules). L, Lumen of the intestinal crypts; LP, lamina propria; PG, Paneth granule. Scale bar = 3 μm.
Figure 4—figure supplement 1
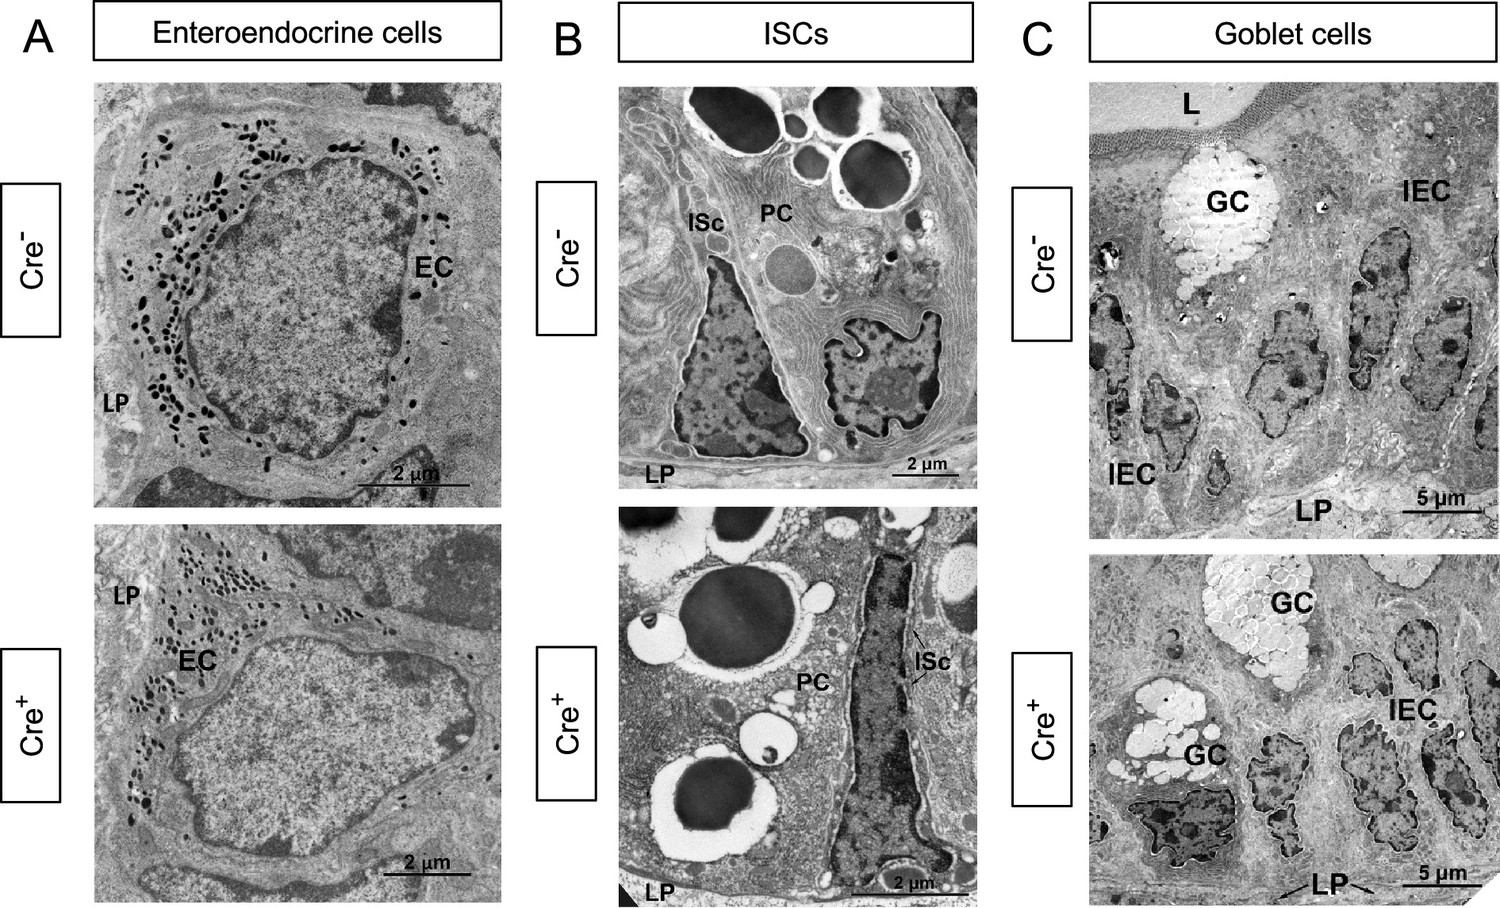
Glial depletion does not affect the ultrastructure of enteroendocrine cells, crypt base stem cells, or goblet cells.
(A-C) Transmission electron microscopy of enteroendocrine cells (A; EC), crypt base intestinal stem cells (B; ISc), and goblet cells (C; GC) reveal no changes in the morphology of these cells in 9dpt Cre+ mice compared to Cre- littermate controls studied in parallel. Representative images are from n=2 mice per genotype from independent cohorts. IEC, Intestinal Epithelial Cell; LP, Lamina propria; L, Lumen; PC, Paneth cell. Scale bar = (A, B) 2 μm, (C) 5 μm.
Figure 5 with 2 supplements
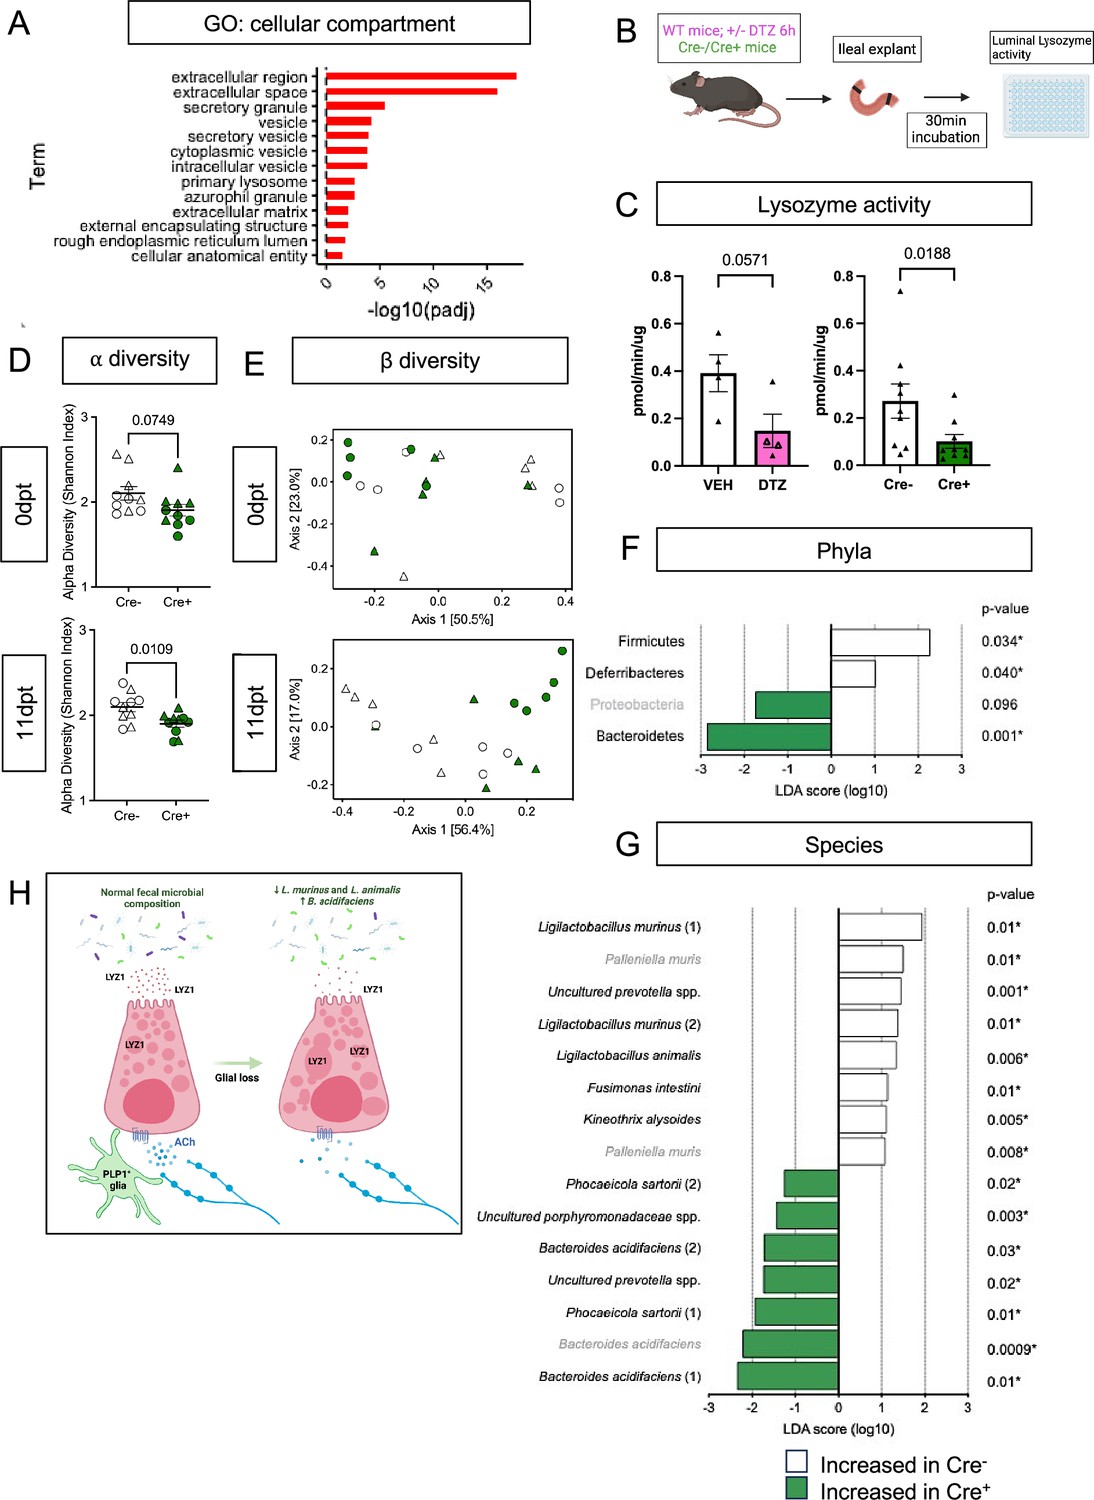
Enteric glial depletion impairs Paneth cell secretion and alters the composition of the gut microbiome.
(A) Pathway analysis using GO term for cellular compartment shows significant enrichment of Paneth cell genes in glial-depleted mice. (B) Schematic of explant assay used to analyze Paneth cell secretion. Small intestinal explants were acutely isolated, ligated at both ends, and incubated in oxygenated media at 37 °C for 30 min. Luminal contents were then extracted and analyzed for lysozyme activity by fluorometric assay. Panel B created with BioRender.com. (C) Luminal lysozyme activity in ileal explants from Cre+ and Cre- mice. Lysozyme activity was lower in ileal explants from Cre+ mice compared to Cre- littermate controls (p=0.0188), mirroring the effects of Paneth cell disruption by dithizone (DTZ) in wildtype mice (p=0.0571). Each data point represents one mouse (n=4 per treatment, n=9 mice per genotype). Open triangles in DTZ group represent subset of explants incubated with 10 µM carbachol to stimulate secretion. Error bars represent SEM. ns – non-significant, p values shown are from Mann-Whitney U test. (D-G) Microbiome analysis by 16S rDNA sequencing of fecal pellets from Cre- and Cre+ mice at 0dpt (baseline, pre-induction) and 11dpt. Graphs depict ⍺-diversity (D) and β-diversity (E) where each data point represent one mouse, with triangles indicating males and circles indicating females (n=10 for Cre- and Cre+). Error bars represent SEM. p-values reflect unpaired parametric t-. test. Analysis of phylum- (F) and species- (G) specific differences at 11dpt using LEfSe (p<0.1, LDA >1, FDR-adjusted significance values provided). Any phyla or species detected as differentially abundant at baseline are demarcated in grey. (H) Working model of glial regulation of Paneth cell function. In the normal intestine, Paneth cells are loaded with secretory granules containing LYZ1 that are released into the gut lumen in response to acetylcholine (ACh) and other signals to regulate microbial composition. Upon glial depletion, Paneth cell secretion is disrupted leading to dysmorphic granules, diminished LYZ1 secretion, and altered fecal microbial composition. This occurs without a change in Paneth cell number, loss of muscarinic acetylcholine receptor expression, or denervation of the cholinergic fibers that normally surround epithelial crypts. Panel H created with BioRender.com.
Figure 5—figure supplement 1

Depletion of enteric glia does not alter epithelial crypt innervation.
(A) Heatmap of neurotransmitter receptor gene expression following GSEA of publicly available RNAseq data from mouse Paneth cells isolated by cell sorting (Yu et al., 2018). Neurotransmitter receptors gene set was derived from Qiagen Ingenuity Pathway Analysis. A subset of genes encoding receptors for acetylcholine, specifically Chrm3, Chrnb4, and Chrm1, exhibit the strongest expression in Paneth cells. (B) Representative images of immunohistochemistry for mAChR3 (n=2) and mAChR1 (n=1) in the human small intestine show high expression of mAChR3 (encoded by CHRM3) in Paneth cells (Protein Atlas, http://www.proteinatlas.org/). (C) Representative images of cross-sections of ileum from explants isolated from Cre- and Cre+ mice, incubated with the cholinergic agonist carbachol (10 µM) or vehicle for 30 min, and stained with UEA-I (red) to label Paneth cell granules (n=3 mice per condition). Paneth cells in both groups of mice showed loss of UEA-I+ granules upon cholinergic stimulation. Scale bar = 20 μm. (D) Lysozyme activity in luminal contents of ileal explants from Cre- and Cre+ mice following incubation with carbachol (10 µM) for 30 min. No difference between explants from Cre- and Cre+ mice was detected. Each data point represents one mouse (n=7–10 mice per genotype). Error bars represent SEM. ns – no significant difference in means by Mann-Whitney U test. (E) Representative IHC images of intestinal epithelial crypts from ileal segments of Cre- and Cre+ mice immunostained for ECAD (magenta) to label epithelial cell borders and TUBB3 (green) to label nerve fibers. Individual crypts are outlined by a dashed line. Quantification of crypt-proximal TUBB3+ neuronal fibers reveals no difference between Cre- and Cre+ mice (n = 4 mice per genotype). Error bars represent SEM. ns - no significant difference in means by unpaired parametric t-test. Scale bar = 10 μm. (F) Representative IHC images for VAChT (red) and TUBB3 (magenta) in the ileum of an adult ChAT-GFP mouse. The majority of TUBB3 immunoreactivity around epithelial crypts colocalizes with GFP (green), indicating that cholinergic fibers (green) comprise most of the crypt-innervating fibers. Scale bar = 50 μm. (G) Representative IHC images for VAChT (red) labeling cholinergic fibers in the ileum of an adult PLP1-eGFP mouse in which Plp1-expressing enteric glia are labeled with GFP (green). GFP+ glia are tightly associated with crypt-innervating cholinergic fibers. Scale bar = 10 μm. (H) Representative IHC images for TUBB3 (green) and VAChT (red) in the ileums of Cre- and Cre+ mice. Individual crypts are magnified in the right panels and outlined by dashed lines. Crypt innervation by fibers labeled with either marker was no different between control and glial-ablated mice. Scale bar = 50 μm (left panels) and 10 μm (right panels). Images in F-H are representative of observations made in three mice per genotype.
Figure 5—figure supplement 2
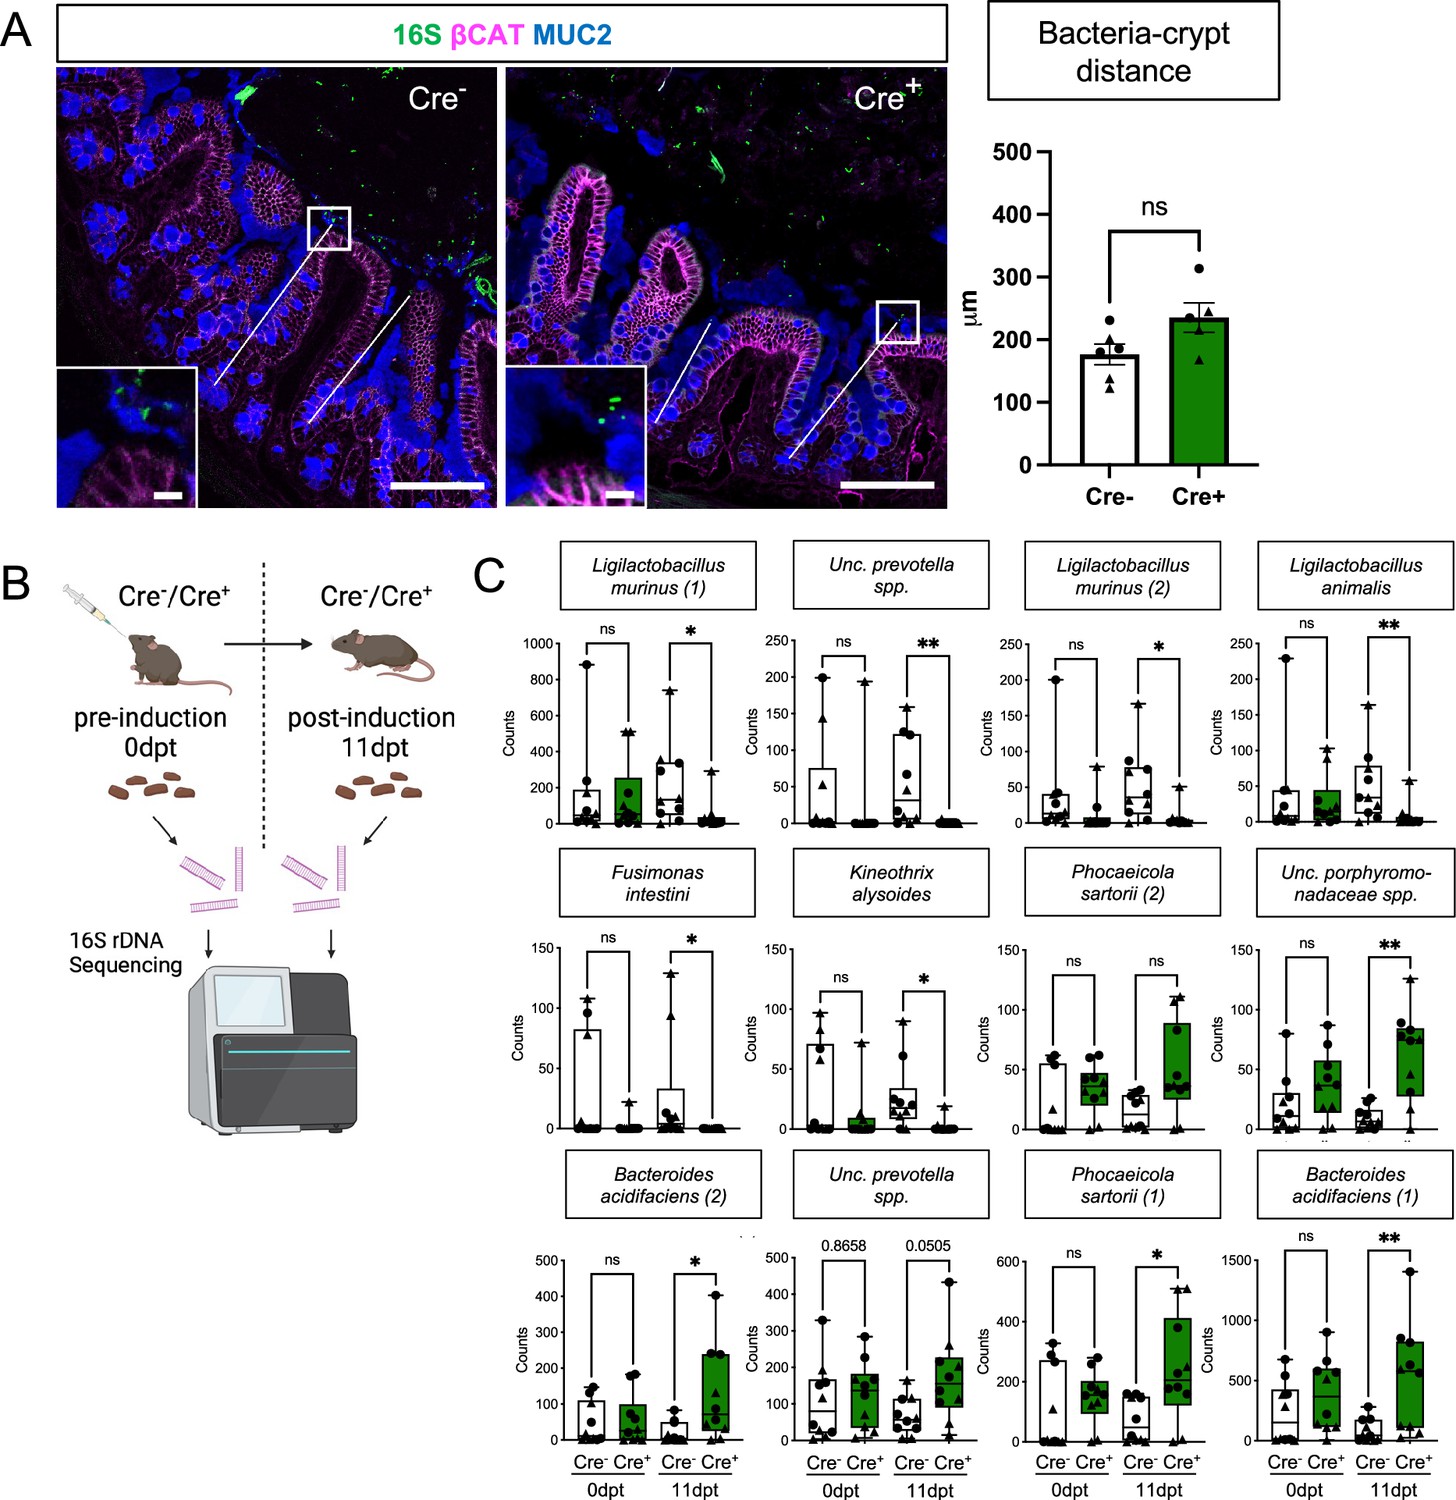
Glial depletion alters gut microbial composition but not the spatial relationship between the host and the bacteria.
(A) Representative images of 16S rRNA bacterial fluorescent in situ hybridization (green) with IHC for MUC2 (blue) and beta-catenin (magenta) in Cre+ and Cre- mice to visualize bacteria, mucus, and epithelial cell borders, respectively. The distance of the closest bacterial signal to the center of >50 open crypts/mouse was measured and average values per mouse are shown in the graph. Each data point represents one mouse, with triangles indicating males and circles indicating females (n=6 for Cre- and n=5 for Cre+). Error bars represent SEM. ns – non-significant by unpaired t-test. Scale bar = 100 μm (large panels) and 10 μm (insets). (B) Schematic of experimental design for microbiome analysis. Fecal pellets from Cre- and Cre+ mice pre- (0dpt) and post-(11dpt) induction were analyzed with 16 S rDNA sequencing. Panel B created with BioRender.com. (C) Four-way analysis of species identified as differentially abundant between Cre- and Cre+ mice at 11dpt but not 0dpt (related to Main Figure 5G). Each data point represents one mouse, with triangles indicating males and circles indicating females (n=10 for Cre- and Cre+). Whiskers represent min. and max. values. *p<0.05; **p<0.01; ns – non-significant by Dunn’s multiple comparison test, following Kruskal-Wallis test. Exact p values are included for Uncultured prevotella spp.
Author response image 1

(A) Immunohistochemical staining of a small intestinal cross-section from a Vil1CreRosa26tdTomato/+ Plp1eGFP transgenic mouse in which enteric glia are labeled with green fluorescent protein (GFP) and intestinal epithelial cells are labeled with tdTomato. (B) Mucosal glia closely associate with epithelial cells in intestinal crypts. Scale bar – 20 µm.
Author response image 2

Representative IHC images showing LYZ1 staining optimization.
Ileal tissues from 8-10-week-old mice were prepared as either 'swiss-rolls' (A-D) or tubes (E, F) and fixed using different protocols: 10% neutral buffered formalin (NBF) from Epredia (#5710-LP) (A-B, E), 10% NBF from G-Biosciences (#786-1057) (C, D), or 4% paraformaldehyde (PFA) from VWR (#100503-917) (F). Fixations were conducted at room temperature (A, C) or at 4°C (B, D-F). Diffuse cytoplasmic LYZ1 staining is observed within Paneth cells, regardless of conditions of tissue preparation.
Tables
Key resources table
| Reagent type (species) or resource | Designation | Source or reference | Identifiers | Additional information |
|---|---|---|---|---|
| Strain, strain background (Mus Muscularis) | Plp1-eGFP, FVB/NJ, male and female | JAX | Cat: 033357 RRID:IMSR_JAX:033357 | |
| Strain, strain background (M. Muscularis) | PLP1CreER, FVB/NJ, male and female | JAX | Cat: 005975 RRID:IMSR_JAX:005975 | |
| Strain, strain background (M. Muscularis) | Rosa26DTA/DTA, C57/BL6, male and female | JAX | Cat: 009669 RRID:IMSR_JAX:009669 | |
| Strain, strain background (M. Muscularis) | ChAT-eGFP, C57/BL6, male and female | JAX | Cat: 007902 RRID:IMSR_JAX:007902 | |
| Chemical compound, drug | Paraformaldehyde | ThermoFisher Scientific | Cat: 28908 | Used at 4% diluted in 1 x phosphate buffered saline |
| Chemical compound, drug | UEA-I | Vector Labs | Cat: DL-1067–1 | |
| Chemical compound, drug | Vectashield | Vector Labs | Cat: H-1200 | |
| Commercial assay or kit | VECTASTAIN Elite ABC-HRP Kit PK | Vector Labs | Cat: PK-6100 | |
| Commercial assay or kit | ImmPACT DAB Substrate Kit, Peroxidase | Vector Labs | Cat: SK-4105 | |
| Antibody | Rabbit polyclonal anti CHGA | Abcam | Cat: ab-15160 RRID:AB_301704 | 1:1000 |
| Antibody | Goat polyclonal anti b-Catenin | R&D Systems | Cat: AF1329-SP RRID:AB_354736 | 1:200 |
| Antibody | Goat polyclonal anti DEFA5 | Gift from Andre Ouellette | N/A | 1:1000 |
| Antibody | Rat monoclonal anti E-cadherin | Life Tech | Cat: 13–1900 RRID:AB_2533005 | 1:400 |
| Antibody | Rabbit polyclonal anti GFAP | Sigma-Aldrich | Cat: G9269 RRID:AB_477035 | 1:500 |
| Antibody | Rabbit polyclonal anti LYZ1 | DAKO | Cat: A0099 RRID:AB_2341230 | 1:500 |
| Antibody | Rabbit polyclonal anti MUC2 | Santa Cruz Biotechnology | Cat: sc-15334 RRID:AB_2146667 | 1:200 |
| Antibody | Rat monoclonal anti PLP1/DM20 | Gift from Wendy Macklin | N/A | 1:500 |
| Antibody | Rabbit polyclonal anti S100β | DAKO | Cat: Z0311 RRID:AB_10013383 | undiluted or 1:500 |
| Antibody | Mouse monoclonal anti TUBB3 | Biolegend | Cat: 801201 RRID:AB_2313773 | 1:500 |
| Antibody | Rabbit polyclonal anti VACHT | Synaptic systems | Cat: 139 103 RRID:AB_887864 | 1:500 |
| Antibody | Rat monoclonal CD16/32 (FcR-blocking) | Biolegend | Cat: 101301, clone 93 RRID:AB_312800 | 1:50 |
| Antibody | Rat monoclonal NKM 16-2-4 | Miltenyi Biotec | Cat: 130-102-150 RRID:AB_2660295 | 1:10 |
| Antibody | Rat monoclonal CD326 (Ep-CAM) | Biolegend | Cat: 118213, clone G8.8 RRID:AB_1134105 | 1:50 |
| Chemical compound, drug | TRIzol | Thermofisher | Cat: 15596026 | |
| Commercial assay or kit | RNeasy Kit | Qiagen | Cat: 74004 | |
| Other | DAPI stain | Vector Laboratories | Cat: H-1200–10 | |
| Software, algorithm | R studio | R studio | RRID:SCR_000432 | |
| Software, algorithm | Deseq2 | Deseq2 | RRID:SCR_015687 | |
| Software, algorithm | DiVenn 2.0 | DiVenn 2.0, Sun et al., 2019 | PMID:31130993 | |
| Software, algorithm | STAR | STAR | RRID:SCR_004463 | |
| Software, algorithm | featurecounts | featurecounts | RRID:SCR_012919 | |
| Software, algorithm | GSEApy | GSEApy | RRID:SCR_025803 | |
| Commercial assay or kit | iScript cDNA Synthesis Kit | BioRad | Cat: 1708890 | |
| Commercial assay or kit | SYBR Select Master Mix | Thermofisher | Cat: 4472908 | |
| Sequence-based reagent | Epcam_F | PMID:25479966 | PCR primer; TCGCAGGTCTTCATCTTCCC | |
| Sequence-based reagent | Epcam_R | PMID:25479966 | PCR primer; GGCTGAGATAAAGGAGATGGGT | |
| Sequence-based reagent | Lyz1_F | PMID:28336548 | PCR primer; ATGGCTACCGTGGTGTCAAG | |
| Sequence-based reagent | Lyz1_R | PMID:28336548 | PCR primer; CGGTCTCCACGGTTGTAGTT | |
| Software, algorithm | GraphPad Prism | GraphPad Prism | RRID:SCR_002798 | |
| software, algorithm | ImageJ | FIJI | RRID:SCR_002285 | |
| commercial assay or kit | RNAscope V2 Assay | ACDBio | Cat: 323100 | |
| sequence-based reagent | Lgr5-C1 | ACDBio | Cat: 312171 | |
| Chemical compound, drug | Opal dye 570 | Akoya Sciences | Cat: FP1488001KT | |
| Chemical compound, drug | ribonucleoside vanadyl complexes (RVC) | New England BioLabs | Cat: S1402S | |
| Chemical compound, drug | glutaraldehyde | Electron Microscopy Sciences | Cat: 111-30-8 | Used at 2% |
| Chemical compound, drug | formaldehyde | Electron Microscopy Sciences | Cat: 15700 | Used at 2.5% |
| Chemical compound, drug | cacodylate buffer | Millipore Sigma | Cat: 97068 | |
| Chemical compound, drug | uranyl acetate | Electron Microscopy Sciences | Cat: 541-09-3 | Used at 2% |
| Chemical compound, drug | lead citrate | Sigma-Aldrich | Cat: 6107-83-1 | |
| Chemical compound, drug | Li2CO3 | Sigma-Aldrich | Cat: 255823 | Used at 135 mM |
| Chemical compound, drug | Diphenylterazine | Sigma-Aldrich | Cat: D5130 | Used at 100 mg/kg |
| Chemical compound, drug | Carbachol | Thermo Fisher Scientific | Cat: L06674.03 | Used at 10 µM |
| Commercial assay or kit | Lysozyme Activity Assay Kit | Abcam | Cat: ab211113 | |
| Commercial assay or kit | ZymoBIOMICS – 96 DNA Kit | Zymo Research | Cat: D4309 | |
| Commercial assay or kit | DNA Clean and Concentrator TM – 5 Kit | Zymo Research | Cat: D4014 | |
| Commercial assay or kit | NEBNext Library Quant Kit | New England BioLabs | Cat: E7630 | |
| Sequence-based reagent | EUB338 | Millipore Sigma 16 s bacterial RNA probe | GCTGCCTCCCGTAGGAGT | |
| Sequence-based reagent | Nonsense control | Millipore Sigma 16 s bacterial RNA control probe | CGACGGAGGGCATCCTCA |
Additional files
-
MDAR checklist
- https://cdn.elifesciences.org/articles/97144/elife-97144-mdarchecklist1-v1.pdf
-
Supplementary file 1
Cell type signatures derived from sc-RNAseq of intestinal epithelial cells used in Figure 3B and Figure 3—figure supplement 1D.
- https://cdn.elifesciences.org/articles/97144/elife-97144-supp1-v1.xlsx
-
Supplementary file 2
Cell type signatures derived from bulk-RNAseq profiling of individual cell types (purified by flow sorting) used in Figure 3—figure supplement 1E–F.
- https://cdn.elifesciences.org/articles/97144/elife-97144-supp2-v1.xlsx
-
Source data 1
Source data containing raw values and statistical analyses used for image quantification and qPCR analysis.
- https://cdn.elifesciences.org/articles/97144/elife-97144-data1-v1.xlsx
Download links
A two-part list of links to download the article, or parts of the article, in various formats.
Downloads (link to download the article as PDF)
Open citations (links to open the citations from this article in various online reference manager services)
Cite this article (links to download the citations from this article in formats compatible with various reference manager tools)
Enteric glia regulate Paneth cell secretion and intestinal microbial ecology
eLife 13:RP97144.
https://doi.org/10.7554/eLife.97144.3


