Reversing protonation of weakly basic drugs greatly enhances intracellular diffusion and decreases lysosomal sequestration
- Department of Biomolecular Sciences, Weizmann Institute of Science, Israel
- Institute of Organic Chemistry and Biochemistry of the Czech Academy of Sciences, Czech Republic
Figures
Figure 1
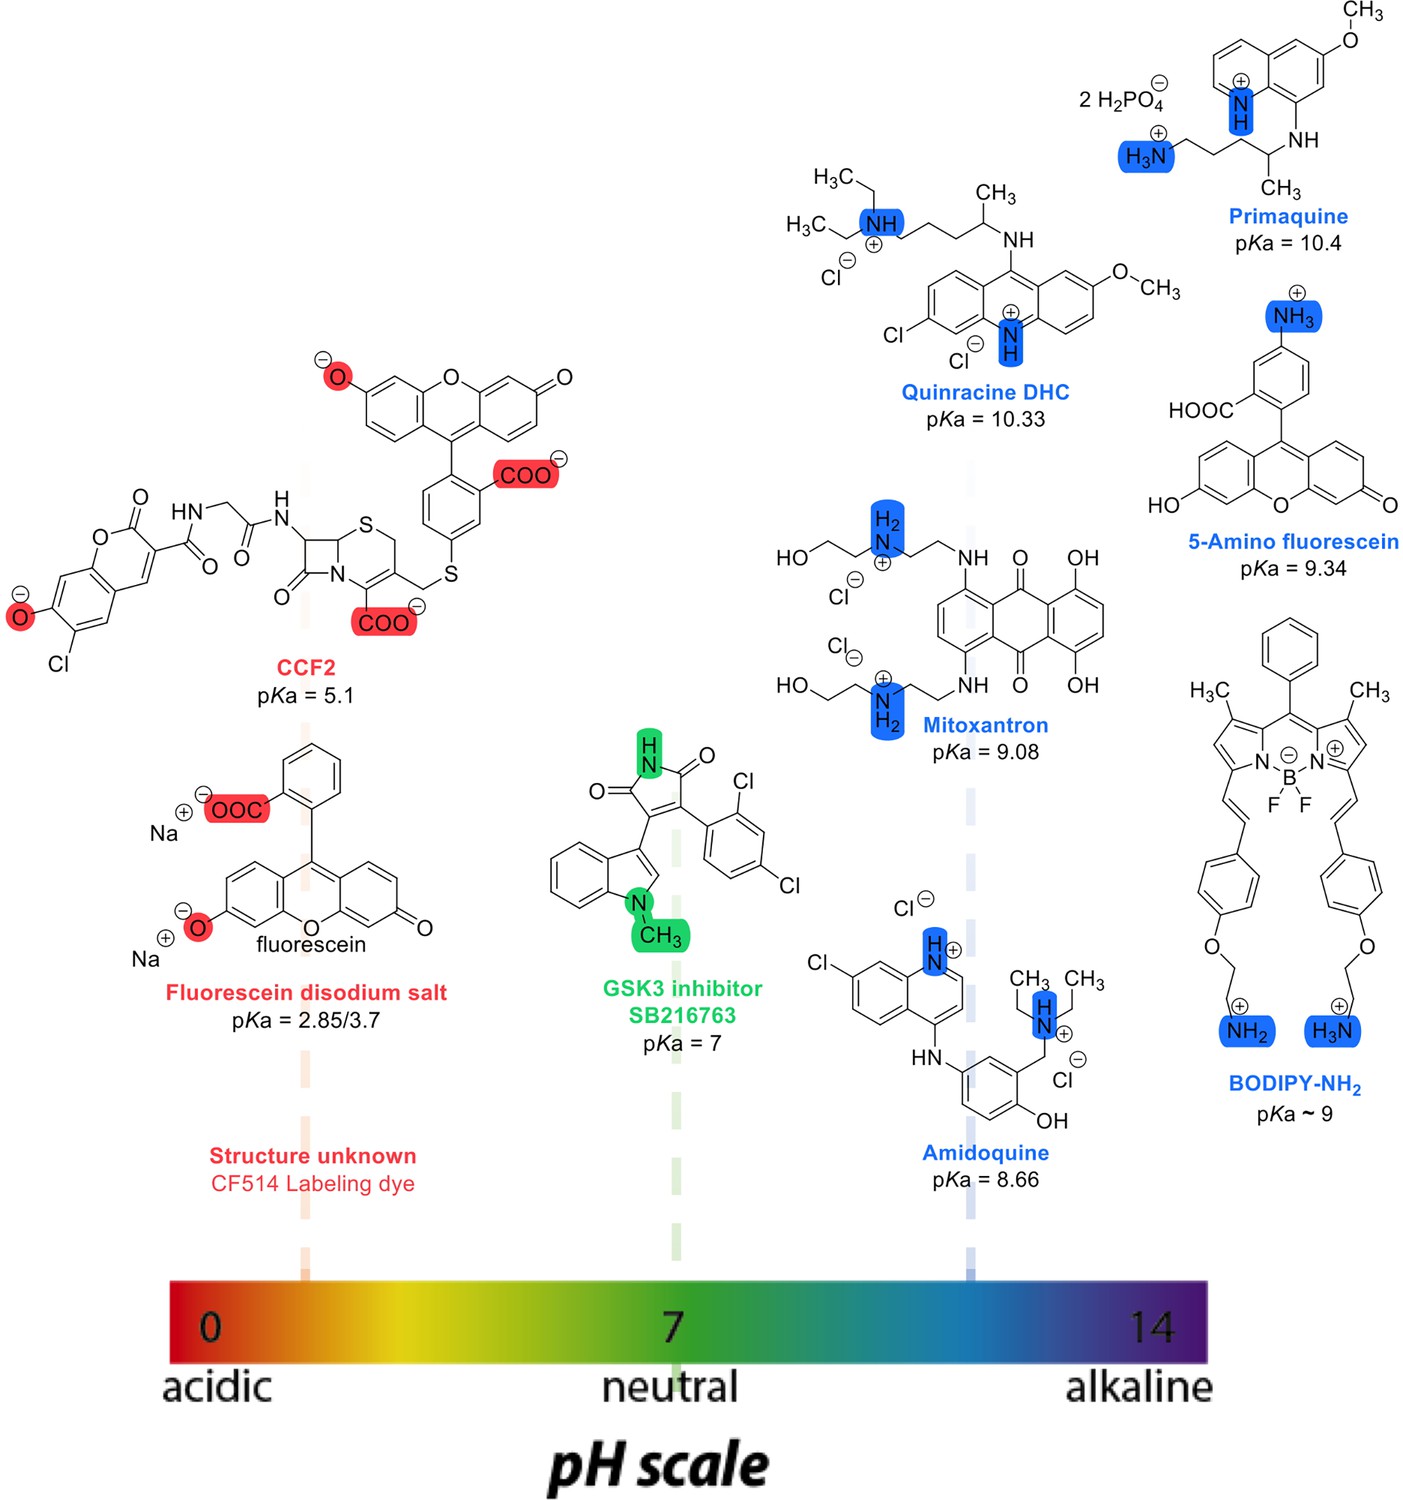
Chemical structures and pKa values (prediction from ChemAxon software) of the small molecules and drugs used in this study.
Figure 2
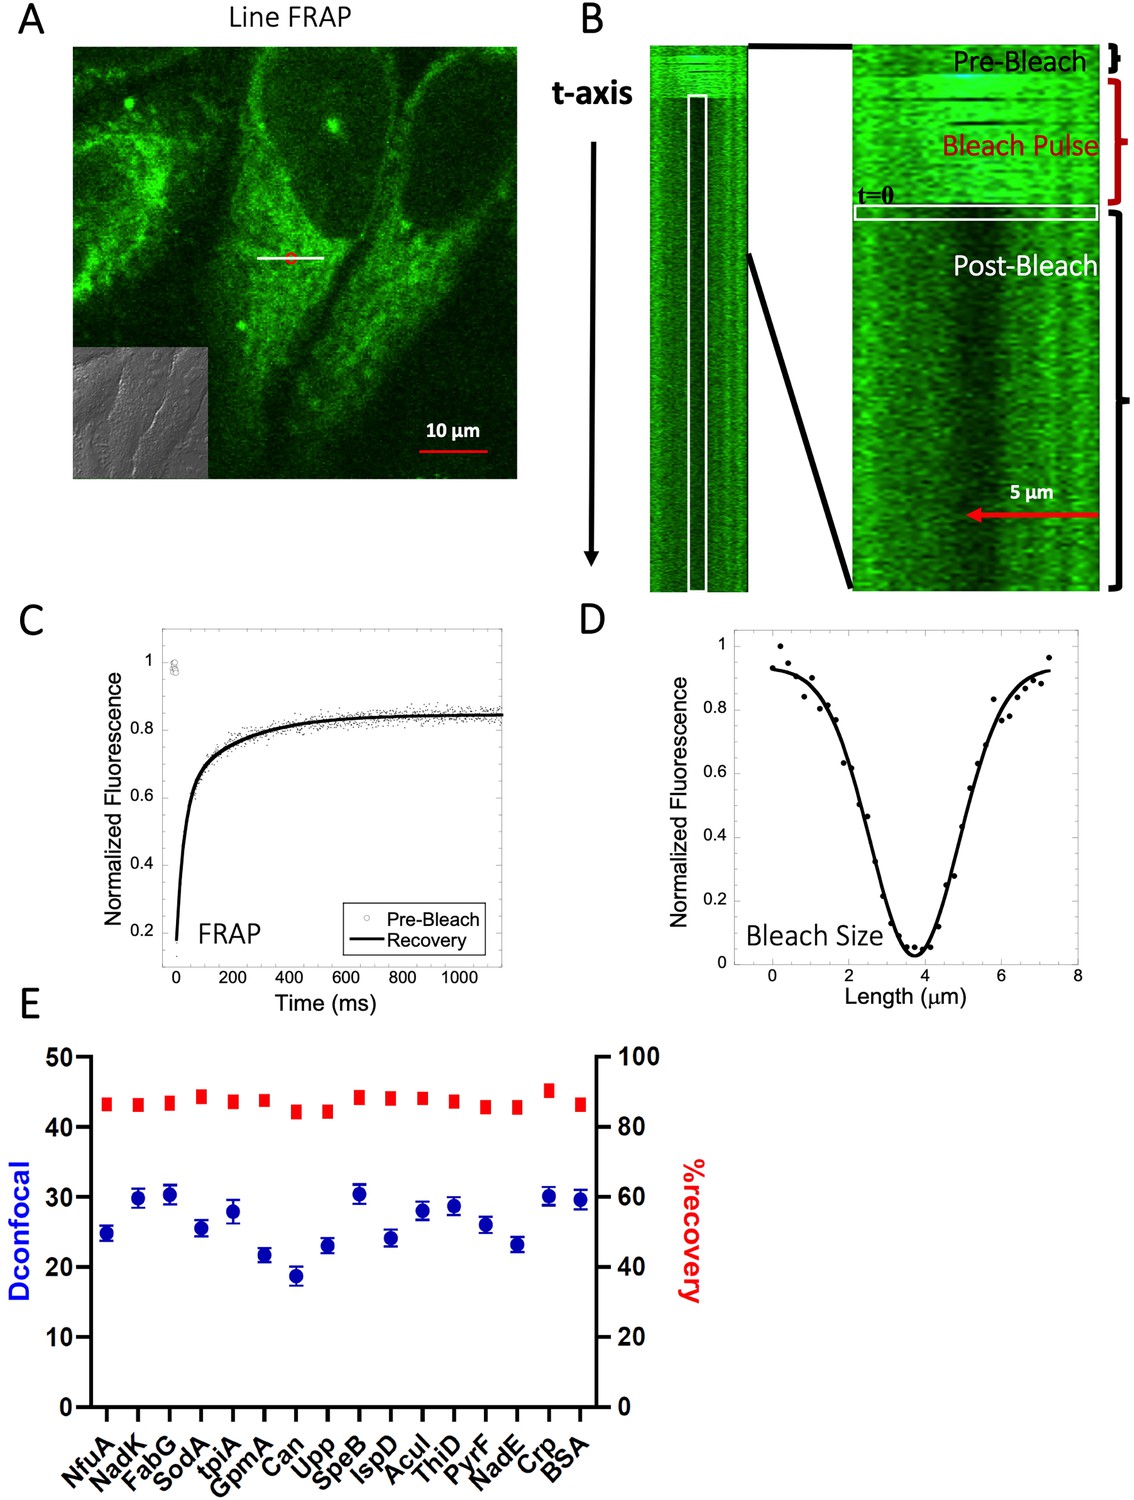
Schematic representation of Line-FRAP and diffusion coefficients of proteins in the HeLa cells.
(A) Line-FRAP performed in a fluorescent drug labeled HeLa cell. The white line represents the scanning line; The red circular area denotes the bleaching area. (B) A single scanning line as a function of time (in the vertical direction) including the bleach is shown. The white vertical rectangular region of interest (ROI), which was used for analysis. A close-up view of the Line-FRAP profile, is also shown where the horizontal rectangular area (white colored marks ROI) denotes the fluorescence intensity as a function of length across the scanning line. (C) Average of 30 FRAP recovery curves as a function of time (N=30; Correlation coefficient of exponential fit: R=0.98) and (D) Averaged bleach size profile with gaussian fits (N=30; R=0.99) are shown. (E) Comparison of diffusion coefficients (Dconfocal in blue circles) and percentage of recoveries (in red squares) of bacterial proteins and BSA as measured in HeLa cell cytoplasm are shown. Error bars represent SE calculated from fitting the FRAP progression curves, which are averaged over at least 30 independent measurements.
-
Figure 2—source data 1
Original data file of Figure 2 plots.
- https://cdn.elifesciences.org/articles/97255/elife-97255-fig2-data1-v1.xlsx
Figure 3 with 3 supplements
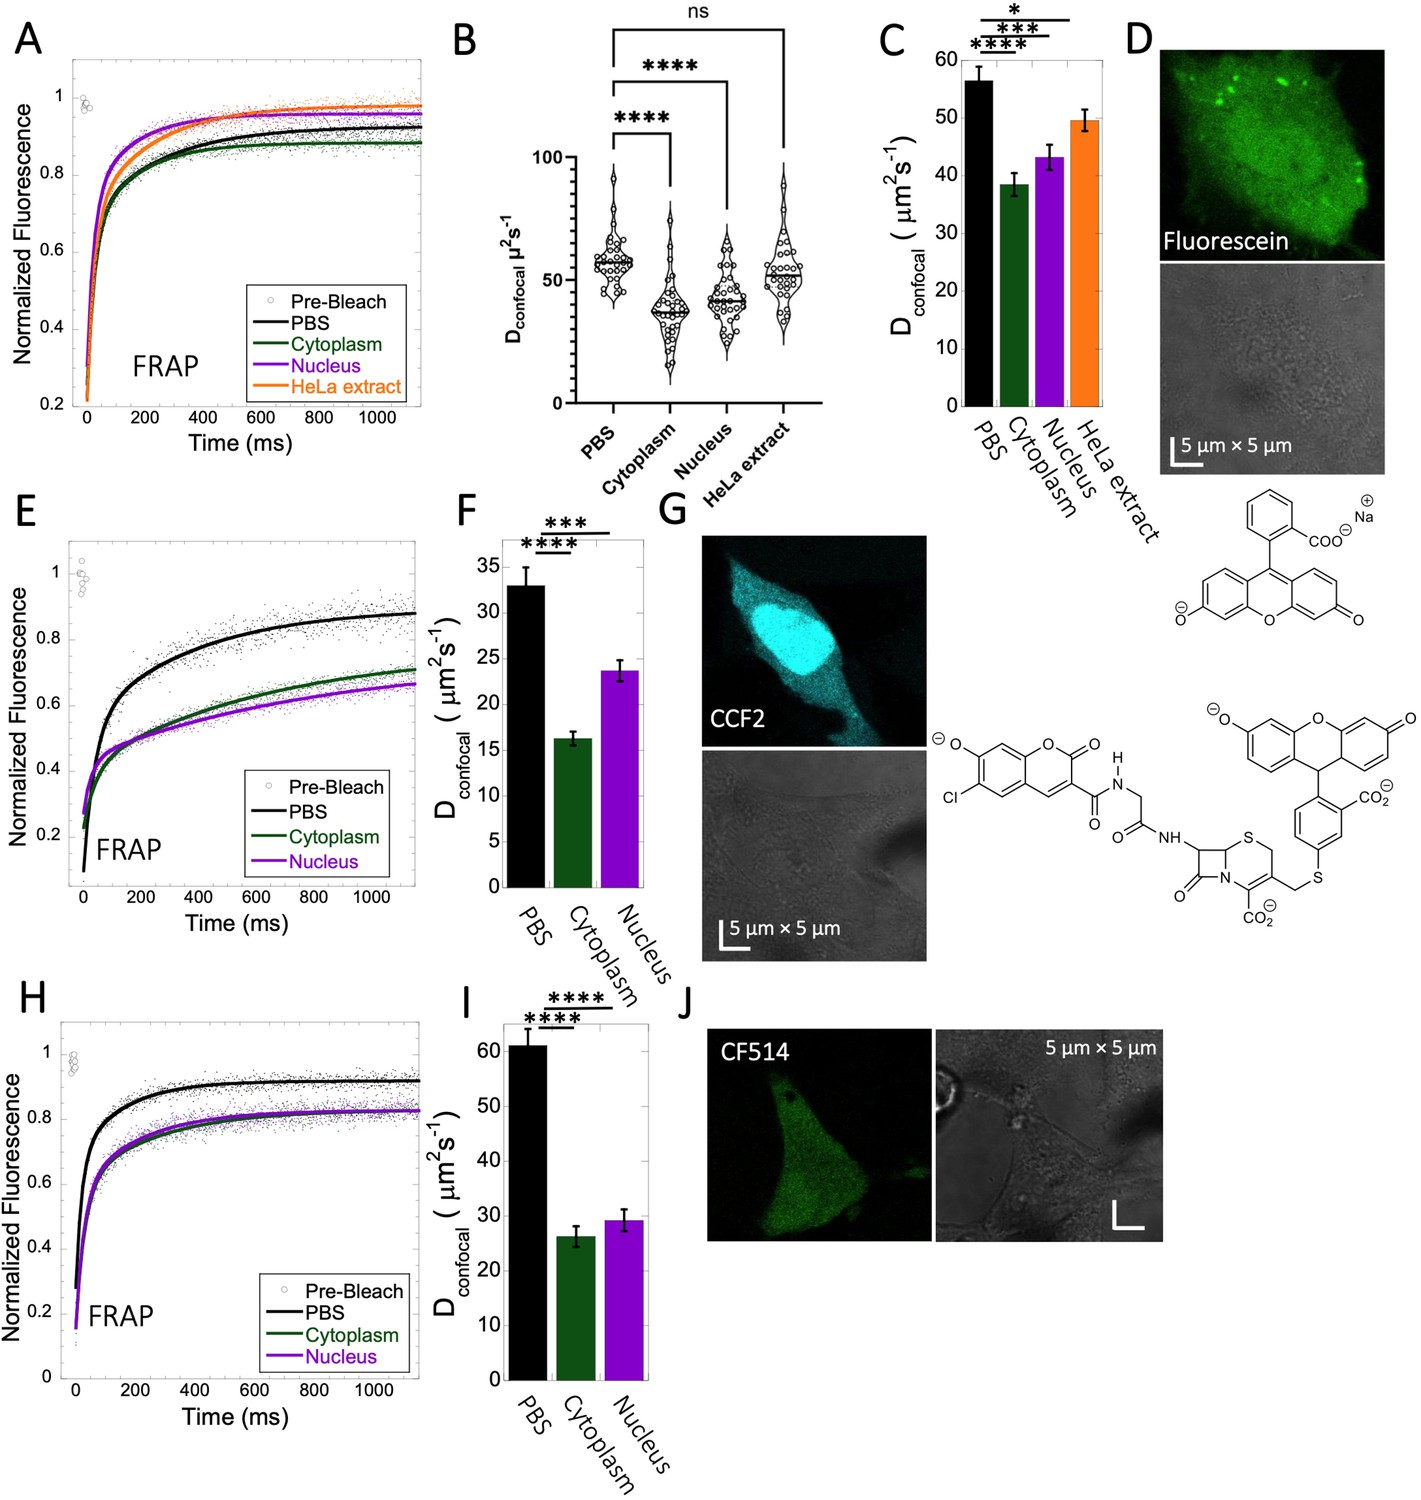
Fluorescein, CCF2 and CF514 diffusion in PBS and inside HeLa cells.
Comparative merged FRAP profiles (N=30; R=0.99 for each of the fits) in PBS and inside HeLa cells with exponential fits are shown for (A) Fluorescein, (E) CCF2 and (H) CF514. Comparative Dconfocal values for (C) Fluorescein (F) CCF2 and (I) CF514 are also shown. (B) Dconfocal values as calculated from individual FRAP curves for Fluorescein (see also Figure 3—figure supplement 2). (C) Dconfocal values as calculated from the merged FRAP curves in panel A is shown (D) HeLa cells after Micro-injection of Fluorescein; (G) CCF2; and (J) for CF514. Error bars represent SE calculated from fitting the FRAP progression curves of 30 merged independent measurements. Statistical significance calculations are detailed in the Materials and methods section.
-
Figure 3—source data 1
Original data file of Figure 3 plots.
- https://cdn.elifesciences.org/articles/97255/elife-97255-fig3-data1-v1.xlsx
Figure 3—figure supplement 1
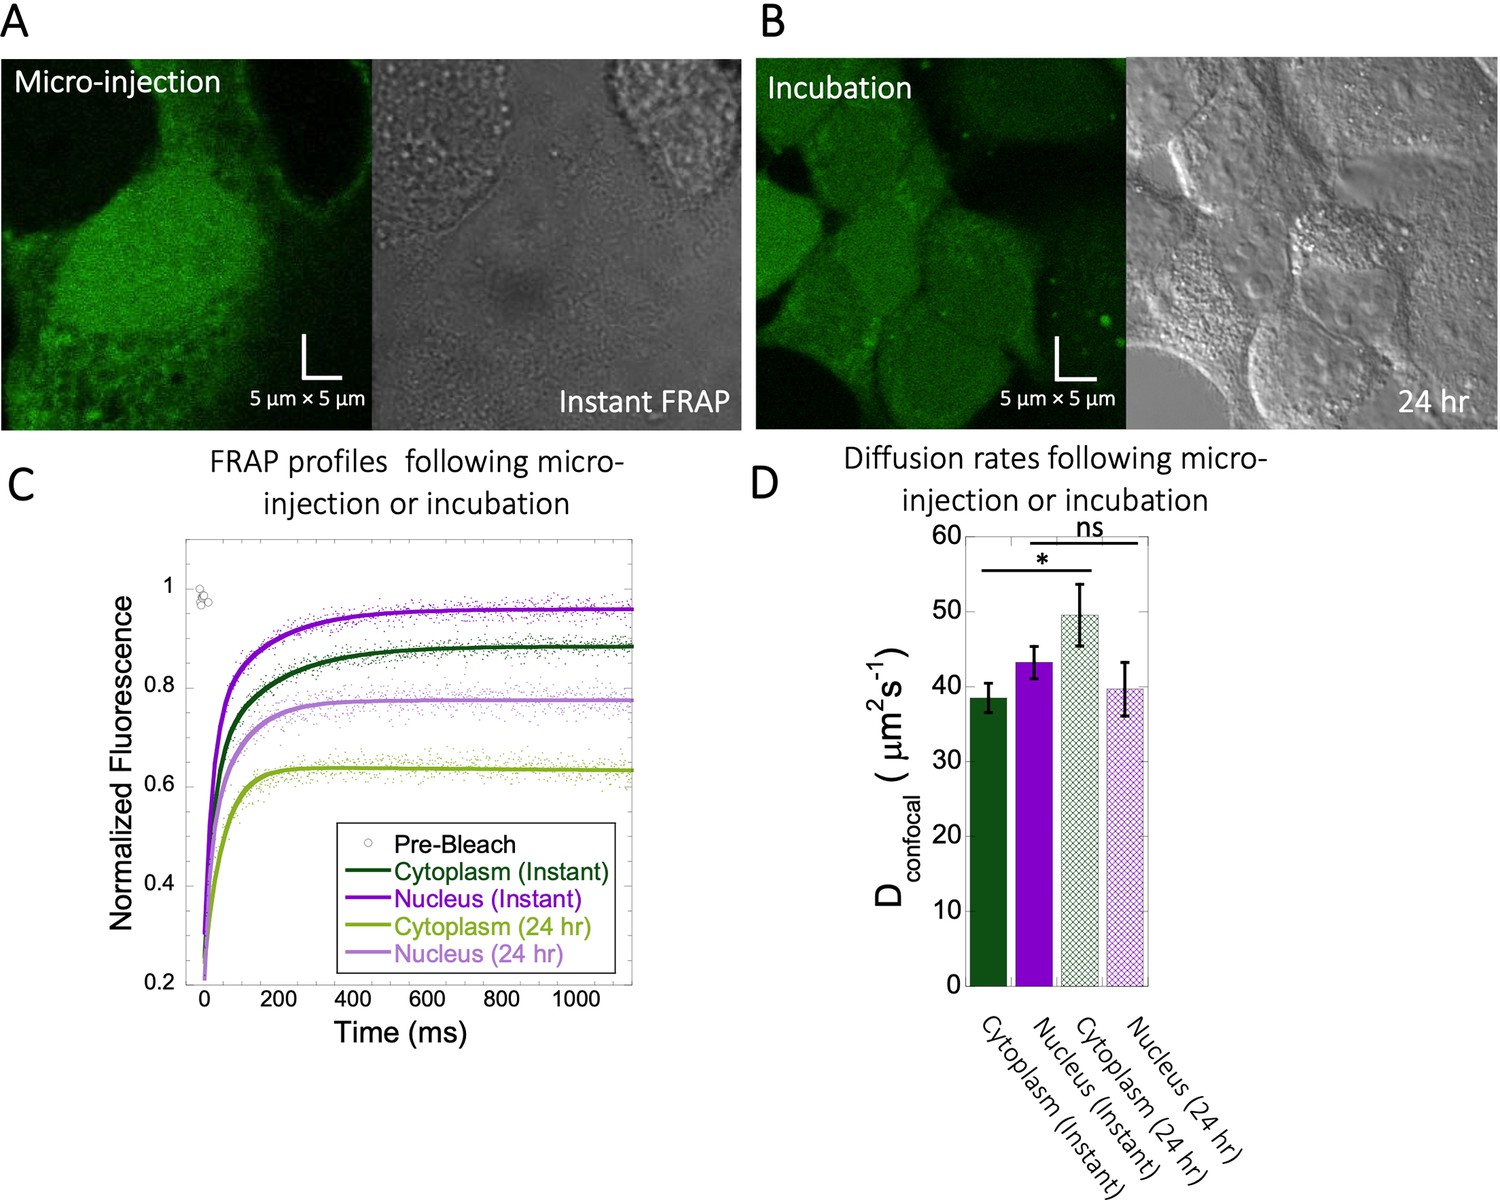
FRAP measurements for Fluorescein following different incubation times.
(A) Micrographs of HeLa cells instantaneously after micro-injection vs (B) FRAP after 24 hr incubation. (C) Comparative merged FRAP profiles with fits (N=30; R=0.99 for each of the fits) and (D) their Dconfocal values. Error bars represent SE calculated from fitting the FRAP progression curves averaged over at least 30 independent measurements.
-
Figure 3—figure supplement 1—source data 1
Original data file of Figure 3—figure supplement 1 plots.
- https://cdn.elifesciences.org/articles/97255/elife-97255-fig3-figsupp1-data1-v1.xlsx
Figure 3—figure supplement 2
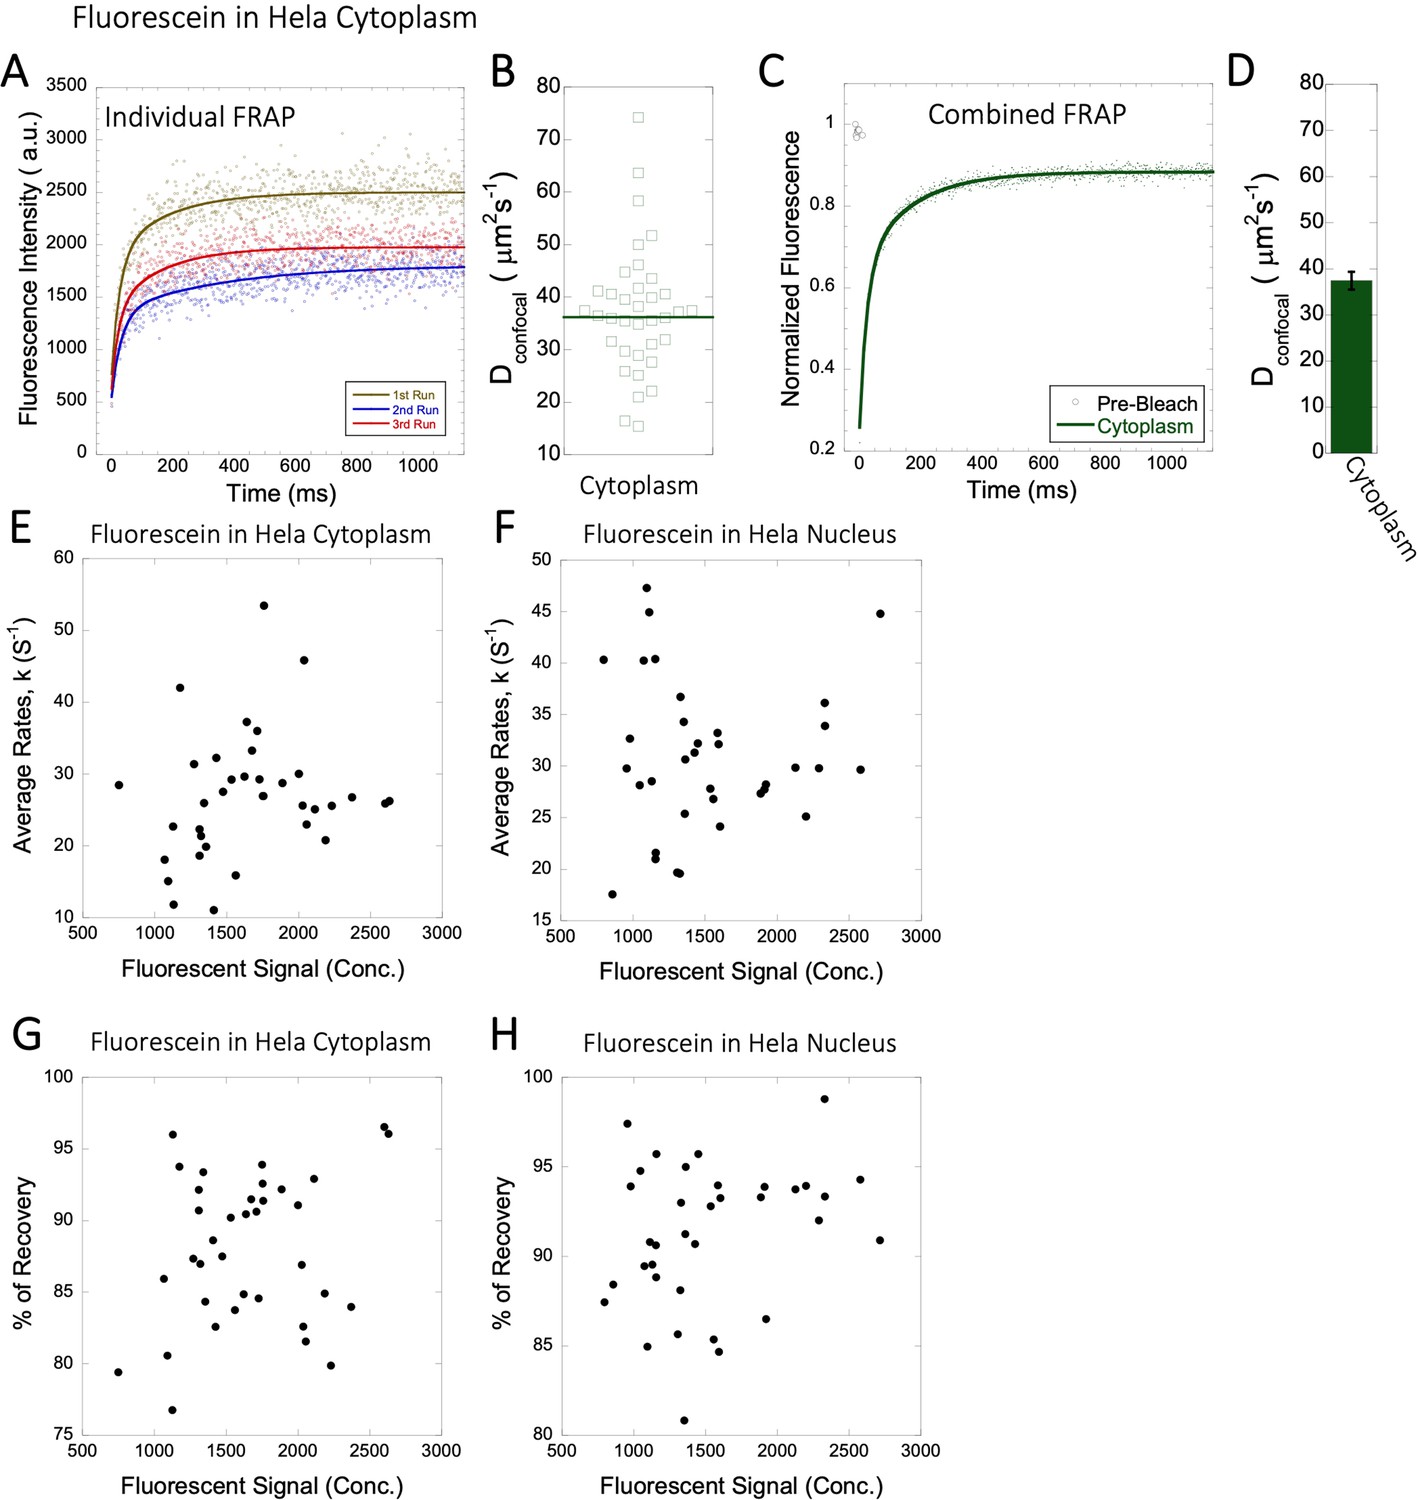
Dconfocal values calculated from individual FRAP and merged FRAP curves and diffusion rates and percent recovery as a function of Fluorescein concentration inside HeLa Cells.
FRAP curves and Dconfocal values for Fluorescein (A–D) inside HeLa cell cytoplasm are shown. Three representative individual FRAP profiles with exponential fits with R=0.80–0.90 are shown in (A). Individual Dconfocal values and their geometric means from individual FRAP curves are shown for Fluorescein in (B). (C) Shows the merged FRAP curves over 30 independent measurements. This provides an improved fit (R=0.99). Panel (D) show Dconfocal values calculated from the merged FRAP profiles. Error bars represent SE calculated from fitting the FRAP progression curves. The diffusion rates and percent recoveries in (E–H) were calculated from individual FRAP progression curves. The drug concentration is linearly related to the fluorescence intensity. (E) show FRAP rates as a function of the fluorescence signal for Fluorescein in the cytoplasm and (F) in the nucleus. (G–H) are as (E–F) but the y-axis denotes percent recovery after FRAP.
-
Figure 3—figure supplement 2—source data 1
Original data file of Figure 3—figure supplement 2 plots.
- https://cdn.elifesciences.org/articles/97255/elife-97255-fig3-figsupp2-data1-v1.xlsx
Figure 3—figure supplement 3
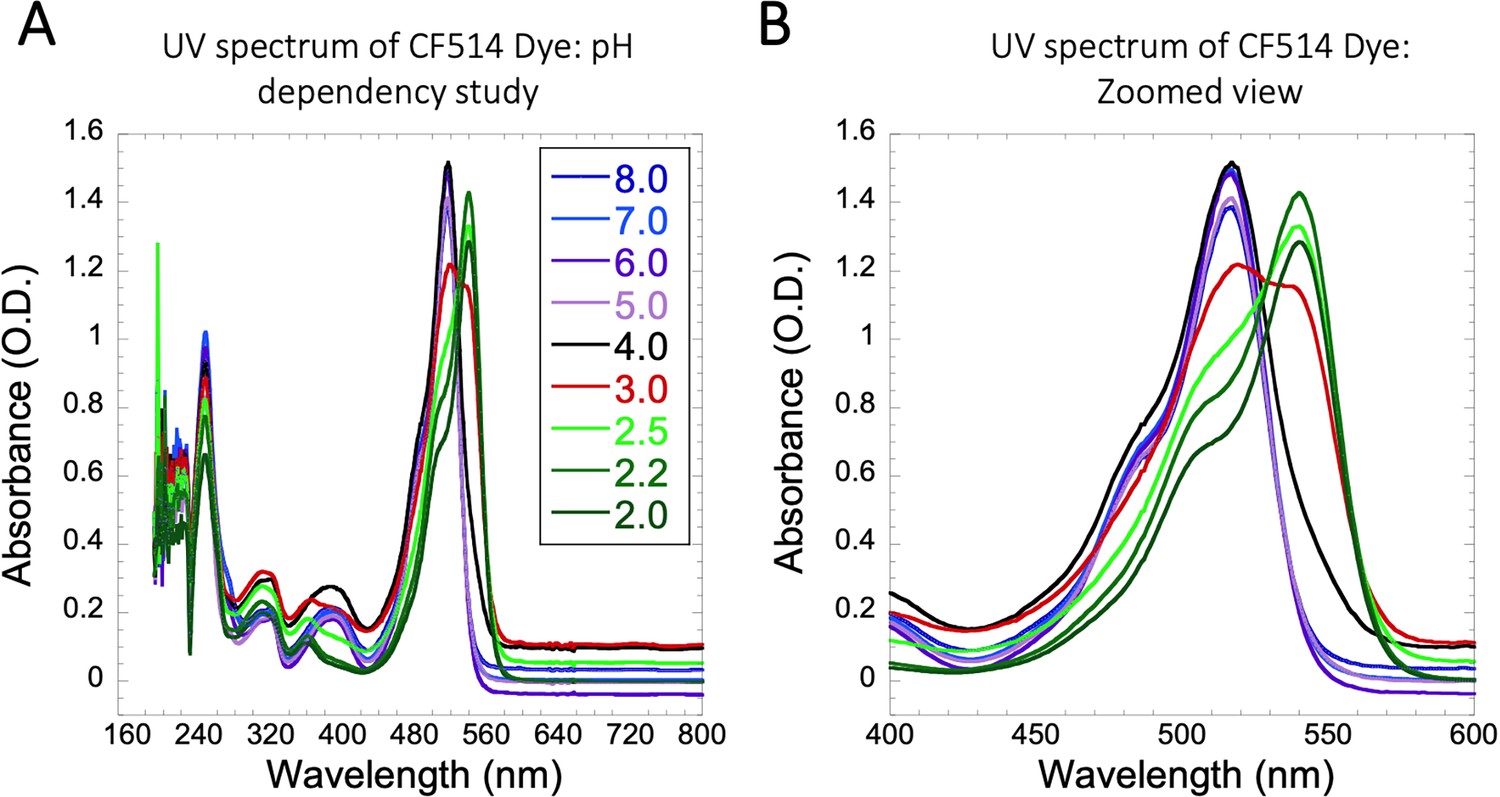
UV spectrum of CF514 Dye on pH variations.
Comparative UV spectrum of CF514 labelling dye in 20 mM sodium phosphate buffer at different pH values are shown in (A–B), from which a pKa value of 3 was calculated.
-
Figure 3—figure supplement 3—source data 1
Original data file of Figure 3—figure supplement 3 plots.
- https://cdn.elifesciences.org/articles/97255/elife-97255-fig3-figsupp3-data1-v1.xlsx
Figure 4 with 2 supplements
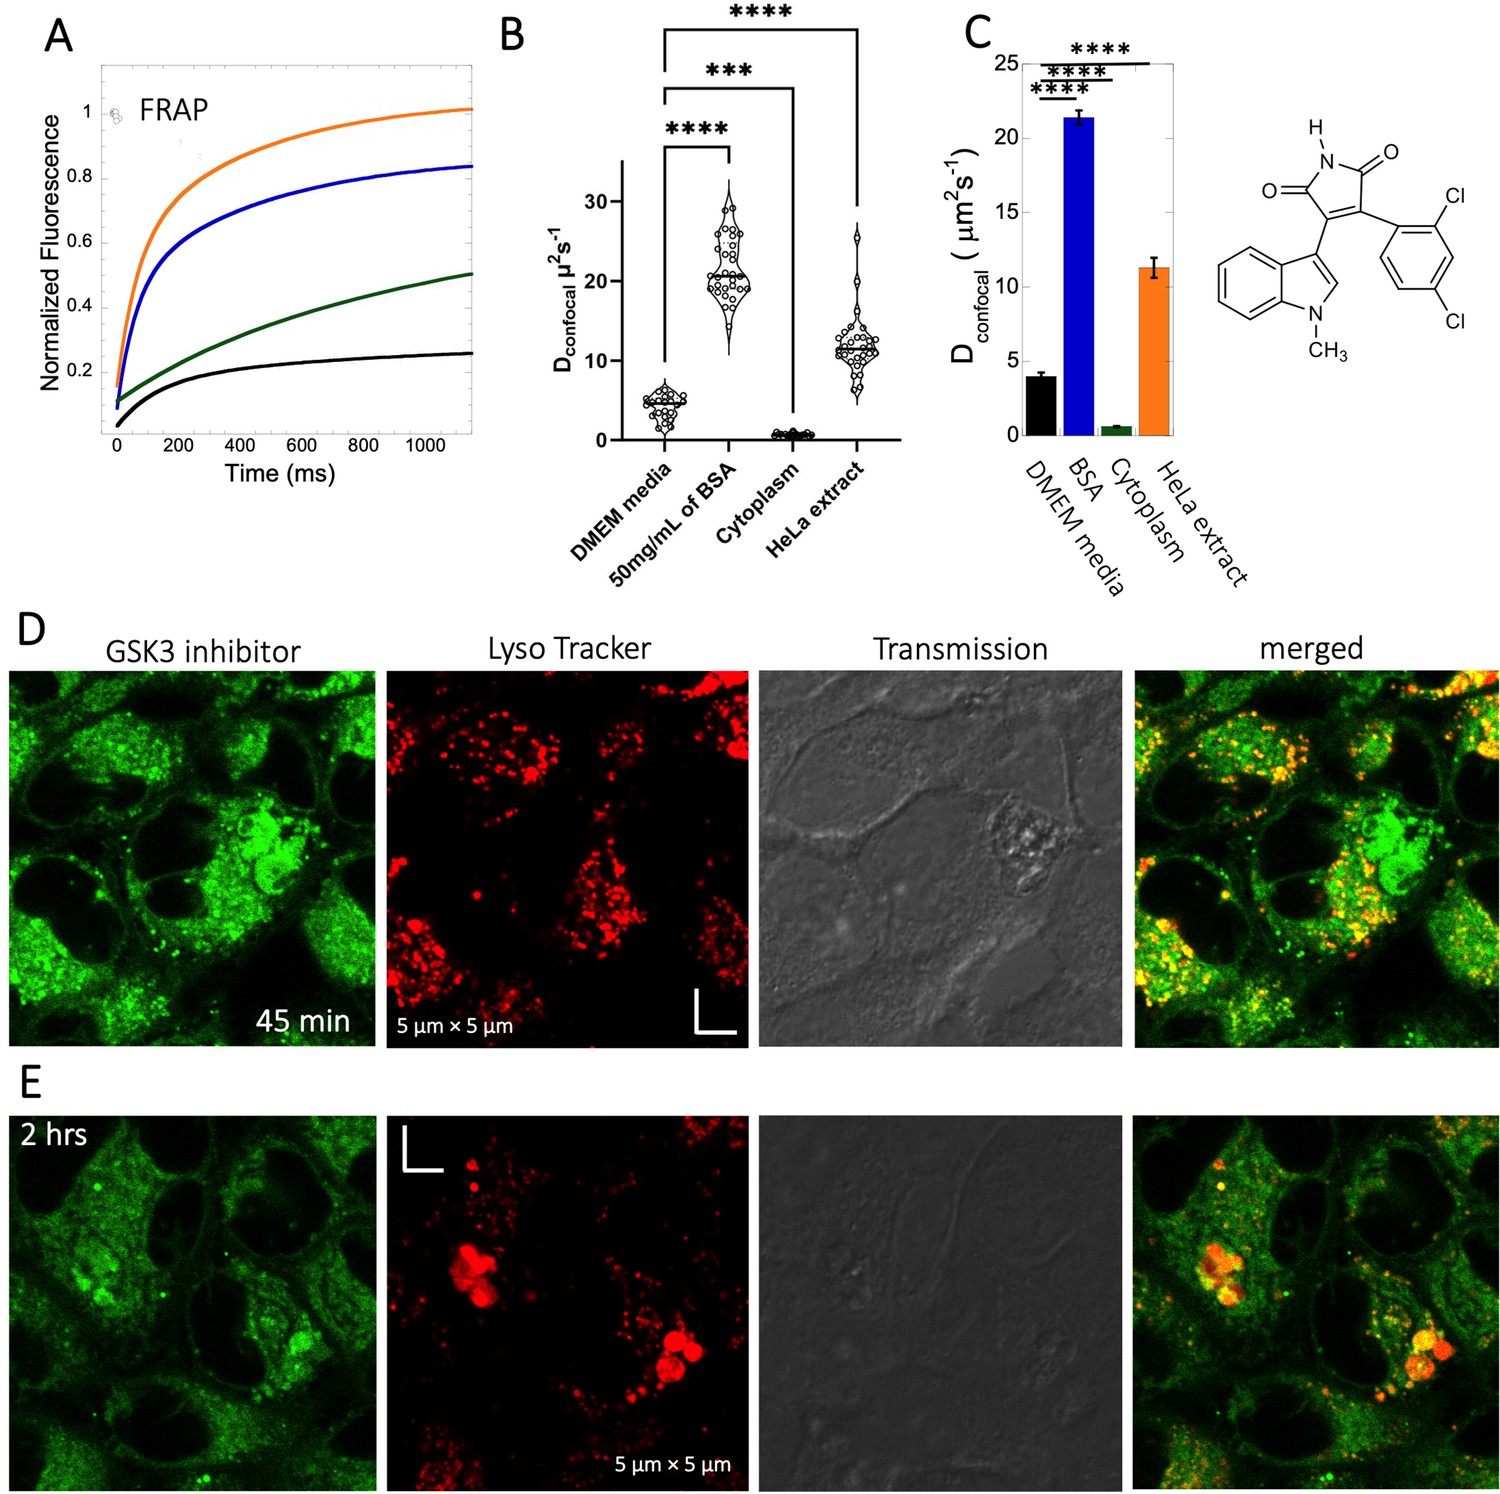
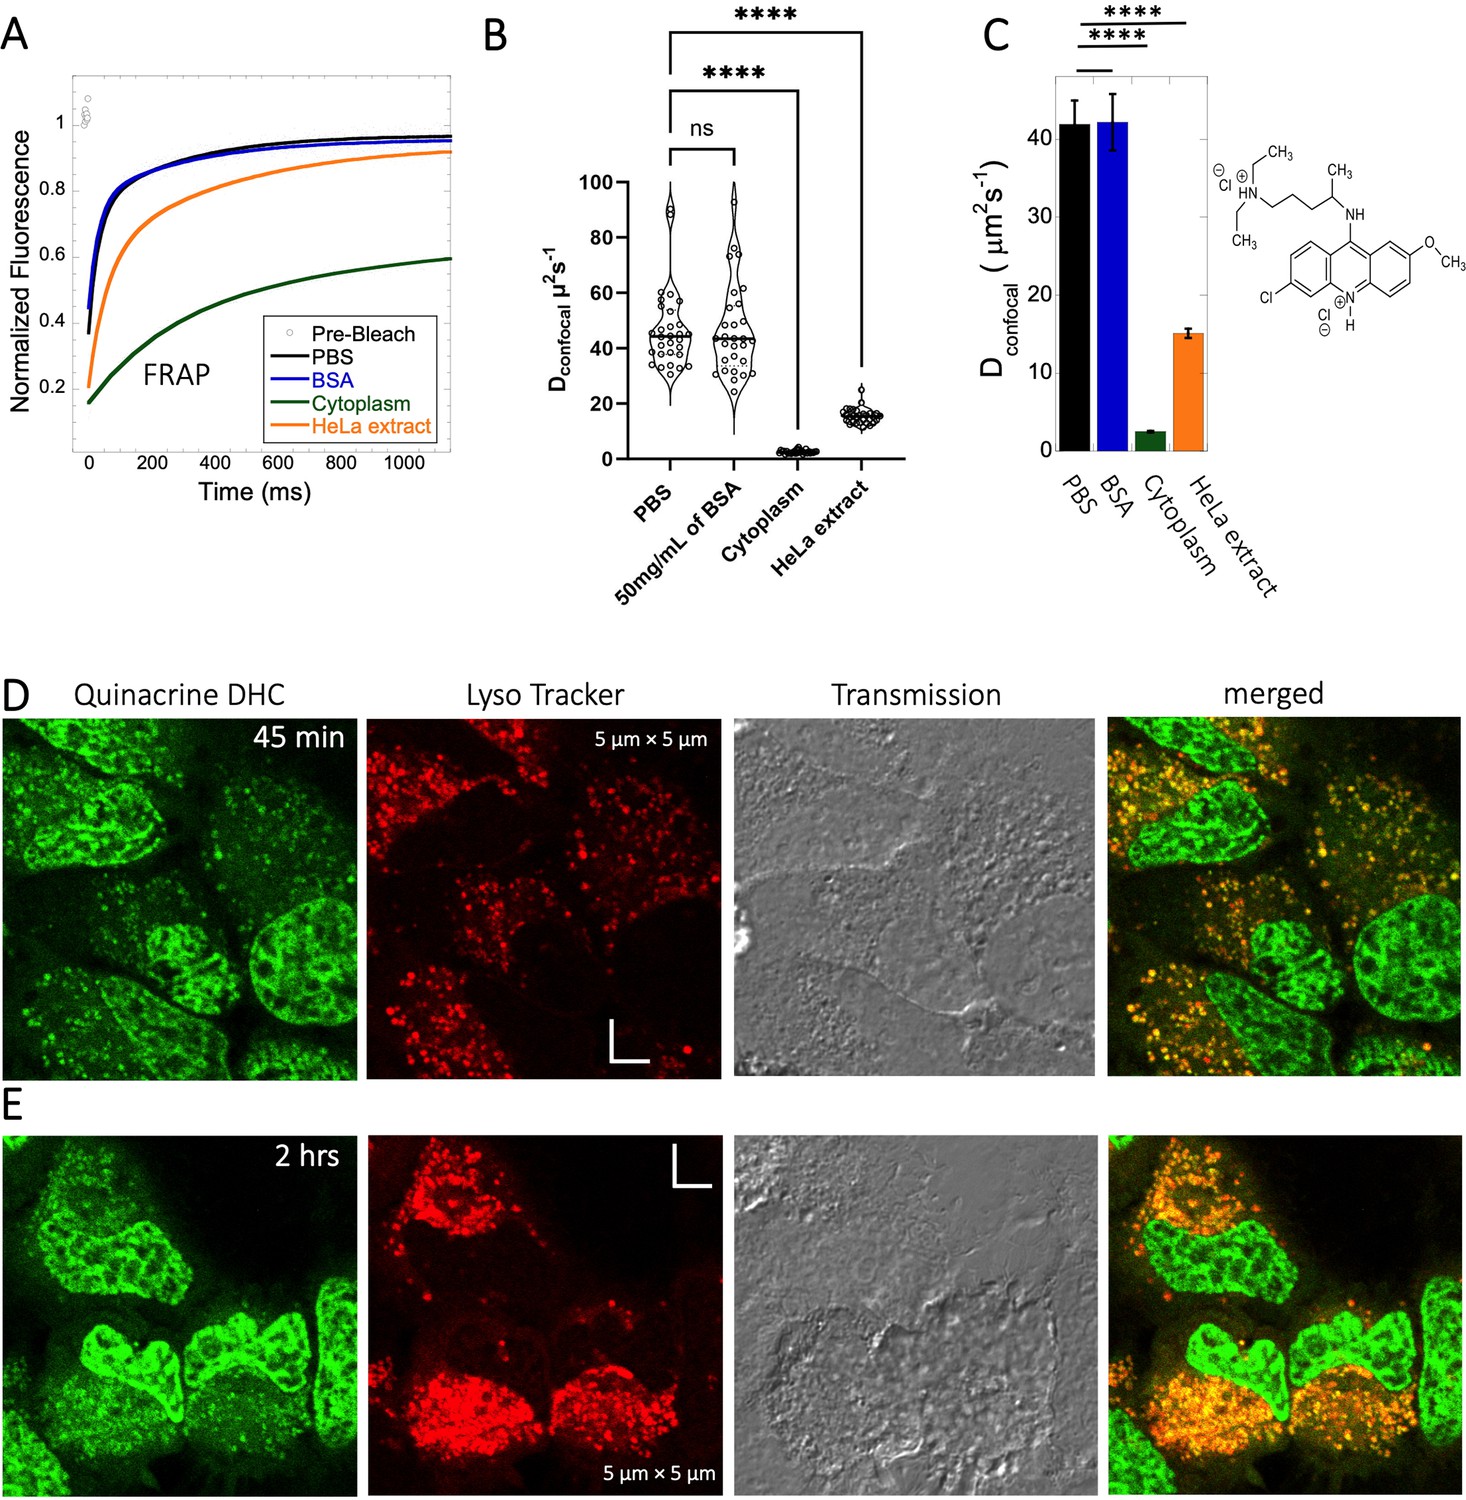
Diffusion of GSK3 inhibitor in PBS and inside HeLa cells.
Comparative (A) averaged FRAP recovery profiles with exponential fits for GSK3 inhibitor (SB216763; N=30; R=0.99 for each of the fits). Dots show prebleach fluorescence, Black line for DMEM, blue for PBS buffer +50 mg/mL of BSA, green for HeLa cells and orange for HeLa extract. (B) Dconfocal values calculated from individual FRAP curves. (C) Dconfocal values calculated from merger of 30 independent FRAP curves. (D–E) Colocalization of GSK3 inhibitor in lysosomal compartments. HeLa cells were treated with Lyso Tracker 633 for 30 min. GSK3 inhibitor treatment for (D) 45 mins and (E) 2 hr respectively at 10 µM concentrations are also shown. Error bars represent SE calculated from fitting the FRAP progression curves, which are averaged over at least 30 independent measurements. Statistical significance calculations are detailed in the Materials and methods section.
-
Figure 4—source data 1
Original data file of Figure 4 plots.
- https://cdn.elifesciences.org/articles/97255/elife-97255-fig4-data1-v1.xlsx
Figure 4—figure supplement 1
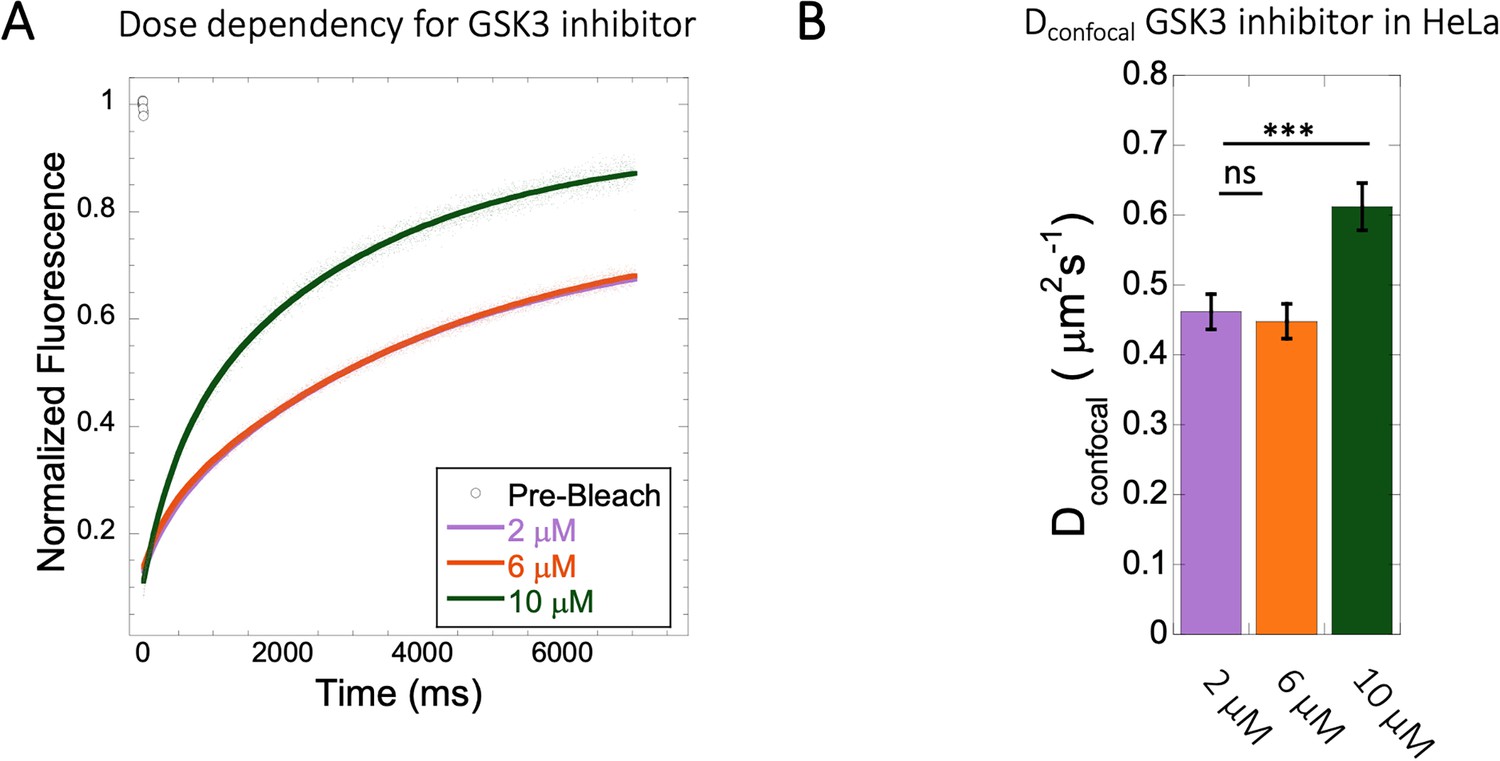
Diffusion rates at different doses of GSK3 inhibitor in HeLa cytoplasm.
Effect of drug dosage (2–10 µM) on (A) averaged FRAP profiles with fits (N=30; R=0.99 for each of the fits) and (B) Dconfocal values. Error bars represent SE calculated from fitting the FRAP progression curves, which are averaged over at least 30 independent measurements.
-
Figure 4—figure supplement 1—source data 1
Original data file of Figure 4—figure supplement 1 plots.
- https://cdn.elifesciences.org/articles/97255/elife-97255-fig4-figsupp1-data1-v1.xlsx
Figure 4—figure supplement 2
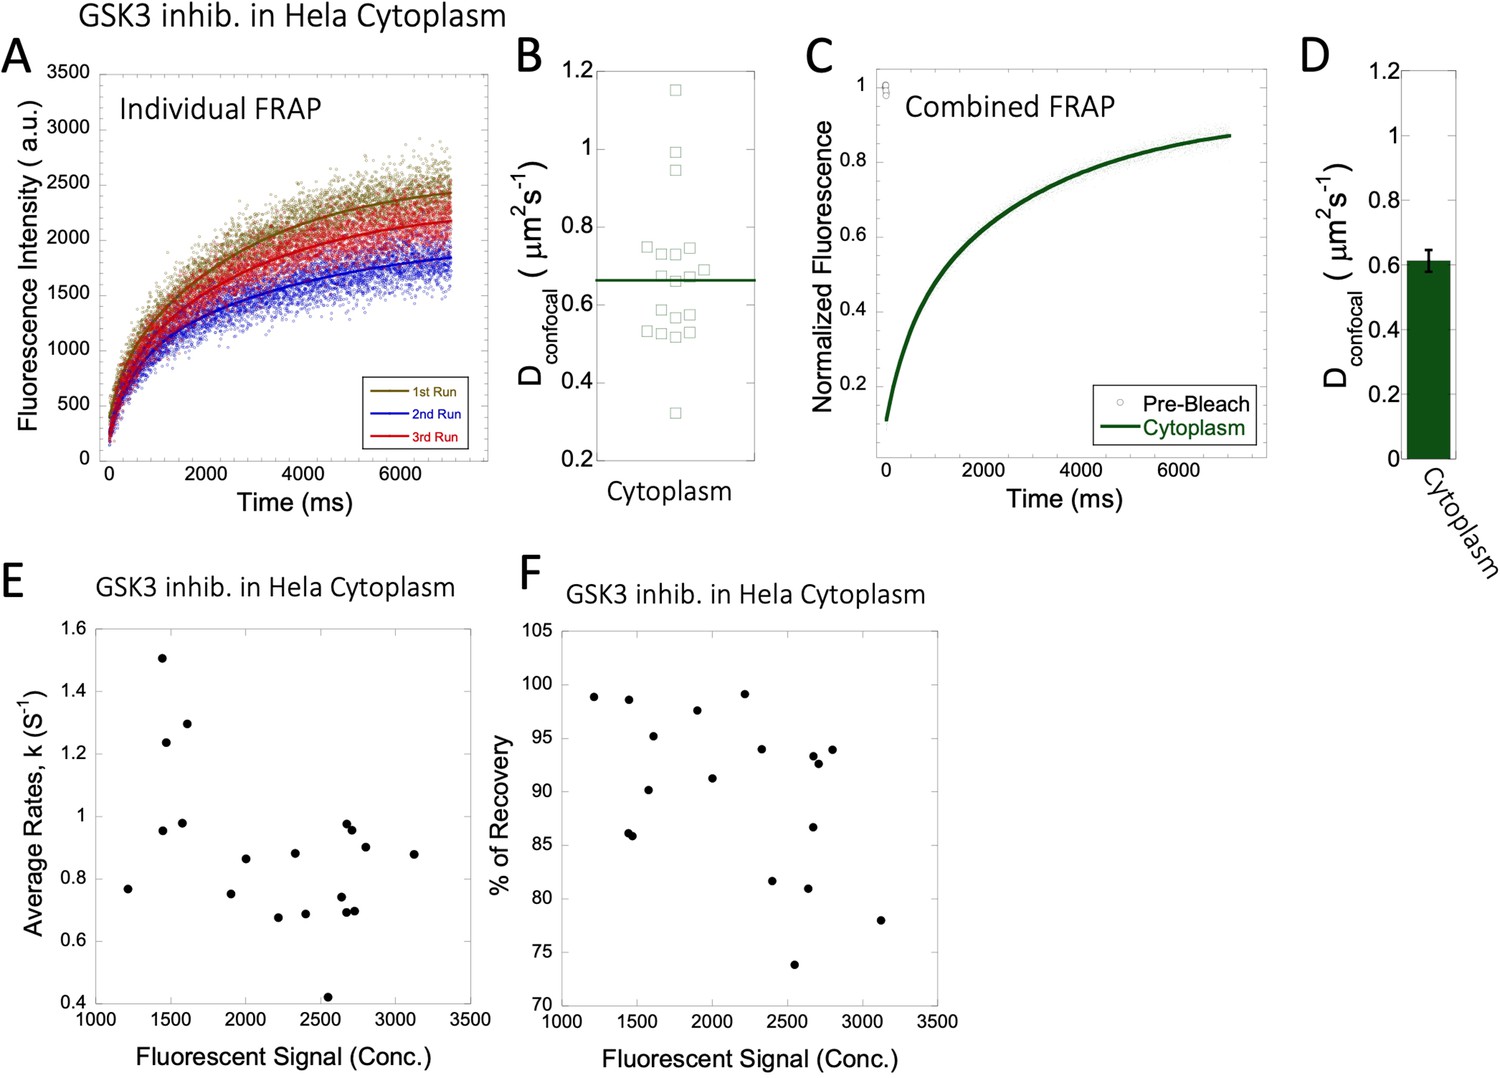
Dconfocal values calculated from individual FRAP and merged FRAP curves and diffusion rates and percent recovery as a function of GSK3 inhibitor concentration inside HeLa cells.
FRAP curves and Dconfocal values for GSK3 inhibitor (A–D) inside HeLa cell cytoplasm are shown. Three representative individual FRAP profiles with exponential fits with R=0.90–0.95 are shown in (A). Individual Dconfocal values and their geometric means from individual FRAP curves are shown for GSK3 inhib. in (B). (C) Shows the merged FRAP curves over 30 independent measurements. This provides an improved fit (R=0.99). Panel (D) show Dconfocal values calculated from the merged FRAP profiles. Error bars represent SE calculated from fitting the FRAP progression curves. The diffusion rates and percent of recoveries in (E–F) were calculated from individual FRAP progression curves. The drug concentration is linearly related to the fluorescence intensity. (E) show FRAP rates as a function of the fluorescence signal for GSK3 inhibitor in the cytoplasm. (F) is as (E) but the y-axis denotes percent recovery after FRAP.
-
Figure 4—figure supplement 2—source data 1
Original data file of Figure 4—figure supplement 2 plots.
- https://cdn.elifesciences.org/articles/97255/elife-97255-fig4-figsupp2-data1-v1.xlsx
Figure 5 with 3 supplements
Diffusion of Quinacrine in PBS and in HeLa cells.
Comparative (A) averaged FRAP recovery profiles with exponential fits for Quinacrine dihydrochloride (N=30; R=0.99 for each of the fits), (B) Dconfocal values calculated from individual FRAP curves. (C) Dconfocal values calculated from merger of 30 independent FRAP curves measured in PBS buffer, 50 mg/mL of BSA, HeLa cell extract and in live HeLa cells. (D–E) Colocalization of Quinacrine DHC in lysosomal compartments are shown. HeLa cells were treated with Lyso Tracker 633 for 30 min. Quinacrine DHC treatment was done for (D) 45 min and (E) 2 hr respectively at 10 µM concentration. Error bars represent SE calculated from fitting the FRAP progression curves, which are averaged over at least 30 independent measurements. Statistical significance calculations are detailed in the Materials and methods section.
-
Figure 5—source data 1
Original data file of Figure 5 plots.
- https://cdn.elifesciences.org/articles/97255/elife-97255-fig5-data1-v1.xlsx
Figure 5—figure supplement 1
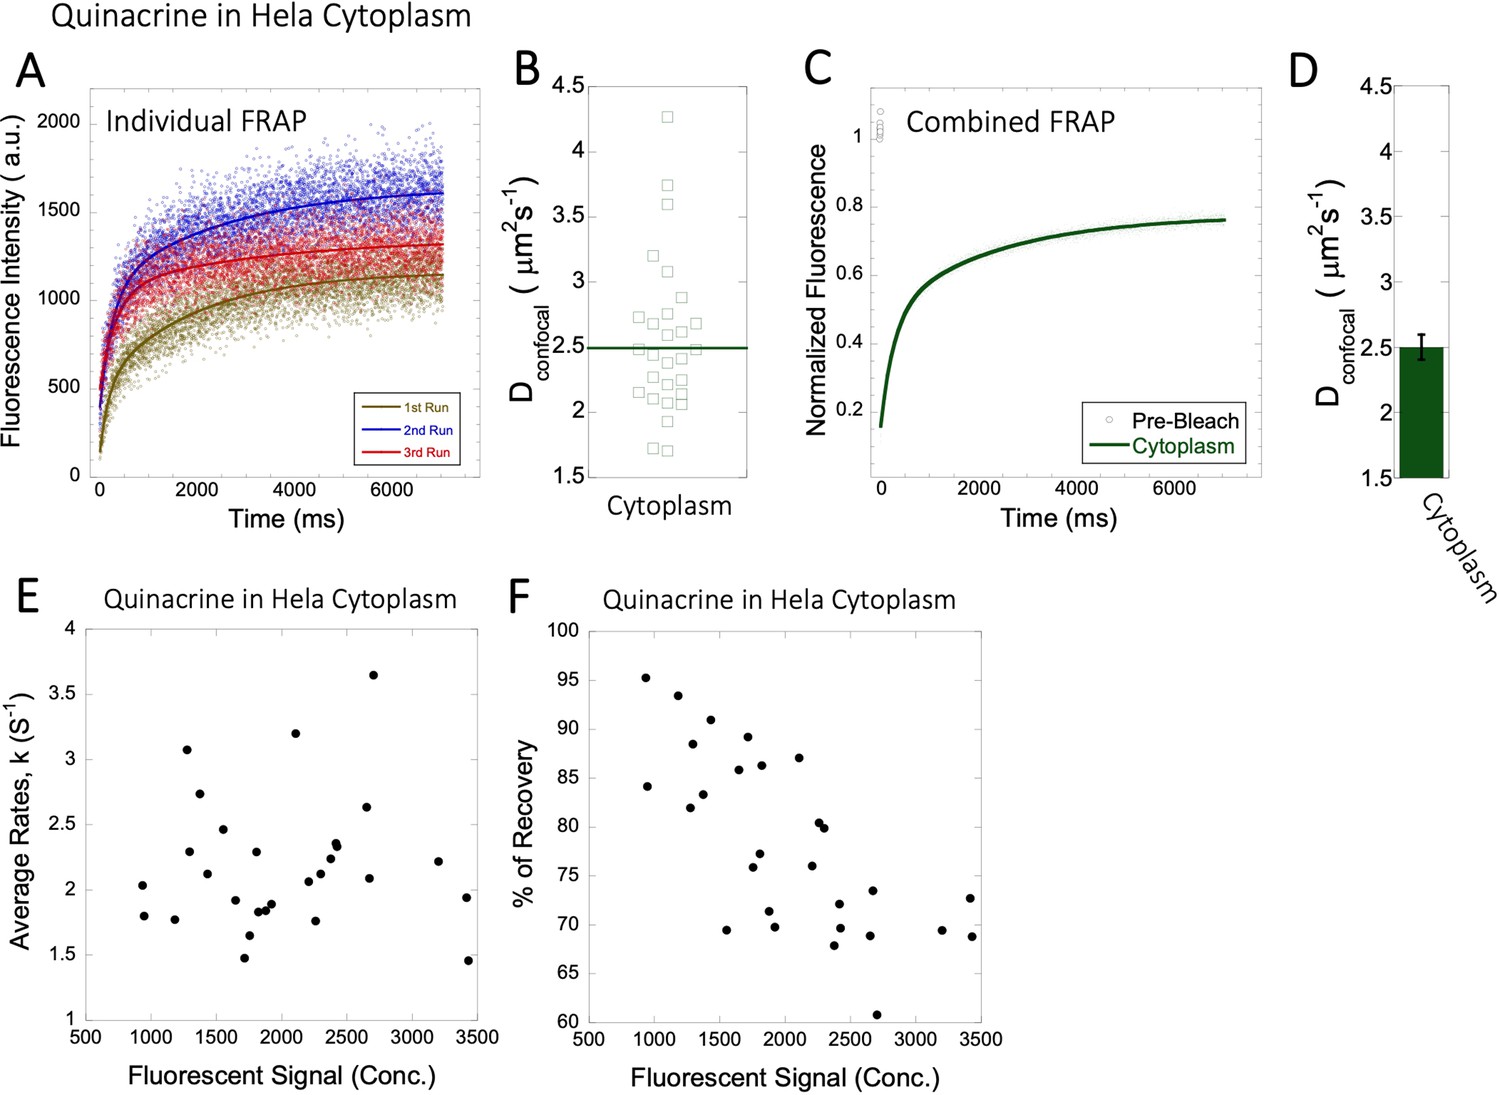
Dconfocal values calculated from individual FRAP and merged FRAP curves and diffusion rates and percent recovery as a function of Quinacrine concentration inside HeLa cells.
FRAP curves and Dconfocal values for Quinacrine (A–D) inside HeLa cell cytoplasm are shown. Three representative individual FRAP profiles with exponential fits with R=0.90–0.95 are shown in (A). Individual Dconfocal values and their geometric means from individual FRAP curves are shown for Quinacrine in (B). (C) Shows the merged FRAP curves over 30 independent measurements. This provides an improved fit (R=0.99). Panel (D) shows Dconfocal values calculated from the merged FRAP profiles. Error bars represent SE calculated from fitting the FRAP progression curves. The diffusion rates and percent of recoveries in (E–F) were calculated from individual FRAP progression curves. The drug concentration is linearly related to the fluorescence intensity. (E) shows FRAP rates as a function of the fluorescence signal for Quinacrine in the cytoplasm. (F) is as (E) but the y-axis denotes percent recovery after FRAP.
-
Figure 5—figure supplement 1—source data 1
Original data file of Figure 5—figure supplement 1 plots.
- https://cdn.elifesciences.org/articles/97255/elife-97255-fig5-figsupp1-data1-v1.xlsx
Figure 5—figure supplement 2
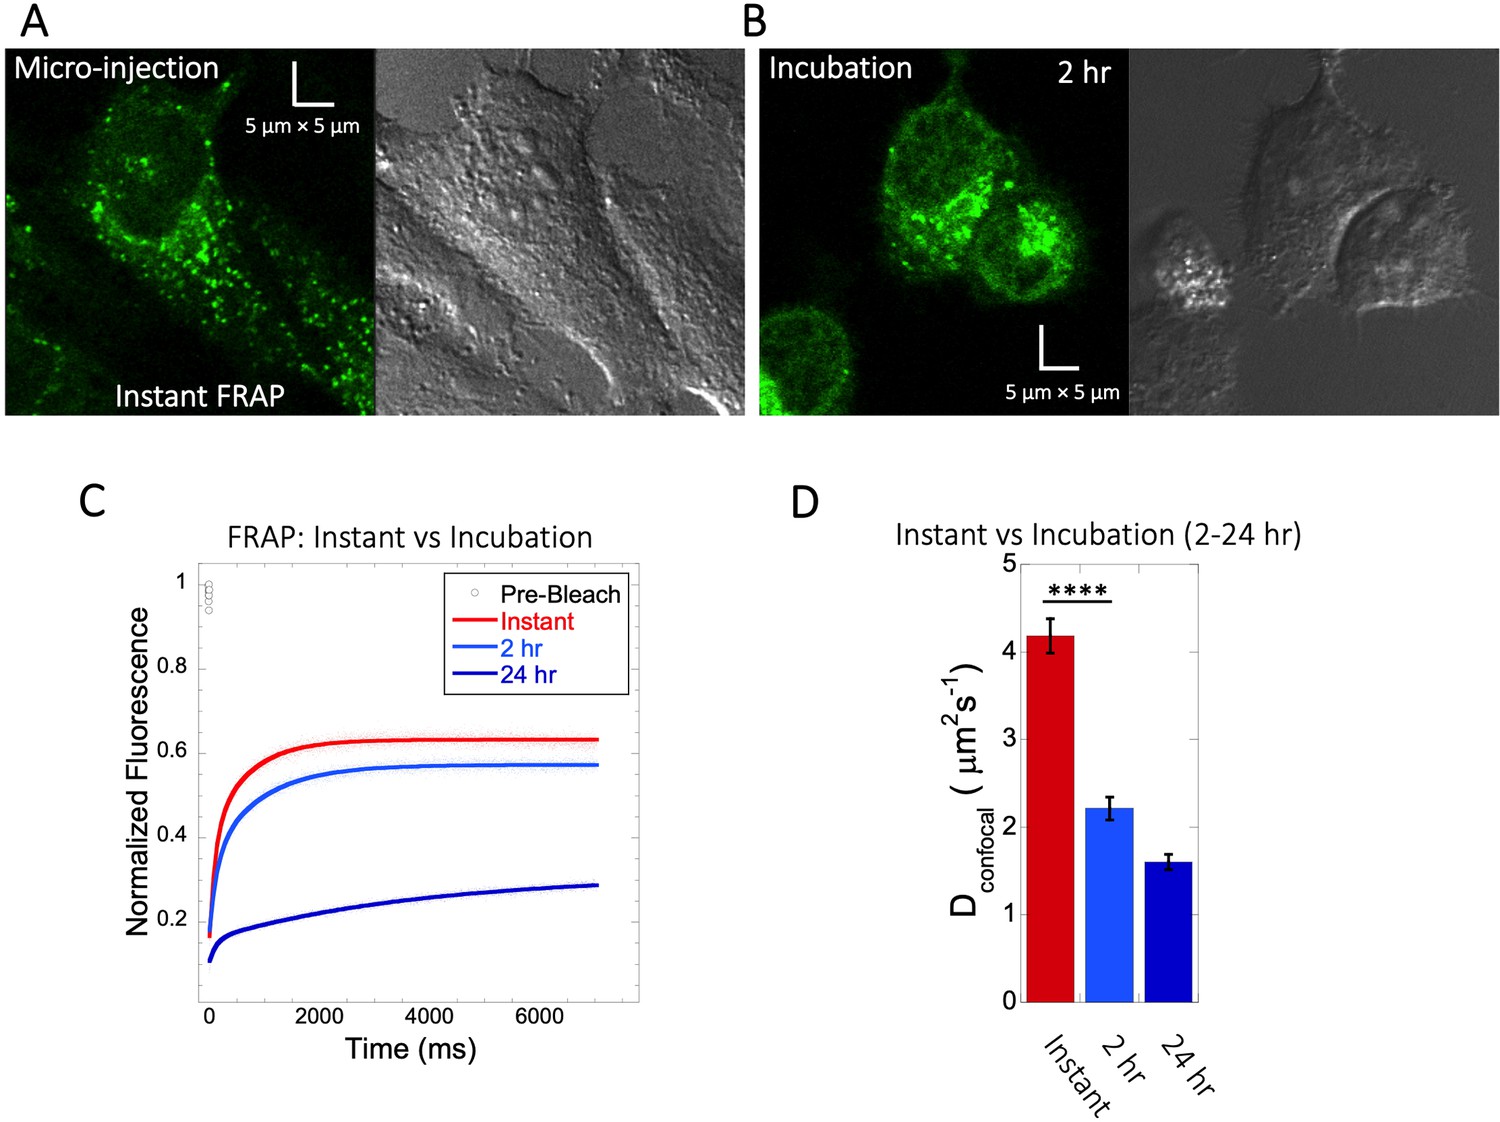
Quinacrine diffusion in HeLa after micro-injection or incubation.
Comparison of FRAP immediately following micro-injection (instant FRAP) and FRAP following 2–24 hr incubation. HeLa cell micrographs following (A) micro-injection and (B) 2 hr of incubation. Comparative (C) averaged FRAP profiles with exponential curve fits (N=30; R=0.99 for each of the fits) and (D) calculated Dconfocal values. Error bars represent SE calculated from fitting the FRAP progression curves, which are averaged over at least 30 independent measurements.
-
Figure 5—figure supplement 2—source data 1
Original data file of Figure 5—figure supplement 2 plots.
- https://cdn.elifesciences.org/articles/97255/elife-97255-fig5-figsupp2-data1-v1.xlsx
Figure 5—figure supplement 3
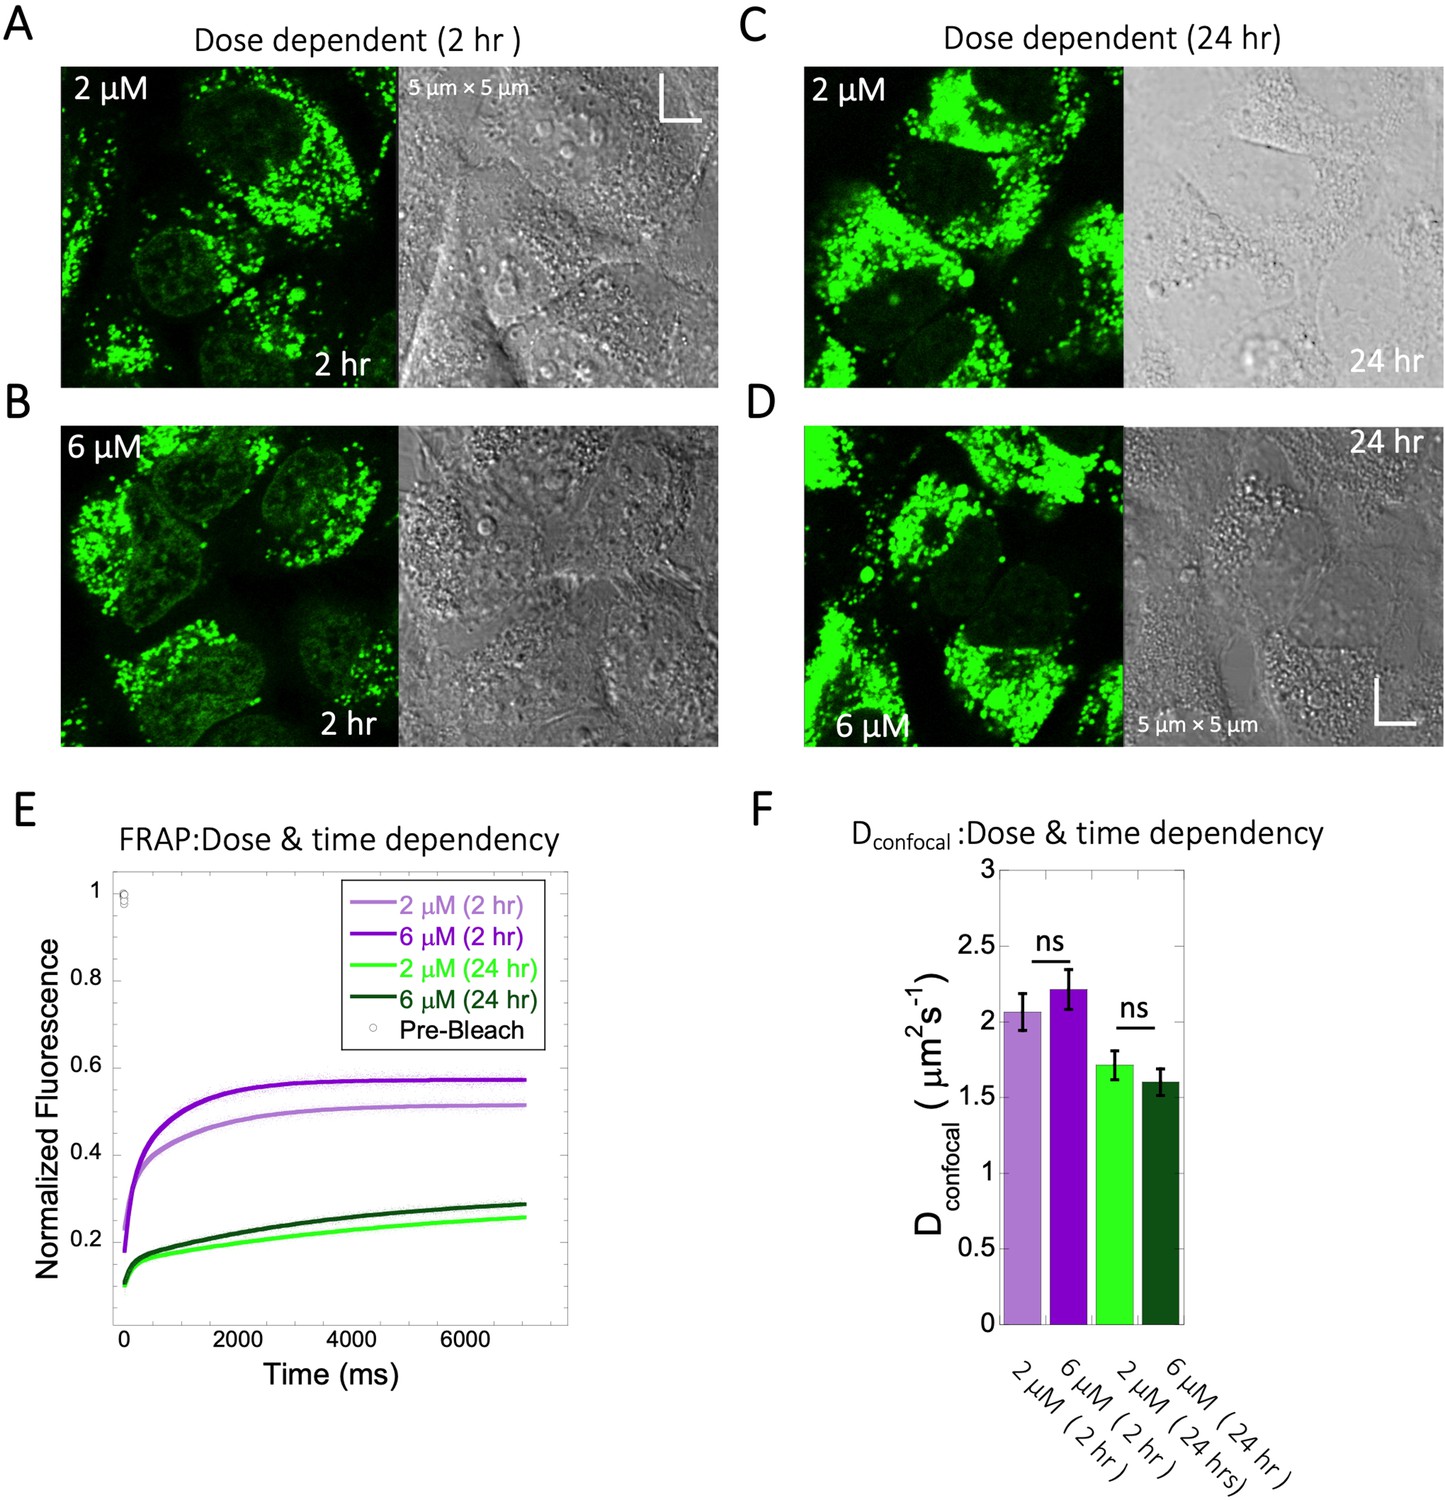
Dose and time dependency of Quinacrine diffusion in HeLa cells.
HeLa cell micrographs after 2 hr of incubation with (A) 2 µM and (B) 6 µM of Quinacrine. (C) and (D) are micrographs of HeLa cells after 24 hr of incubation with 2 µM and 6 µM Quinacrine, respectively. (E) Effect of drug dose and time dependency on comparative FRAP profiles, with fits (N=30; R=0.99 for each of the fits) and (F) Calculated Dconfocal values from the fits in (E). Error bars represent SE calculated from fitting the FRAP progression curves, which are averaged over at least 30 independent measurements.
-
Figure 5—figure supplement 3—source data 1
Original data file of Figure 5—figure supplement 3 plots.
- https://cdn.elifesciences.org/articles/97255/elife-97255-fig5-figsupp3-data1-v1.xlsx
Figure 6 with 1 supplement
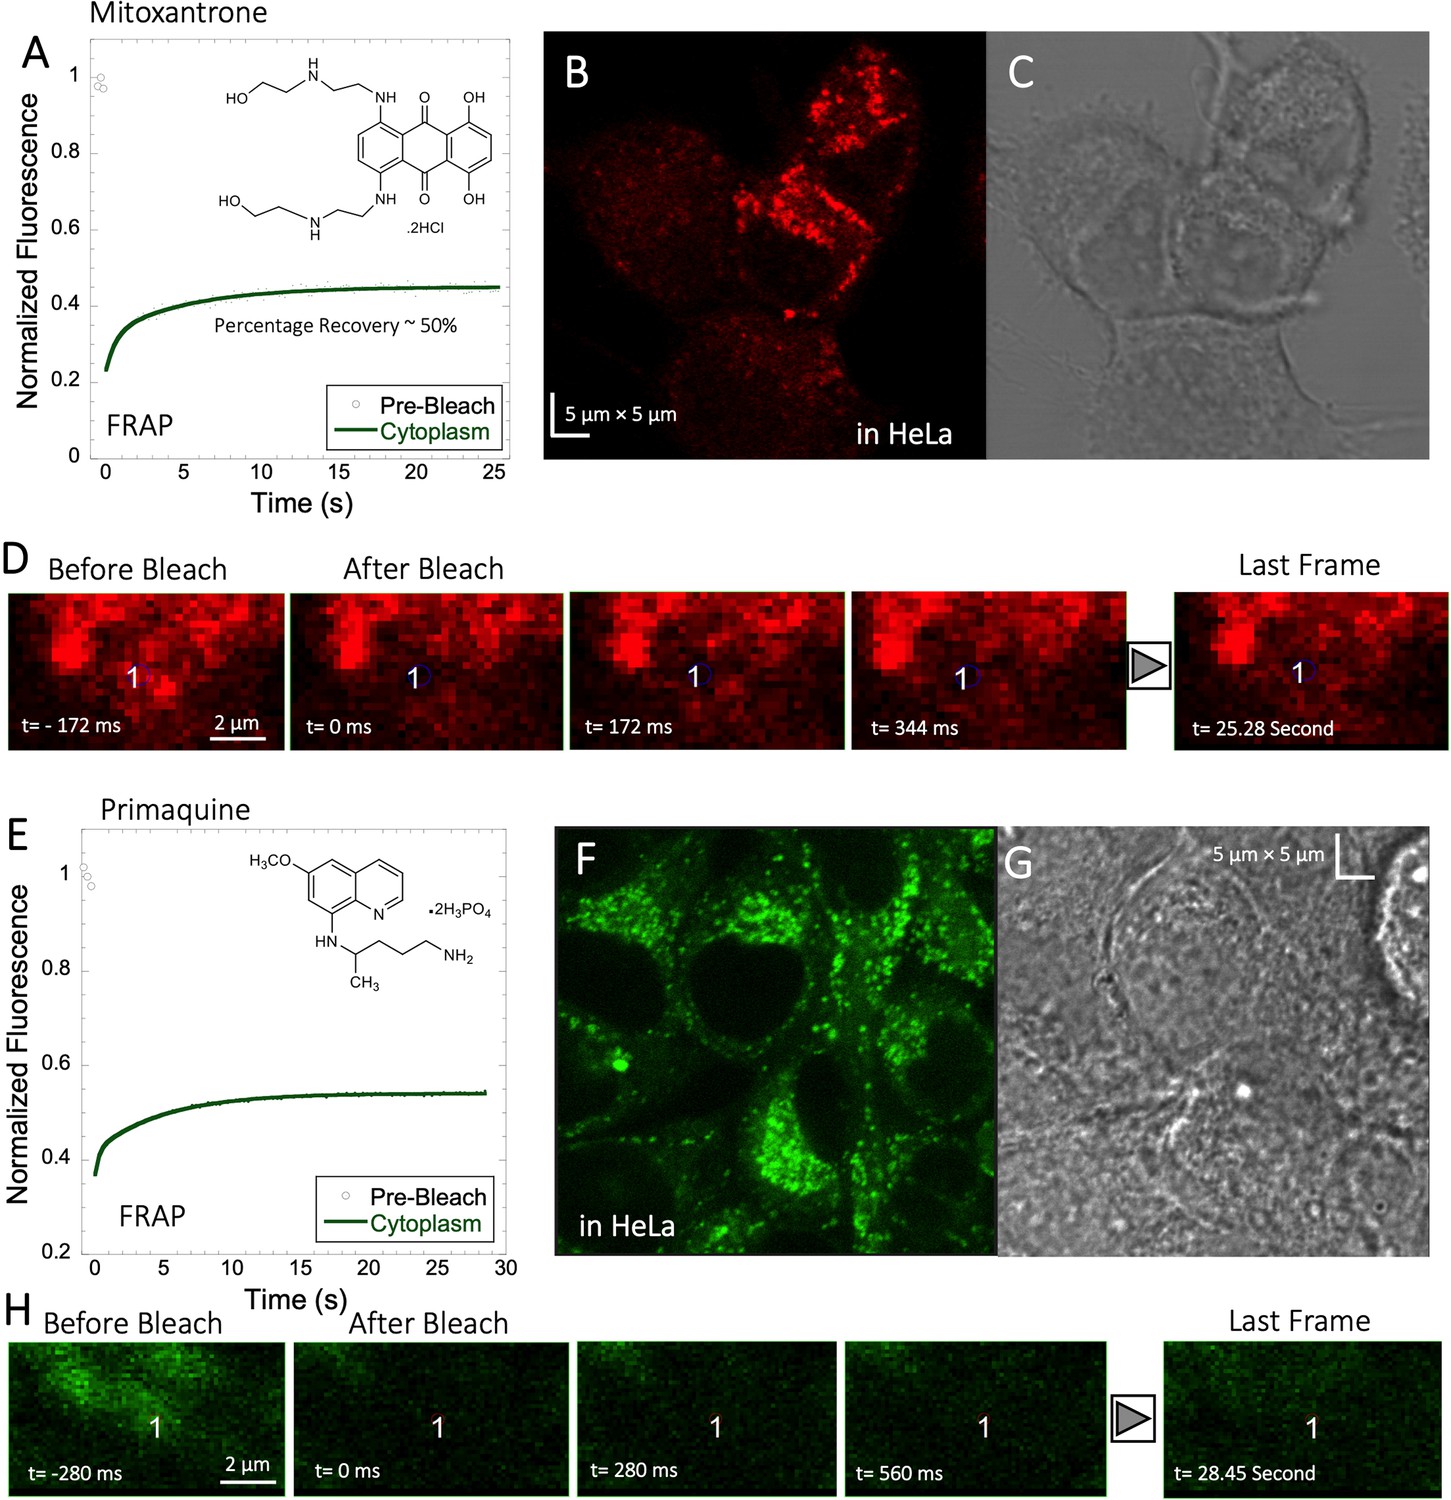
Mitoxantrone and Primaquine diffusion inside HeLa cells.
Averaged XY- FRAP recovery profiles with exponential fits (N=20; R=0.98 for each of the fits) for (A) Mitoxantrone and (E) Primaquine in HeLa cells. Fluorescent and Transmission channel images of HeLa cells after 45 min incubations with (B–C) Mitoxantrone and (F–G) Primaquine are shown. Time lapse micrographs of a portion of HeLa cell using a classical rectangular XY-FRAP protocol for (D) Mitoxatrone and, (H) Primaquine are shown.
-
Figure 6—source data 1
Original data file of Figure 6 plots.
- https://cdn.elifesciences.org/articles/97255/elife-97255-fig6-data1-v1.xlsx
Figure 6—figure supplement 1
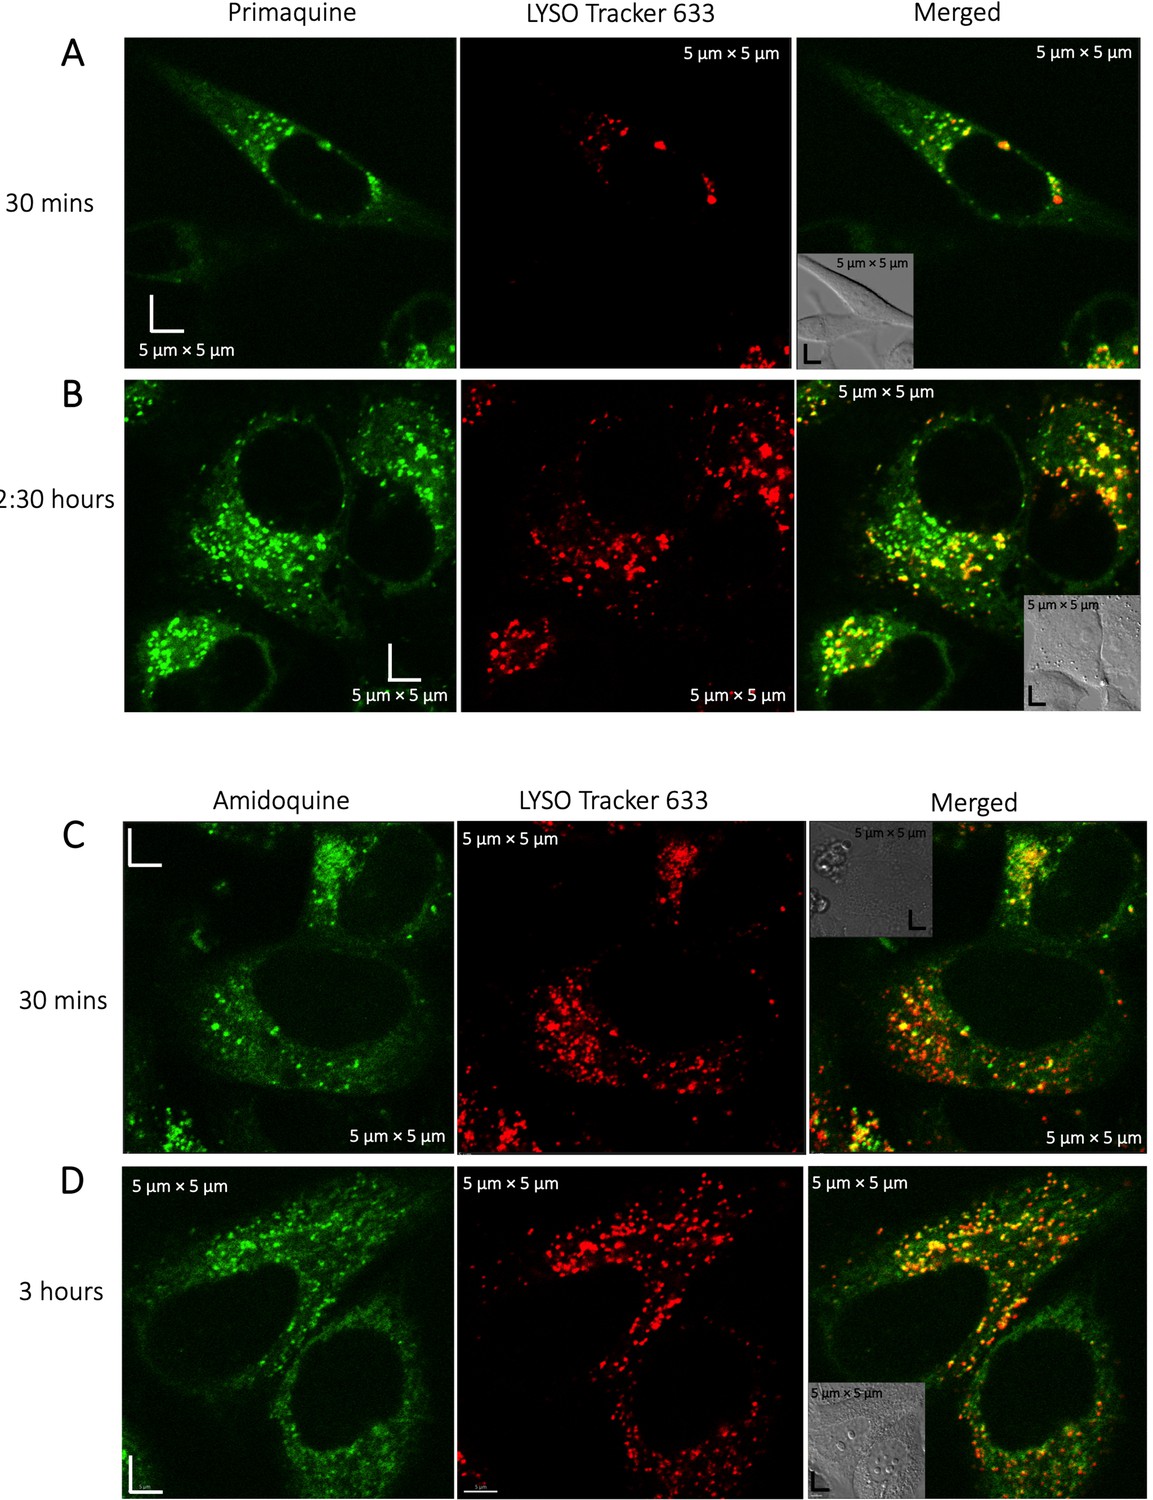
Colocalization of Primaquine and Amidoqiuine with Lyso-tracker.
Colocalization of Primaquine (A–B) and Amidoquine (C–D) with Lyso Tracker 633 in HeLa cells. Time-dependent measurements show higher aggregation of both drugs in the lysosomes over time.
Figure 7 with 2 supplements
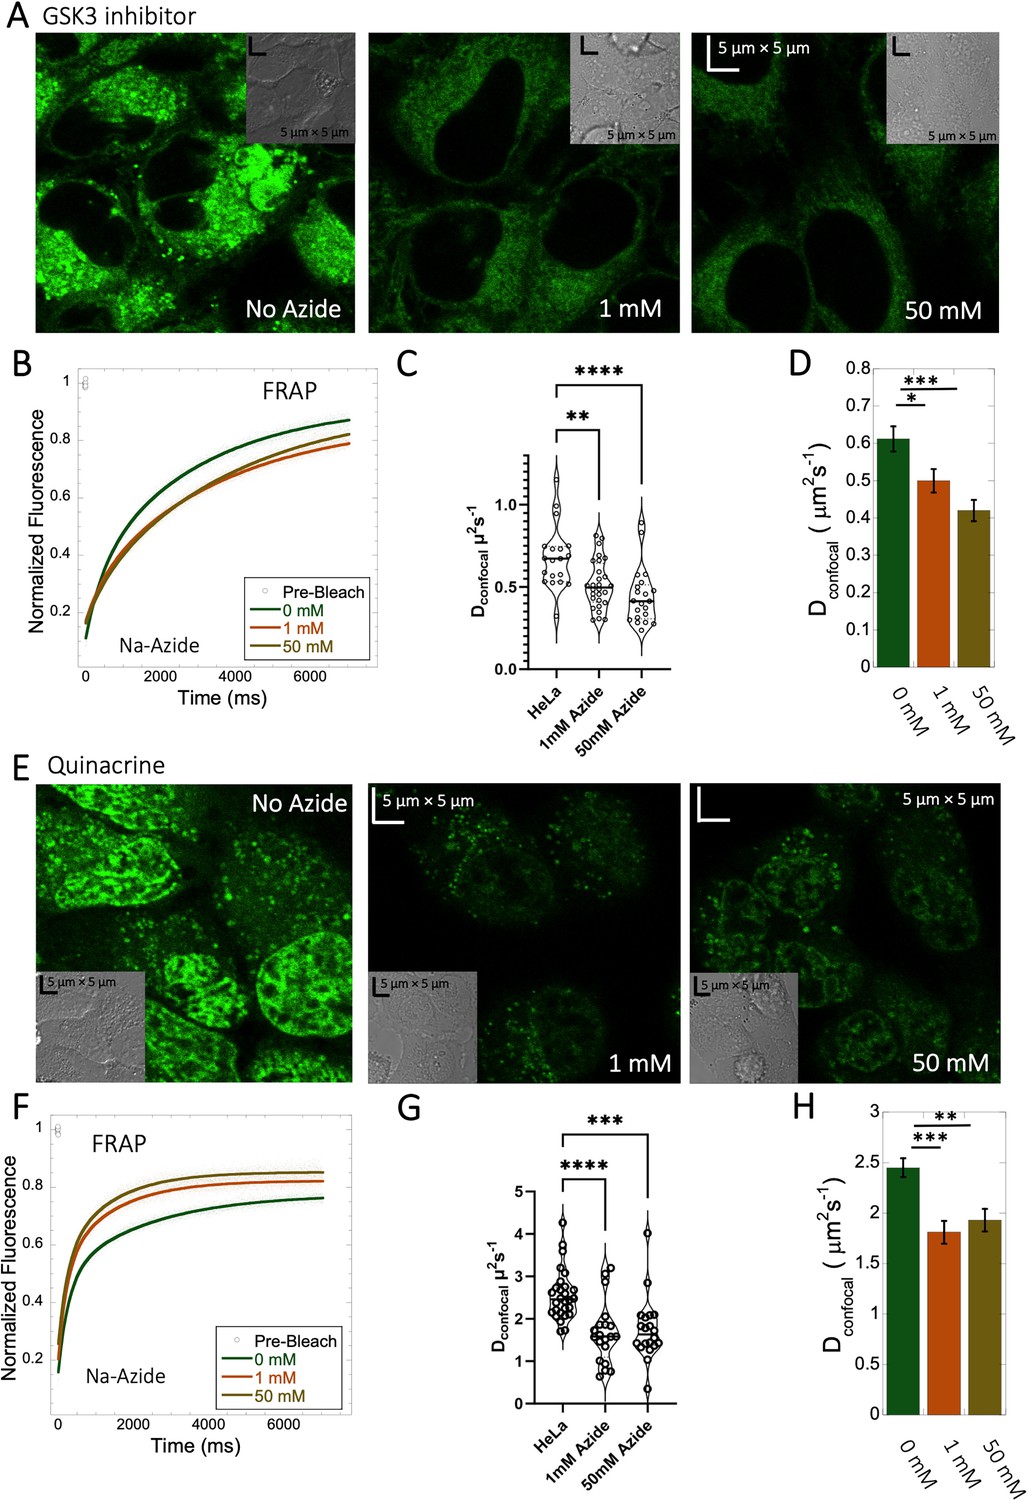
Effect of sodium azide on the diffusion of GSK3 inhibitor and Quinacrine inside HeLa cells.
(A) GSK3 inhibitor and (E) Quinacrine-dihydrochloride-treated HeLa cells with or without sodium azide. Comparison of merged FRAP profiles with exponential fits (N=30; R=0.99 for each of the fits) and calculated Dconfocal values from individual fits and combined averaged fit for (B–D) GSK3 inhibitor and (F–H) Quinacrine dihydrochloride are shown. Dconfocal estimations from individual FRAP curves are shown in (C,G). Error bars represent SE calculated from fitting the FRAP progression curves, which are averaged over at least 30 independent measurements. Statistical significance calculations are detailed in the Materials and methods section.
-
Figure 7—source data 1
Original data file of Figure 7 plots.
- https://cdn.elifesciences.org/articles/97255/elife-97255-fig7-data1-v1.xlsx
Figure 7—figure supplement 1
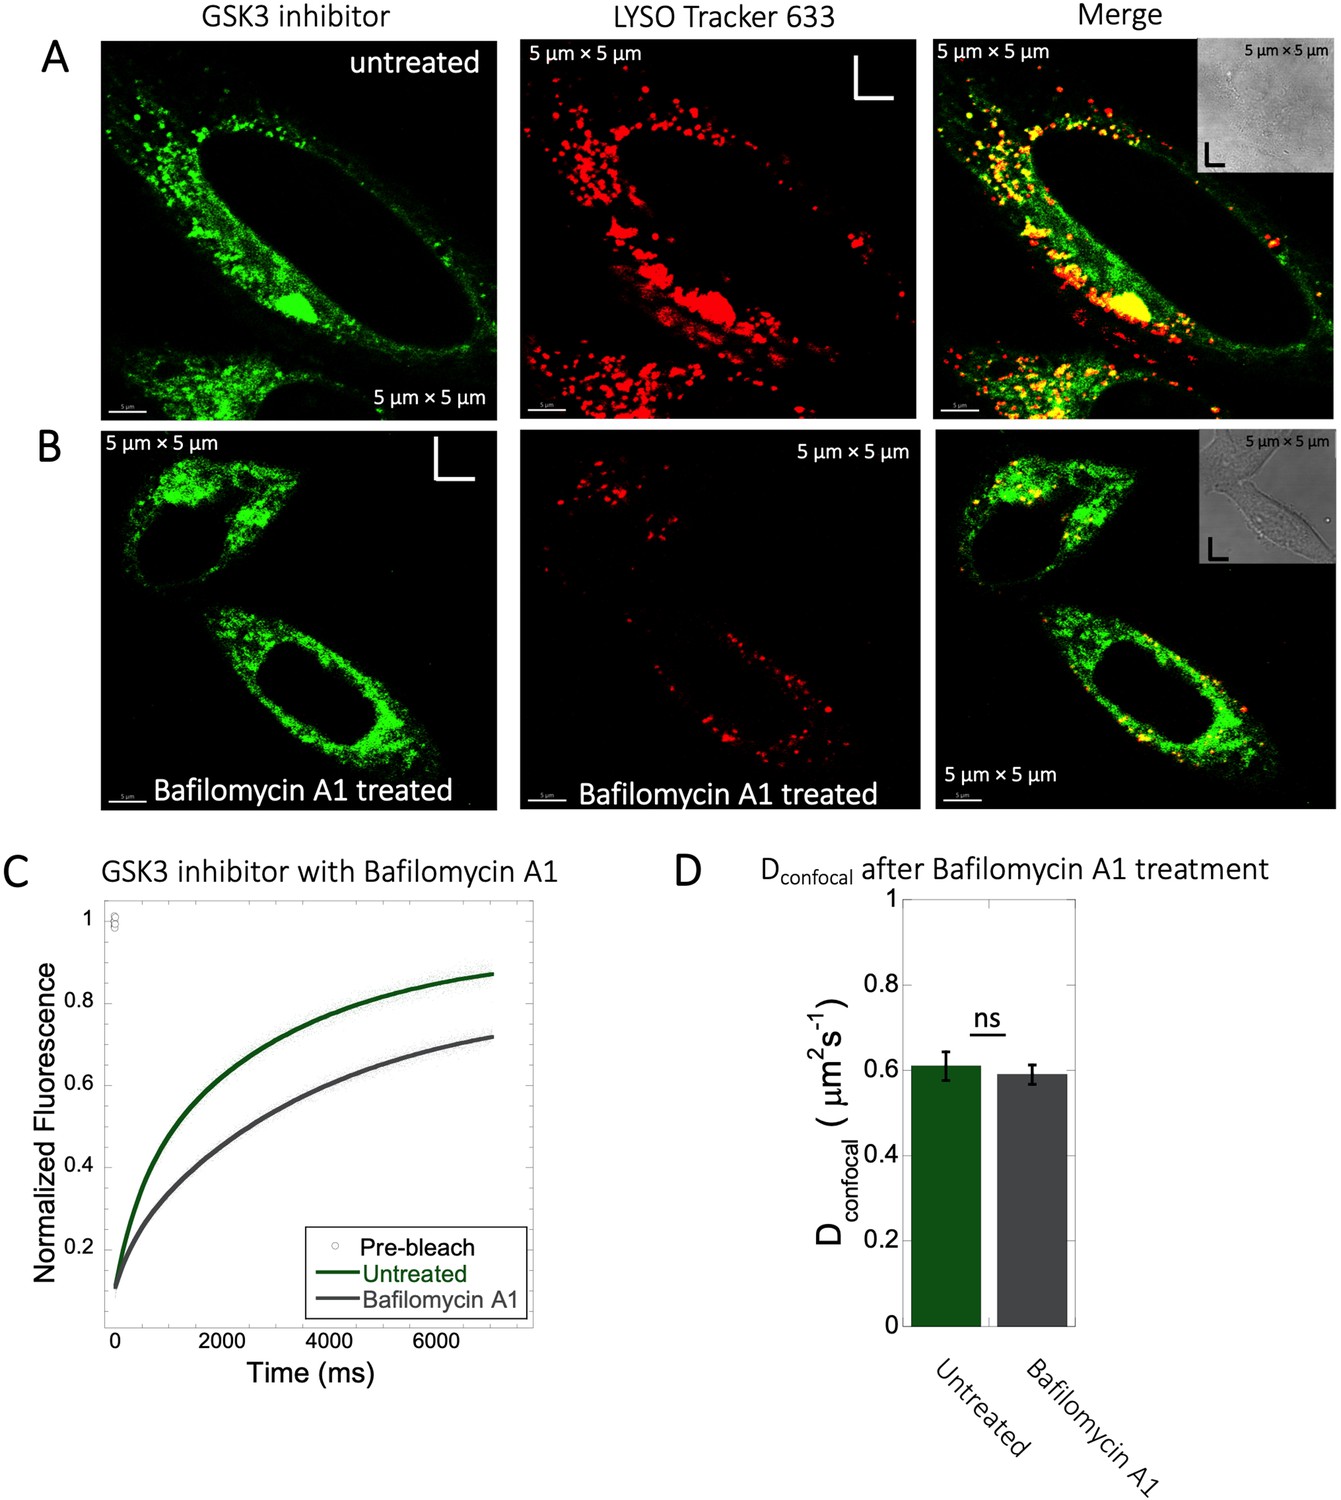
Inhibition of lysosomal accumulation of GSK3 inhibitor by Bafilomycin A1.
(A–B) Colocalization of GSK3 inhibitor with Lyso Tracker 633 in HeLa cells. (A) Untreated and (B) treated with 100 nM Bafilomycin A1 and corresponding colocalizations are shown. (C) Comparative averaged FRAP profiles with fits (N=30; R=0.99 for each of the fits) and (D) DconfocalDconfocal diffusion values with and without the Bafilomycin A1 treatment. Error bars represent SE calculated from fitting the FRAP progression curves, which are averaged over at least 30 independent measurements.
-
Figure 7—figure supplement 1—source data 1
Original data file of Figure 7—figure supplement 1 plots.
- https://cdn.elifesciences.org/articles/97255/elife-97255-fig7-figsupp1-data1-v1.xlsx
Figure 7—figure supplement 2
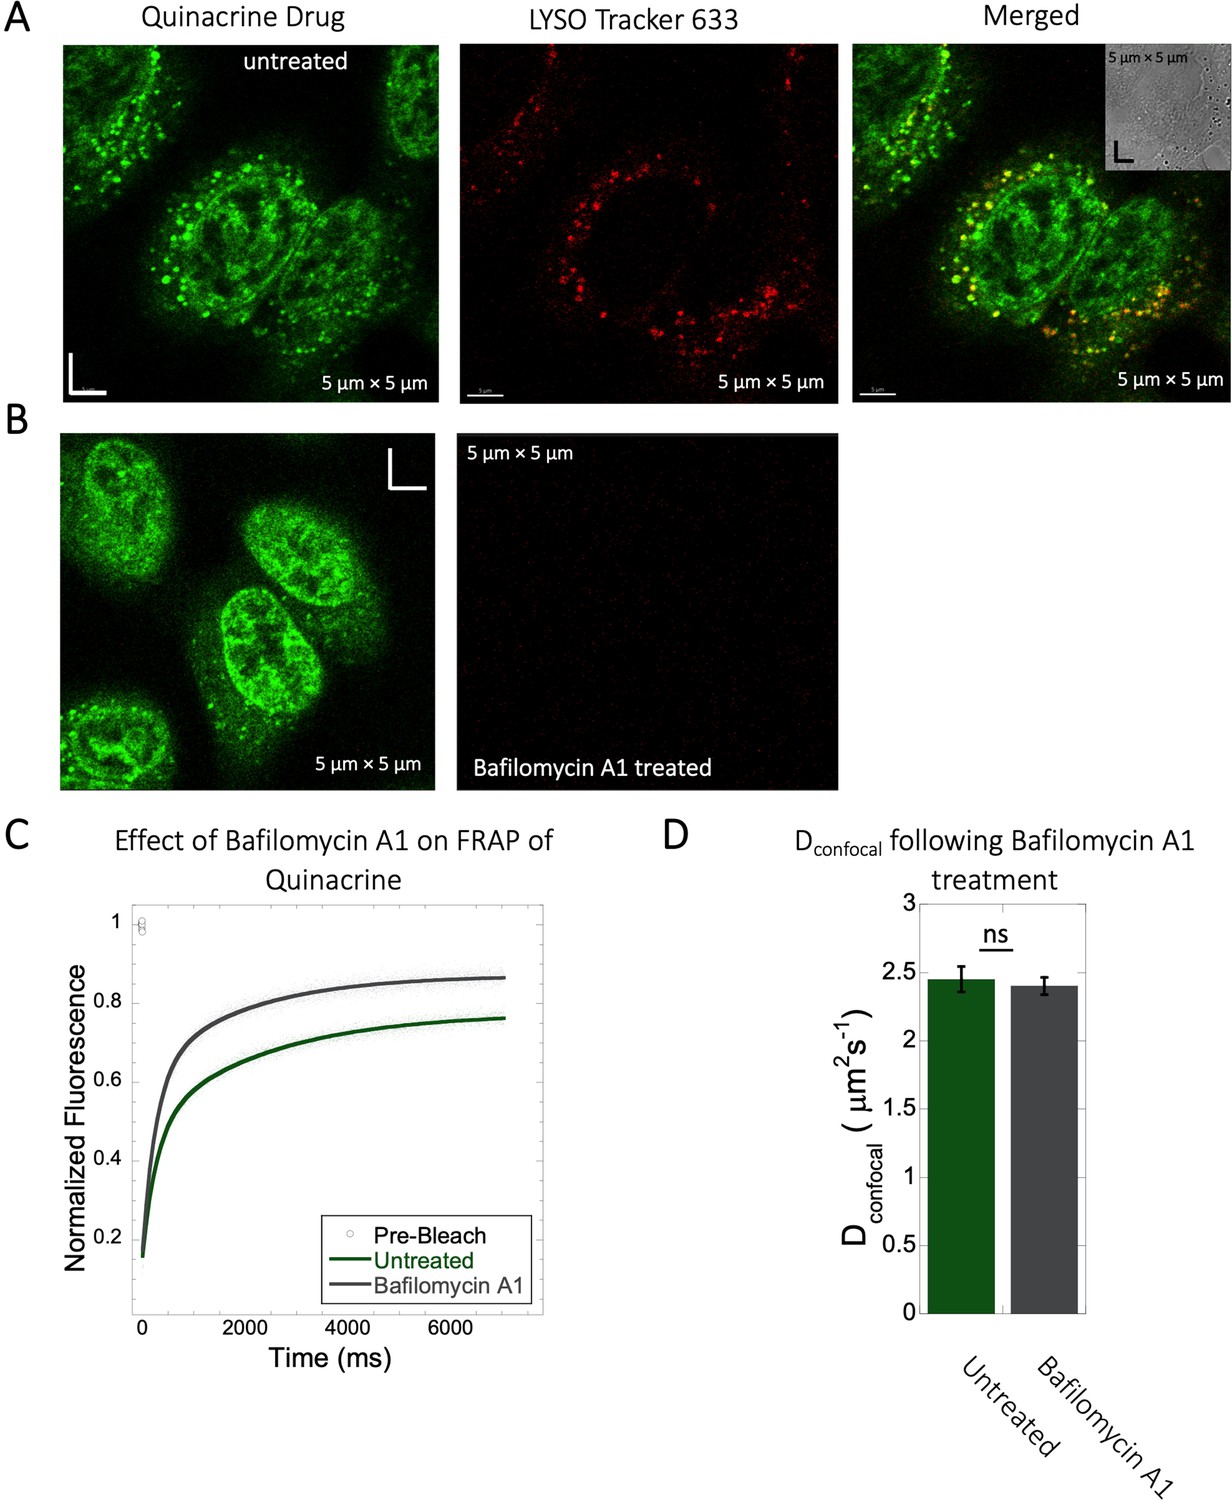
Inhibition of lysosomal accumulation of Quinacrine by Bafilomycin A1.
(A–B) Colocalization of Quinacrine with Lyso Tracker 633 in HeLa cells. HeLa cells (A) untreated and (B) treated with 100 nM Bafilomycin A1 and corresponding colocalizations. (C) Comparative averaged FRAP profiles with fits (N=30; R=0.99 for each of the fits) and (D) Dconfocal values with and without the Bafilomycin A1 treatment. Error bars represent SE calculated from fitting the FRAP progression curves, which are averaged over at least 30 independent measurements.
-
Figure 7—figure supplement 2—source data 1
Original data file of Figure 7—figure supplement 2 plots.
- https://cdn.elifesciences.org/articles/97255/elife-97255-fig7-figsupp2-data1-v1.xlsx
Figure 8 with 2 supplements
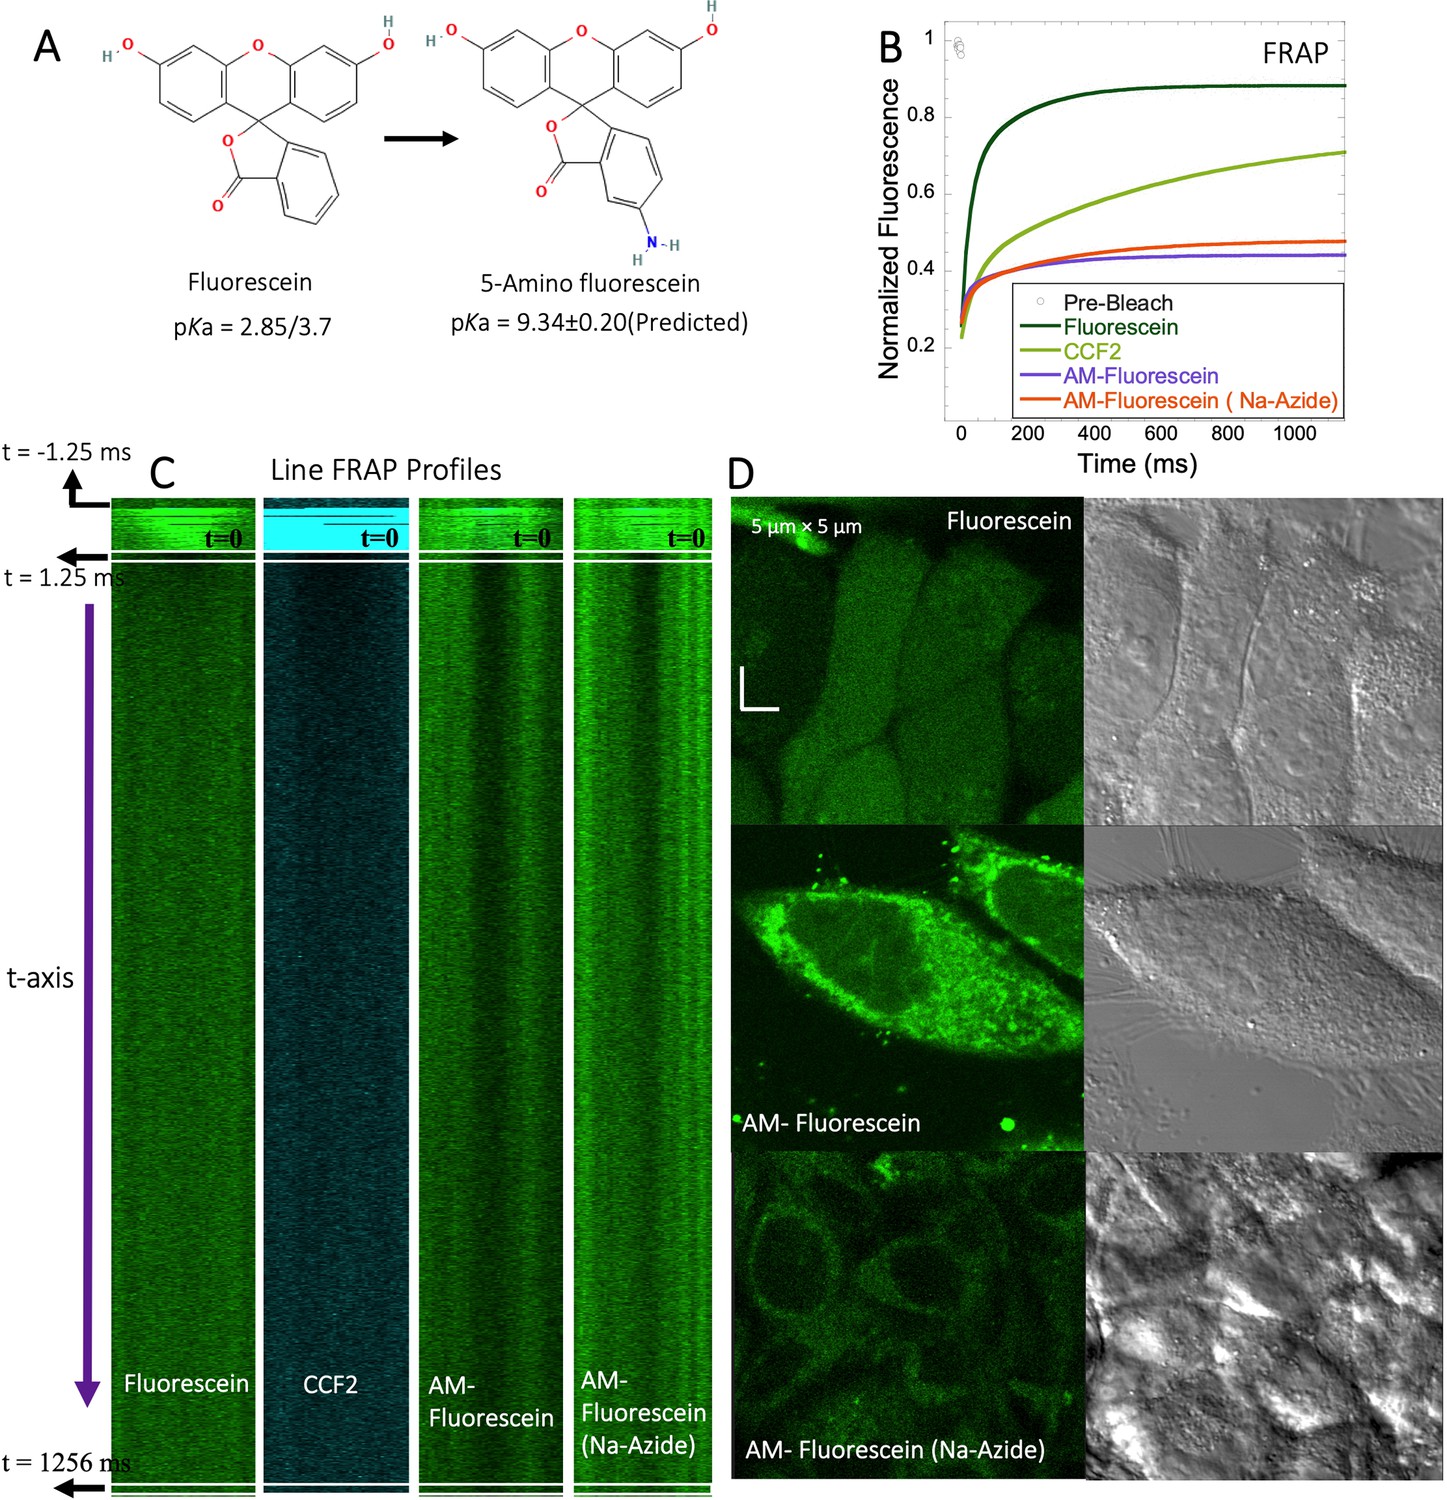
FRAP of Fluorescein analogues inside HeLa cells.
(A) Structures of Fluorescein analogues with pKa values. (B) FRAP recoveries with exponential fits for Fluorescein, CCF2 and 5-amino Fluorescein, with/without Na-Azide treatments in HeLa cells (N=30; R=0.99 for each of the fits). (C) Line FRAP profiles with time lapses. (D) Micrograph images of treated HeLa cells after small molecule incubations.
-
Figure 8—source data 1
Original data file of Figure 8 plots.
- https://cdn.elifesciences.org/articles/97255/elife-97255-fig8-data1-v1.xlsx
Figure 8—figure supplement 1
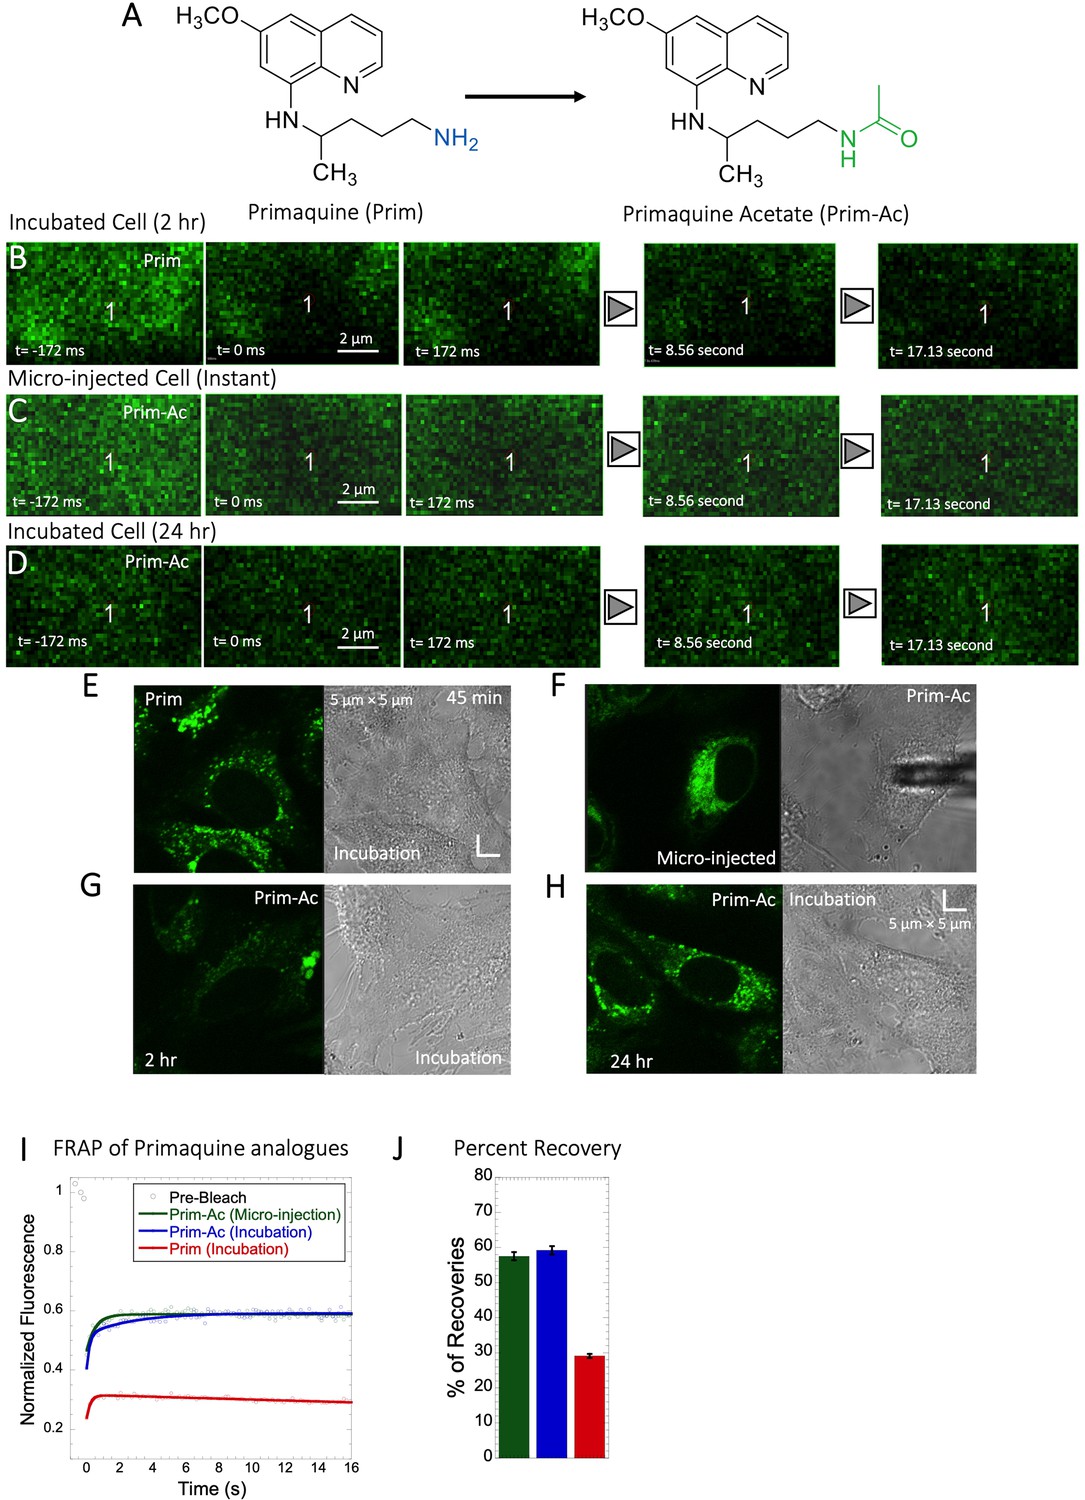
Comparative FRAP of Primaquine analogues in HeLa cell cytoplasm.
(A) Structures of Primaquine analogues. Comparative (B–D) XY FRAP micrographs with time lapses in HeLa cell. (E–H) Micrographs of treated HeLa cells either with micro-injection or after drug incubations with Prim or Prim-Ac. Comparative (I) XY-FRAP recovery profiles with fits (N=20; R=0.98 for each of the fits) and (J) percentage of recoveries for Primaquine analogues in HeLa cytoplasm (N=20).
-
Figure 8—figure supplement 1—source data 1
Original data file of Figure 8—figure supplement 1 plots.
- https://cdn.elifesciences.org/articles/97255/elife-97255-fig8-figsupp1-data1-v1.xlsx
Figure 8—figure supplement 2
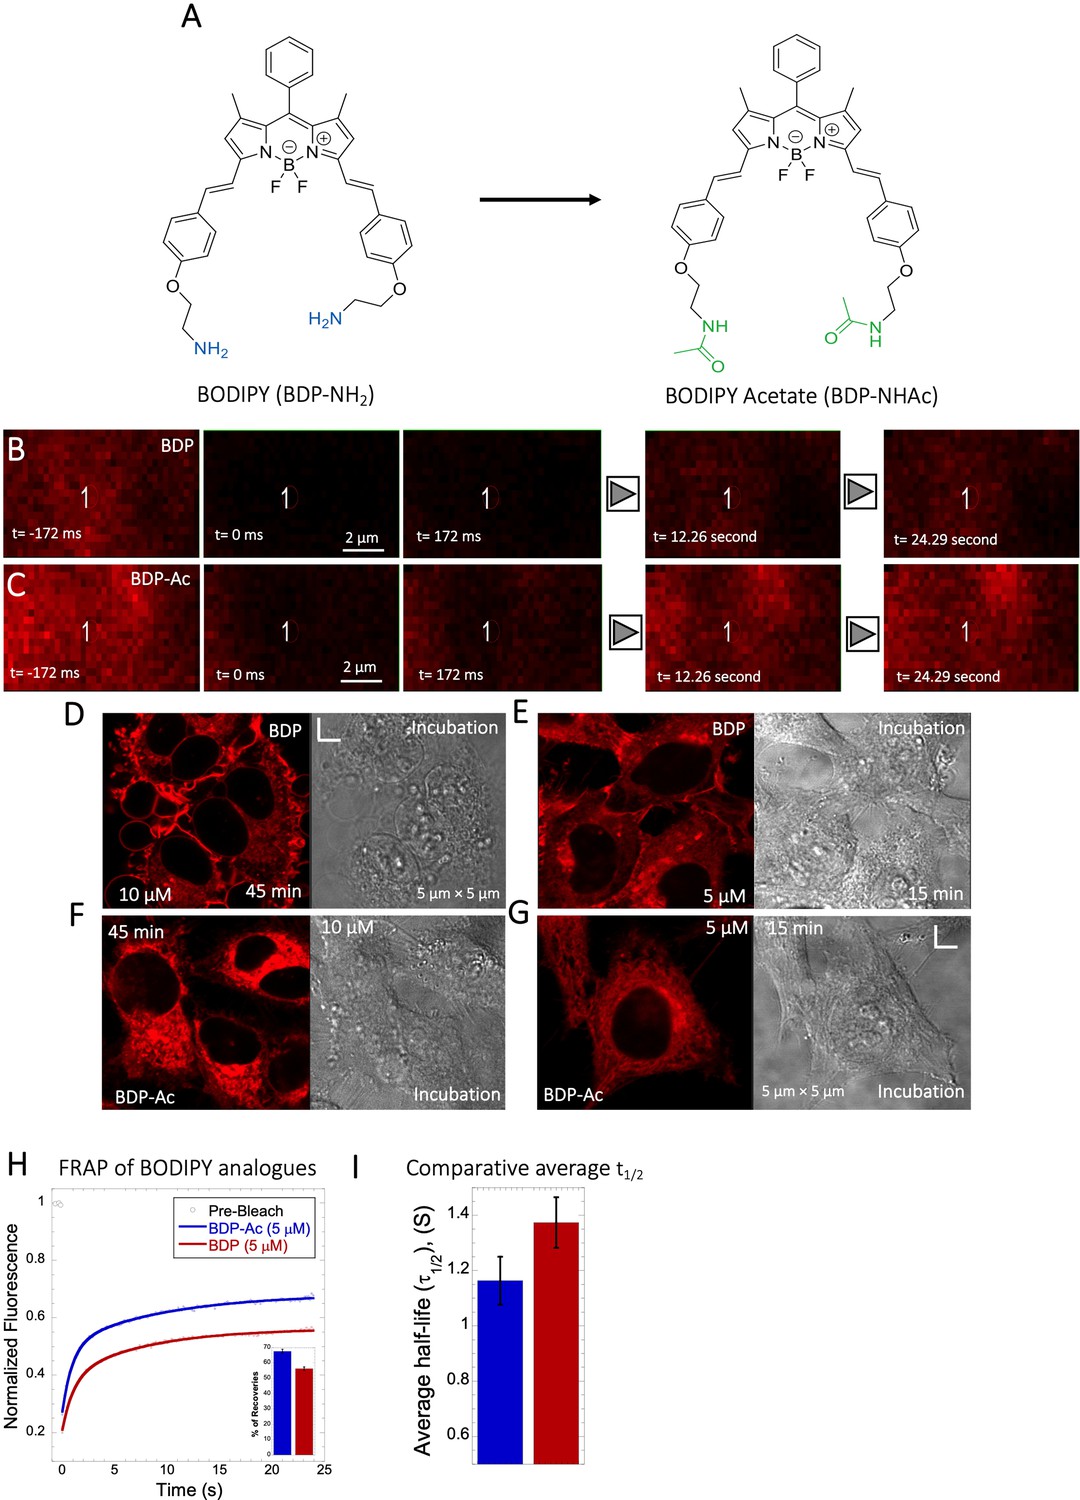
Comparative FRAP of BODIPY analogues in HeLa cell cytoplasm.
(A) Structures of BODIPY analogues. (B–C) Comparative XY FRAP micrographs with time lapses in HeLa cell cytoplasm. (D–G) Micrographs of treated HeLa cells after incubations (with BDP/BDP-Ac) and, Comparative (H) averaged XY-FRAP recovery profiles with fits (N=30; R=0.99 for each of the fits), (I) averaged half-life and percentage of recoveries for BODIPY analogues in HeLa cytoplasm (H) (N=30).
-
Figure 8—figure supplement 2—source data 1
Original data file of Figure 8—figure supplement 2 plots.
- https://cdn.elifesciences.org/articles/97255/elife-97255-fig8-figsupp2-data1-v1.xlsx
Figure 9 with 1 supplement
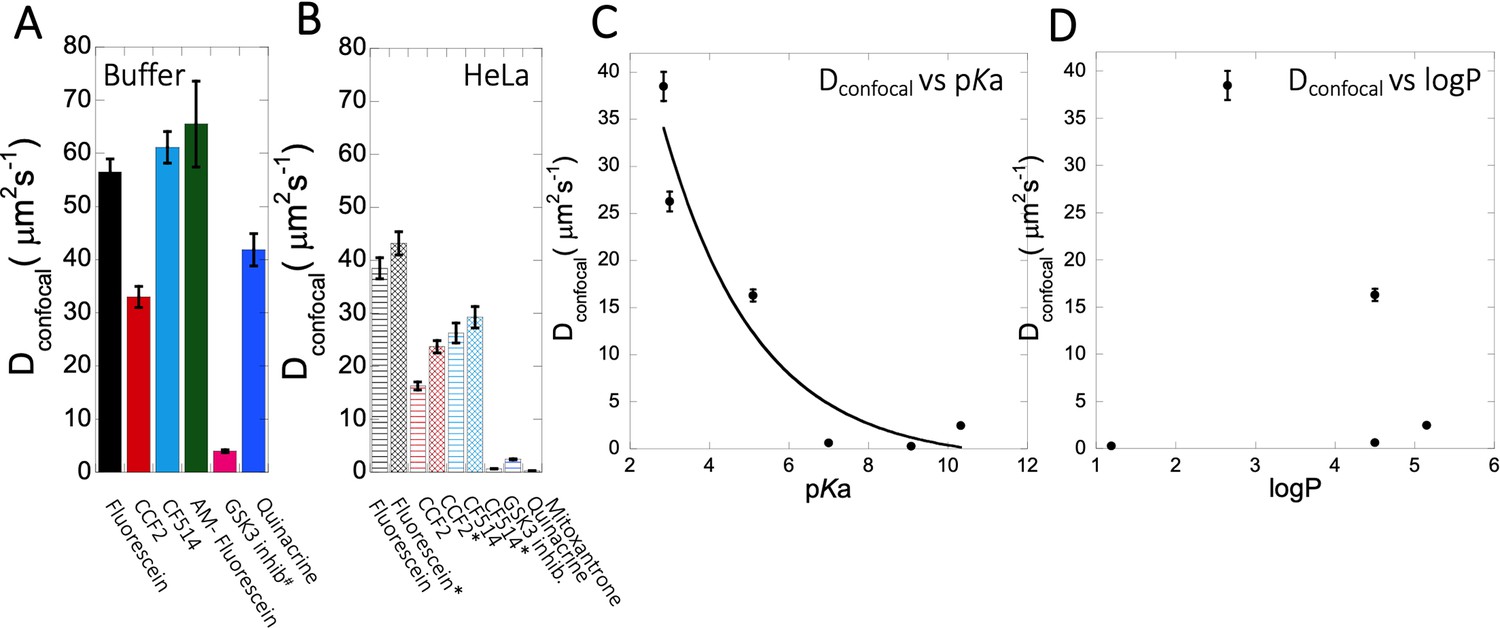
Dconfocal of small molecules in PBS buffer and inside HeLa cells.
Comparison of Dconfocal values of small molecule drugs in (A) PBS buffer and in (B) HeLa cells. Error bars represent SE calculated from fitting the FRAP progression curves, which are averaged over at least 30 independent measurements. Dependency of Dconfocal values on (C) pKa and (D) logP values in HeLa cells. # in (A) denotes DMEM media (instead of PBS), * in (B) denotes measurements done in the nucleus.
-
Figure 9—source data 1
Original data file of Figure 9 plots.
- https://cdn.elifesciences.org/articles/97255/elife-97255-fig9-data1-v1.xlsx
Figure 9—figure supplement 1
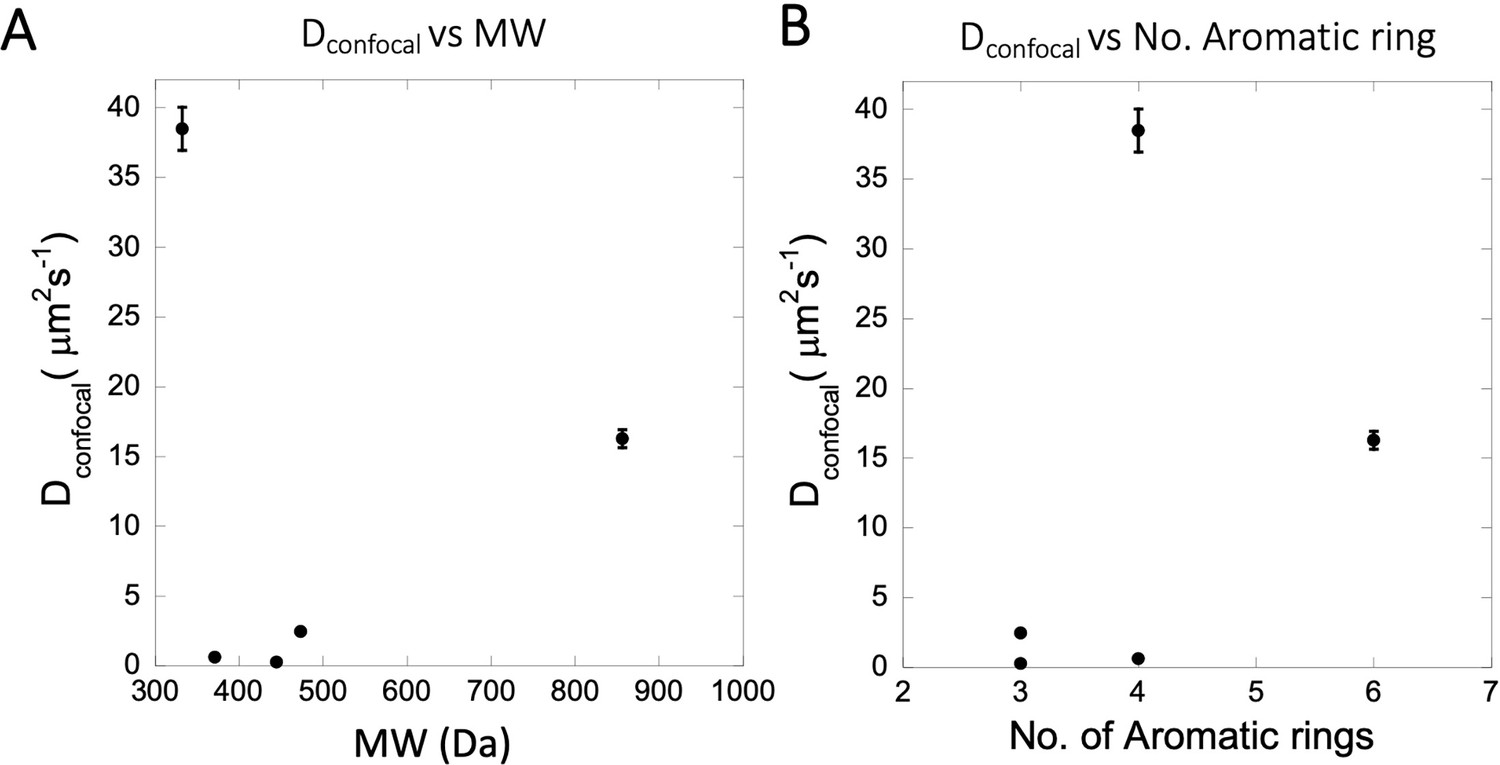
Dependency of Dconfocal rates on MW, number of aromatic rings.
(A) Dependency of Dconfocal on molecular weight (MW). (B) Dependency of Dconfocal on the number of aromatic rings in the drugs.
-
Figure 9—figure supplement 1—source data 1
Original data file of Figure 9—figure supplement 1 plots.
- https://cdn.elifesciences.org/articles/97255/elife-97255-fig9-figsupp1-data1-v1.xlsx
Appendix 1—scheme 1

Chemical structures of Primaquine and N-acetylated Primaquine.
Appendix 1—scheme 2
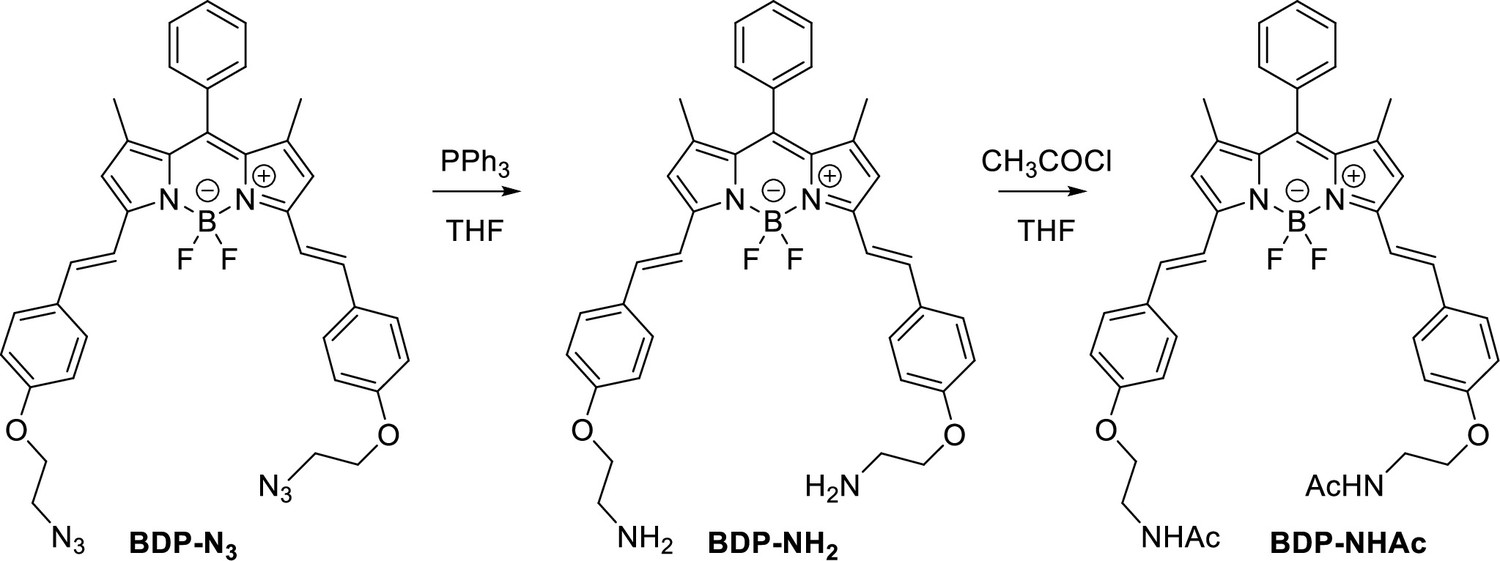
Chemical synthesis scheme of BODIPY analogues.
Appendix 1—figure 1
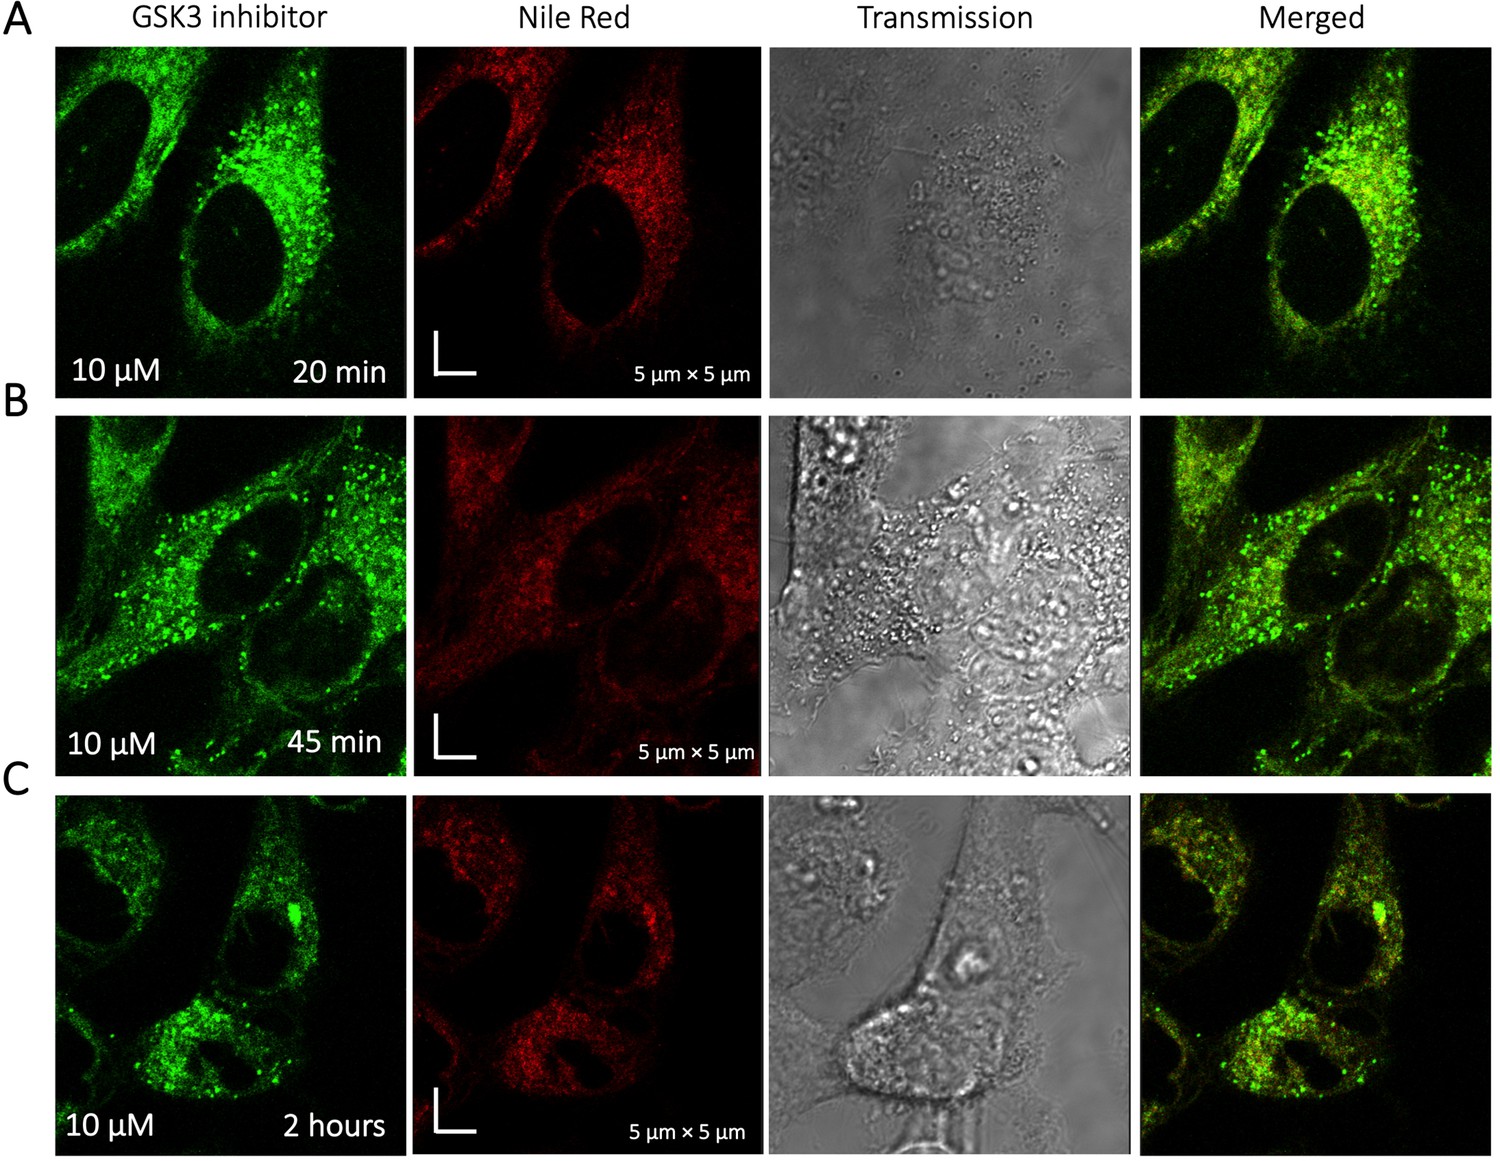
Time dependent colocalization of GSK3 inhibitor and Nile Red in HeLa cell cytoplasm.
Panels (A–C) show Nile red accumulating in lipid droplets, while GSK3 inhibitor does not colocalize.
Appendix 1—figure 2
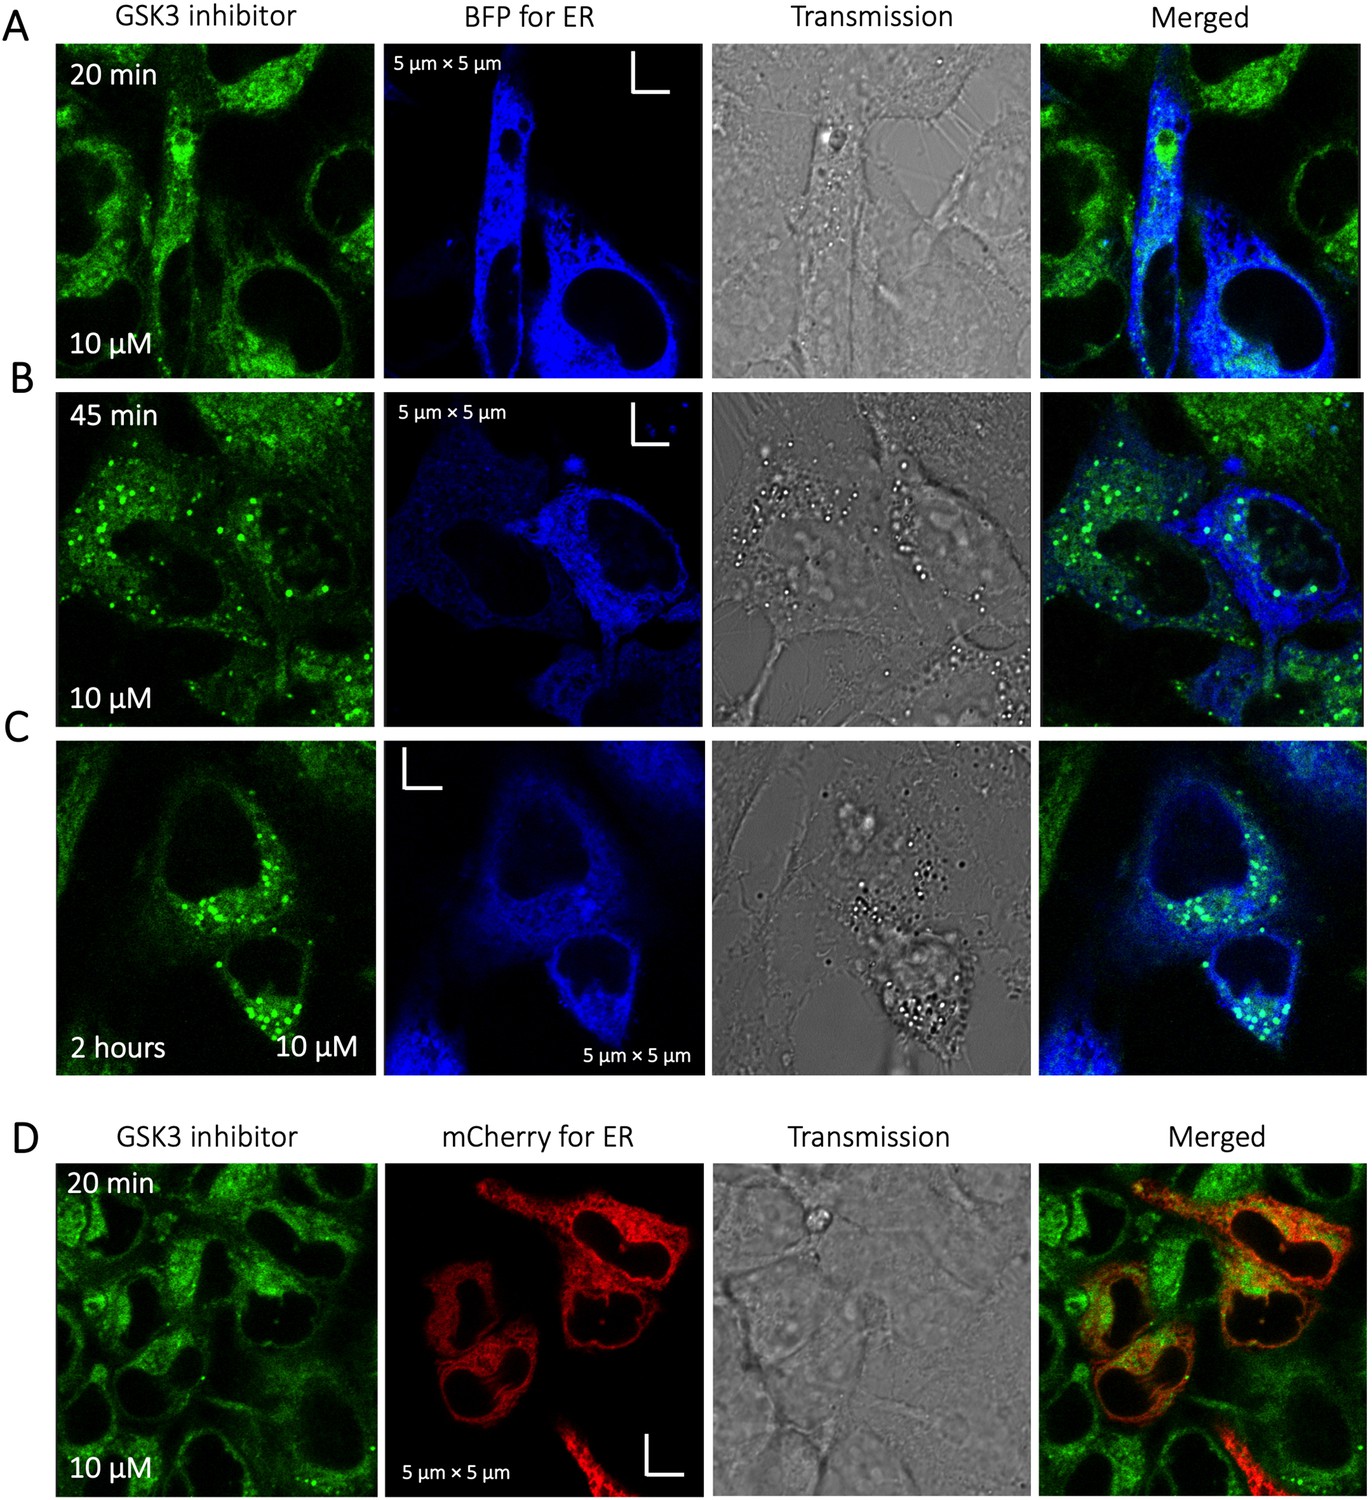
Time dependent colocalization of GSK3 inhibitor and ER marker in HeLa cell cytoplasm.
Panels (A–D) show BFP/mCherry fused antibody marker accumulating in ER, but GSK3 inhibitor does not colocalize. HeLa cells were first transiently transfected with BFP/mCherry fused antibody markers, then treated with GSK3 inhibitor.
Appendix 1—figure 3
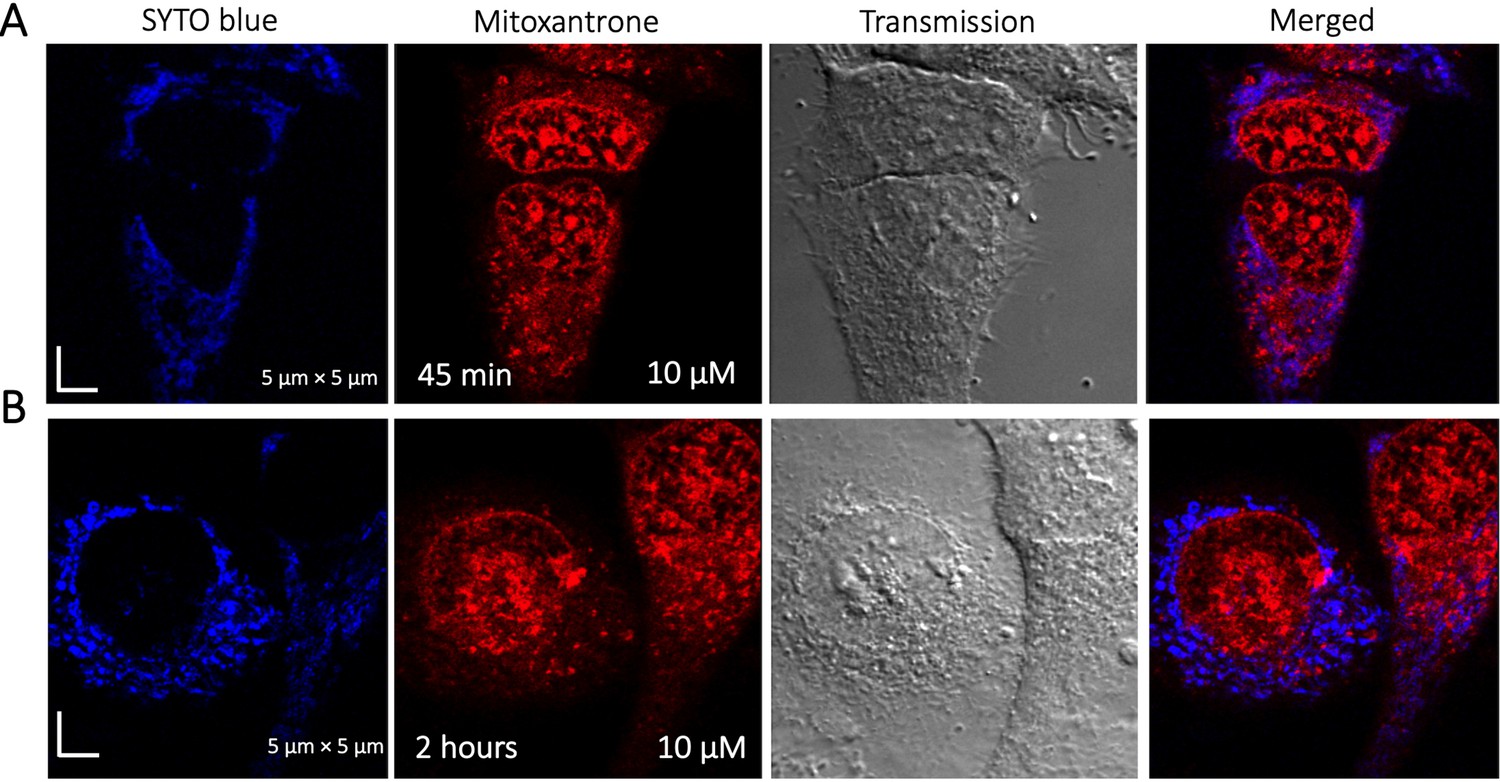
Time dependent colocalization study of Mitoxantrone and SYTO blue marker in HeLa cells.
Panels (A–B) show SYTO blue marker accumulating in nucleic acids, but Mitoxantrone is not colocalized. HeLa cells were first treated with SYTO blue, then treated with Mitoxantrone.
Appendix 1—figure 4
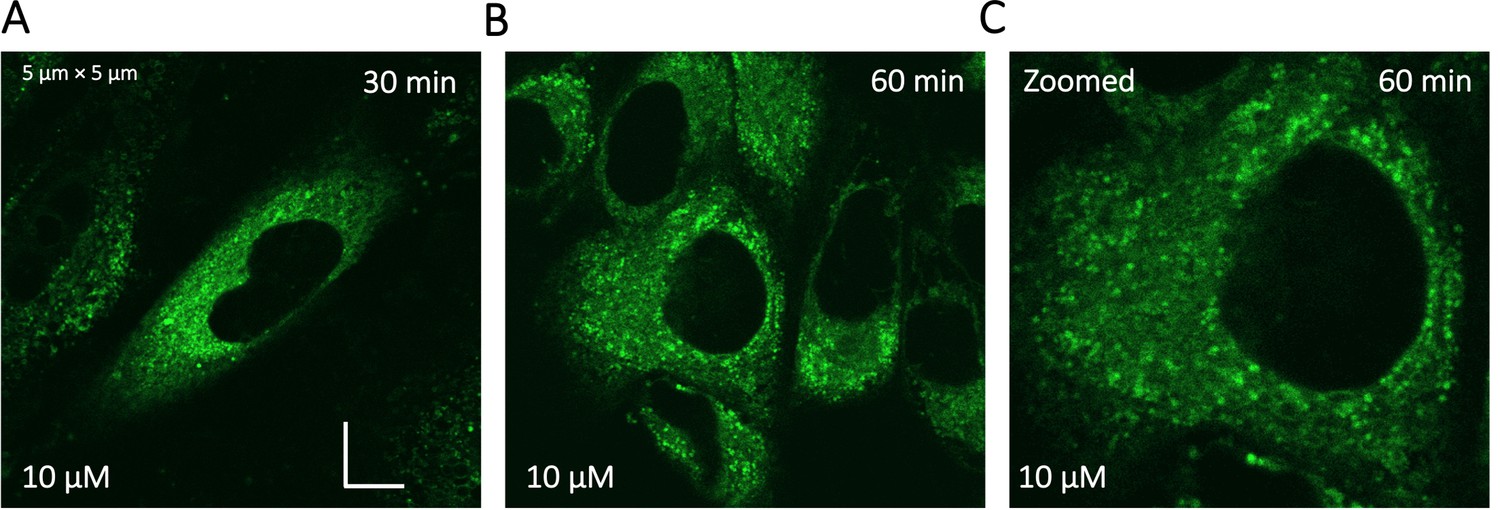
Super resolution images of GSK3 inhibitor treated HeLa cells.
Micrographs were taken using a Zeiss LSM900 microscope.
Appendix 1—figure 5
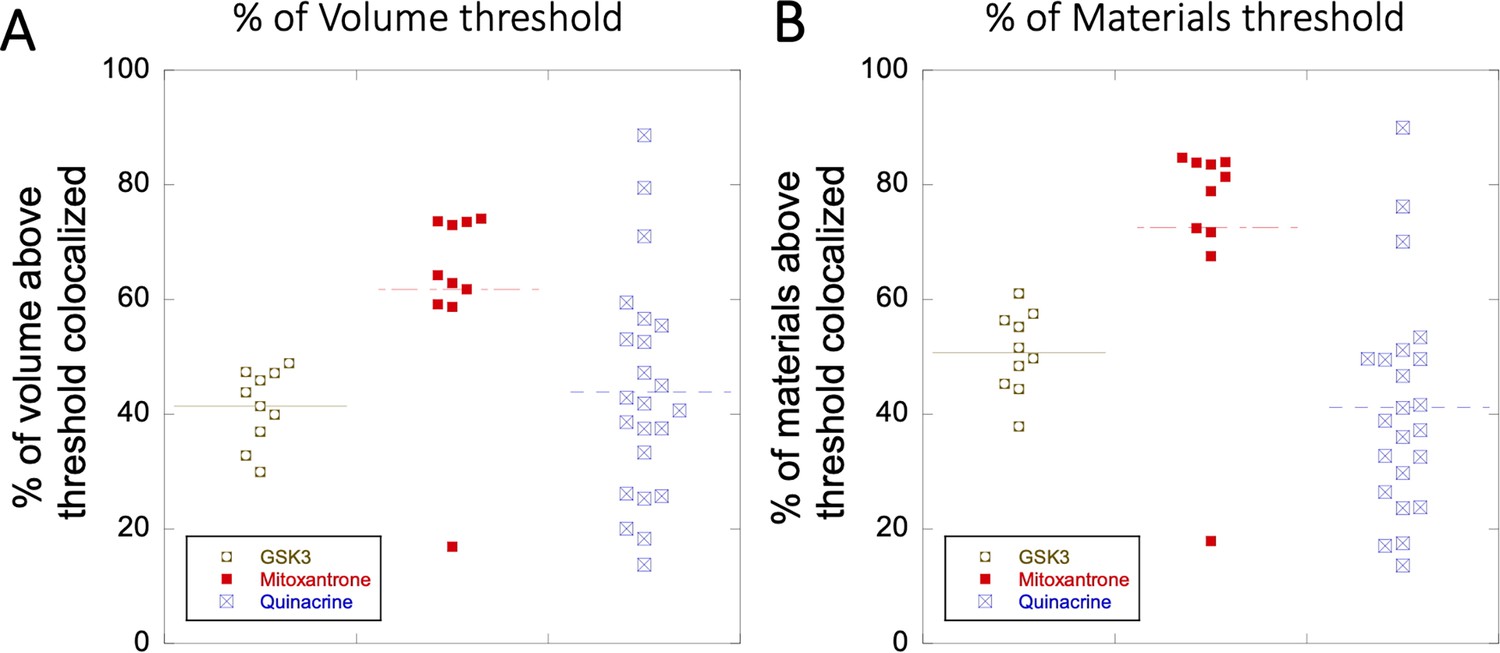
Colocalization within Lysosomes.
(A–B) Comparison of percentage of colocalization among GSK3 inhibitor vs Mitoxantrone vs Quinacrine in acidic lysosomes are shown. Each dot represents 4–5 stained cells in a single frame acquisition. Colocalization study for GSK3 inhibitor and Quinacrine was done with commercial Lyso tracker-633, and for Mitoxantrone using Quinacrine itself used as a Lyso tracker dye.
-
Appendix 1—figure 5—source data 1
Original data file of Appendix 1—figure 5 plots.
- https://cdn.elifesciences.org/articles/97255/elife-97255-app1-fig5-data1-v1.xlsx
Appendix 1—figure 6
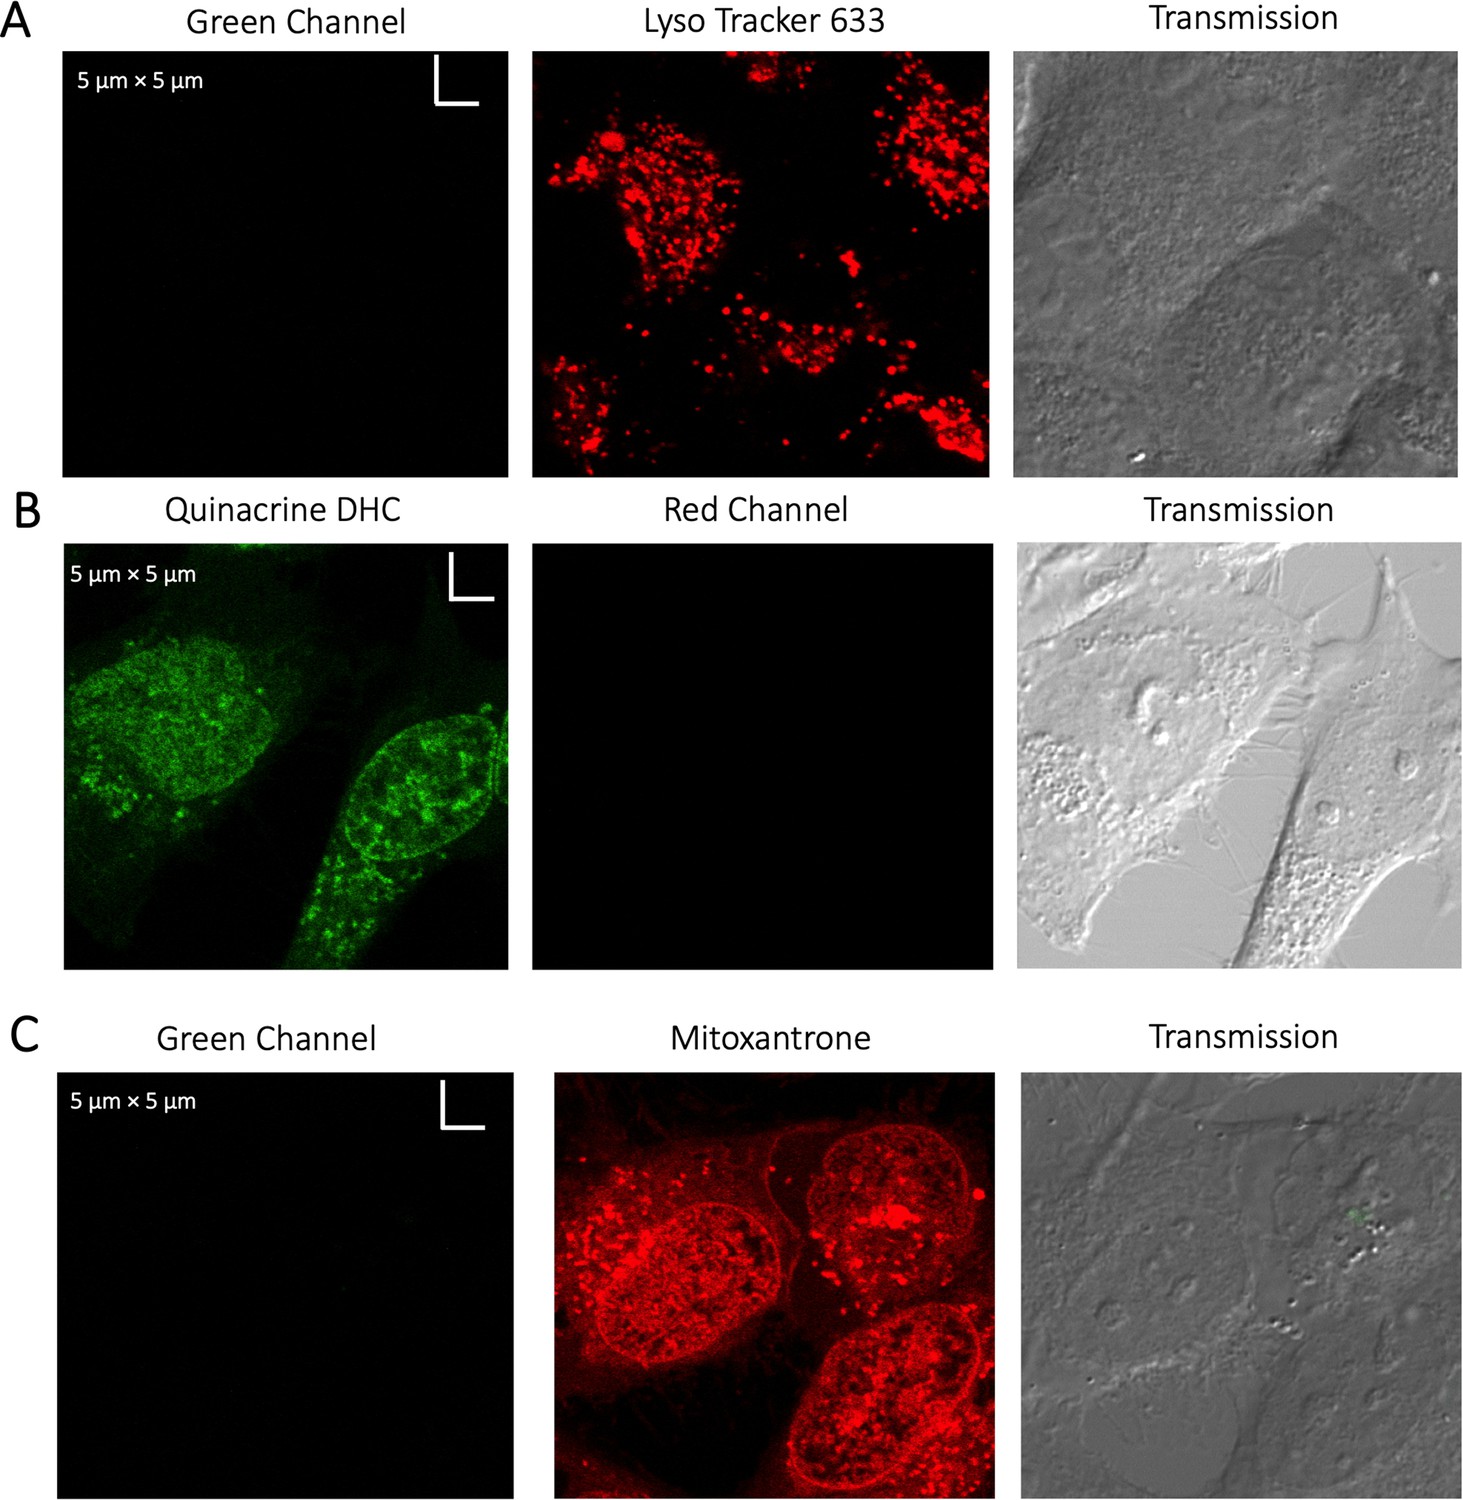
Evaluating channel leakage.
Control experiments showing that channel leakage did not occur during colocalization studies. (A) Lyso-Tracker only, (B) Quinacrine only and (C) Mitoxantrone only.
Appendix 1—figure 7
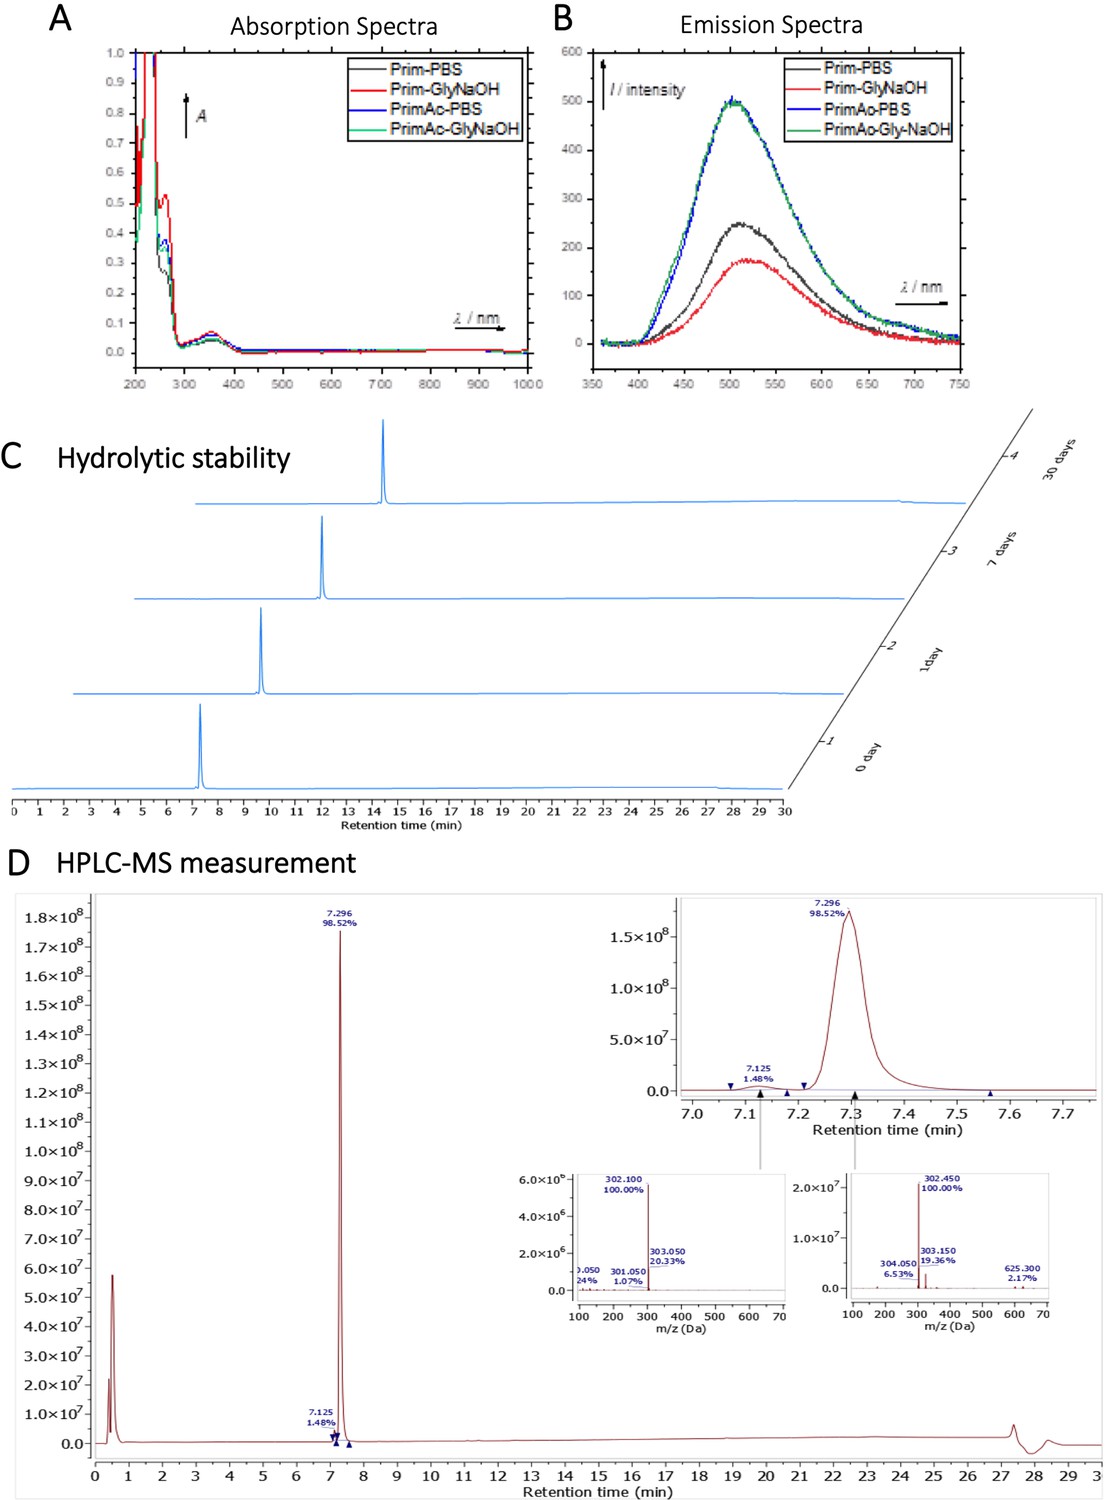
Characterization of Primaquine (Prim) and N-acetylated Primaquine (PrimAc).
(A) Absorption (c ≈ 1 ∙ 10–3) and (B) emission (c ≈ 3 ∙ 10–4) spectra. Both experiments were measured in the mixture of 10% DMSO in PBS or in Glycine/NaOH buffer. (C) Measurement of hydrolytic stability by HPLC. (D) HPLC-MS measurement of PrimAc are shown. According to HPLC-MS data the peak at 7.125 corresponds to 302 m/z (ESI +) so as the main peak at 7.296. The molar mass of PrimAc corresponds to the measured value.
Appendix 1—figure 8
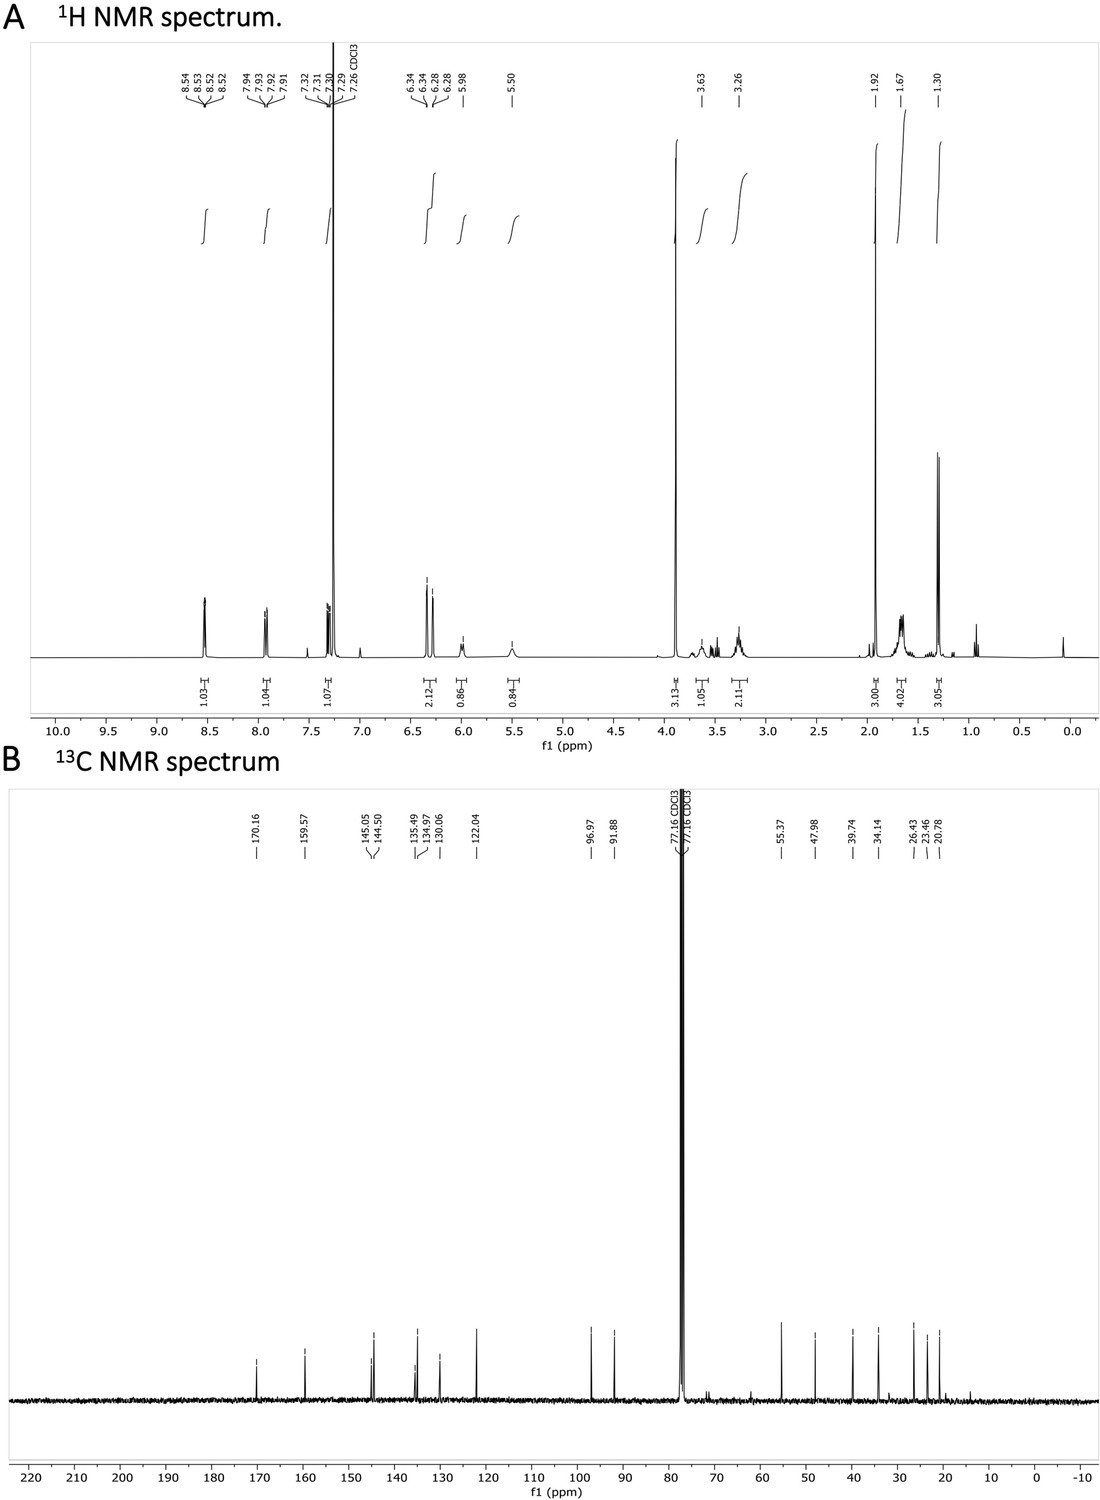
N-acetylated Primaquine.
(A) 1H NMR spectrum is shown. The presence of impurities is caused by the degradation in the used solvent. (B) 13C NMR spectrum is shown.
Appendix 1—figure 9
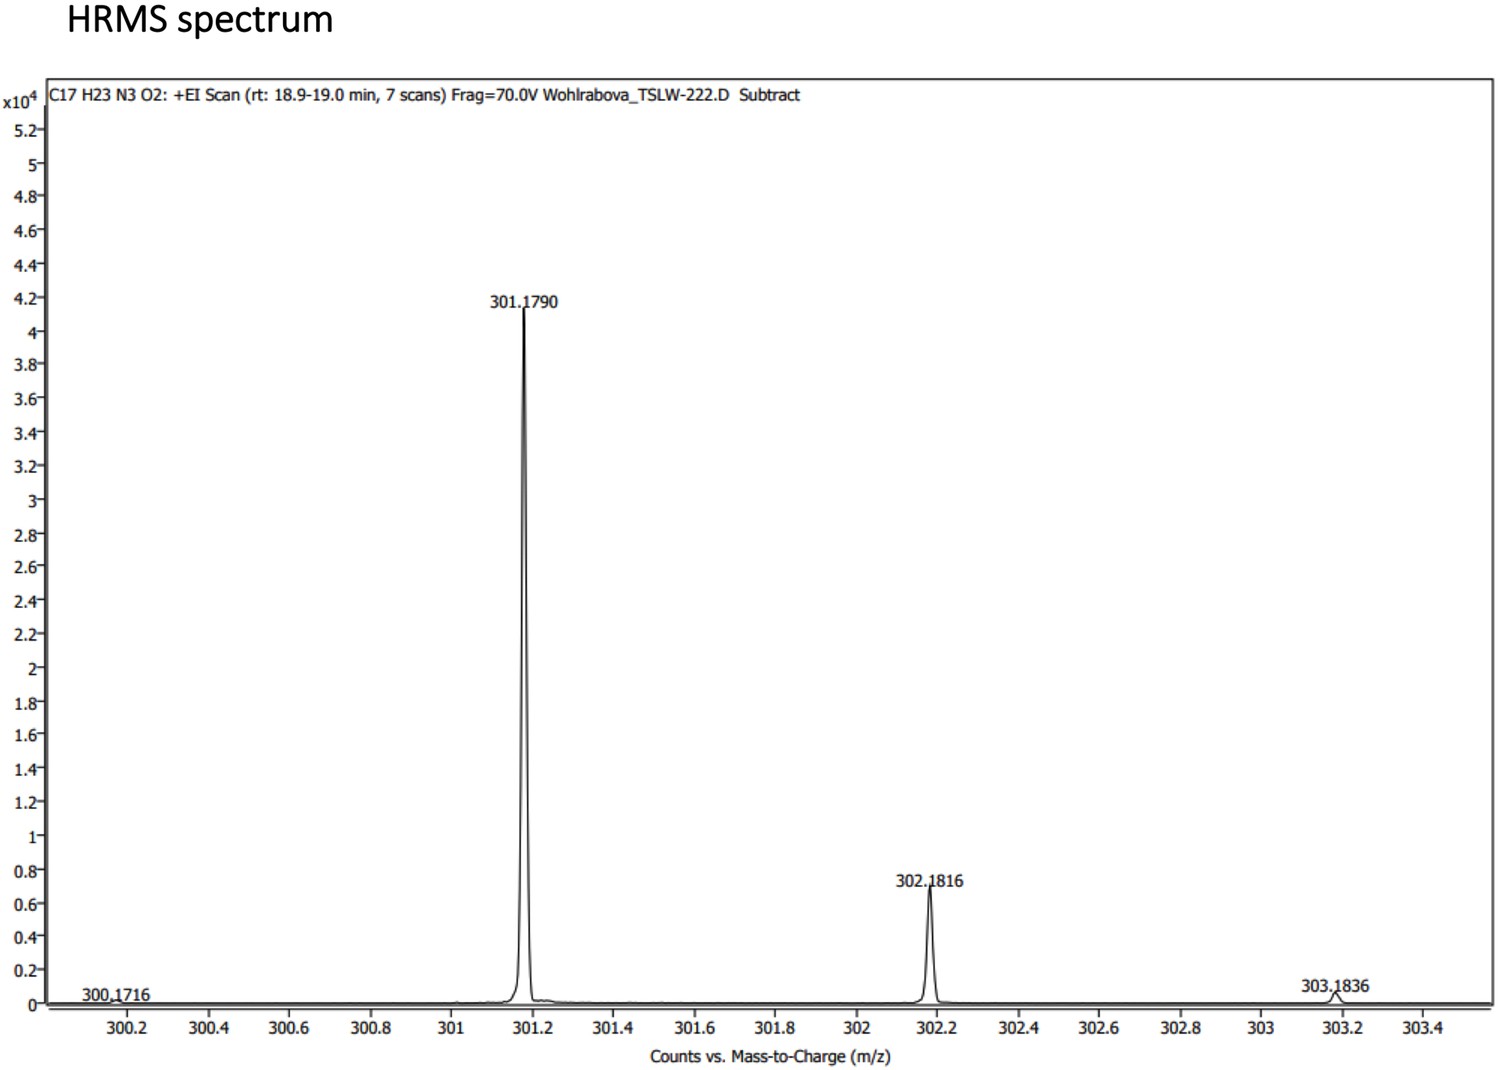
N-acetylated Primaquine.
HRMS spectrum (+EI) is shown.
Appendix 1—figure 10
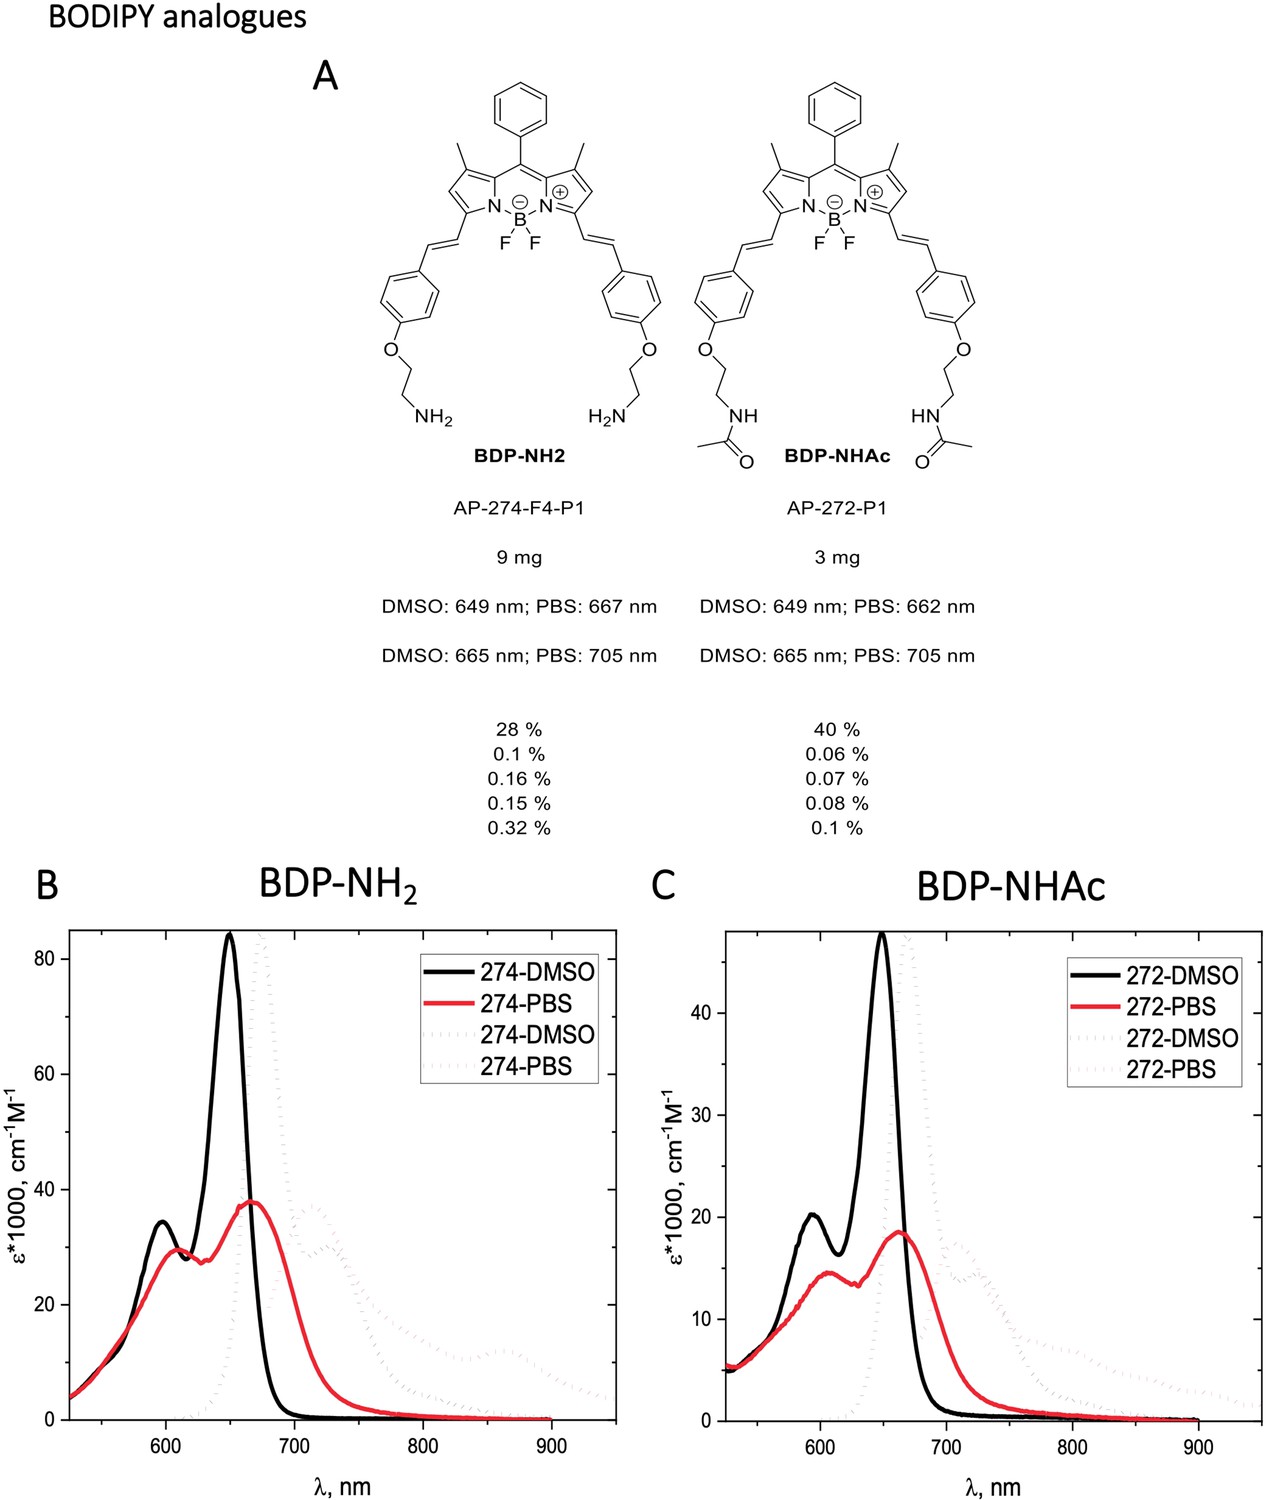
Structure, photo-physical properties & Absorption/Emission spectra of BODIPY analogues.
(A) Structure and photo-physical properties of BODIPY analogues. (B) Absorption (full line) and emission spectra (dashed line) of BDP-NH2 in DMSO (black) and PBS (red) are shown. (C) Absorption (full line) and emission spectra (dashed line) of BDP-NHAc in DMSO (black) and PBS (red) are shown.
Appendix 1—figure 11
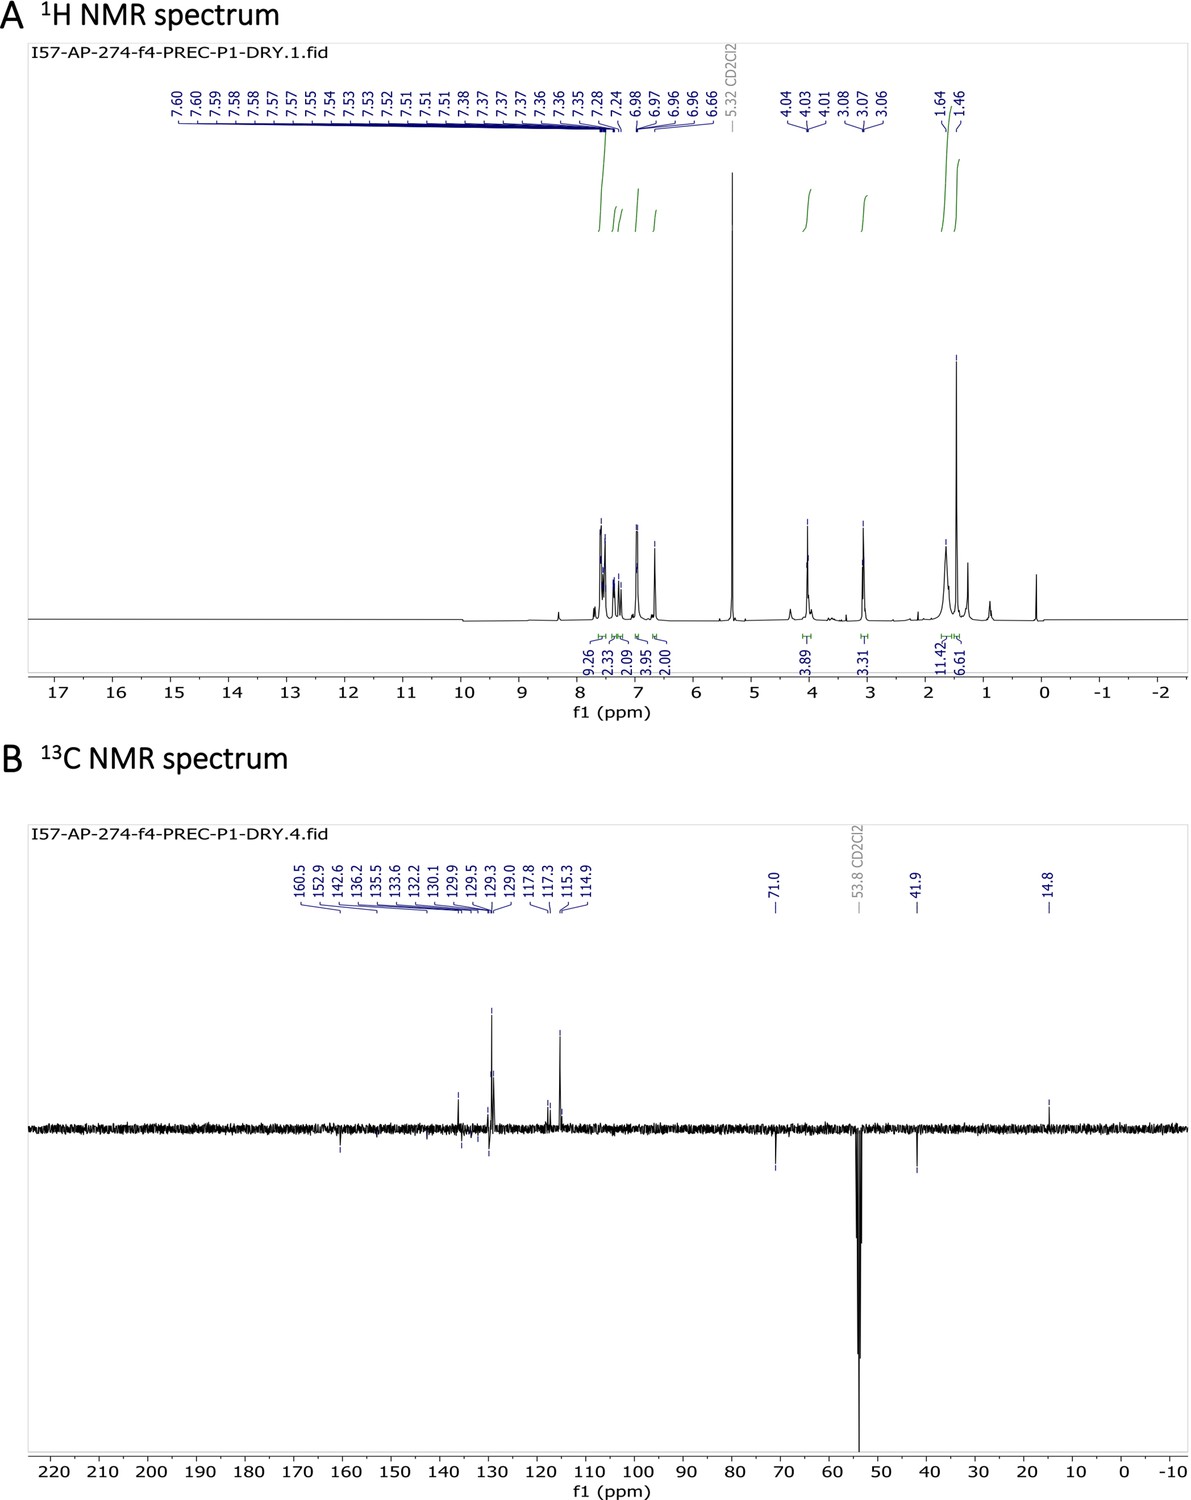
Characterization of BODIPY-NH2.
(A) 1H NMR spectrum and (B) 13C NMR spectrum are shown.
Appendix 1—figure 12
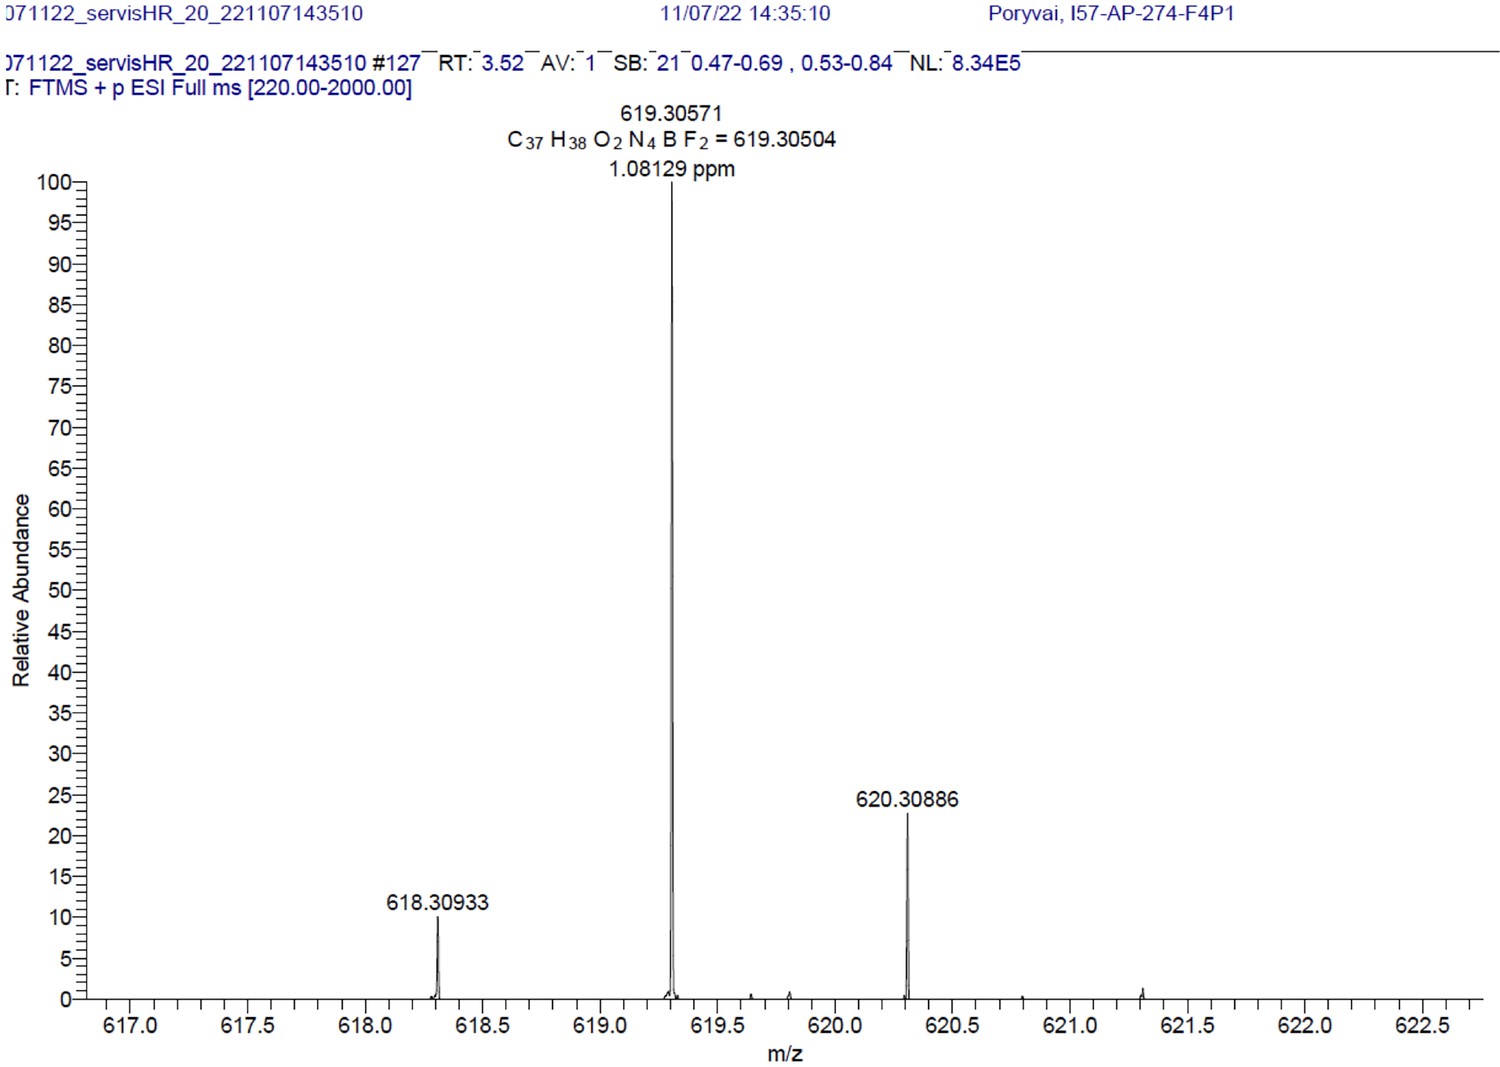
BODIPY-NH2.
HRMS spectrum (+EI) is shown.
Appendix 1—figure 13
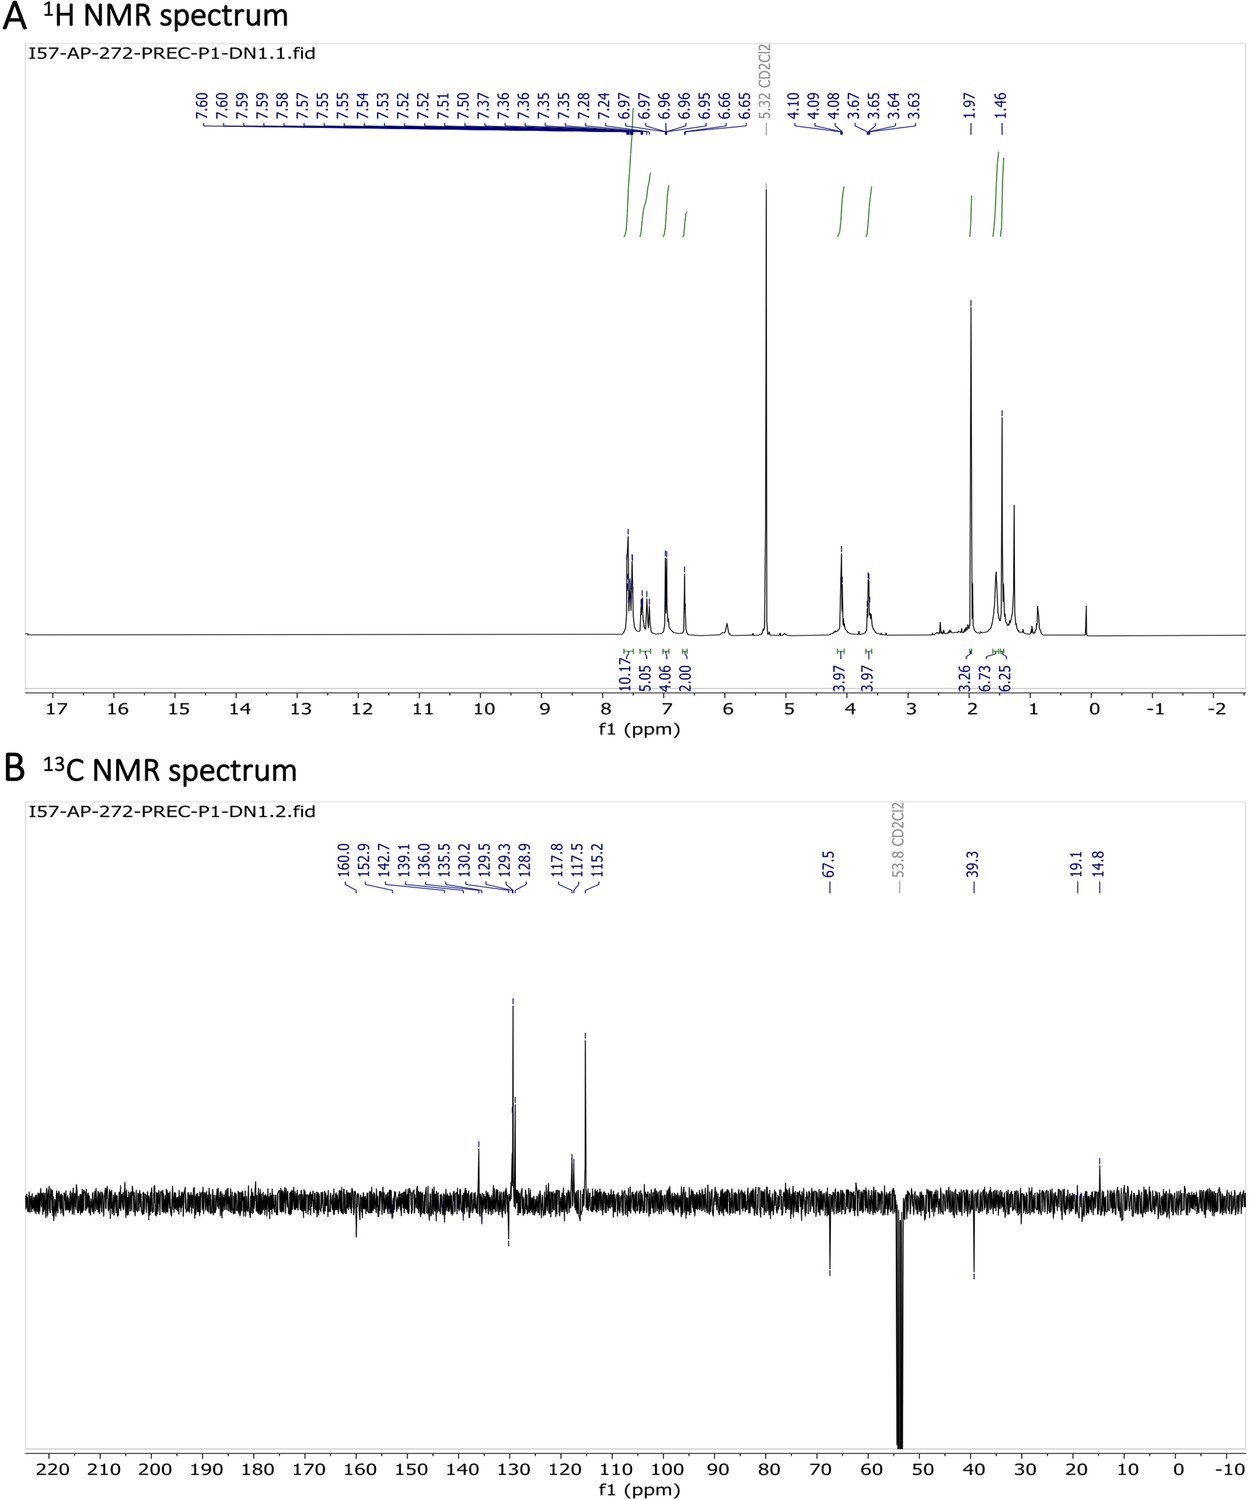
Characterization of BODIPY-NHAc.
(A) 1H NMR spectrum and (B) 13C NMR spectrum are shown.
Appendix 1—figure 14
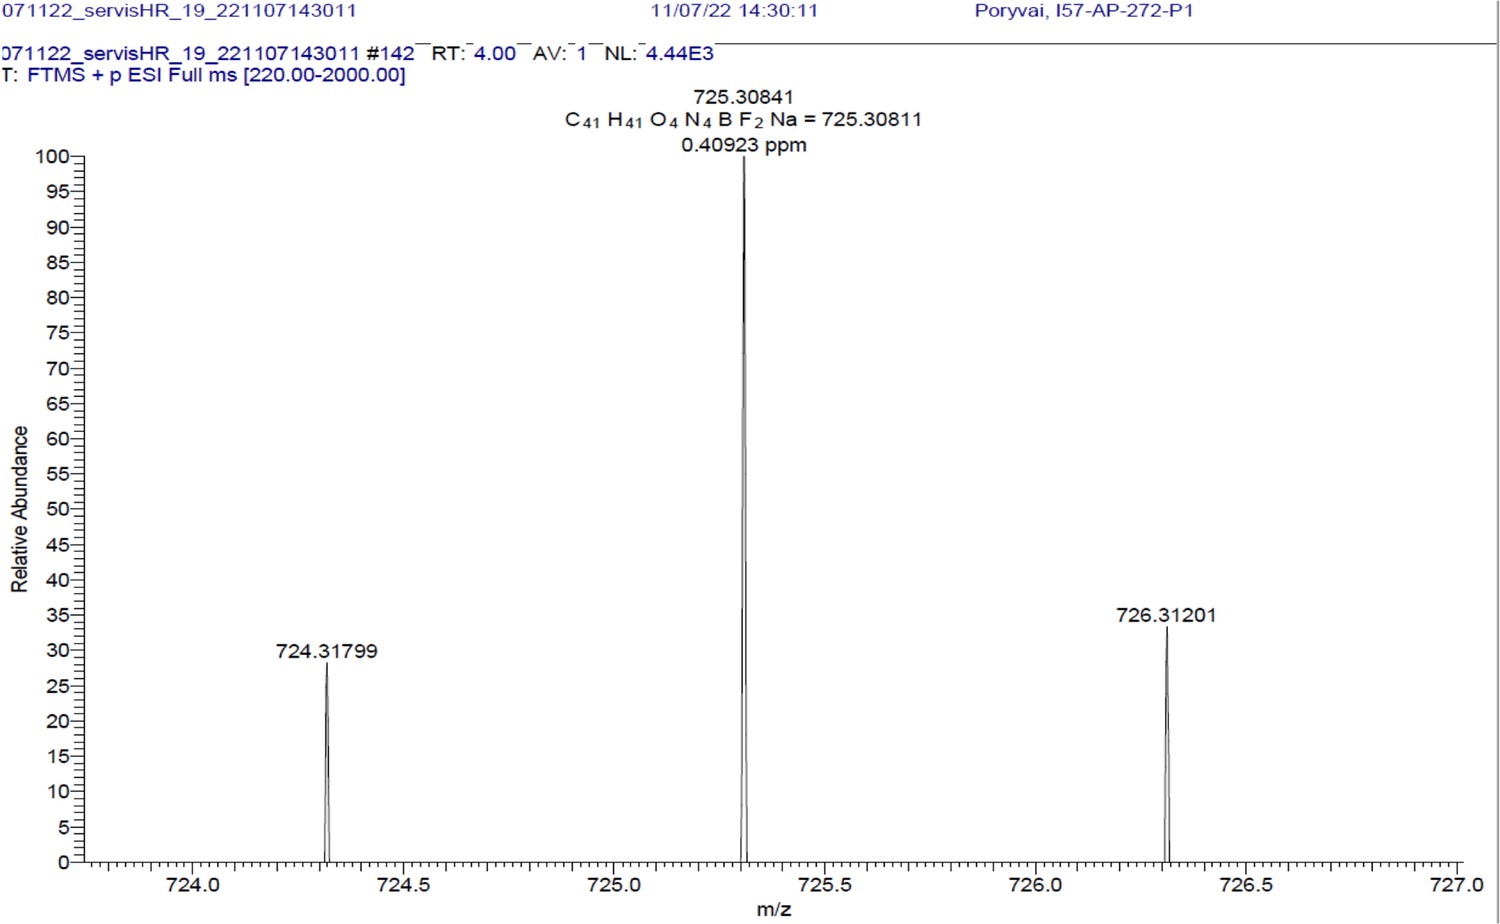
BODIPY-NHAc.
HRMS spectrum (+EI) is shown.
Tables
Table 1
LogP, pKa and lysosomal sequestration of drugs used in this study.
(Predicted by ChemAxon software, and obtained from drug bank data base Zhitomirsky and Assaraf, 2015).
| Therapeutic indication | Drug/small molecules | Calculated LogP | Calculated pKa(strongest basic) | Lysosomal sequestration |
|---|---|---|---|---|
| Anti-cancer | mitoxantrone | 1.19 | 9.08 | + |
| Antimalarial | quinacrine | 5.15 | 10.33 | + |
| primaquine-biphosphate | 1.64 | 10.4 | + | |
| amodiaquine | 4.83 | 8.66 | + | |
| Other small molecules | 5-Amino fluorescein | 3.02 | 9.34 | + |
| fluorescein-Sodium Salt | 2.65 | 2.85/3.7 | - | |
| GSK3 inhibitor (SB216763) | 4.5 | 7 | + | |
| BODIPY-NH2 | _ | 9.00 | _ | |
| BODIPY-NHAc | _ | _ | _ | |
| CCF2 | 4.5 | 5.1 | _ | |
| CF514 | _ | ~3.0 (from UV spectrum) | _ | |
| Values of pKa were estimated using ChemAxon. Lysosomal sequestration was taken from the in-cell micrographs in this work. | ||||
Key resources table
| Reagent type (species) or resource | Designation | Source or reference | Identifiers | Additional information |
|---|---|---|---|---|
| Gene (E.coli) | nfuA, nadK, fabG, sodA, tpiA, gpmA, can, upp, speB, ispD, acuL, thiD, pyrF, nadE, crp | Extracted by qPCR from BL21 E. coli K12 | Marciano et al., 2022 | |
| Cell line (Human) | HeLa cell line | Epithelial cell | RRID: CVCL_0030 | |
| Peptide, recombinant protein | nfuA, nadK, fabG, sodA, tpiA, gpmA, can, upp, speB, ispD, acuL, thiD, pyrF, nadE, crp | Genes were cloned into pET-His- bdSumo and purified as described | Marciano et al., 2022 | |
| Chemical compound, drug | Dulbecco’s phosphate-buffered saline (PBS 1 X) | Biological Industries | Cat# 02-023-1A | |
| Chemical compound, drug | HEPES buffer | Fisher BioReagents | LOT# 170358 | |
| Chemical compound, drug | DMEM(1 X) Gibco | Life Technologies Limited | REF# 41965–039 | |
| Chemical compound, drug | Fetal Bovine Serum (Gibco) | Life Technologies Limited | REF# 12657–029 | |
| Chemical compound, drug | Trypsin-EDTA Solution A | Biological Industries | REF# 03-050-1B | |
| Chemical compound, drug | Penicillin/ Streptomycin | Biological Industries | REF# 03-031-1B | |
| Chemical compound, drug | Sodium Pyruvate Solution | Biological Industries | REF# 03-042-1B | |
| Chemical compound, drug | 35 mm glass-bottomed dishes | MatTek Corporation | P35G-0–14 C | |
| Chemical compound, drug | Pierce Dye Removal Columns | Thermo-Fisher scientific | Cat# 22858 | |
| Chemical compound, drug | Gebaflex tubes 3.5 KDa (GeBa) | TIVAN BIOTECH | Cat# MIDI3-100 | |
| Chemical compound, drug | Capillary Glass Tubing | Warner Instruments | Model No. G120TF-4 203-776-0664 | |
| Chemical compound, drug | well Black F-Bottom Plate | Greiner-bio-one | REF# 655076 | |
| Chemical compound, drug | Disposable cuvettes | Fisher Scientific | ZEN0040 | |
| Chemical compound, drug | BSA (Albumin Bovine, fraction V) | MP Biomedicals, LLC | CAS# 9048-46-8 | |
| Chemical compound, drug | HEWL (Lysozyme from chicken egg white) | Merck | CAS# 12650-88-3 | |
| Chemical compound, drug | Myoglobin (from equine heart) | Merck | CAS# 100684-32-0 | |
| Chemical compound, drug | Doxorubicin | AdooQ Bioscience | Cat# A14403 | |
| Chemical compound, drug | Fluorescein disodium salt | chemcruz | Cat# sc-206026 | |
| Chemical compound, drug | GSK3 inhibitor SB216763 | Abcam | Cat# ab120202 | |
| Chemical compound, drug | Quinacrine dihydrochloride | Abcam | Cat# ab120749 | |
| Chemical compound, drug | Primaquine biphosphate | Merck | CAS# 63-45-6 | |
| Chemical compound, drug | CCF2-FA | Thermo-Fisher Scientific | Cat# K1039a | |
| Chemical compound, drug | CF514 Labelling dye | Biotium | CF514 Dye Alternative green fluorescent dye | |
| Chemical compound, drug | Amodiaquine | AdooQ Bioscience | Cat# A17660 | |
| Chemical compound, drug | Sodium Azide | Merck | CAS# 26628-22-8 | |
| Chemical compound, drug | Mitoxantrone | Abcam | Cat# ab141041 | |
| Chemical compound, drug | Bafilomycin A1 | Abcam | Cat# ab120497 | |
| Chemical compound, drug | 5-amino Fluorescein | Abcam | Cat#ab145305 |
Appendix 1—table 1
Oligomeric state, Isoelectric point and Net charge at pH 7.4.
| Protein entry | Isoelectric point: pI | Net charge at pH 7.4:Z | Dconfocal | Oligomeric state | Uniprot(kDa)Monomer |
|---|---|---|---|---|---|
| NfuA | 4.534 | –15.767 | 24.8±1.1 | M/D | 20.93 |
| NadK | 6.387 | –4.808 | 29.8±1.4 | M/D/T | 32.57 |
| FabG | 6.250 | –1.66 | 30.33±1.4 | D/T/H | 25.56 |
| E-fts | 5.228 | –9.527 | 22.5±1.0 | M/D | 30.29 |
| SodA | 6.511 | –2.481 | 25.5±1.2 | D | 22.97 |
| tpiA | 5.688 | –7.851 | 27.9±1.7 | ||
| GpmA | 5.913 | –4.262 | 21.7±1.0 | D | 28.43 |
| Can | 6.230 | –5.908 | 18.7±1.4 | T | 25.1 |
| Upp | 5.335 | –6.829 | 23.0±1.1 | M/D | 22.53 |
| SpeB | 5.160 | –14.788 | 30.4±1.4 | Tri/H | 33.56 |
| IspD | 6.257 | –5.445 | 24.1±1.2 | D/T/H | 25.61 |
| BaeR | 5.554 | –6.032 | 21.9±1.1 | M/D | 27.66 |
| Acul | 5.669 | –5.986 | 28.0±1.3 | M/D/T/H | 34.73 |
| PyrF | 5.874 | –3.9 | 26.0±1.20 | M/D | 26.35 |
| ThiD | 5.793 | –6.842 | 28.7±1.3 | M/D | 28.64 |
| NadE | 5.603 | –4.993 | 23.2±1.1 | D | 27.16 |
| CRP | 7.979 | +1.388 | 30.1±1.3 | D/T | 23.64 |
| DES3im-4rp4 | 5.041 | –5.659 | 29.4±1.4 | ||
| DES7im-3rk6 | 4.599 | –10.654 | 28.8±1.3 | ||
| 6E5C_denovobeta30 | 6.336 | –0.714 | 30.0±1.4 | ||
| BSA | 4.5–4.8 | –15 | 29.6±1.4 | M/D | 66.5 |
-
Isoelectric points and net-charges were predicted using Prot Pi. Oligomeric states were taken from native mass spectrometry measurements.
Additional files
-
MDAR checklist
- https://cdn.elifesciences.org/articles/97255/elife-97255-mdarchecklist1-v1.docx
-
Appendix 1—figure 5—source data 1
Original data file of Appendix 1—figure 5 plots.
- https://cdn.elifesciences.org/articles/97255/elife-97255-app1-fig5-data1-v1.xlsx
Download links
A two-part list of links to download the article, or parts of the article, in various formats.
Downloads (link to download the article as PDF)
Open citations (links to open the citations from this article in various online reference manager services)
Cite this article (links to download the citations from this article in formats compatible with various reference manager tools)
Reversing protonation of weakly basic drugs greatly enhances intracellular diffusion and decreases lysosomal sequestration
eLife 13:RP97255.
https://doi.org/10.7554/eLife.97255.3


