Presynaptic Rac1 in the hippocampus selectively regulates working memory
- Department of Cell Biology, Duke University School of Medicine, United States
- Department of Anatomy and Histology, University of Veterinary Medicine, Hungary
- Department of Psychiatry and Behavioral Sciences, Duke University School of Medicine, United States
- Mouse Behavioral and Neuroendocrine Analysis Core Facility, Duke University School of Medicine, United States
- Department of Neurobiology, Duke University School of Medicine, United States
- Proteomics and Metabolomics Shared Resource and Center for Genomic and Computational Biology, Duke University School of Medicine, United States
Figures
Figure 1
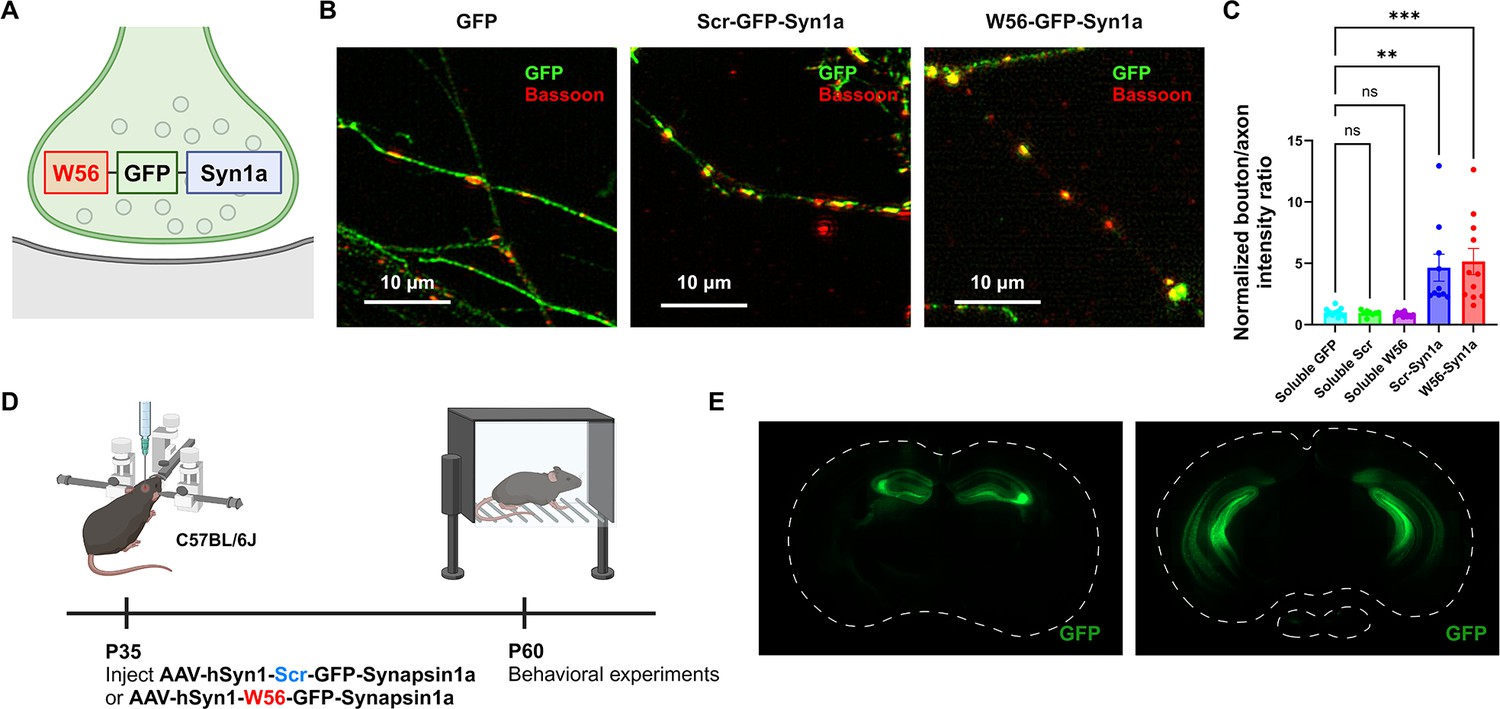
Localization of the presynaptic Rac1 inhibitor construct.
(A) Illustration of the presynaptic Rac1 inhibitor construct. (B) C57BL/6J primary neuron cultures expressing GFP, the negative control construct, or the presynaptic Rac1 inhibitor construct. (C) Fluorescence intensity profiles validated presynaptic localization of the constructs (Soluble GFP: n = 11 cells; Soluble Scr: n = 8 cells; Soluble W56: n = 11 cells; Scr-Syn1a: n = 10 cells; W56-Syn1a: n = 11 cells). (D) Timeline of AAV injection and behavioral experiments. (E) Representative immunohistochemistry images of brain slices expressing W56-GFP-Syn1a. Dotted lines indicate the outlines of the brain slices. Data are expressed as mean ± standard error of the mean (SEM) with ns. not significant, **p < 0.01 and ***p < 0.001.
© 2024, BioRender Inc. Figure 1A and D were created using BioRender, and are published under a CC BY-NC-ND 4.0. Further reproductions must adhere to the terms of this license
Figure 2
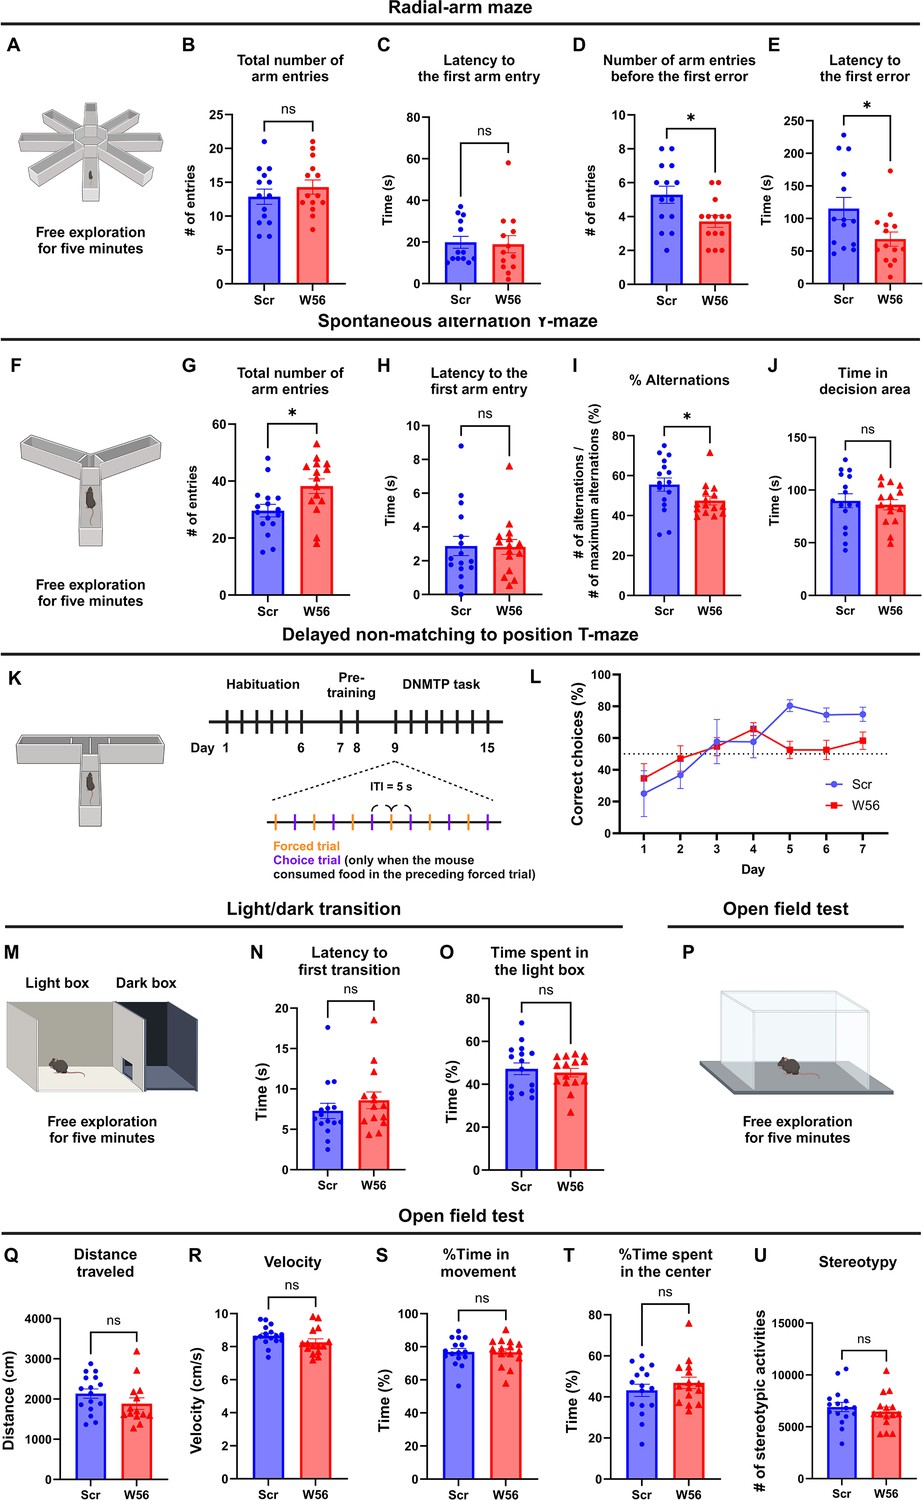
Hippocampal presynaptic Rac1 inhibition impairs spatial working memory.
(A) Schematic of the eight-arm radial maze test (n = 14 mice per group). (B) The total number of arm entries (Scr: 12.86 ± 1.123, W56: 14.29 ± 1.051, p = 0.3615) and (C) latency to the first arm entry (Scr: 23.93 ± 4.877 s, W56: 26.07 ± 8.106 s, p = 0.5020) were not significantly different, whereas (D) the number of arm entries before the first error (Scr: 5.286 ± 0.5074, W56: 3.714 ± 0.3544, p = 0.0174) and (E) latency to the first error (Scr: 115.3 ± 17.11 s, W56: 68.36 ± 11.01 s, p = 0.0248) were lower in the W56 group. (F) Schematic of the spontaneous alternation Y-maze test (n = 15 mice per group). (G) The total number of entries (Scr: 29.63 ± 2.185, W56: 38.20 ± 2.599, p = 0.0168) was higher in the W56 group, while (H) latency to the first arm entry (Scr: 2.875 ± 0.5719 s, W56: 2.811 ± 0.4422 s, p = 0.7039) was similar. (I) The percentage of alternations (Scr: 55.58 ± 3.34%, W56: 47.51 ± 2.12%, p = 0.030) was significantly lower in the W56 group. (J) Time spent in the decision area (Scr: 89.85 ± 6.555 s, W56: 86.03 ± 4.873 s, p = 0.6467) was not influenced by presynaptic Rac1 inhibition. (K) Schematic of the delayed non-matching to position (DNMTP) T-maze test (n = 8 mice per group). (L) Percentage of correct choice trials during the DNMTP task. (M) Schematic of the light/dark transition test (n = 16 mice per group). (N) The latency to the first transition (Scr: 8.263 ± 1.313 s, W56: 9.827 ± 1.571, p = 0.2130) and (O) percentage of time spent in the light box (Scr: 47.22 ± 2.750%, W56: 45.42 ± 2.008%, p = 0.6054) were not significantly different. (P) Schematic of the open field test (Scr: n = 16 mice; W56: n = 15 mice). No significant change was observed in (Q) the distance traveled (Scr: 2135 ± 117.6 cm, W56: 2030 ± 195.9 cm, p = 0.1417), (R) velocity (Scr: 8.665 ± 0.1518 cm/s, W56: 8.262 ± 0.2067 cm/s, p = 0.1242), (S) percentage of time in movement (Scr: 76.91 ± 2.035%, W56: 76.67 ± 2.103%, p = 0.9347), (T) percentage of time spent in the center (Scr: 43.20 ± 2.980%, W56: 46.84 ± 2.822%, p = 0.3842), and (U) number of stereotypic activities (Scr: 6912 ± 445.5, W56: 6470 ± 430.4, p = 0.4827). Data are expressed as mean ± standard error of the mean (SEM) with ns, not significant, and *p < 0.05.
© 2024, BioRender Inc. Figure 2A, F, K, M, and P were created using BioRender, and are published under a CC BY-NC-ND 4.0. Further reproductions must adhere to the terms of this license
Figure 3
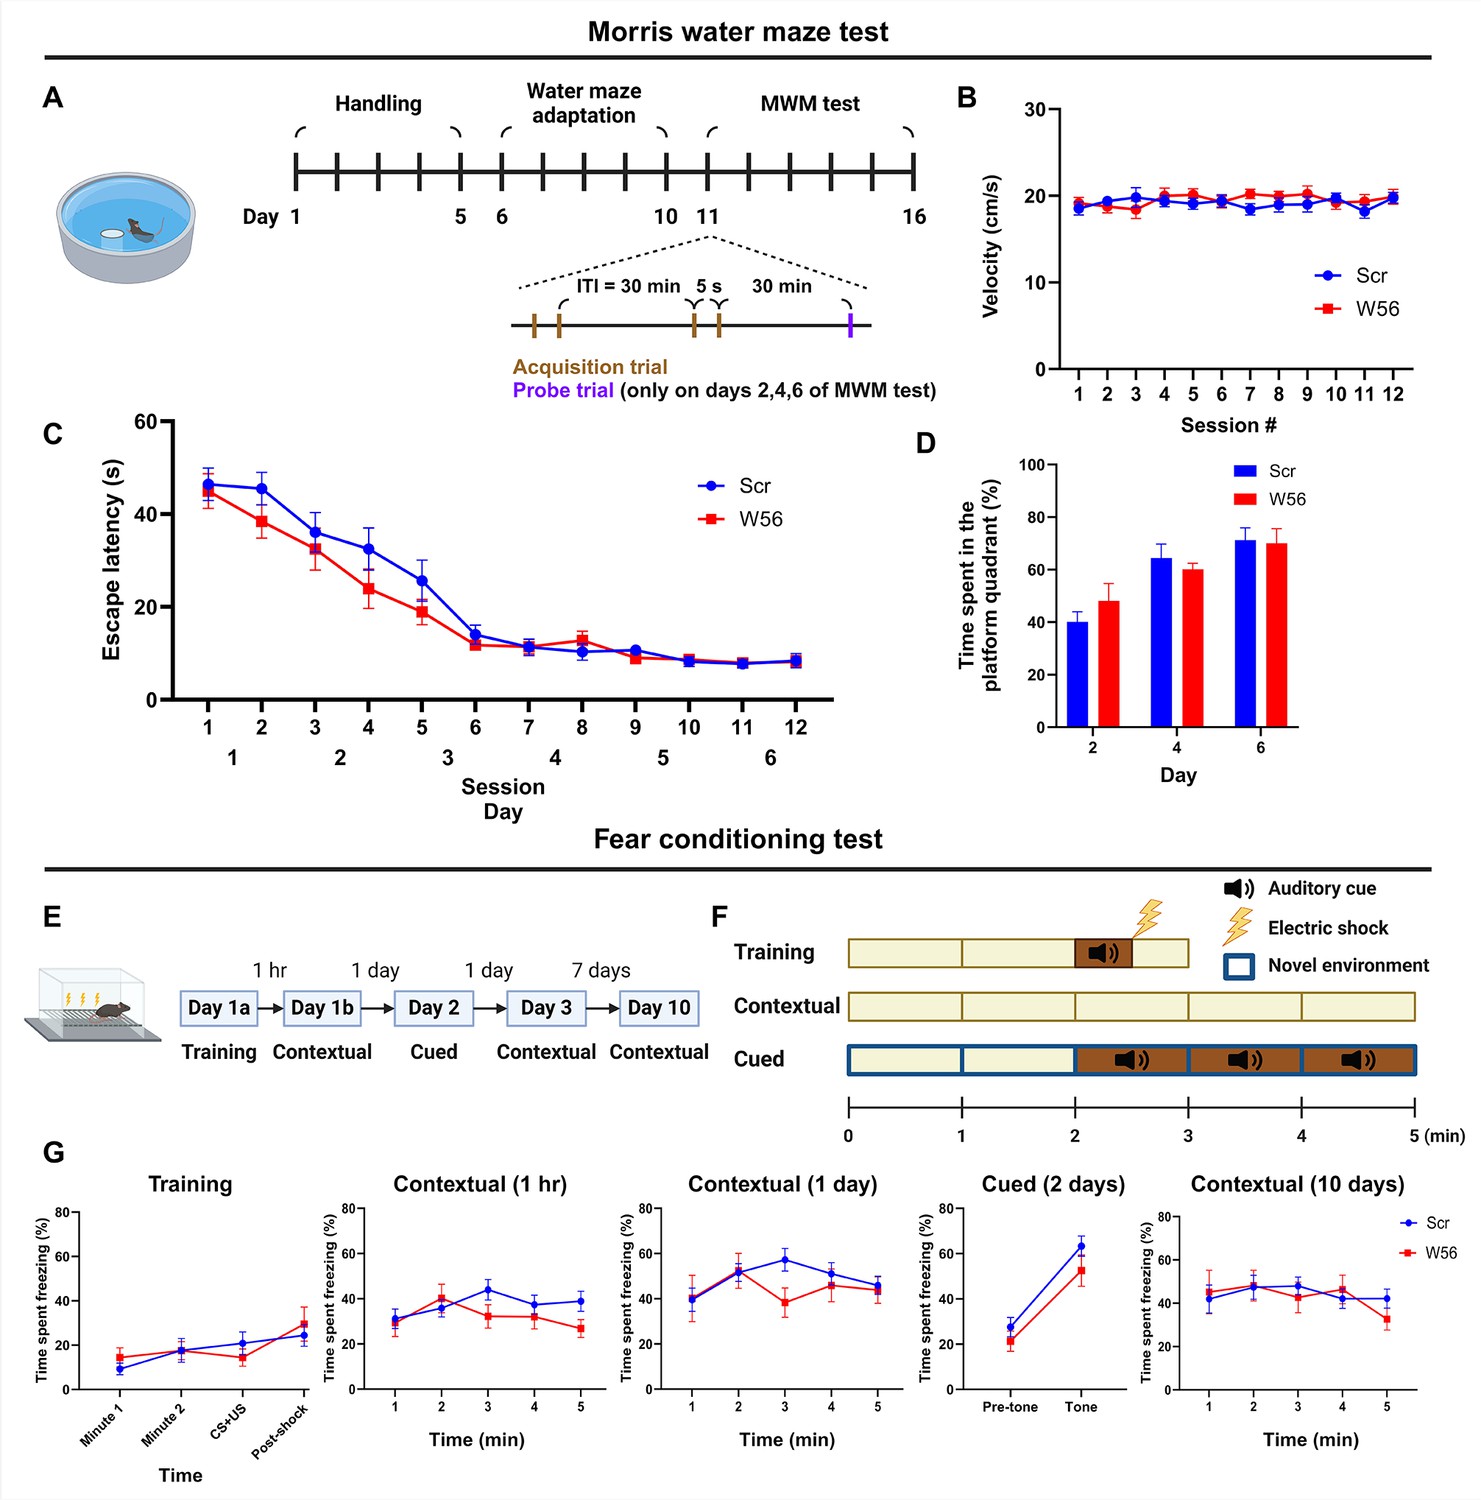
Hippocampal presynaptic Rac1 inhibition does not affect other types of learning and memory.
(A) Schematic and timeline of the Morris water maze (MWM) test (Scr: n = 16 mice; W56: n = 15 mice). During the MWM acquisition trials, (B) average swimming speed and (C) escape latency showed no significant differences across treatment groups (two-way repeated measures analysis of variance [ANOVA]; Swimming speed: F(1,29) = 0.253, p = 0.619; Escape latency: F(1,29) = 1.40, p = 0.246). (D) Percentage of time spent in the platform quadrant during the probe trials was also not significantly different across treatment groups (F(1,29) = 0.024, p = 0.878). (E) Timeline of the fear conditioning test (Scr: n = 16 mice; W56: n = 15 mice). (F) Schematic of fear conditioning sessions. (G) Percentage of time spent freezing. Data are expressed as mean ± standard error of the mean (SEM).
© 2024, BioRender Inc. Figure 3A, E, and F were created using BioRender, and are published under a CC BY-NC-ND 4.0. Further reproductions must adhere to the terms of this license
Figure 4 with 2 supplements
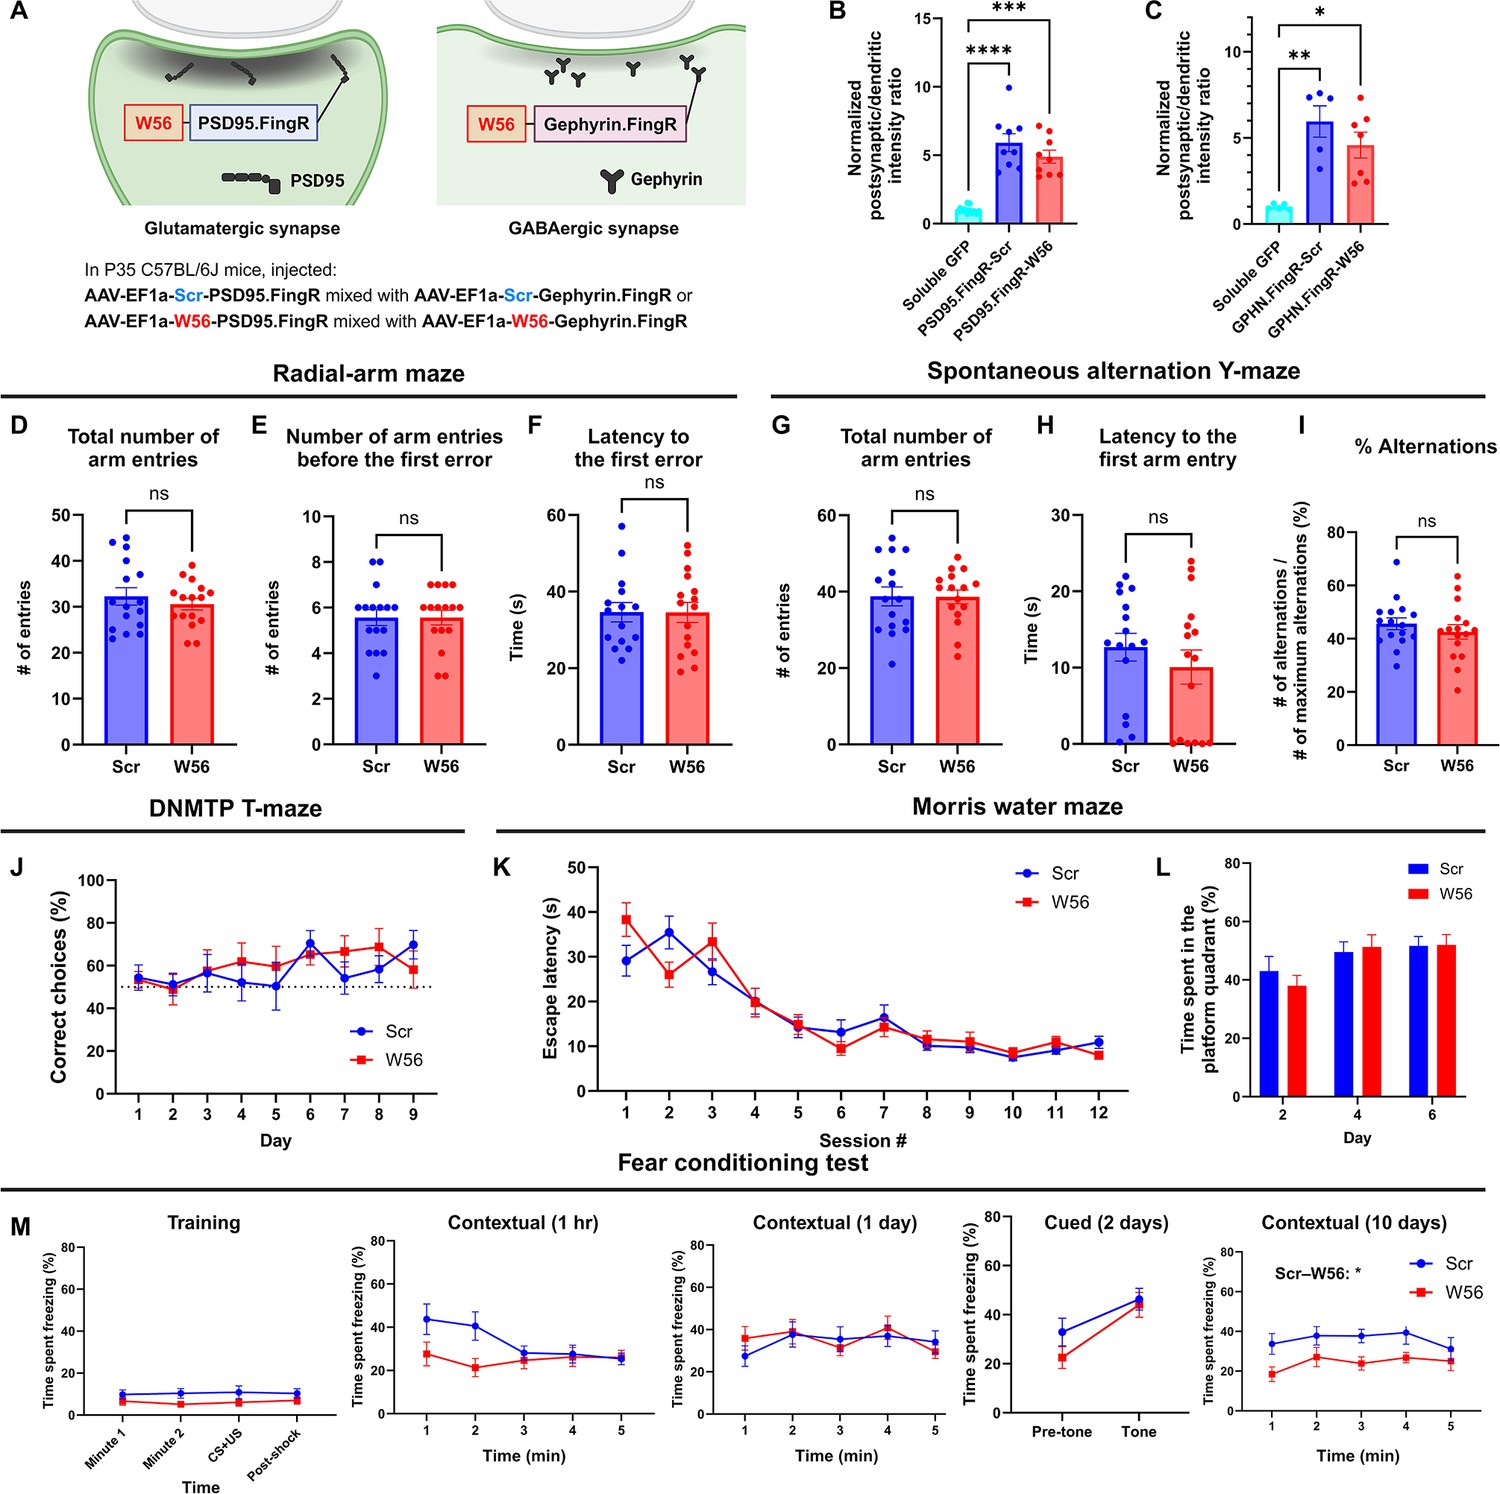
Hippocampal postsynaptic Rac1 inhibition does not affect hippocampal-dependent learning and memory.
(A) Illustration of the postsynaptic Rac1 inhibitor constructs. (B, C) Fluorescence intensity profiles validated postsynaptic localization of the constructs (Soluble GFP (Homer): n = 12 cells; PSD95.FingR-Scr: n = 9 cells; PSD95.FingR-W56 : n = 9 cells; Soluble GFP (Gephyrin): n = 5 cells; GPHN.FingR-Scr: n = 5 cells; GPHN.FingR-W56: n = 7 cells). The radial-arm maze (n = 16 mice per group) revealed no significant differences in (D) the total number of arm entries (Scr: 32.25 ± 1.896, W56: 30.56 ± 1.245, p = 0.4627), (E) number of arm entries before making the first error (Scr: 5.563 ± 0.3532, W56: 5.563 ± 0.3287, p = 0.8199), and (F) latency to the first error (Scr: 37.19 ± 3.500 s, W56: 34.56 ± 2.630 s, p = 0.9919). The spontaneous alternation Y-maze (n = 16 mice per group) indicated no significant difference in (G) the total number of arm entries (Scr: 38.75 ± 2.452, W56: 38.63 ± 1.798, p = 0.9675), (H) latency to the first arm entry (Scr: 12.68 ± 1.819 s, W56: 10.07 ± 2.240 s, p = 0.3226), and (I) percentage of alternations (Scr: 45.61 ± 2.254%, W56: 42.56 ± 2.723%, p = 0.3953). (J) The percentage of correct choice trials in the DNMTP T-maze (n = 8 mice per group) was comparable for both groups throughout the test. In the Morris water maze (Scr: n = 16 mice; W56: n = 15 mice), (K) the escape latency from acquisition sessions (F(1,29) = 0.04019, p = 0.8425), and (L) the time spent in the platform quadrant (F(1,29) = 0.05692, p = 0.8131) also revealed no significant differences. (M) Percentage of time spent freezing in the fear conditioning test (Scr: n = 15 mice; W56: n = 14 mice). The difference between treatment groups was significant during the contextual trial 10 days after training (two-way repeated measures analysis of variance [ANOVA]; Treatment: F(1,27) = 6.169, p = 0.0195), but not in other trials. Data are expressed as mean ± standard error of the mean (SEM) with ns, not significant, *p < 0.05, **p < 0.01, ***p < 0.001, and ****p < 0.0001.
© 2024, BioRender Inc. Figure 4A was created using BioRender, and is published under a CC BY-NC-ND 4.0. Further reproductions must adhere to the terms of this license
Figure 4—figure supplement 1
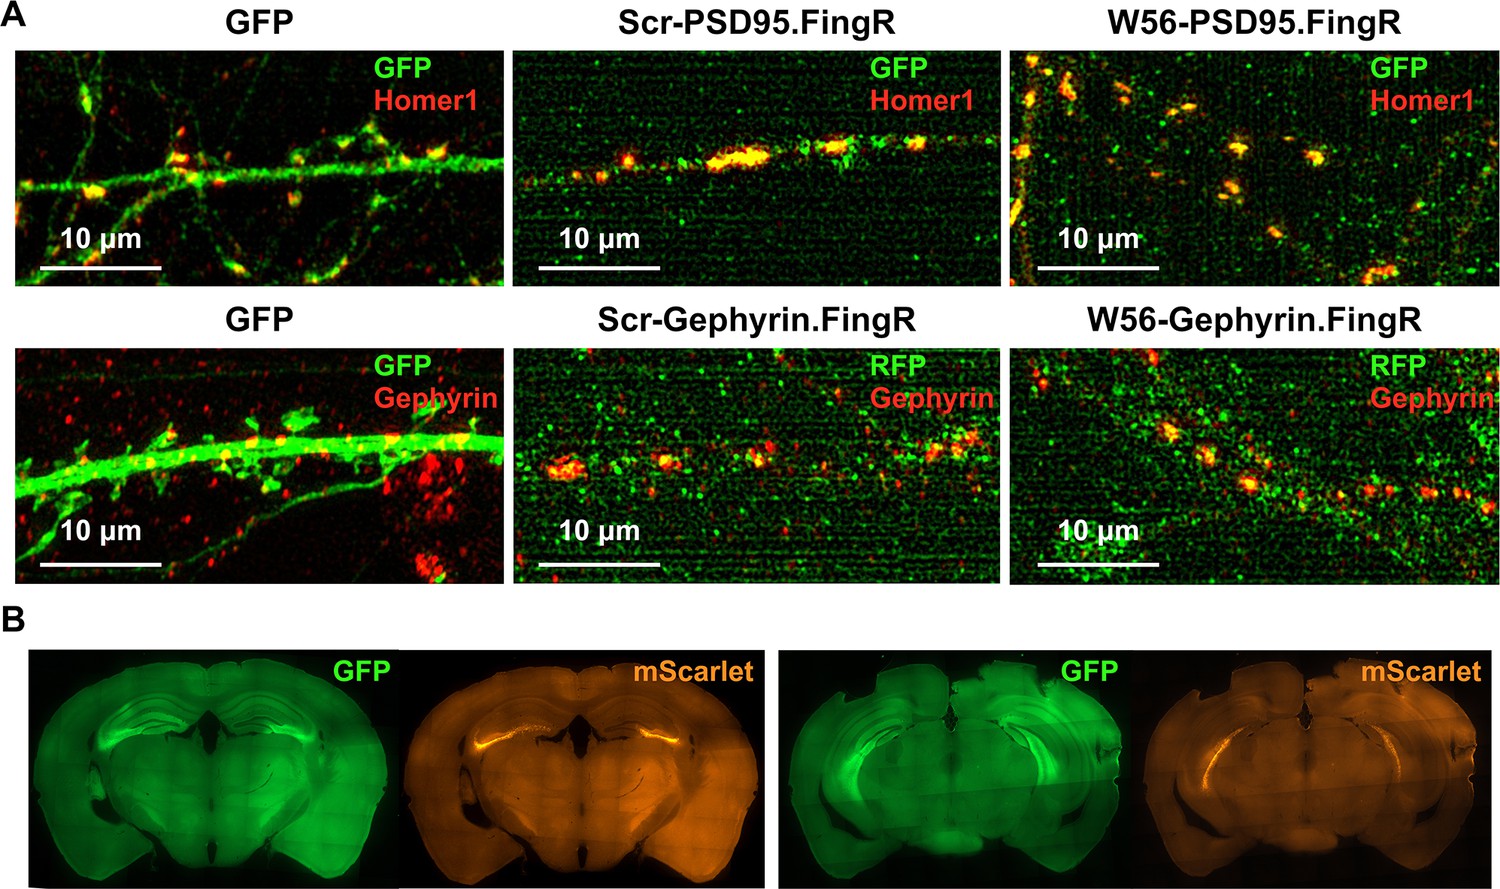
Localization of postsynaptic Rac1 inhibitor constructs.
(A) C57BL/6J primary neuron cultures expressing GFP, the negative control construct, or the postsynaptic Rac1 inhibitor construct. The mScarlet-Gephyrin.FingR constructs were immunostained using an RFP antibody and an Alexa Flour 488 secondary antibody, enabling the imaging of mScarlet in the green channel. (B) Representative immunohistochemistry images of brain slices expressing W56-PSD95.FingR-GFP and W56-mScarlet-Gephyrin.FingR. Expression of both constructs was observed in the dorsal (left) and ventral (right) hippocampus.
Figure 4—figure supplement 2
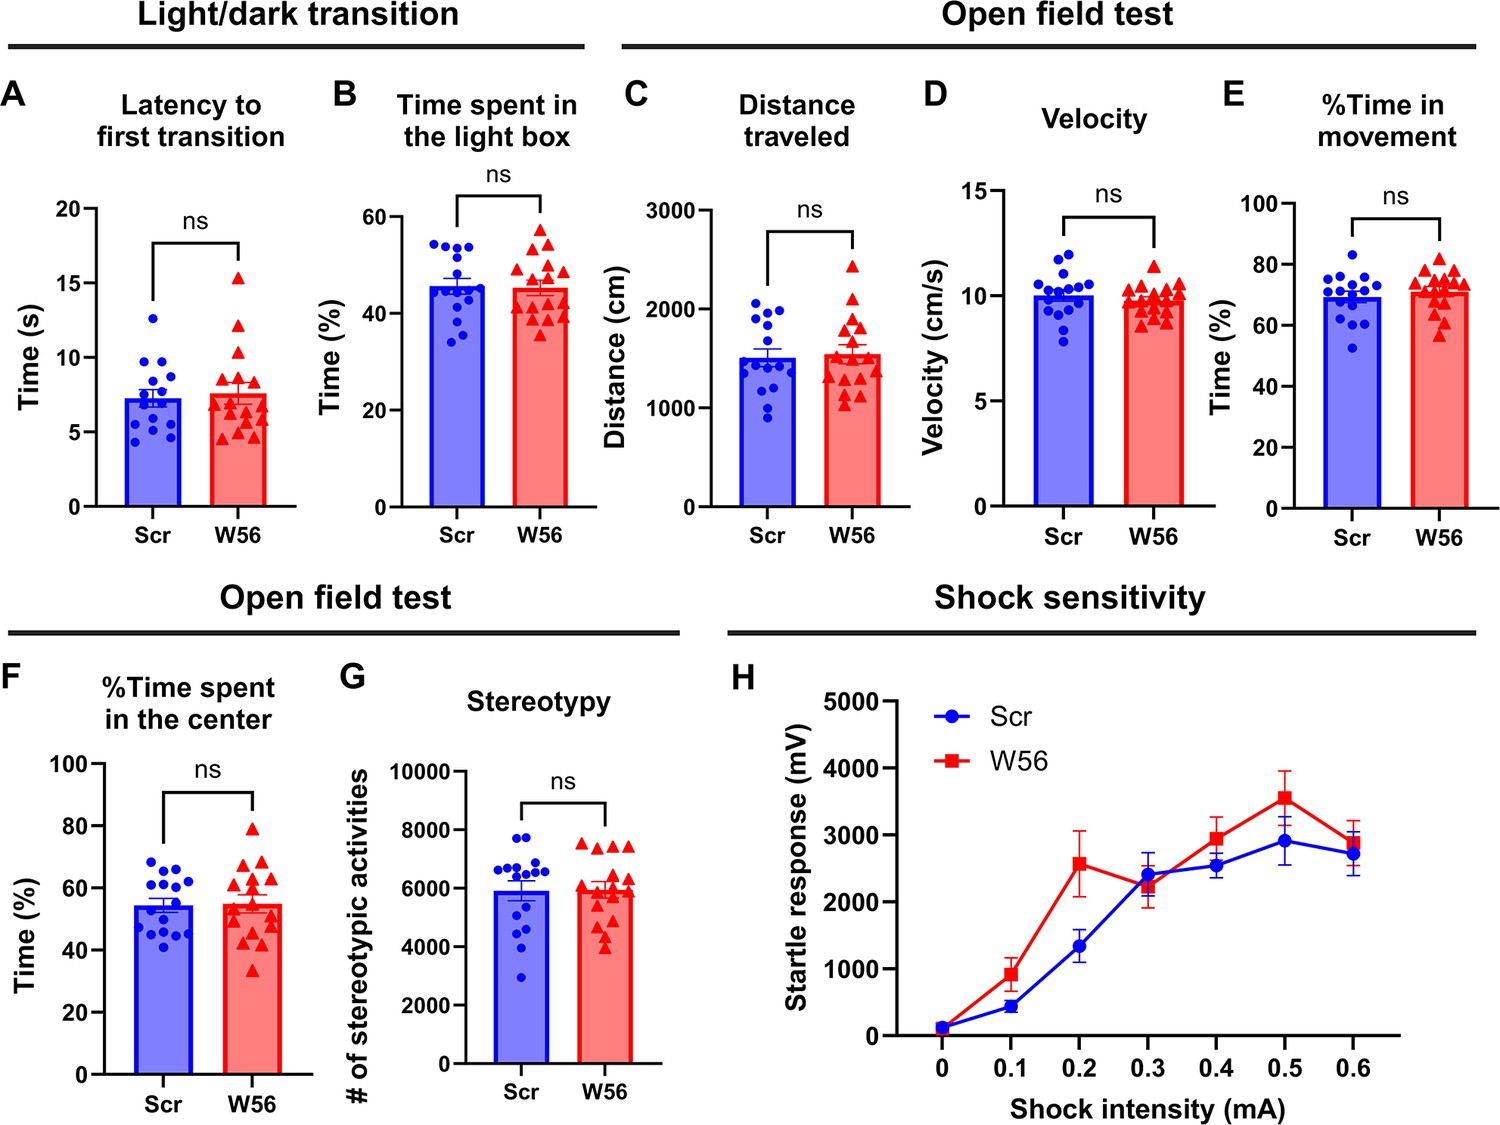
Anxiety and general locomotor activity are not affected by postsynaptic Rac1 inhibition.
In the light/dark transition (n = 16 mice per group), (A) latency to the first transition (Scr: 8.350 ± 1.221 s, W56: 7.588 ± 0.7299 s, p = 0.9612) and (B) time spent in the light box (Scr: 45.60 ± 1.625%, W56: 45.26 ± 1.597%, p = 0.8819) were not influenced by postsynaptic Rac1 inhibition. In the open field test (n = 16 mice per group), (C) distance traveled (Scr: 1506 ± 89.87 cm, W56: 1543 ± 95.70 cm, p = 0.7775), (D) velocity (Scr: 10.02 ± 0.2759 cm/s, W56: 9.768 ± 0.1878 cm/s, p = 0.4597), (E) percentage of time in movement (Scr: 69.33 ± 1.896%, W56: 71.07 ± 1.658%, p = 0.4953), (F) percentage of time spent in the center (Scr: 54.38 ± 2.265%, W56: 54.87 ± 2.952%, p = 0.8958), and (G) number of stereotypic activities (Scr: 5914 ± 342.4, W56: 5946 ± 281.2, p = 0.9443) were also unaffected. (H) The startle responses elicited by electric shock showed a positive correlation with the intensity of the shock (Scr: n = 16 mice; W56: n = 15 mice). However, no significant variations were observed across treatment groups (two-way repeated measures analysis of variance (ANOVA); Intensity: F(3.808,110.4) = 32.41, p < 0.0001; Intensity × Treatment: F(6,174) = 1.313, p = 0.2539). Data are expressed as mean ± standard error of the mean (SEM) with ns, not significant.
Figure 5
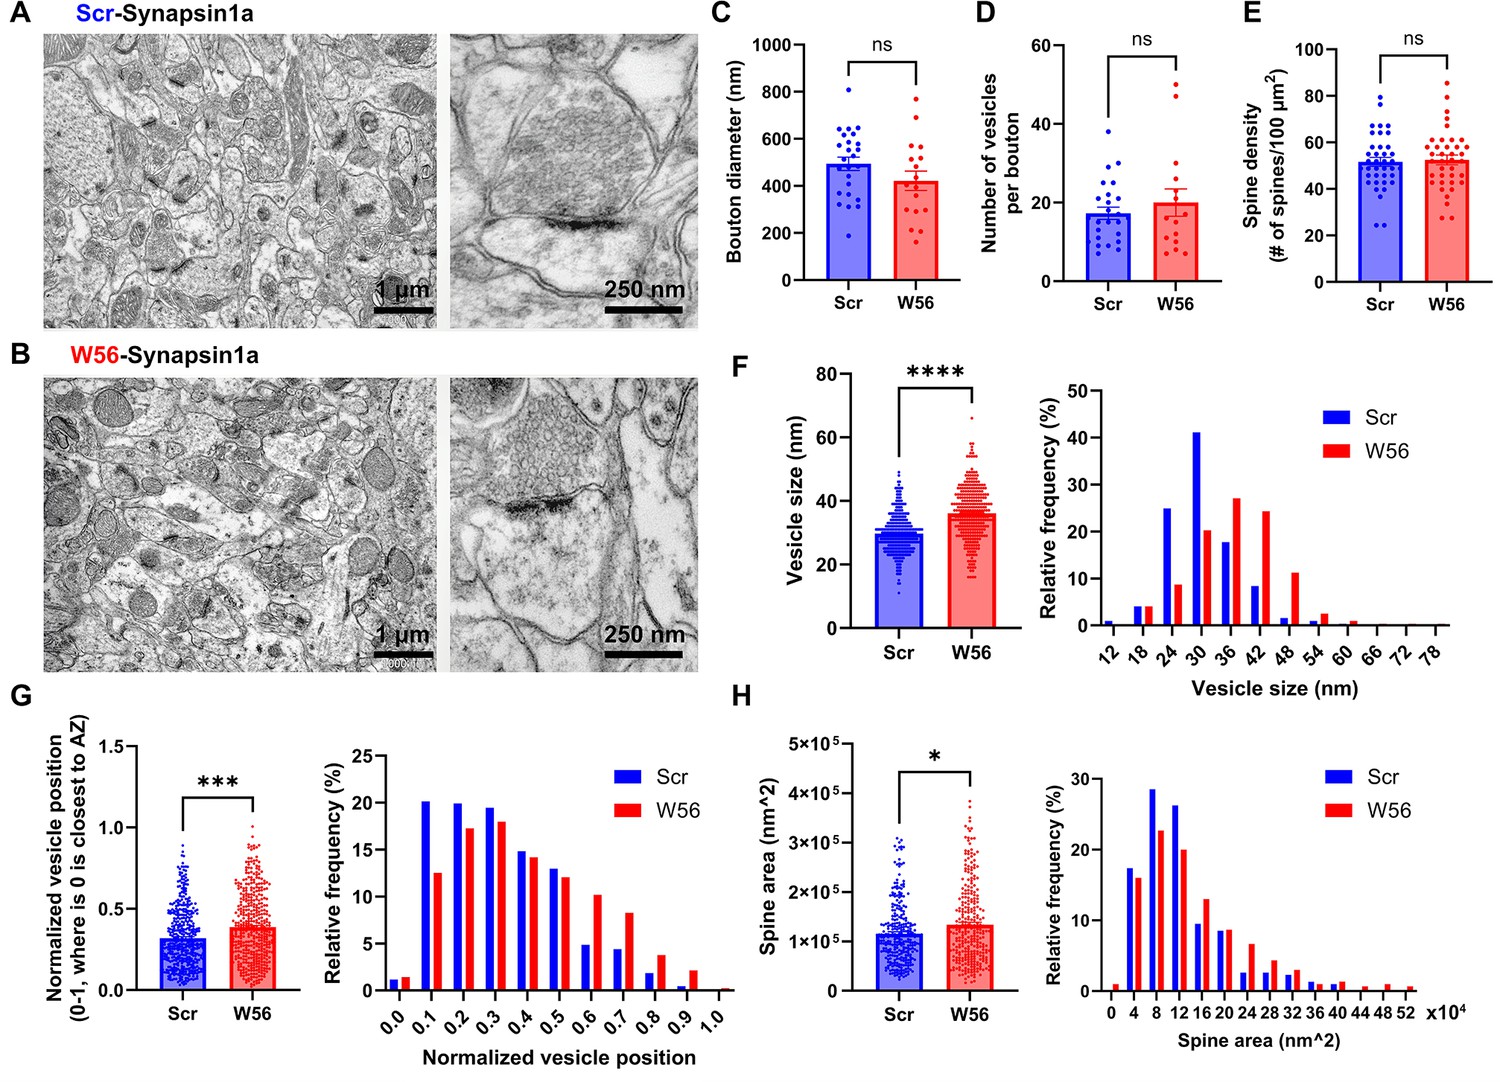
EM analysis of presynaptic Rac1 inhibition in hippocampal cells.
Representative electron microscopy (EM) images of the dorsal CA1 stratum radiatum transduced with AAV-hSyn1-Scr-Syn1a (A) and AAV-hSyn1-W56-Syn1a (B). (C) Diameter of axonal boutons (Scr: 493.8 ± 28.38 nm, n = 25 boutons; W56: 421.5 ± 41.47 nm, n = 17 boutons; p = 0.1437). (D) Number of synaptic vesicles per bouton (Scr: 17.28 ± 1.552, n = 25 boutons; W56: 20.00 ± 3.486, n = 17 boutons; p = 0.9877). (E) Number of dendritic spines per 100 µm2 (Scr: 51.64 ± 1.927 spines/100 µm2; W56: 52.46 ± 2.068 spines/100 µm2; n = 38 images per group; p = 0.7730). (F) Bar graph and frequency distribution of diameter of synaptic vesicles show that presynaptic Rac1 inhibition leads to larger vesicles (Scr: 30.02 ± 0.3845 nm, W56: 36.35 ± 0.4993 nm; n = 321 vesicles per group; p < 0.0001). (G) Synaptic vesicles were located relatively further from the active zone in the W56 group (Scr: 0.3193 ± 0.008885, n = 432 vesicles; W56: 0.3869 ± 0.01032, n = 423 vesicles; p ≈ 0.0001). The position of individual vesicles within a presynaptic terminal was normalized as a value ranging from 0 to 1, where 0 is closest to the active zone. (H) Area of dendritic spines was larger following presynaptic Rac1 inhibition (Scr: 124,400 ± 4342 nm2, n = 305 spines; W56: 144,700 ± 5676 nm2, n = 300 spines; p = 0.0276). Kolmogorov–Smirnov test was performed on data that did not pass normality test. Data are expressed as mean ± standard error of the mean (SEM) with ns, not significant, *p < 0.05, ***p < 0.001, and ****p < 0.0001.
Figure 6 with 1 supplement
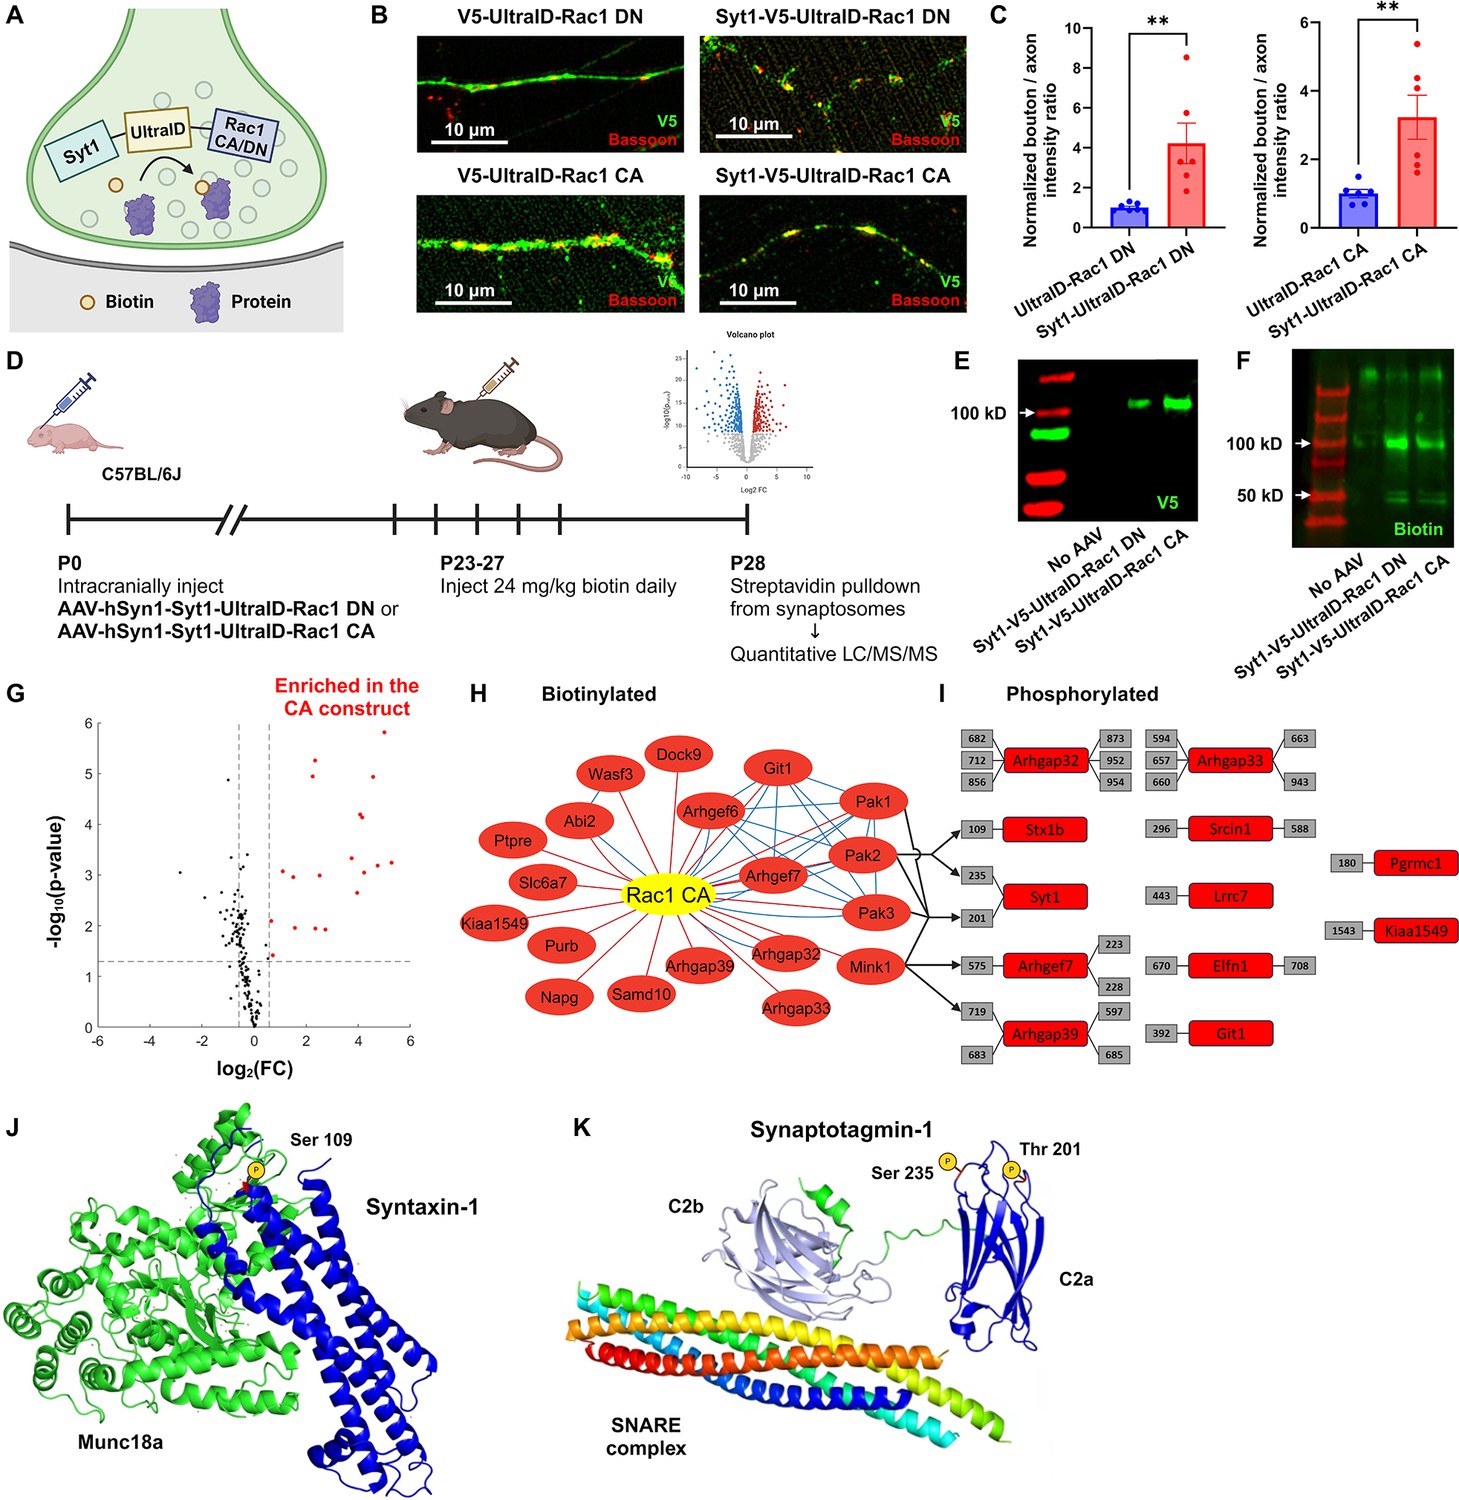
Functional protein interaction network of presynaptic Rac1.
(A) Schematic of the presynaptic Rac1 BioID construct. (B, C) Presynaptic Rac1 BioID constructs are co-localized with a presynaptic marker Bassoon at synaptic boutons in C57BL/6J primary neuron cultures (UltraID-Rac1 DN: n = 7 cells; Syt1-UltraID-Rac1 DN, UltraID-Rac1 CA, Syt1-UltraID-Rac1 CA: n = 6 cells). (D) Timeline of AAV injection and protein sample collection. Expression of presynaptic Rac1 BioID constructs (E) and biotinylation (F) were verified using Western blot. (G) Volcano plot of the biotinylated proteins. Red dots represent the 19 proteins that were significantly enriched in the Rac1 constitutively active (CA) proteome. Dashed lines correspond to p-value = 0.05 (horizontal) or fold-change (FC) = ±1.5 (vertical). (H) Network of biotinylated proteins that were significantly enriched (FC >1.5 and p < 0.05) in the CA proteome. Edges represent protein–protein interactions identified from our proteomic data (red) or reported from STRING (blue). (I) Phosphorylated peptides that were significantly enriched in the CA proteome. Numbers in gray boxes represent phosphorylation sites. Arrows represent predicted kinase–substrate pairs with high percentile scores (>90). (J) Schematic of Syntaxin-1 and Munc18a (PDB ID: 3C98). A red residue represents the phosphorylation site (Ser 109). (K) Schematic of Synaptotagmin-1 and SNARE complex (PDB ID: 5CCG). Colors are assigned randomly for different proteins/domains. Data are expressed as mean ± standard error of the mean (SEM) with **p < 0.01.
© 2024, BioRender Inc. Figure 6A and D were created using BioRender, and are published under a CC BY-NC-ND 4.0. Further reproductions must adhere to the terms of this license
Figure 6—figure supplement 1
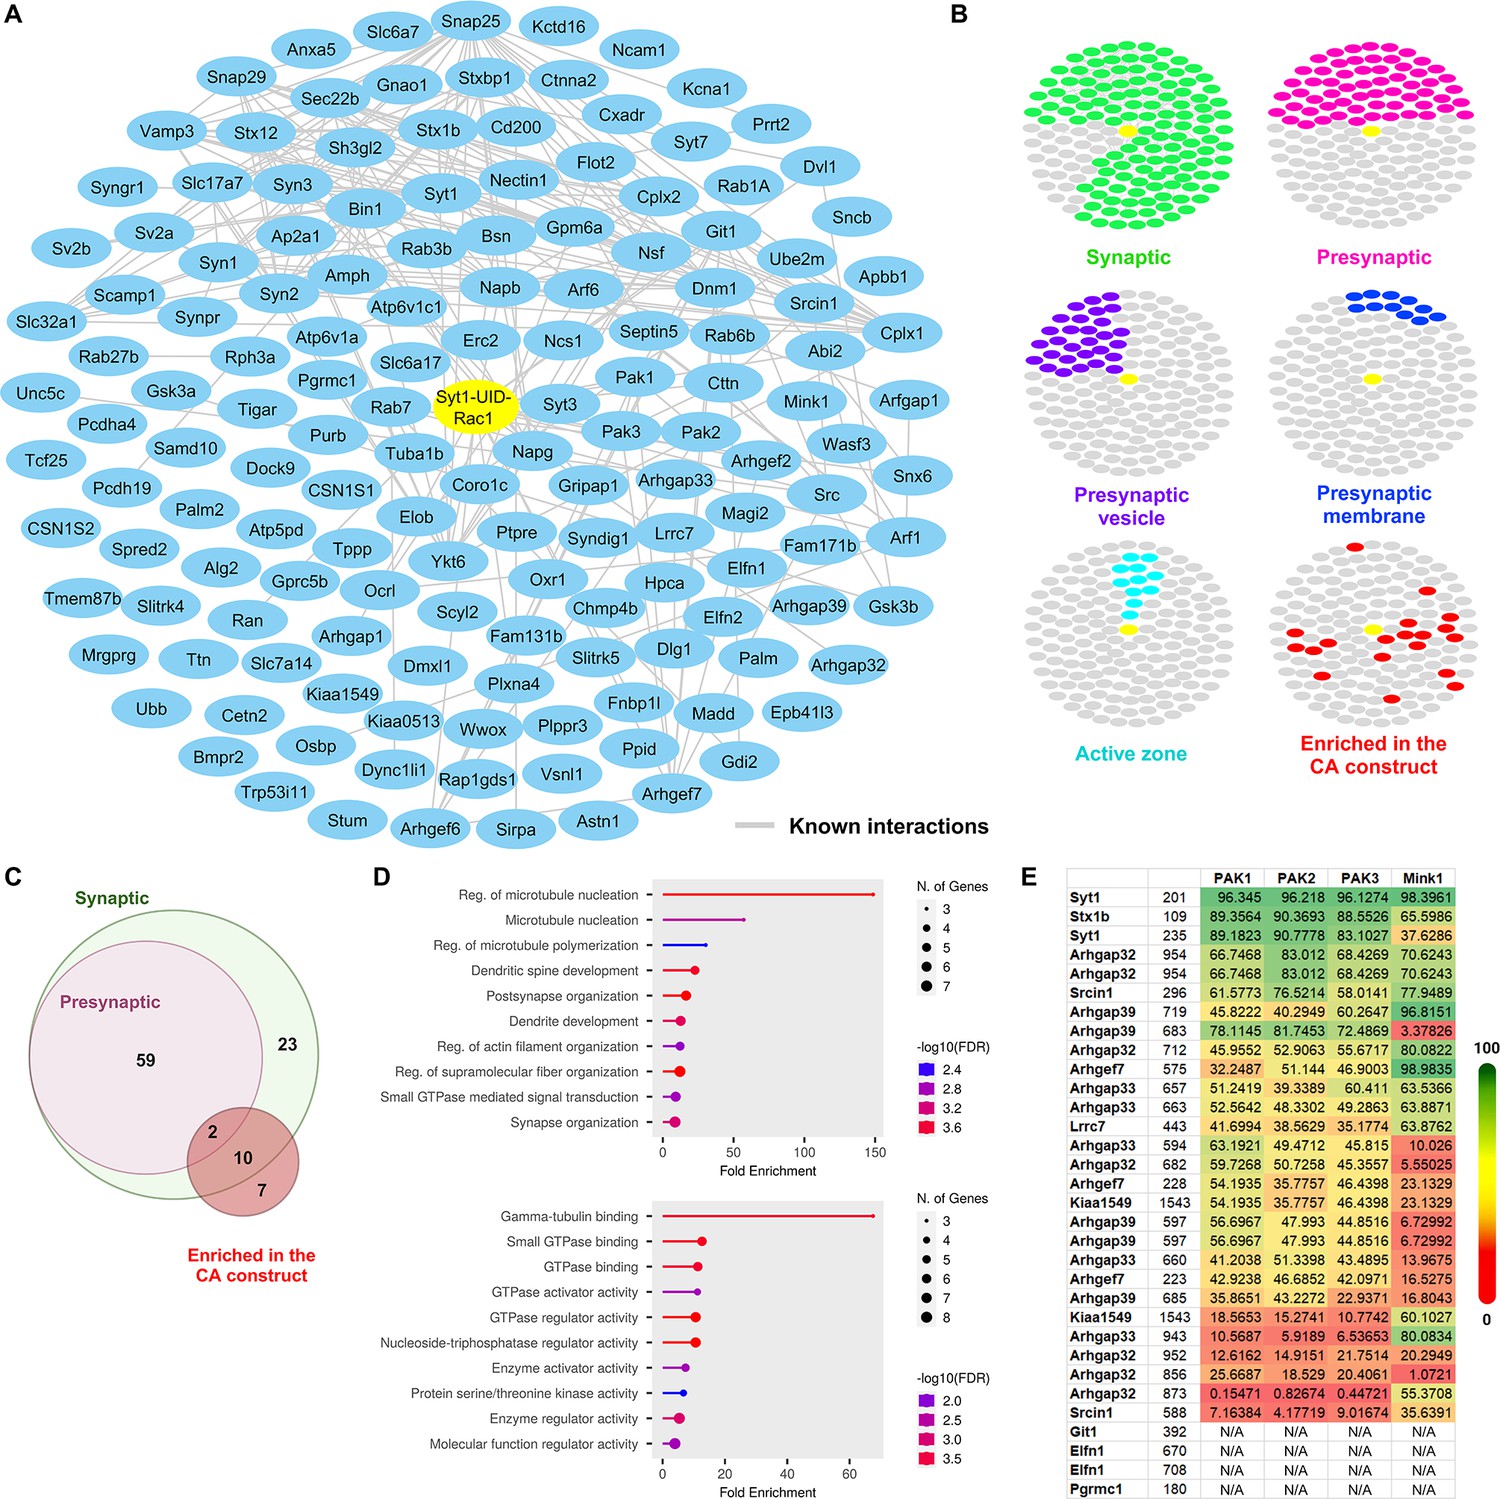
Synaptic enrichment and additional analysis of the presynaptic Rac1 constitutively active (CA) and dominant negative (DN) proteomes.
(A) Network of biotinylated proteins identified within either CA or DN proteome. Node titles correspond to the gene names. Edges between nodes represent protein–protein interactions previously reported from STRING. (B) Clustergrams of proteins that are previously reported as synaptic (green, n = 123/149 proteins) or presynaptic (pink, n = 61); localized in presynaptic membrane (purple, n = 29), presynaptic vesicle (blue, n = 11), or active zone (cyan, n = 11) as identified through SynGO; are significantly enriched in our Rac1 CA proteome (red, n = 19). (C) Venn diagram of the biotinylated proteins annotated as synaptic/presynaptic or enriched in the CA proteome. (D) Gene ontology (GO) analysis of the 19 biotinylated proteins enriched in the CA proteome using Biological Process (left) and Molecular Function (right) datasets. (E) Table of percentile scores of kinases and specific phosphorylation sites of substrates. The data were retrieved from the Kinase Library.
Figure 7
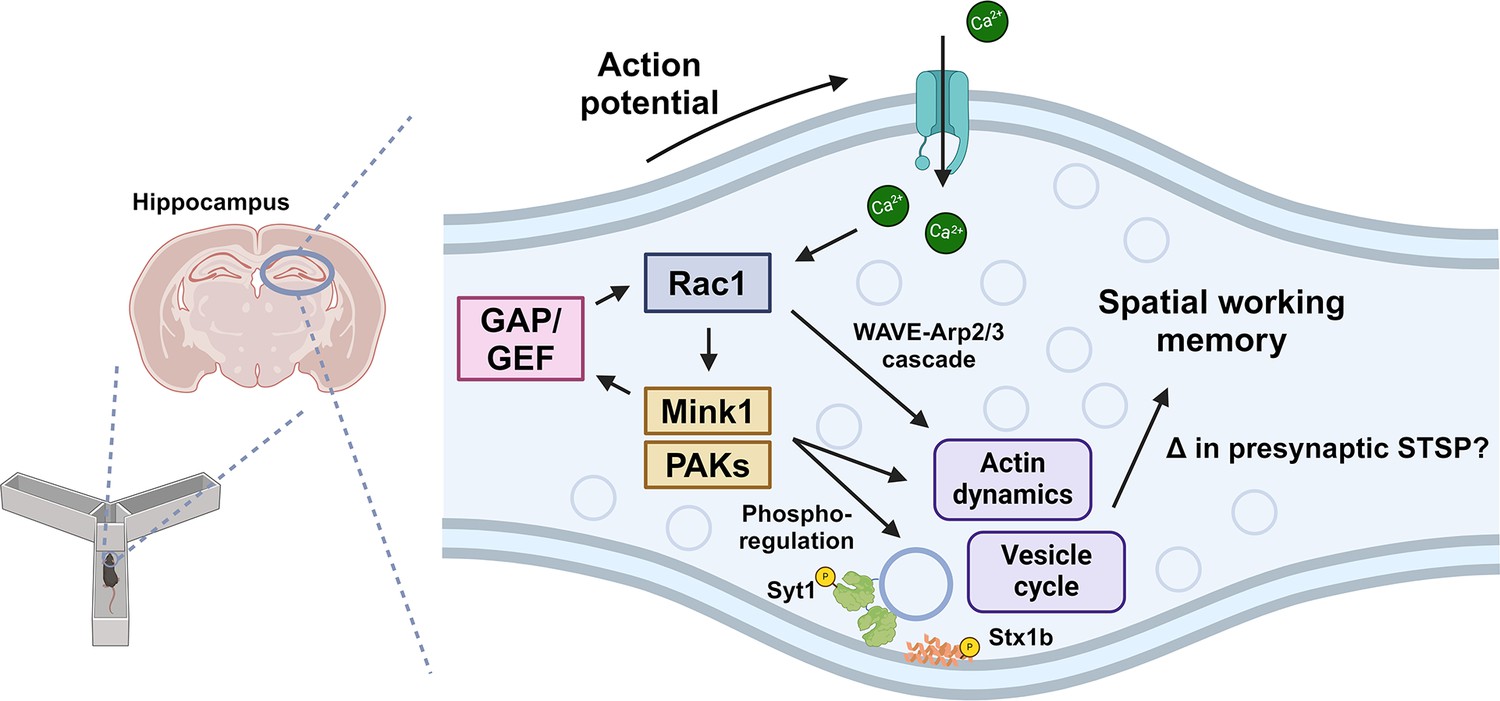
Model of presynaptic Rac1 regulation and its signaling cascades in spatial working memory.
This study suggests this process is driven by kinase-mediated phosphorylation of Guanine nucleotide Exchange Factor (GEF)/GAPs and vesicle proteins, which regulate vesicle cycle and actin dynamics.
© 2024, BioRender Inc. Figure 7 was created using BioRender, and is published under a CC BY-NC-ND 4.0. Further reproductions must adhere to the terms of this license
Tables
Key resources table
| Reagent type (species) or resource | Designation | Source or reference | Identifiers | Additional information |
|---|---|---|---|---|
| Strain, strain background (Mus musculus) | C57BL/6J | The Jackson Laboratory | Cat# 000664; RRID:IMSR_JAX:000664 | |
| Cell line (Homo sapiens) | HEK293T | ATCC | Cat# CRL-3216; RRID:CVCL_0063 | |
| Biological sample (Mus musculus) | Primary neuron cultures | This paper | Freshly isolated from Mus musculus | |
| Antibody | anti-GFP (Mouse monoclonal) | Synaptic Systems | Cat# 132 011; RRID:AB_887726 | ICC (1:500) |
| Antibody | anti-V5 (Mouse monoclonal) | Thermo Fisher Scientific | Cat# R960-25; RRID:AB_2556564 | IHC (1:500), WB (1:1000) |
| Antibody | anti-Bassoon (Rabbit polyclonal) | Synaptic Systems | Cat# 141 003; RRID:AB_887697 | ICC (1:500) |
| Antibody | anti-RFP (Mouse monoclonal) | Synaptic Systems | Cat# 409 011; RRID:AB_2800533 | ICC (1:500) |
| Antibody | anti-Homer1 (Rabbit polyclonal) | Synaptic Systems | Cat# 160 003; RRID:AB_887730 | ICC (1:500) |
| Antibody | anti-Gephyrin (Rabbit monoclonal) | Synaptic Systems | Cat# 147 008; RRID:AB_2619834 | ICC (1:500) |
| Antibody | anti-Biotin (Goat polyclonal) | Thermo Fisher Scientific | Cat# 31852; RRID:AB_228243 | WB (1:5000) |
| Recombinant DNA reagent | pAAV-hSyn1-W56-EGFP-Linker-Synapsin1a | O’Neil et al., 2021 | See Plasmids construction | |
| Recombinant DNA reagent | pAAV-hSyn1-Scr-EGFP-Linker-Synapsin1a | O’Neil et al., 2021 | See Plasmids construction | |
| Recombinant DNA reagent | pAAV-hSyn1-EGFP-Rac1 | O’Neil et al., 2021 | See Plasmids construction | |
| Recombinant DNA reagent | pAAV-hSyn1-Syanptotagmin1-Linker-V5-UltraID-Linker-Rac1 CA | This paper | See Plasmids construction | |
| Recombinant DNA reagent | pAAV-hSyn1-Syanptotagmin1-Linker-V5-UltraID-Linker-Rac1 DN | This paper | See Plasmids construction | |
| Recombinant DNA reagent | pAAV-hSyn1-V5-UltraID-Linker-Rac1 CA | This paper | See Plasmids construction | |
| Recombinant DNA reagent | pAAV-hSyn1-V5-UltraID-Linker-Rac1 DN | This paper | See Plasmids construction | |
| Recombinant DNA reagent | pAAV-EF1a-W56-Linker-PSD95.FingR-eGFP-CCR5TC | This paper | See Plasmids construction | |
| Recombinant DNA reagent | pAAV-EF1a-Scr-Linker-PSD95.FingR-eGFP-CCR5TC | This paper | See Plasmids construction | |
| Recombinant DNA reagent | pAAV_Ef1a-W56-Linker-mScarlet-Gephyrin.FingR-IL2RGTC | This paper | See Plasmids construction | |
| Recombinant DNA reagent | pAAV_Ef1a-Scr-Linker-mScarlet-Gephyrin.FingR-IL2RGTC | This paper | See Plasmids construction | |
| Chemical compound, drug | Biotin | Millipore Signma | Cat# B4501; CAS: 58-85-5 | |
| Software, algorithm | Cytoscape | The Cytoscape Consortium | RRID:SCR_003032 | Version 3.9 |
Additional files
Download links
A two-part list of links to download the article, or parts of the article, in various formats.
Downloads (link to download the article as PDF)
Open citations (links to open the citations from this article in various online reference manager services)
Cite this article (links to download the citations from this article in formats compatible with various reference manager tools)
Presynaptic Rac1 in the hippocampus selectively regulates working memory
eLife 13:RP97289.
https://doi.org/10.7554/eLife.97289.2


