Acquisition of auditory discrimination mediated by different processes through two distinct circuits linked to the lateral striatum
- Department of Physiology, Graduate School of Medicine, Osaka Metropolitan University, Japan
- Department of Physiology, Osaka City University Graduate School of Medicine, Japan
- Department of Molecular Genetics, Institute of Biomedical Sciences, Fukushima Medical University, Japan
- Laboratory for Biofunction Dynamics Imaging, RIKEN Center for Biosystems Dynamics Research, Japan
- Japan Society for the Promotion of Science, Japan
- Laboratory for Pathophysiological and Health Science, RIKEN Center for Biosystems Dynamics Research, Japan
- Medical Devices Research Group, Health and Medical Research Institute, National Institute of Advanced Industrial Science and Technology, Japan
- Human Brain Research Center, Kyoto University Graduate School of Medicine, Japan
- Department of Physiology and Oral Physiology, Graduate School of Biomedical and Health Sciences, Hiroshima University, Japan
Figures
Figure 1 with 1 supplement
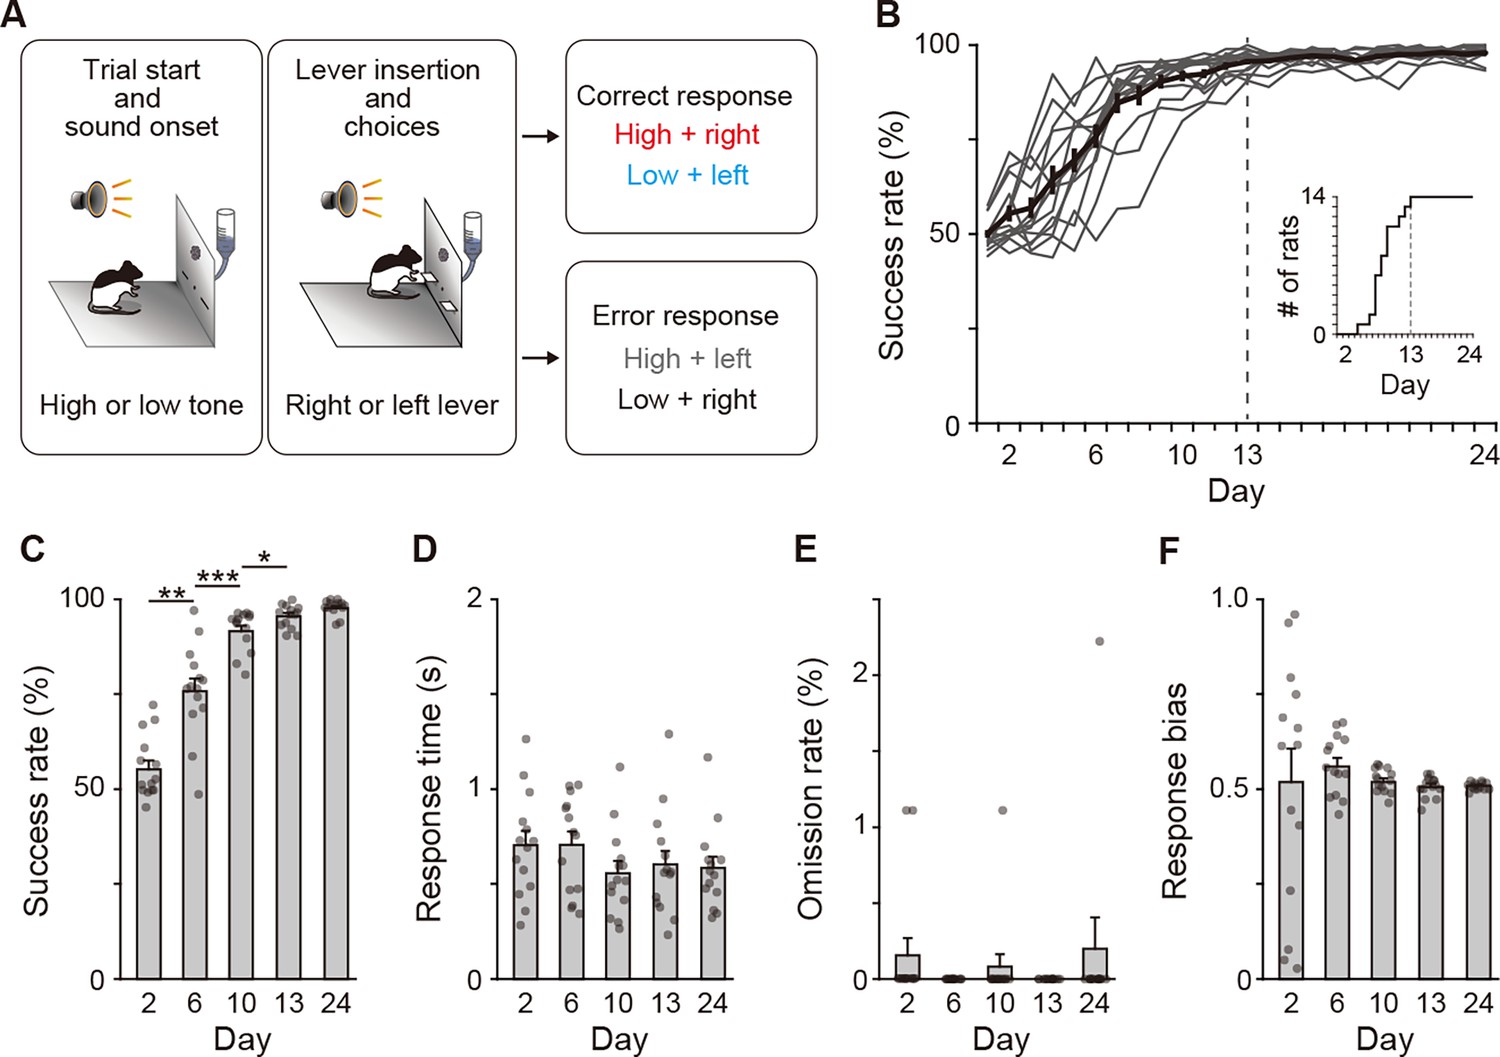
Behavioral performance of two-alternative auditory discrimination learning.
(A) Schematic diagram of the auditory discrimination task. Each trial started with the presentation of a tone instruction cue with the high (10 kHz) or low (2 kHz) frequency. Three seconds later, the room light was illuminated, and two retractable levers were inserted at the same time. The rats were required to press the right and left levers in response to the high and low tones, respectively. (B) Learning curve of the auditory discrimination in intact rats (n = 14). Inset indicates the cumulative curve of the number achieving the success rate of more than 90%. (C) Success rate at Days 2, 6, 10, 13, and 24 (one-way repeated ANOVA, F[1.897,24.659] = 106.706, p = 1.1 × 10⁻¹², post hoc Bonferroni test, Day 2 vs. Day 6, p = 0.001, Day 6 vs. Day 10, p = 3.6 × 10⁻⁴, Day 10 vs. Day 13, p = 0.040, and Day 13 vs. Day 24, p = 0.080). (D) Response time (one-way repeated ANOVA, F[2.203,28.642] = 2.386, p = 0.105). (E) Omission rate (F[4,52] = 0.699, p = 0.596). (F) Response bias (one-way repeated ANOVA, F[1.129,14.674] = 0.250, p = 0.653). Data are indicated as the mean ± s.e.m., and individual data are overlaid. *p < 0.05, **p < 0.01, and ***p < 0.001.
-
Figure 1—source data 1
Behavioral performance of intact rats.
- https://cdn.elifesciences.org/articles/97326/elife-97326-fig1-data1-v1.xlsx
Figure 1—figure supplement 1
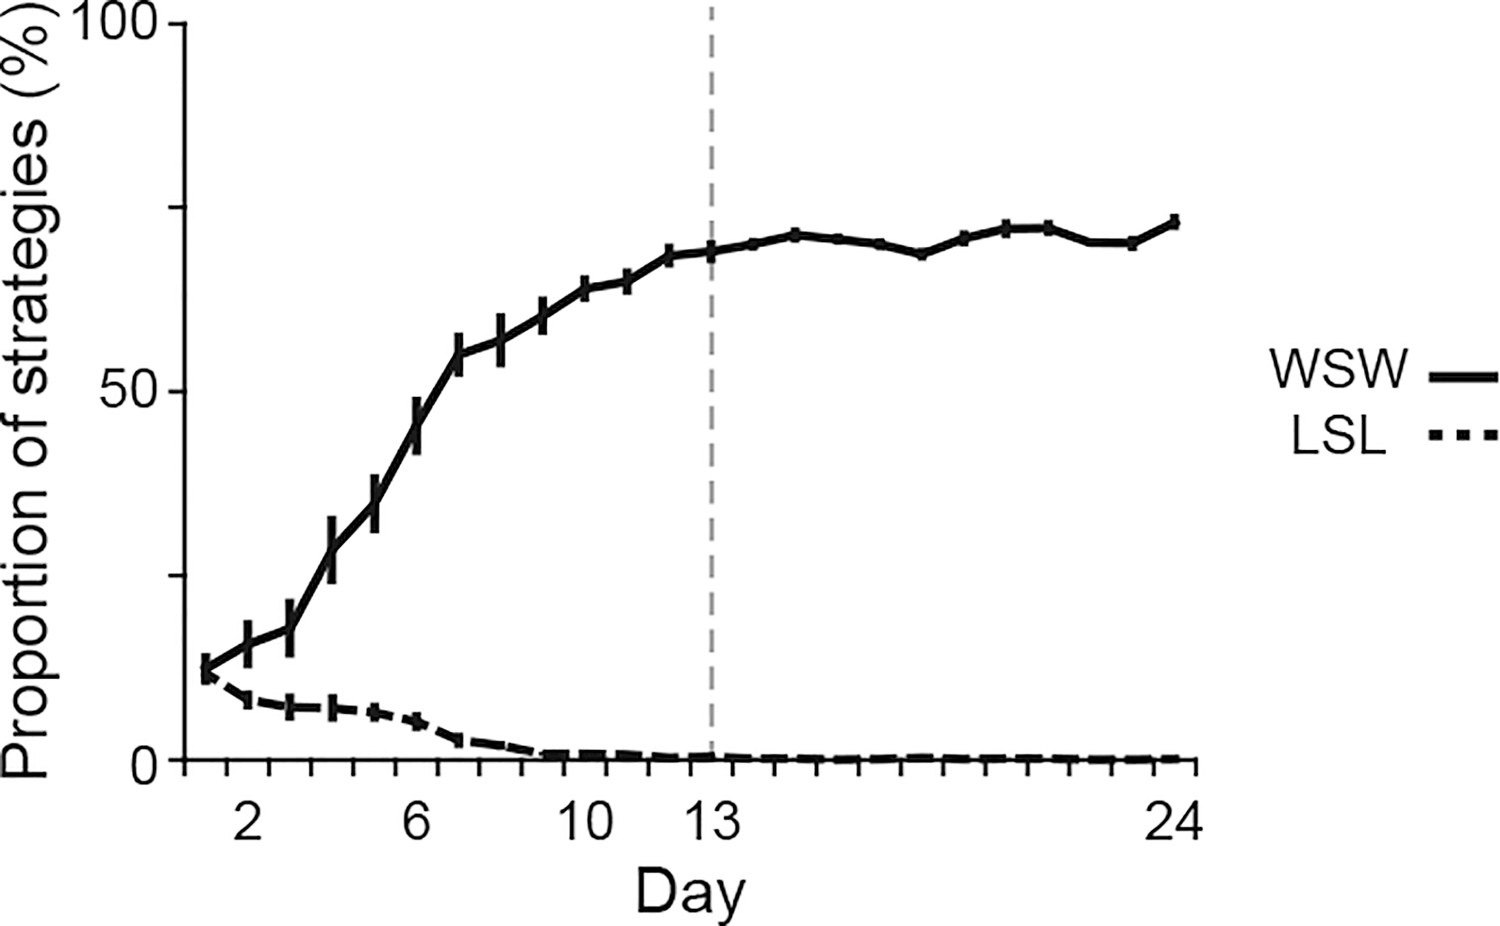
Proportions of behavioral strategies during auditory discrimination learning.
Proportions of the win-stay-win and lose-shift-lose strategies in intact rats (n = 14) shown in Figure 1. Vertical dashed line indicates the day of transition between the acquisition and learned phases. Data are indicated as the mean ± s.e.m. Abbreviations: WSW, win-shift-win; and LSL, lose-shift-lose.
-
Figure 1—figure supplement 1—source data 1
Behavioral strategies of intact rats.
- https://cdn.elifesciences.org/articles/97326/elife-97326-fig1-figsupp1-data1-v1.xlsx
Figure 2
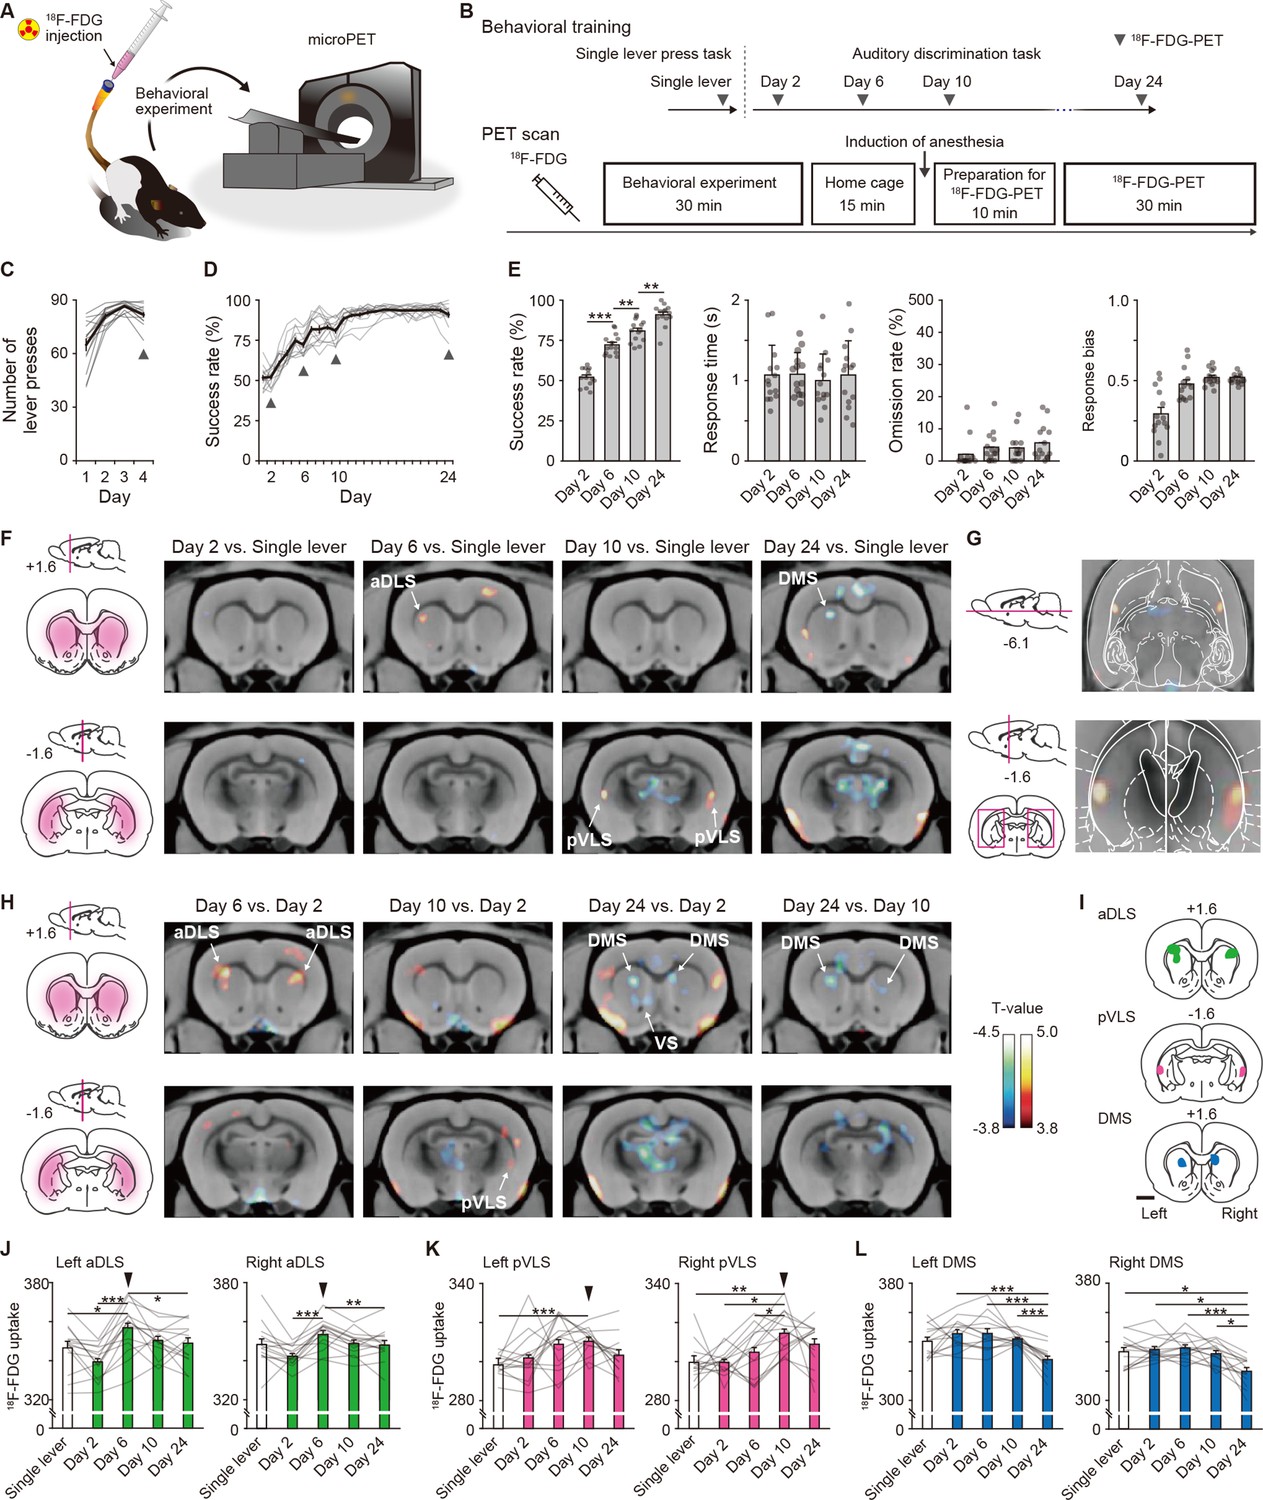
Dissociable brain activity patterns during auditory discrimination learning among three striatal subregions.
(A) Schematic illustration of an awake rat receiving intravenously 18F-FDG injection through an indwelling catheter attached to the tail. The rat was conducted for the behavioral experiment and then used for microPET imaging. (B) Schedule for the behavioral training and 18F-FDG-PET scan. After 18F-FDG injection, rats (n = 14 rats) were subjected to the behavioral experiment (30 min) and returned to the home cage (15 min). Ten min before the PET scan started, the rats were anesthetized, and then the scan was started (30 min). (C, D) Learning curves of the single lever press task (C) and auditory discrimination task (D). Arrowheads indicate the PET scan days. (E) Behavioral performance on the scan days during the auditory discrimination. Success rate (one-way repeated ANOVA, F[3,39] = 125.012, p = 4.8 × 10⁻²⁰, post hoc Bonferroni test; Day 2 vs. Day 6, p = 5.0 × 10⁻⁷; Day 6 vs. Day 10, p = 0.001; Day 10 vs. Day 24, p = 0.003, response time (one-way repeated ANOVA, F[3,39] = 0.156, p = 0.926), omission rate (one-way repeated ANOVA, F[3,39] = 1.559, p = 0.215), and response bias (one-way repeated ANOVA, F[1.779,23.130] = 17.734, p = 3.6 × 10⁻⁵) are shown. (F) Representative images of coronal sections that compared the brain activity in the single lever press task with the activity on Day 2, 6, 10, or 24 in the discrimination task. Left panels show schematic illustrations of striatal subregions. (G) Horizontal (top) and coronal (bottom) images of striatal activation areas shown on Day 10 vs. single lever in (F). (H) Representative images of coronal section that compared the brain activity on Day 2 with that on Day 6, 10, or 24 in the discrimination task. Color bars indicate the T-values, and a value of 3.8 was used as the threshold corresponding to the uncorrected threshold (p < 0.001). (I) Schematic pictures showing voxels of interests for the aDLS, pVLS, and DMS. (J–L) Regional 18F-FDG uptakes in the aDLS (J), one-way repeated ANOVA, left aDLS, F[4,52] = 10.322, p = 3.0 × 10⁻⁶, post hoc Bonferroni test; single lever vs. Day 6, p = 0.016; Day 2 vs. Day 6, p = 6.5 × 10⁻⁵; Day 2 vs. Day 10, p = 0.019; Day 2 vs. Day 24, p = 0.017; Day 6 vs. Day 24, p = 0.041; right aDLS, F[4,52] = 7.462, p = 7.9 × 10⁻⁵, post hoc Bonferroni test, Day 2 vs. Day 6, p = 2.9 × 10⁻⁴; Day 2 vs. Day 10, p = 0.036; Day 6 vs. Day 24, p = 0.005, pVLS (K), one-way repeated ANOVA, left pVLS, F[2.368,30.784] = 4.152, p = 0.020, post hoc Bonferroni test; single lever vs. Day 10, p = 1.8 × 10⁻⁵; right pVLS, F[4,52] = 5.995, p = 4.8 × 10⁻⁴, post hoc Bonferroni test, single lever vs. Day 10, p = 0.001; Day 2 vs. Day 10, p = 0.011; Day 6 vs. Day 10, p = 0.032, and DMS (L), one-way repeated ANOVA, left DMS, F[4,52] = 12.836, p = 2.4 × 10⁻⁷, post hoc Bonferroni test; Day 2 vs. Day 24, p = 1.8 × 10⁻⁵; Day 6 vs. Day 24, p = 4.8 × 10⁻⁴; Day 10 vs. Day 24, p = 5.5 × 10⁻⁵; right DMS, F[4,52] = 10.717, p=2.0 × 10⁻⁶, post hoc Bonferroni test; single lever vs. Day 24, p = 0.036; Day 2 vs. Day 24, p = 0.011; Day 6 vs. Day 24, p = 2.6 × 10⁻⁴; Day 10 vs. Day 24, p = 0.011). Arrowheads indicate the day with the most activations throughout the learning process. Data are indicated as the mean ± s.e.m., and individual data are overlaid. The anteroposterior coordinates from bregma (mm) are shown (F–I). Scale bar; 2 mm (I). *p < 0.05, **p < 0.01, and ***p < 0.001.
-
Figure 2—source data 1
Behavioral performance of rats conducted for microPET imaging and regional brain activity in striatal subregions.
- https://cdn.elifesciences.org/articles/97326/elife-97326-fig2-data1-v1.xlsx
-
Figure 2—source data 2
Task-related brain activity during the acquisition of auditory discrimination.
- https://cdn.elifesciences.org/articles/97326/elife-97326-fig2-data2-v1.docx
Figure 3 with 2 supplements
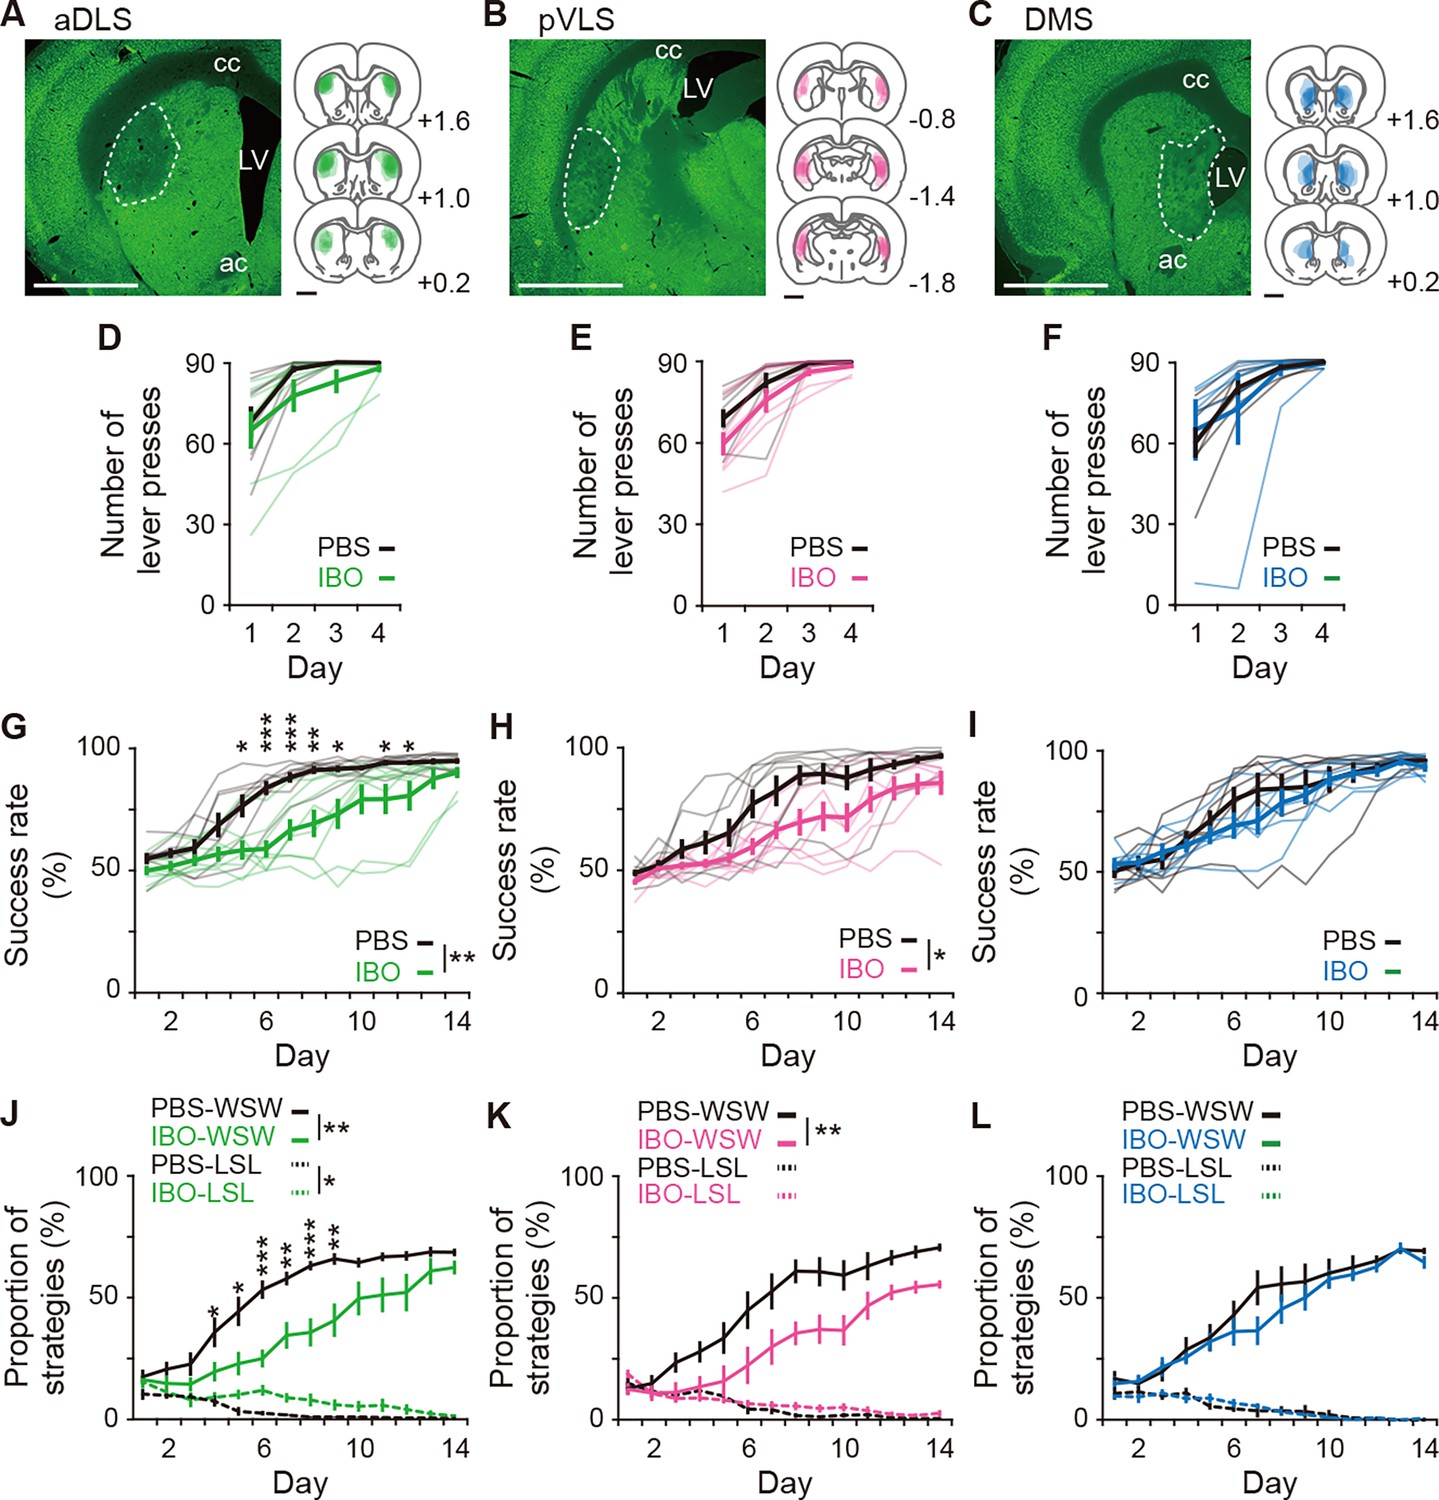
Impacts of excitotoxic lesion of striatal subregions on the acquisition of auditory discrimination.
Rats were given intracranial injection of PBS or IBO solution into the aDLS (n=8 for each injection), pVLS (n = 8 for each injection), or DMS (n = 7 for PBS injection, and n = 6 for IBO injection) before the start of the single lever press task. (A–C) Representative images of NeuN immunostaining and individual schematic illustrations showing lesioned area in the aDLS (A), pVLS (B), or DMS (C). Dotted lines in the images indicate the range of the lesioned area. ac, anterior commissure; cc, corpus callosum; and LV, lateral ventricle. (D–F) Learning curves during the single lever press task in the groups injected into the aDLS (D), two-way repeated ANOVA, group, F[1,14] = 1.275, p = 0.278, day, F[1.512,21.171] = 26.281, p = 7.0 × 10⁻⁶, group × day, F[1.512,21.171] = 0.834, p = 0.418, pVLS (E), two-way repeated ANOVA, group, F[1,14] = 2.542, p = 0.133, day, F[1.547,21.658] = 40.183, p = 2.2 × 10⁻⁷, group × day, F[1.547,21.658] = 0.953, p = 0.380, or DMS (F), two-way repeated ANOVA, group, F[1,11] = 0.025, p = 0.876, day, F[1.205,13.252] = 14.818, p = 0.001, group ×day, F[1.205,13.252] = 0.610, p = 0.478. (G–I) Learning curves during the auditory discrimination task in the groups injected into the aDLS (G), two-way repeated ANOVA, group, F[1,14] = 11.578, p = 0.004, day, F[2.805,39.274] = 60.733, p = 1.8 × 10⁻¹⁴, group × day, F[2.805,39.274] = 3.863, p = 0.018, simple main effect, PBS vs. IBO, Day 1, p = 0.140, Day 2, p = 0.085, Day 3, p = 0.284, Day 4, p = 0.068, Day 5, p = 0.011, Day 6, p = 9.5 × 10⁻⁵, Day 7, p = 0.001, Day 8, p = 0.002, Day 9, p = 0.012, Day 10, p = 0.059, Day 11, p = 0.034, Day 12, p = 0.046, Day 13, p = 0.136, Day 14, p = 0.096, pVLS (H), two-way repeated ANOVA, group, F[1,14] = 7.221, p = 0.018, day, F[3.646,51.041] = 51.794, p = 9.2 × 10⁻¹⁷, group × day, F[3.646,51.041] = 1.612, p = 0.190, or DMS (I), two-way repeated ANOVA, group, F[1,14] = 0.469, p = 0.507, day, F[2.677,29.452] = 48.860, p = 3.9 × 10⁻¹¹, group × day, F[2.677,29.452] = 1.094, p = 0.362. (J–L) Changes in the proportions of the win-shift-win or lose-shift-lose strategies through the discrimination learning in the groups treated into the aDLS (J), two-way repeated ANOVA, group, F[1,14] = 13.451, p = 0.003, day, F[3.048,42.673] = 54.777, p = 9.1 × 10⁻¹⁵, group × day, F[3.048,42.673] = 3.288, p = 0.029, simple main effect, PBS vs. IBO, Day 1, p = 0.728, Day 2, p = 0.225, Day 3, p = 0.165, Day 4, p = 0.044, Day 5, p = 0.015, Day 6, p = 1.1 × 10⁻⁴, Day 7, p = 0.002, Day 8, p = 5.1 × 10⁻⁴, Day 9, p = 0.004, Day 10, p = 0.060, Day 11, p = 0.053, Day 12, p = 0.081, Day 13, p = 0.198, Day 14, p = 0.075 for win-shift-win; group, F[1,14] = 5.039, p = 0.041, day, F[3.866,54.119] = 14.578, p = 5.2 × 10⁻⁸, group × day, F[3.866,54.119] = 2.471, p = 0.057 for lose-shift-lose, pVLS (K), two-way repeated ANOVA, group, F[1,14] = 9.251, p = 0.009, day, F[3.206,44.881] = 47.168, p = 2.7 × 10⁻¹⁴, group × day, F[3.206,44.881] = 1.862, p = 0.146 for win-shift-win; group, F[1,14] = 0.762, p = 0.397, day, F[4.773,66.815] = 24.018, p = 1.9 × 10⁻¹³, group × day, F[4.773,66.815] = 1.338, p = 0.260 for lose-shift-lose, or DMS (L), two-way repeated ANOVA, group, F[1,14] = 0.703, p = 0.420, day, F[3.052,33.568] = 48.424, p = 2.3 × 10⁻¹², group × day, F[3.052,33.568] = 0.846, p = 0.480 for win-shift-win; group, F[1,14] = 0.002, p = 0.965, day, F[3.442,37.866] = 13.787, p = 1.0 × 10⁻⁶, group × day, F[3.442, 37.866] = 0.581, p = 0.654 for lose-shift-lose. Data are indicated as the mean ± s.e.m., and individual data are overlaid (except for panels J–L). The anteroposterior coordinates from bregma (mm) are shown (A–C). Scale bars; 2 mm (A–C). *p < 0.05, **p < 0.01 and ***p < 0.001. Abbreviations: WSW, win-shift-win; and LSL, lose-shift-lose.
-
Figure 3—source data 1
Behavioral performance and strategies of IBO-lesioned rats.
- https://cdn.elifesciences.org/articles/97326/elife-97326-fig3-data1-v1.xlsx
Figure 3—figure supplement 1
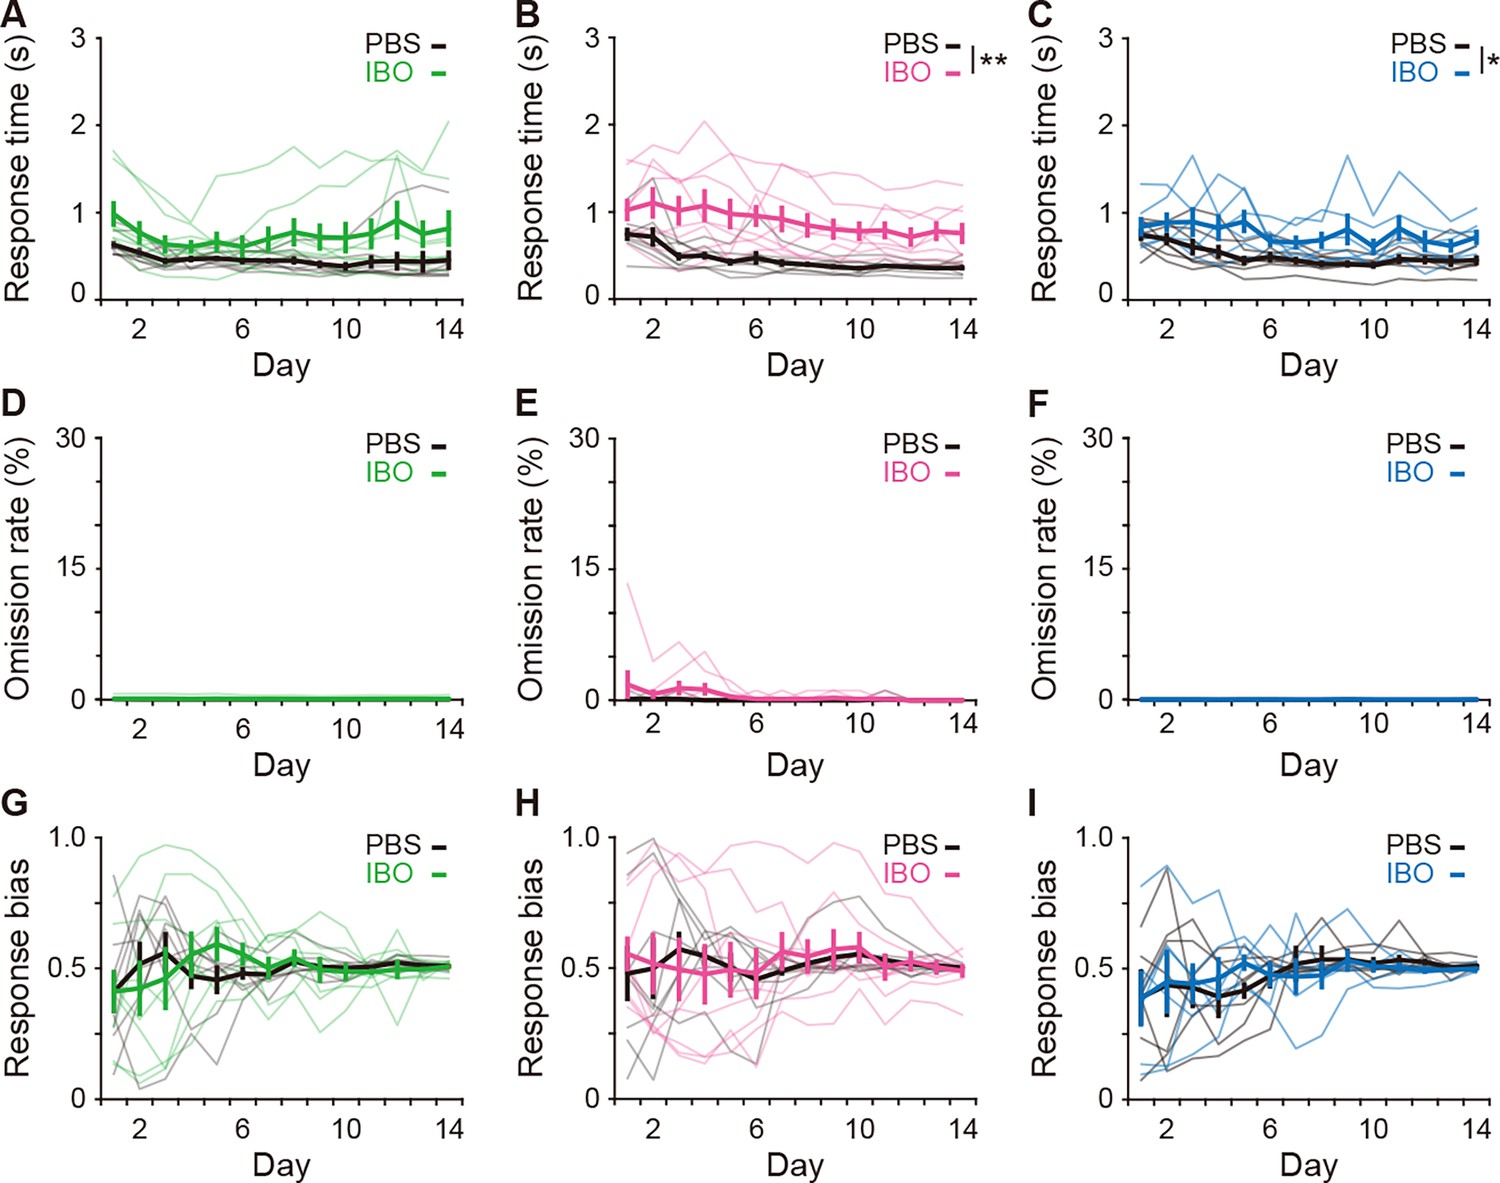
Effects of excitotoxic lesion on the reaction time, omission ratio, and response bias.
(A–C) Response time (A), two-way repeated ANOVA, day, F[2.728,38.193] = 2.867, p = 0.054, group, F[1,14] = 3.562, p = 0.080, day × group, F[2.728,38.193] = 1.137, p = 0.343 for the aDLS; B, day, F[2.890,40.456] = 6.230, p = 0.002, group, F[1,14] = 13.566, p = 0.002, day × group, F[2.890,40.456] = 0.685, p = 0.561 for the pVLS; (C), day, F[3.123,34.358] = 4.659, p = 0.007, group, F[1,14] = 6.474, p = 0.027, day × group, F[3.123,34.358] = 1.127, p = 0.353 for the DMS. (D–F) Omission rate (D), two-way repeated ANOVA, day, F[1.066,14.927] = 1.038, p = 0.330; group, F[1,14] = 1.041, p = 0.325, day × group, F[1.066,14.927] = 0.800, p = 0.393 for the aDLS; (E), day, F[1.384,19.372] = 1.483, p = 0.247, group, F[1,14] = 2.297, p = 0.152, day × group, F[1.384,19.372] = 1.140, p = 0.320 for the pVLS; (F), day, F[3.119,34.306] = 2.398, p = 0.083, group, F[1,14] = 0.950, p = 0.351, day × group, F[3.119,34.306] = 0.951, p = 0.429 for the DMS. (G–I) Response bias (G), two-way repeated ANOVA, day, F[2.573,36.027] = 0.748, p = 0.512, group, F[1,14] = 0.008, p = 0.929, day × group, F[2.573,36.027] = 0.853, p = 0.459 for the aDLS; (H), day, F[2.523,35.317] = 0.430, p = 0.699, group, F[1,14] = 0.008, p = 0.931, day × group, F[2.523,35.317] = 0.349, p = 0.756 for the pVLS; (I), day, F[2.429,26.718] = 1.286, p = 0.297, group, F[1,14] = 2.4 × 10⁻⁵, p = 0.996, day × group, F[2.429,26.718] = 0.348, p = 0.749 for the DMS. Data are indicated as the mean ± s.e.m., and individual data are overlaid. *p < 0.05 and **p < 0.01.
-
Figure 3—figure supplement 1—source data 1
Reaction time, omission ratio, and response bias of IBO-lesioned rats.
- https://cdn.elifesciences.org/articles/97326/elife-97326-fig3-figsupp1-data1-v1.xlsx
Figure 3—figure supplement 2
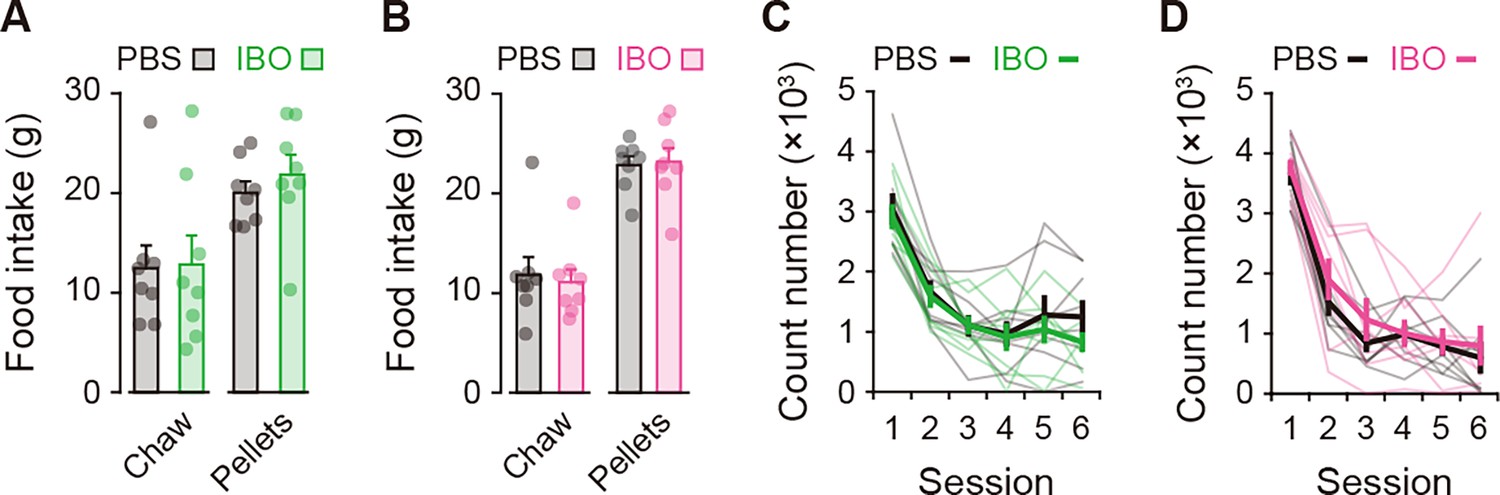
Effects of excitotoxic lesion on feeding behavior and locomotion.
(A, B) Amounts of food intake (laboratory chow or reinforcement pellets) for 60 min (A), unpaired Student’s t-test, laboratory chow, t[14] = 0.101, p = 0.921; reinforcement pellets, t[14] = 0.796, p = 0.439 for the aDLS; (B), laboratory chow, t[14] = 0.345, p = 0.735; reinforcement pellets, t[14] = 0.201, p = 0.844 for the pVLS. (C, D) Time course of the number of beam breaks for a 10-min block in the open field (C), two-way repeated ANOVA, session, F[2.214,30.994] = 34.082, p = 6.8 × 10⁻⁹, group, F[1,14] = 0.530, p = 0.479, session × group, F[2.214,30.994] = 0.348, p = 0.730 for the aDLS; (D), session, F[5,70] = 79.020, p = 2.1 × 10⁻²⁷, group, F[1,14] = 0.559, p = 0.467,session × group, F[5,70] = 0.382, p = 0.860 for the pVLS. Data are indicated as the mean ± s.e.m., and individual data are overlaid.
-
Figure 3—figure supplement 2—source data 1
Feeding behavior and locomotion of IBO-lesioned rats.
- https://cdn.elifesciences.org/articles/97326/elife-97326-fig3-figsupp2-data1-v1.xlsx
Figure 4 with 3 supplements

Influences of transient inhibition of striatal subregions at different timings on the performance of auditory discrimination.
Rats received intracranial injection of SAL or MUS solution into the aDLS (n = 8 for each injection) or pVLS (n = 6 for each injection). (A, B) Representative images of cresyl violet staining and schematic illustrations showing placement sites of the tip of guide cannula in the aDLS (A) or pVLS (B). Dotted lines in the images indicate the position of the cannula placement. ac, anterior commissure; cc, corpus callosum; and LV, lateral ventricle. (C, D) Effects of transient striatal inhibition on the performance. For aDLS inhibition (C), success rate (left, two-way repeated ANOVA, stage, F[2,28] = 28.708, p = 1.7 × 10⁻⁷, group, F[1,14] = 8.840, p = 0.010, stage × group, F[1,14] = 0.757, p = 0.478; unpaired Student’s t-test, early, t[14] = 0.558, p = 0.586; middle, t[14] = 2.764, p = 0.015; Welch’s t-test, late, t[12.010] = 1.617, p = 0.132, p = 0.016 after a Bonferroni correction method) and subtracted success rate on day N-1 from that on day N (right, two-way repeated ANOVA, stage, F[2,28] = 1.231, p = 0.307, group, F[1,14] = 10.797, p = 0.005, stage × group, F[2,28] = 2.360, p = 0.113; unpaired Student’s t-test, early, t[14] = 0.285, p = 0.780, late, t[14] = 1.271, p = 0.225, Welch’s t-test, middle, t[9.603] = 3.331, p = 0.008, p = 0.016 after a Bonferroni correction method). For pVLS inhibition (D), success rate (left, two-way repeated ANOVA, stage, F[2,28] = 17.642, p = 3.8 × 10⁻⁵, group, F[1,10] = 43.942, p = 5.9 × 10⁻⁵, stage × group, F[2,20] = 4.729, p = 0.012; simple main effect, early, p = 0.055, middle, p = 0.109, late, p = 4.2 × 10⁻⁵) and subtracted success rate on day N-1 from that on day N (right, two-way repeated ANOVA, stage, F[2,20] = 12.105, p = 3.6 × 10⁻⁴, group, F[1,10] = 16.310, p = 0.002, stage × group, F[2,20] = 8.500, p = 0.002; simple main effect, early, p = 0.595, middle, p = 0.085, late, p = 3.0 × 10⁻⁶). (E, F) Subtracted proportion of the win-shift-win or lose-shift-lose strategies in the groups injected into the aDLS at the middle stage (E), unpaired Student’s t-test, t[14] = 2.038, p = 0.061 for win-shift-win, and t[14] = 2.714, p = 0.017 for lose-shift-lose and the late stage (F), unpaired Student’s t-test, t[14] = 0.898, p = 0.384 for win-shift-win, and t[14] = 0.226, p = 0.824 for lose-shift-lose. (G, H) Subtracted proportion of the win-shift-win or lose-shift-lose strategies in the groups injected into the pVLS at the middle stage (G), unpaired Student’s t-test, t(10) = 1.924, p = 0.083 for win-shift-win, and Welch’s t-test, t[6.095] = 1.364, p = 0.221 for lose-shift-lose and the late stage (H), unpaired Student’s t-test, t[10] = 3.629, p = 0.005 for win-shift-win, and t[10] = 1.577, p = 0.146 for lose-shift-lose. Data are indicated as the mean ± s.e.m., and individual data are overlaid. The anteroposterior coordinates from bregma (mm) are shown (A, B). Scale bars; 2 mm (A, B). *p < 0.05, **p < 0.01, and ***p < 0.001. Abbreviations: WSW, win-shift-win; and LSL, lose-shift-lose.
-
Figure 4—source data 1
Behavioral performance and strategies of MUS-injected rats.
- https://cdn.elifesciences.org/articles/97326/elife-97326-fig4-data1-v1.xlsx
Figure 4—figure supplement 1
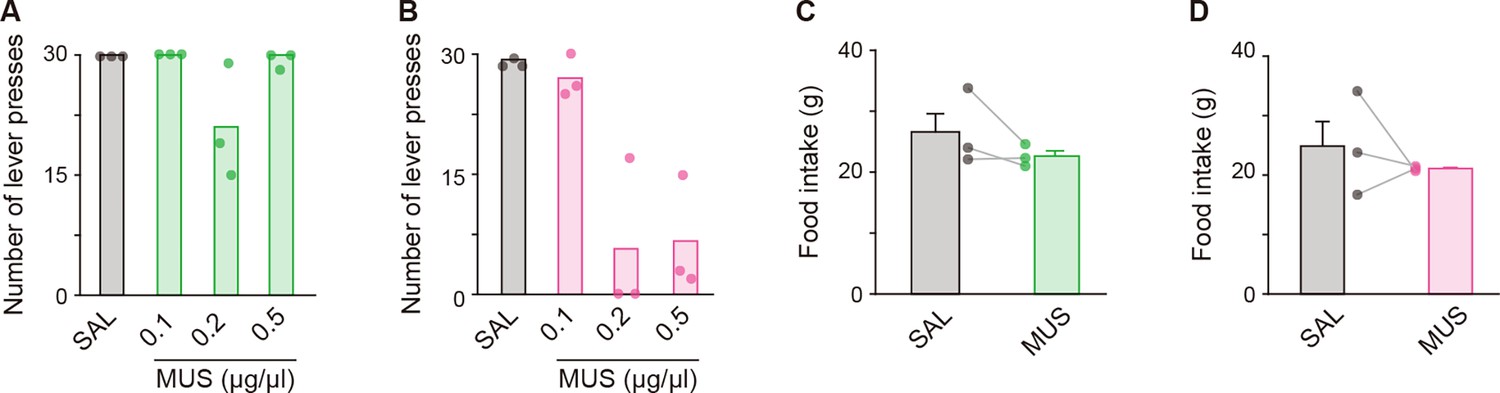
Effects of bilateral MUS injections into the aDLS and pVLS on the single lever press task and feeding behavior.
Rats (n = 3 for each group) received a bilateral injection of solution containing MUS or SAL into the aDLS and pVLS and then conducted the behavioral task. (A, B) Number of single lever presses in group injected with SAL or different doses of MUS into the aDLS (A), one-way repeated ANOVA, F[3,6] = 4.315, p = 0.061 or the pVLS (B), one-way repeated ANOVA, F[3,6] = 27.236, p = 6.8 × 10⁻⁴. (C, D) Amount of food intake for 60 min after the SAL and MUS (0.1 μg/μL) injections into the aDLS (C), paired Student’s t-test, t[2] = 1.450, p = 0.284 or the pVLS (D), paired Student’s t-test, t[2] = 0.726, p = 0.543. Data are indicated as the mean ± s.e.m., and individual data are overlaid.
-
Figure 4—figure supplement 1—source data 1
Single lever press task and feeding behavior of MUS-injected rats.
- https://cdn.elifesciences.org/articles/97326/elife-97326-fig4-figsupp1-data1-v1.xlsx
Figure 4—figure supplement 2
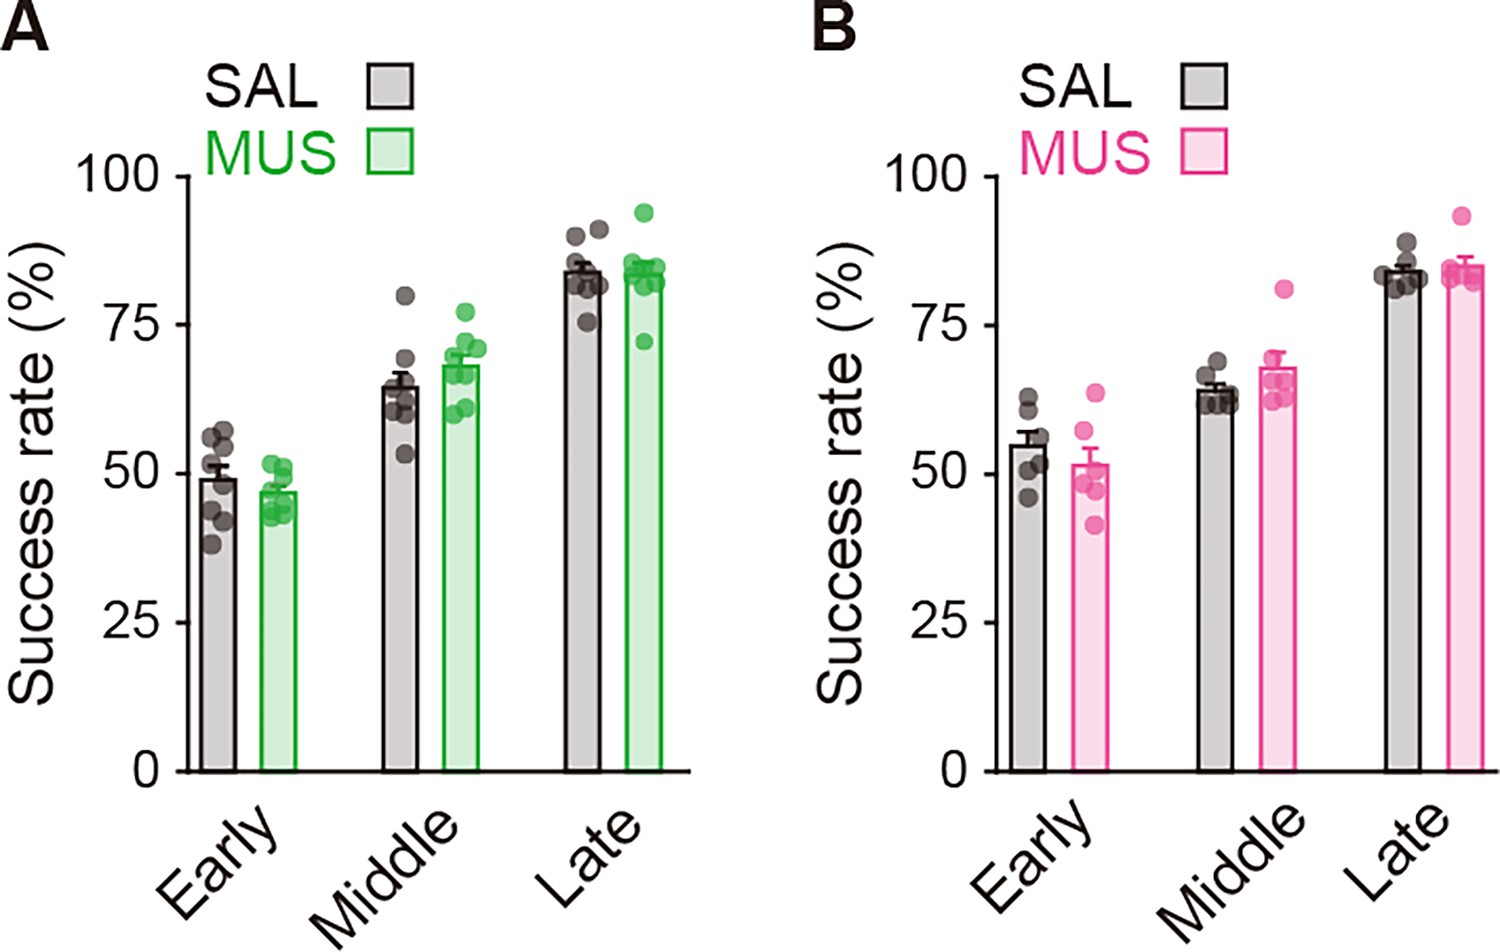
Performance of the auditory discrimination task on Day N-1 of rats used for the injection into striatal subregions.
The success rate in the groups used for the aDLS injection (A), unpaired Student’s t-test, early, t[10.437] = 0.800, p = 0.441; middle, t[14] = 1.064, p = 0.305; late, t[14] = 0.118, p = 0.907 or the pVLS injection (B), unpaired Student’s t-test: early, t[10] = 0.789, p = 0.448; middle, t[10] = 1.224, p = 0.249; late, t[10] = 0.489, p = 0.635. Data are indicated as the mean ± s.e.m., and individual data are overlaid.
-
Figure 4—figure supplement 2—source data 1
Behavioral performance on Day N-1 of MUS-injected rats.
- https://cdn.elifesciences.org/articles/97326/elife-97326-fig4-figsupp2-data1-v1.xlsx
Figure 4—figure supplement 3
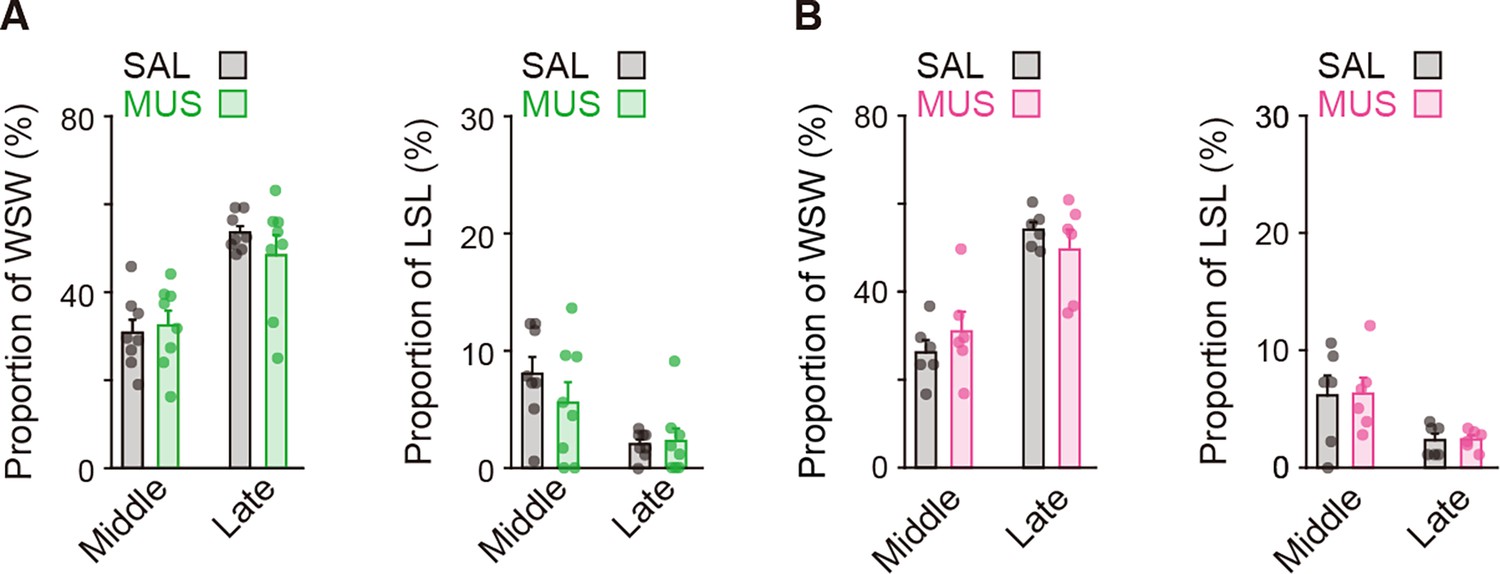
Proportion of the behavioral strategies on Day N-1 of rats used for the striatal injection.
The strategy proportion in the groups used for the aDLS injection (A), unpaired Student’s t-test, win-shift-win: middle, t[14] = 0.376, p = 0.713; and late, t[8.479] = 1.078, p = 0.311. lose-shift-lose: middle, t[4] = 1.084, p = 0.297; and late, t[14] = 0.229, p = 0.822 or the pVLS injection (B), unpaired Student’s t-test, win-shift-win: middle, t[10] = 0.912, p = 0.383; and late, t[6.408] = 0.942, p = 0.380. lose-shift-lose: middle, t[10] = 0.075, p = 0.942; and late, t[8.267] = 0.129, p = 0.900. Data are indicated as the mean ± s.e.m., and individual data are overlaid. Abbreviations: WSW, win-shift-win; and LSL, lose-shift-lose.
-
Figure 4—figure supplement 3—source data 1
Behavioral strategies on Day N-1 of MUS-injected rats.
- https://cdn.elifesciences.org/articles/97326/elife-97326-fig4-figsupp3-data1-v1.xlsx
Figure 5 with 5 supplements
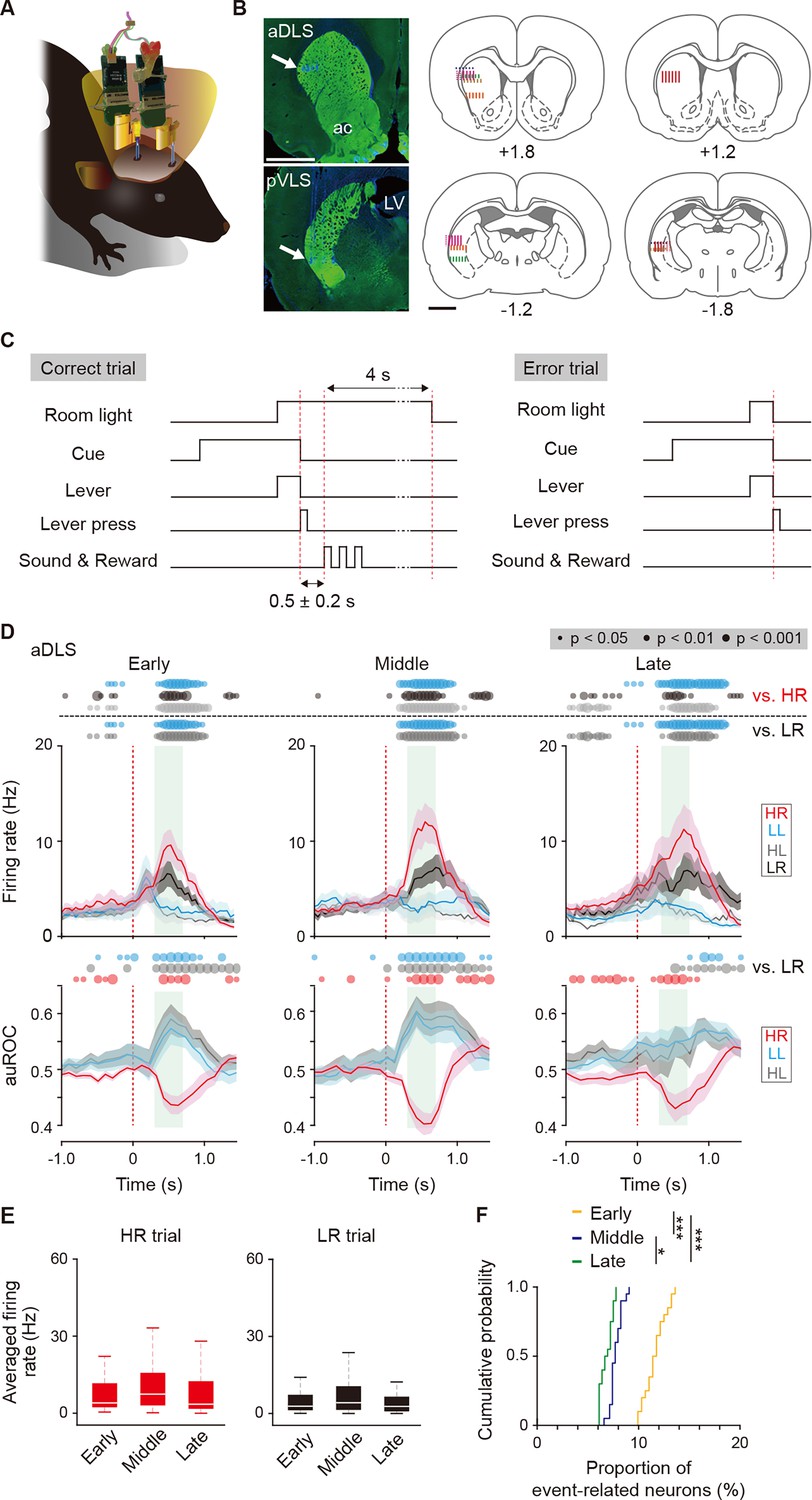
Multi-unit recording of neurons in striatal subregions and firing activity related to the behavioral outcome of reward sound-related HR type neurons in the aDLS.
(A) Schematic illustration of a freely moving rat used for simultaneous multi-unit recordings in the aDLS and pVLS. Six rats were used for the following analysis. (B) Representative images of TH immunostaining, showing positions of electrode tips (arrows) in the aDLS and pVLS (left rows). The recording sites estimated by electrode tracks and electrical marks in individual rats are shown (center and right rows). ac, anterior commissure; LV, lateral ventricle. (C) Sequence of some events in correct and error trials. The delay periods were pseudorandomly added between a correct lever press and the reward sound (0.5 ± 0.2 s). The room light turned off the extended time (4 s) after the correct response or immediately after the error response. (D) Mean firing rate (top rows) and auROC values (bottom rows) of reward sound-related HR type neurons in the aDLS at the early (n = 43 neurons), middle (n = 37 neurons), and late (n = 44 neurons) stages. These data are aligned to the choice response. Green shadows show the period when the reward sound is presented (500 ± 200 ms after the lever press). Time bins with significant differences between the mean firing rate in the HR or LR trial and any of the rates in the other three trials (Wilcoxon signed rank test) or the distribution of auROC values and 0.5 (Wilcoxon rank-sum test) are represented by the circles at the top. (E) Averaged firing rate during the reward sound period in the HR and LR trials at the early, middle, and late stages (Kruskal-Wallis test: HR trial, χ2 = 3.028, p = 0.220; and LR trial, χ2 = 1.249, p = 0.536). (F) Cumulative probability of the proportion of reward sound-related HR type neuron number at the three stages (Kruskal-Wallis test, χ2 = 45.378, p = 1.4 × 10⁻¹⁰; post hoc Tukey-Kramer test, p = 7.1 × 10⁻⁵ for early vs. middle, p = 1.0 × 10⁻⁹ for early vs. late, and p = 0.040 for middle vs. late). Data are indicated as the mean ± s.e.m. (D) or the median and quartiles with the maximal and minimal values (E). The anteroposterior coordinates from bregma (mm) are shown (B). Scale bars; 2 mm (B). *p < 0.05 and ***p < 0.001.
-
Figure 5—source data 1
Firing activity of reward sound-related HR type neurons in the aDLS.
- https://cdn.elifesciences.org/articles/97326/elife-97326-fig5-data1-v1.xlsx
Figure 5—figure supplement 1
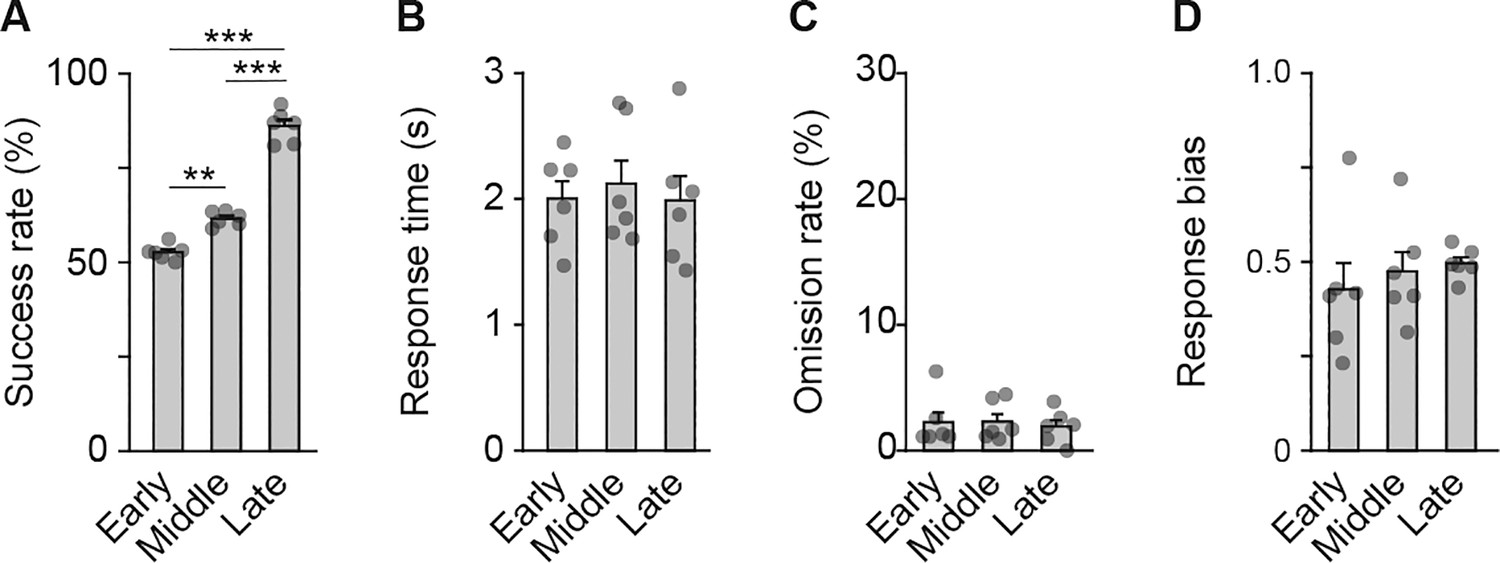
Behavioral performance of rats used for the multi-unit recording experiment.
Behavioral parameters at the early, middle, and late stages. Success rates (A), one-way repeated ANOVA, F[2,10] = 213.186, p = 6.3 × 10⁻⁹, post hoc Bonferroni test; early vs. middle, p = 0.003; early vs. late, p = 5.7 × 10⁻⁵; middle vs. late, p = 4.9 × 10⁻⁵. Response time (B), one-way repeated ANOVA, F[2,10] = 0.379, p = 0.694. Omission rate (C), one-way repeated ANOVA, F[2,10] = 0.163, p = 0.852. Response bias (D), one-way repeated ANOVA, F[2,10] = 0.600, p = 0.567. Data are indicated as the mean ± s.e.m., and individual data are overlaid. **p < 0.01 and ***p < 0.001.
-
Figure 5—figure supplement 1—source data 1
Behavioral performance of rats used for the multi-unit recording.
- https://cdn.elifesciences.org/articles/97326/elife-97326-fig5-figsupp1-data1-v1.xlsx
Figure 5—figure supplement 2
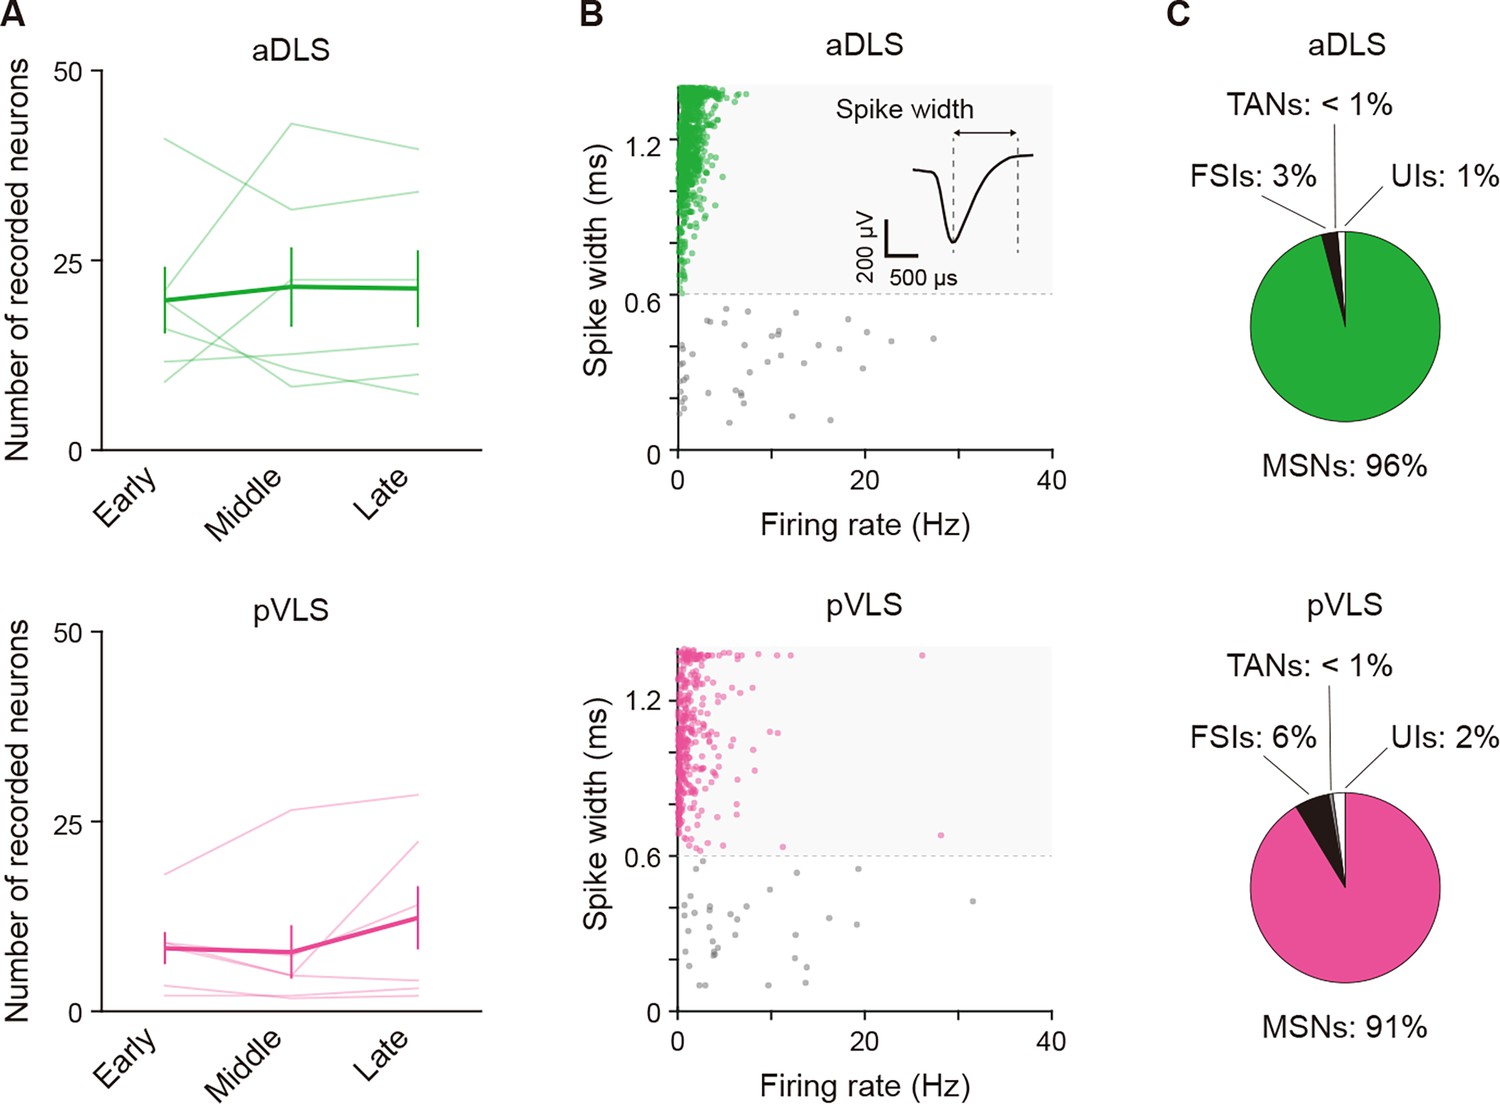
Properties of identified neurons in the multi-unit recording experiment.
(A) Averaged number of well-isolated neurons for every stage in individual rats (one-way repeated ANOVA, aDLS, F[1.045,5.226] = 0.098, p = 0.777; pVLS, F[2,10] = 1.855, p = 0.207). (B) Scatter plots of spike width and firing rate of aDLS and pVLS neurons. The spike width was measured as the trough-to-peak width of the mean wide-band spike waveform. A representative waveform is shown. Putative MSNs were defined as units with >0.6 ms spike width (green shaded areas). (C) Proportions of neurons classified as MSNs, fast spiking interneurons (28 and 25 neurons for the aDLS and pVLS, respectively), tonically active neurons (1 and 2 neuron (s) for the aDLS and pVLS, respectively), and unclassified interneurons (14 and 9 neurons for the aDLS and pVLS, respectively). Data are indicated as the mean ± s.e.m., and individual data are overlaid. Abbreviations: FSIs, fast spiking interneurons; TANs, tonically active neurons; and UIs, unclassified interneurons.
-
Figure 5—figure supplement 2—source data 1
Numbers of identified neurons in the multi-unit recording.
- https://cdn.elifesciences.org/articles/97326/elife-97326-fig5-figsupp2-data1-v1.xlsx
Figure 5—figure supplement 3
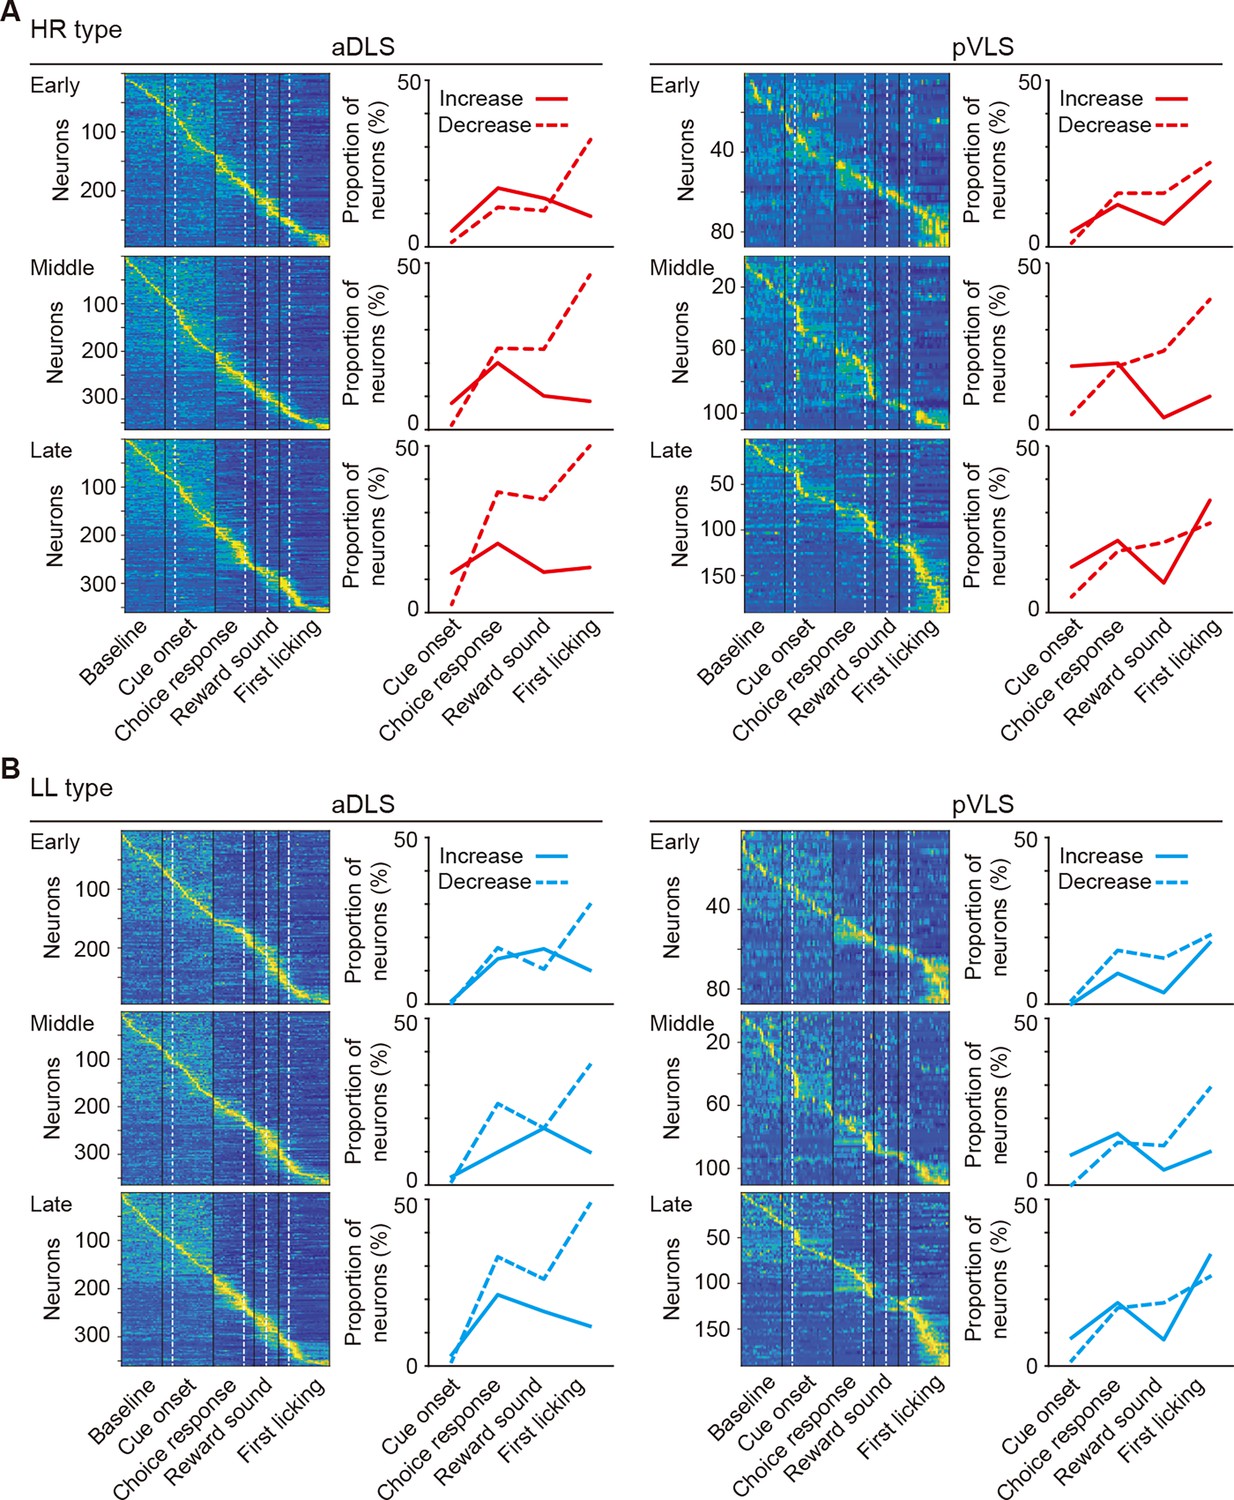
Changes in event-related firing activity of HR and LL type neurons during the acquisition phase of the auditory discrimination task.
(A, B) Pseudocolor maps indicate the z-scored event-related firing rate of HR (A) and LL (B) type neurons in the aDLS and pVLS. Spike data for each 50 ms bin during the baseline and time windows around the cue onset, choice response, reward sound, and first licking were concatenated in series. The proportion of neurons with increased or decreased activity is shown on the right side of the corresponding maps.
-
Figure 5—figure supplement 3—source data 1
Proportions of event-related neurons during the auditory discrimination task.
- https://cdn.elifesciences.org/articles/97326/elife-97326-fig5-figsupp3-data1-v1.xlsx
Figure 5—figure supplement 4
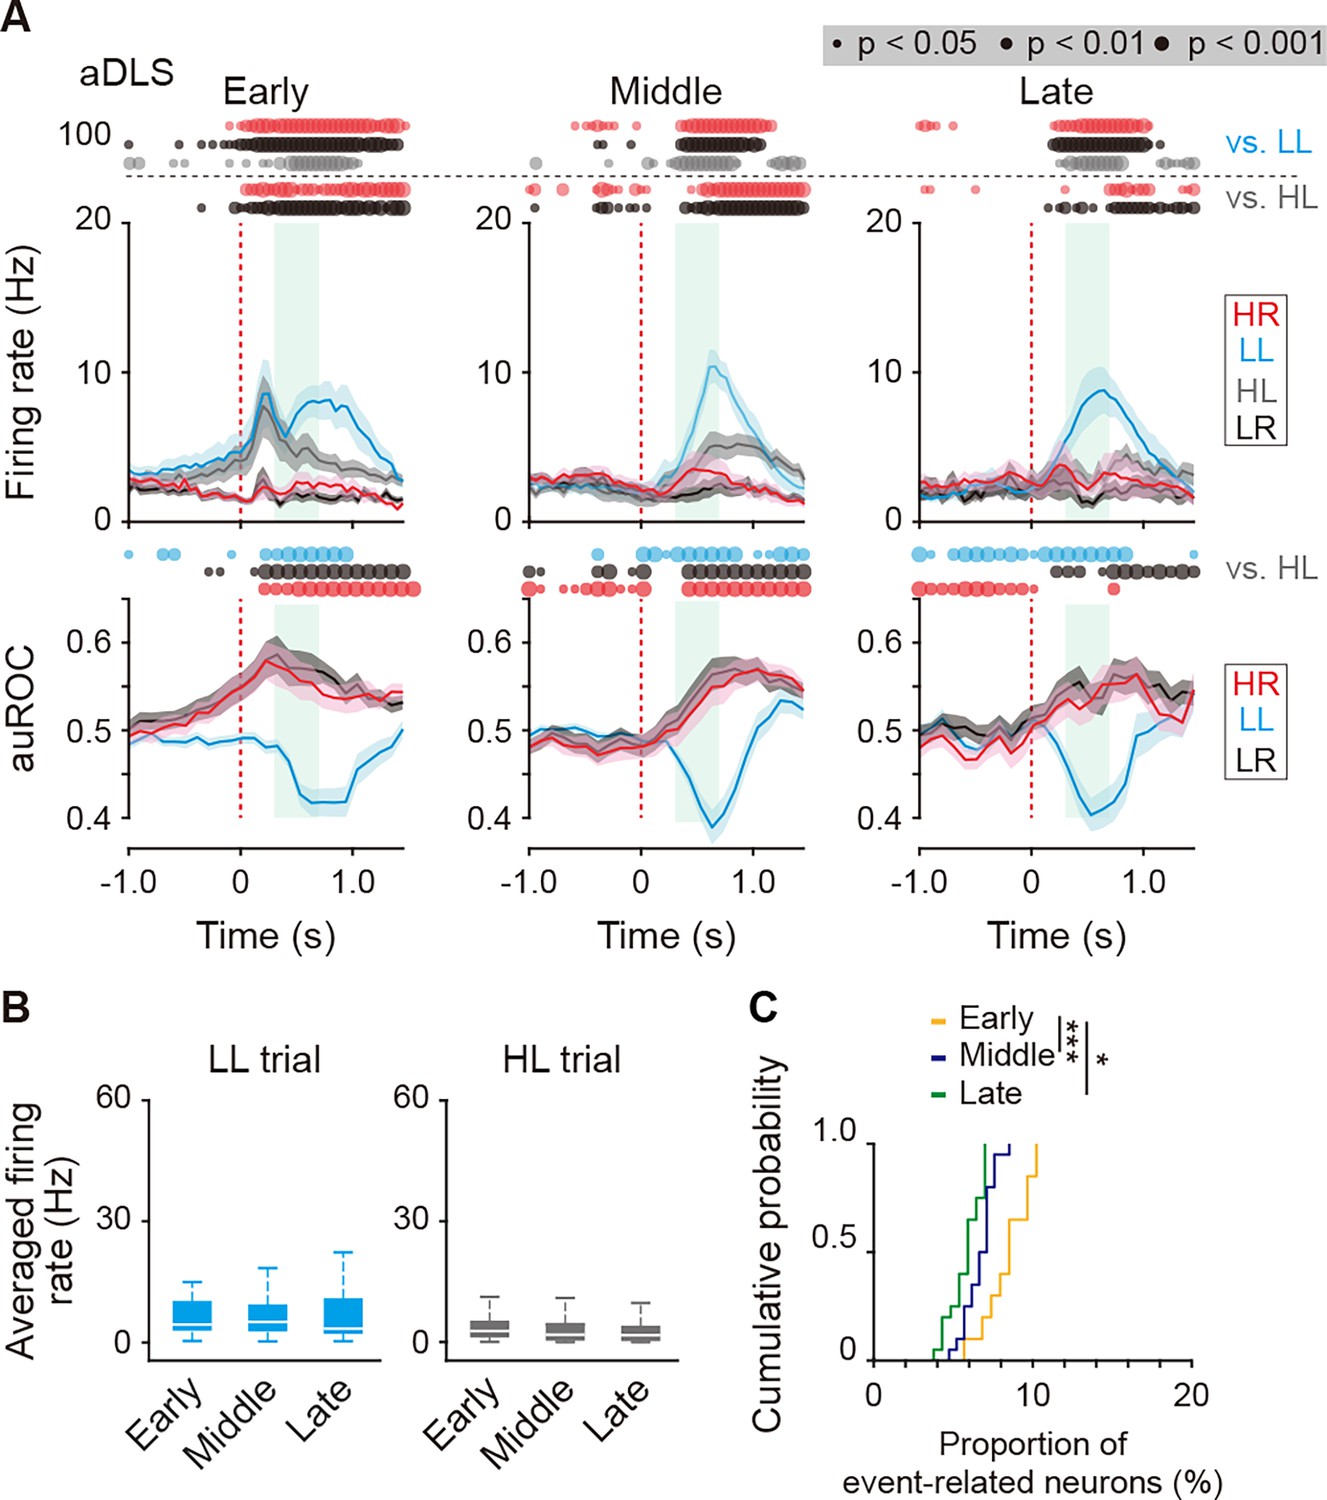
Firing activity of reward sound-related LL type neurons in the aDLS at the three learning stages.
(A) Mean firing rate (top rows) and auROC values (bottom rows) of reward sound-related LL type neurons in the aDLS at the early (n = 49 neurons), middle (n = 62 neurons), and late (n = 59 neurons) stages. These data are aligned to the choice response. Green shadows show the period when the reward sound is presented (500 ± 200 ms after the lever press). Time bins with significant differences between the mean firing rate in the LL or HL trial and either of the rates in the other three trials (Wilcoxon signed rank test) or the distribution of auROC values and 0.5 (Wilcoxon rank-sum test) are represented by the circles at the top. (B) Averaged firing rate during the reward sound period in the LL and HL trials at the early, middle, and late stages (Kruskal-Wallis test, LL trial, χ2 = 2.467, p = 0.291, HL trial, χ2 = 4.426, p = 0.109). (C) Cumulative probability of the proportion of the reward sound-related LL type neurons at the three stages (Kruskal-Wallis test, χ2 = 26.419, p = 1.8 × 10⁻⁶, post hoc Tukey–Kramer test, p = 8.9 × 10⁻⁷ for early vs. middle; p = 0.010 for early vs. late; and p = 0.067 for middle vs. late). Data are indicated as the mean ± s.e.m. (A) or the median and quartiles with the maximal and minimal values (B). *p < 0.05 and ***p < 0.001.
-
Figure 5—figure supplement 4—source data 1
Firing activity of reward sound-related LL type neurons in the aDLS.
- https://cdn.elifesciences.org/articles/97326/elife-97326-fig5-figsupp4-data1-v1.xlsx
Figure 5—figure supplement 5
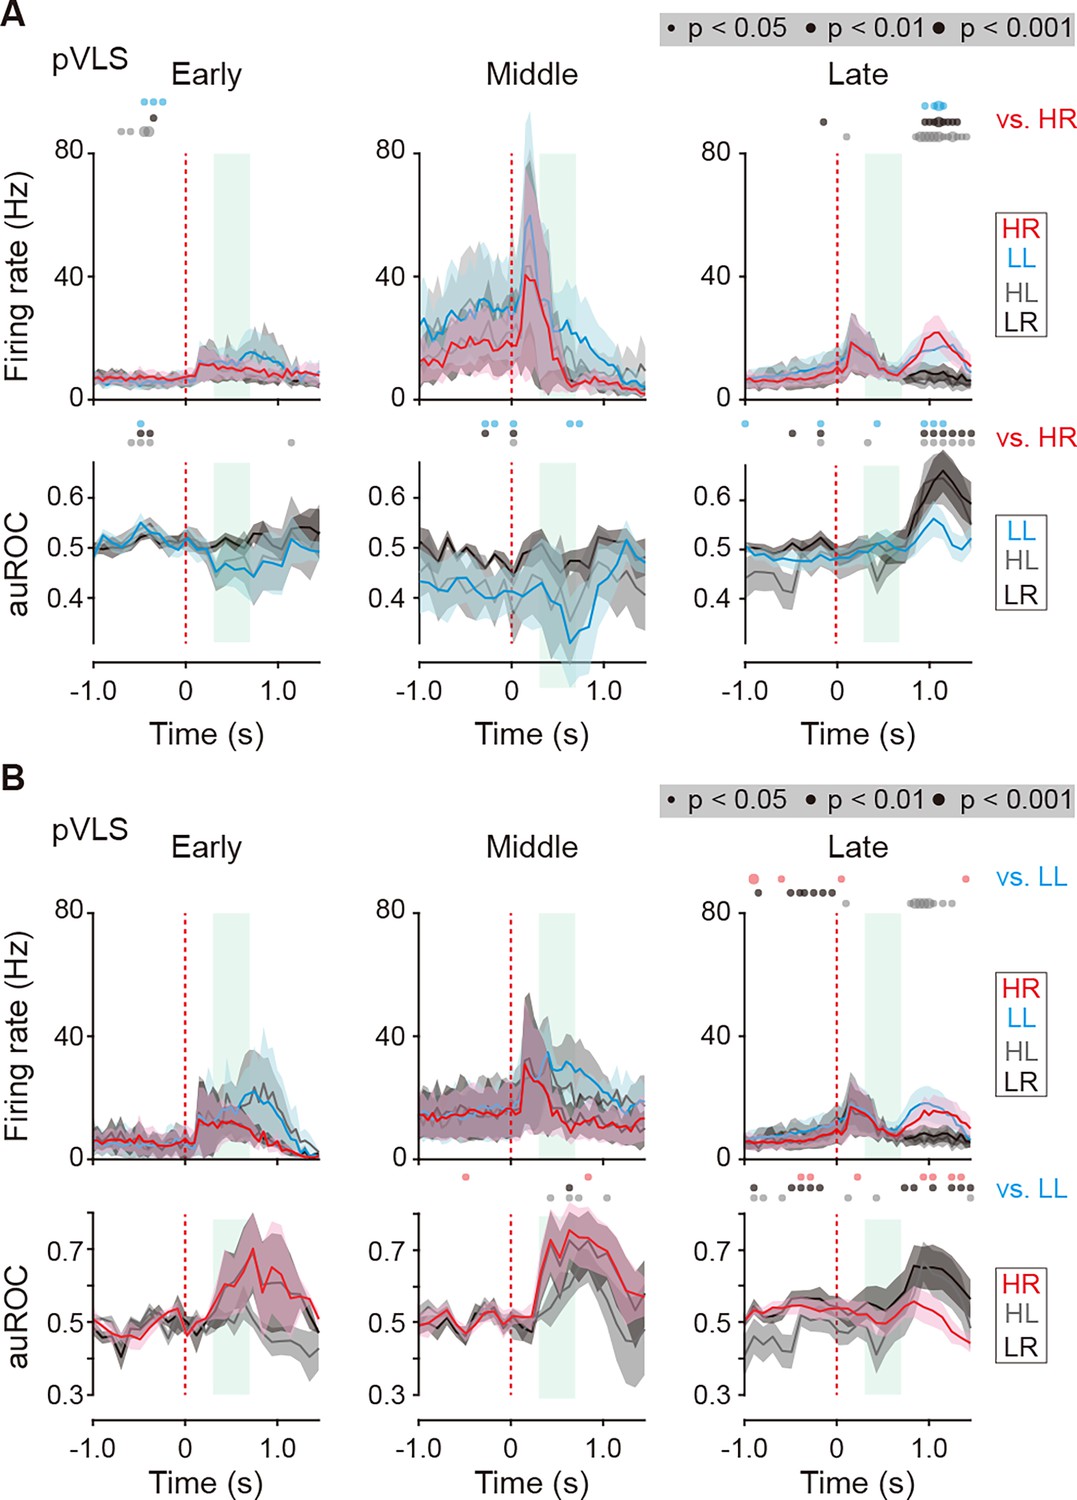
Firing activity of reward sound-related HR and LL type neurons in the pVLS at the three learning stages.
(A) Mean firing rate (top rows) and auROC values (bottom rows) of the reward sound-related HR type neurons in the pVLS at the early (n = 6 neurons), middle (n = 4 neurons), and late (n = 17 neurons) stages. (B) Mean firing rate (top rows) and auROC values (bottom rows) of the reward sound-related LL type neurons in the pVLS at the early (n = 3 neurons), middle (n = 5 neurons), and late (n = 15 neurons) stages. These data are aligned to the choice response. Green shadows show the period when the reward sound is presented. Time bins with significant differences between the mean firing rate in the HR (A) or LL (B) trial and any of the rate in other three trials (Wilcoxon signed rank test) or the distribution of auROC values and 0.5 (Wilcoxon rank-sum test) are represented by the circles at the top. Data are indicated as the mean ± s.e.m.
-
Figure 5—figure supplement 5—source data 1
Firing activity of reward sound-related neurons in the pVLS.
- https://cdn.elifesciences.org/articles/97326/elife-97326-fig5-figsupp5-data1-v1.xlsx
Figure 6 with 2 supplements
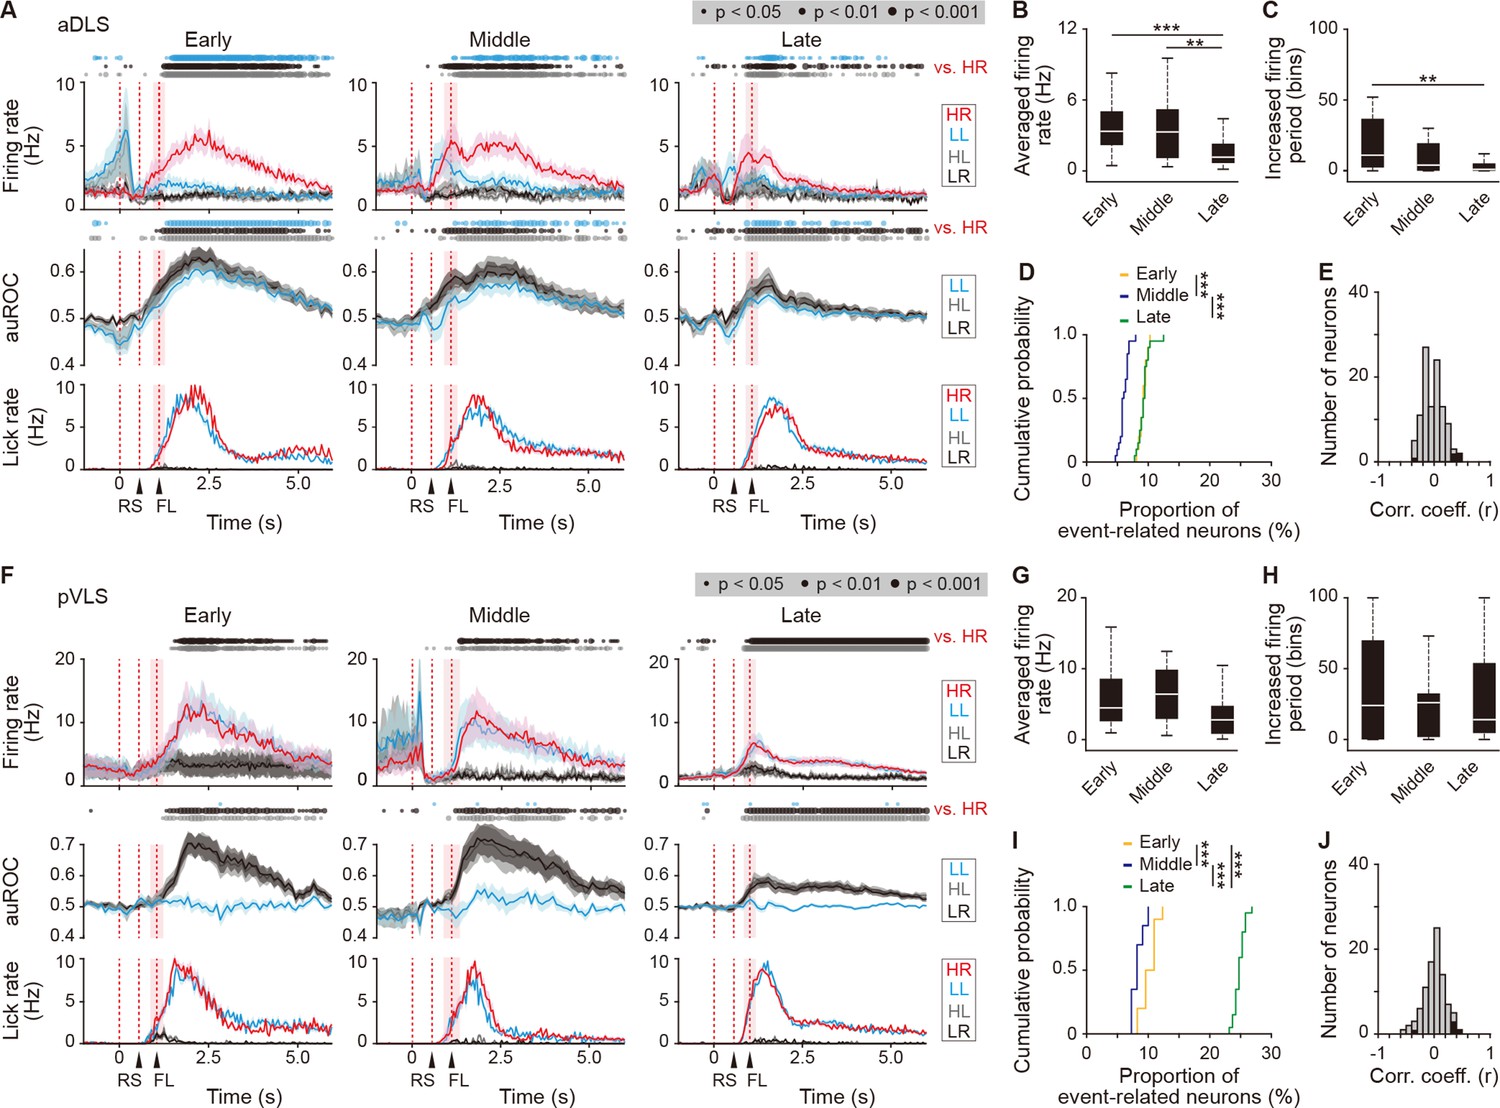
Sustained activity after the reward of first licking-related HR type neurons in the aDLS and pVLS.
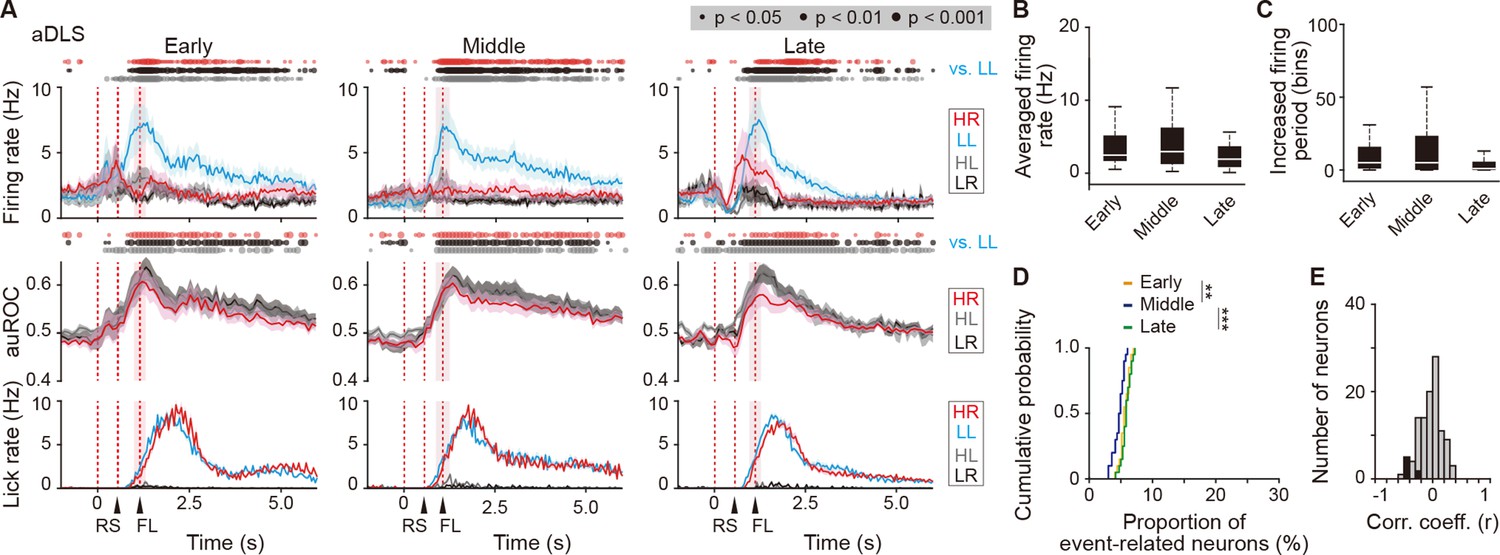
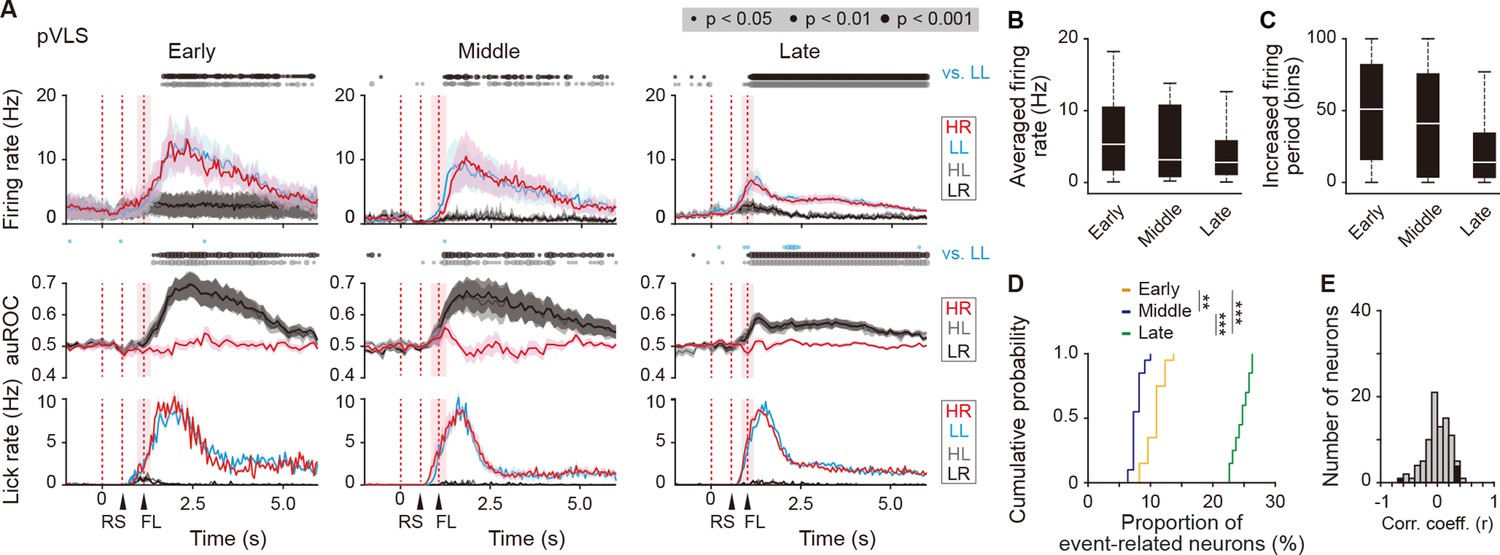
(A) Firing rate (top rows), auROC (middle rows), and licking rate (bottom rows) after the reward of first licking-related HR type neurons in the aDLS at the early (n = 27 neurons), middle (n = 31 neurons), and late (n = 49 neurons) stages. These data are aligned to the choice response. Timings of the reward sound and first licking are shown. Time bins with significant differences between the mean firing rate in the HR trial and any of the rates in the other three trials (Wilcoxon signed rank test) or the distribution of auROC values and 0.5 (Wilcoxon rank-sum test) are represented by the circles at the top. (B) Averaged firing rate for 5 s after the first licking in the HR trial (Kruskal-Wallis test, χ2 = 16.396, p = 2.8 × 10⁻⁴, post hoc Tukey-Kramer test, early vs. middle, p = 0.726, early vs. late, p = 7.2 × 10⁻⁴, middle vs. late, p = 0.009). (C) Averaged total number of time bins above 3 s.d. of the baseline firing for 5 s after the first licking in the HR trial (Kruskal-Wallis test, χ2 = 12.803, p = 0.002, post hoc Tukey-Kramer test, early vs. middle, p = 0.173, early vs. late, p = 0.001, middle vs. late, p = 0.219). (D) Cumulative probability of the proportion of first licking-related HR type neuron number (Kruskal-Wallis test, χ2 = 39.280, p = 3.0 × 10⁻⁹, post hoc Tukey-Kramer test, early vs. middle, p = 1.3 × 10⁻⁷, early vs. late, p = 0.995, middle vs. late, p = 2.3 × 10⁻⁷). (E) Distribution of the correlation coefficient between the numbers of spikes and licking. Closed column indicates the number of neurons showing significant correlations between the two parameters (5 out of 107 neurons). (F) Firing rate (top rows), auROC (middle rows), and licking rate (bottom rows) after the reward of first licking-related HR neurons in the pVLS at the early (n = 17 neurons), middle (n = 11 neurons), and late (n = 64 neurons) stages. The data are aligned to the choice response, and the timings of the reward sound and first licking are shown. Time bins with significant differences between the rate in the HR trial and any of the rates in other trials or the distribution of auROC values and 0.5 are represented as above. (G) Averaged firing rate of pVLS neurons after the first licking in the HR trial (Kruskal-Wallis test, χ2 = 7.652, p = 0.022; post hoc Tukey-Kramer test, early vs. middle, p = 0.975, early vs. late, p = 0.076, and middle vs. late, p = 0.096). (H) Averaged total number of time bins above 3 s.d. of the baseline firing of pVLS neurons after the first licking in the HR trial (Kruskal-Wallis test, χ2 = 0.023, p = 0.989). (I) Cumulative probability of the proportion of first licking-related HR type neuron number (Kruskal-Wallis test, χ2 = 47.922, p = 3.9 × 10⁻¹¹; post hoc Tukey-Kramer test, early vs. middle, p = 0.011, early vs. late, p = 1.7 × 10⁻⁴, and middle vs. late, p = 9.7 × 10⁻¹⁰). (J) Distribution of the correlation coefficient between the number of spikes and the licking. Closed column indicates the number of neurons showing significant correlations between the two parameters (5 out of 92 neurons). Data are indicated as the mean ± s.e.m. (A, F) or the median and quartiles with the maximal and minimal values (B, C, G, H). **p < 0.01 and ***p < 0.001. Abbreviations: RS, reward sound; and FL, first licking.
-
Figure 6—source data 1
Firing activity of first licking-related HR type neurons in the two striatal subregions.
- https://cdn.elifesciences.org/articles/97326/elife-97326-fig6-data1-v1.xlsx
Figure 6—figure supplement 1
Sustained activity after the reward of first licking-related LL type neurons in the aDLS.
(A) Firing rate (top rows), auROC (middle rows), and licking rate (bottom rows) after the reward of first licking-related LL type neurons in the aDLS at the early (n = 30 neurons), middle (n = 36 neurons), and late (n = 43 neurons) stages. These data are aligned to the choice response. Timings of the reward sound and first licking are shown. Time bins with significant differences between the mean firing rate in the LL trial and any of the rates in the other three trials (Wilcoxon signed rank test) or the distribution of auROC values and 0.5 (Wilcoxon rank-sum test) are represented by the circles at the top. (B) Averaged firing rate for 5 s after the first licking in the LL trial (Kruskal-Wallis test, χ2 = 4.474, p = 0.107). (C) Averaged total number of time bins above 3 s.d. of the baseline firing for 5 s after the first licking in the LL trial (Kruskal-Wallis test, χ2 = 6.306, p = 0.043, post hoc Tukey-Kramer test, early vs. middle, p = 0.989, early vs. late, p = 0.081, middle vs. late, p = 0.089). (D) Cumulative probability of the proportion of first licking-related LL type neuron number (Kruskal-Wallis test, χ2 = 18.952, p = 7.7 × 10⁻⁵, post hoc Tukey-Kramer test, early vs. middle, p = 0.003, early vs. late, p = 0.671, middle vs. late, p = 1.1 × 10⁻⁴). (E) Distribution of the correlation coefficient between the numbers of spikes and licking. Closed column indicates the number of neurons showing significant differences between the two parameters (7 out of 109 neurons). Data are indicated as the mean ± s.e.m. (A) or the median and quartiles with the maximal and minimal values (B, C). **p < 0.01 and ***p < 0.001. Abbreviations: RS, reward sound; and FL, first licking.
-
Figure 6—figure supplement 1—source data 1
Firing activity of first licking-related LL type neurons in the aDLS.
- https://cdn.elifesciences.org/articles/97326/elife-97326-fig6-figsupp1-data1-v1.xlsx
Figure 6—figure supplement 2
Sustained activity after the reward of first licking-related LL type neurons in the pVLS.
(A) Firing rate (top rows), auROC (middle rows), and licking rate (bottom rows) after the reward outcome of first licking-related LL neurons in the pVLS at the early (n = 16 neurons), middle (n = 11 neurons), and late (n = 63 neurons) stages. These data are aligned to the choice response. Time bins with significant correlations between the rate in the LL trial and either the rate in other trials (Wilcoxon signed rank test) or the distribution of auROC values and 0.5 (Wilcoxon rank-sum test) are represented by the circles at the top. The timings of the reward sound and first licking are shown. (B) Averaged firing rate of pVLS neurons after the first licking in the LL trial (Kruskal-Wallis test, χ2 = 2.327, p = 0.312). (C) Averaged total number of time bins above 3 S.D. of the baseline firing of pVLS neurons after the first licking in the LL trial (Kruskal-Wallis test, χ2 = 4.736, p = 0.094). (D) Cumulative probability of the proportion of first licking-related LL type neuron number (Kruskal-Wallis test, χ2 = 51.215, p = 7.6 × 10⁻¹², post hoc Tukey-Kramer test, early vs. middle, p = 0.002, early vs. late, p = 5.1 × 10⁻⁴, middle vs. late, p = 9.6 × 10⁻¹⁰). (E) Distribution of the correlation coefficient between the number of spikes and the licking. Closed column indicates the number of neurons showing significant correlations between the two parameters (5 out of 90 neurons). Data are indicated as the mean ± s.e.m. (A) or the median and quartiles with the maximal and minimal values (B, C). **p < 0.01 and ***p < 0.001. Abbreviations; RS, reward sound; and FL, first licking.
-
Figure 6—figure supplement 2—source data 1
Firing activity of first licking-related LL type neurons in the pVLS.
- https://cdn.elifesciences.org/articles/97326/elife-97326-fig6-figsupp2-data1-v1.xlsx
Figure 7 with 3 supplements
Transient activity related to the beginning and ending of a behavior of cue onset- and choice response-related HR type neurons in the pVLS.
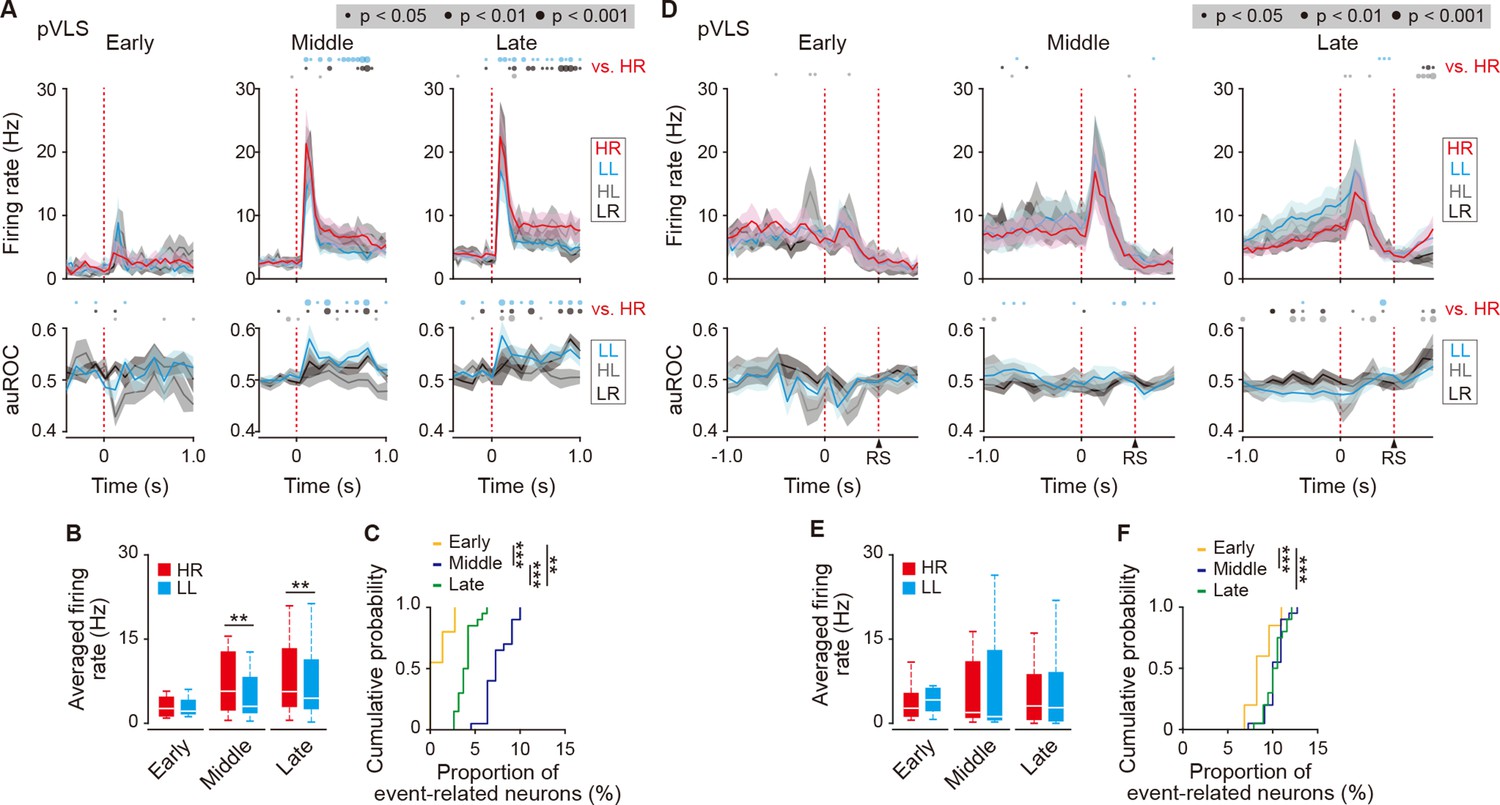
(A) Firing rate (top rows) and auROC values (bottom rows) of cue onset-related HR type neurons in the pVLS at the early (n = 4 neurons), middle (n = 21 neurons), and late (n = 24 neurons) stages. These data are aligned to the cue onset. Time bins with significant differences between the mean firing rate in the HR trial and either of the rate in the other three trials (Wilcoxon signed rank test) or the distribution of auROC values and 0.5 (Wilcoxon rank-sum test) are represented by the circles at the top. (B) Averaged firing rate of the cue onset-related HR type neurons in HR and LL trials (0–600ms after the cue onset; Wilcoxon signed rank test; early, p = 0.875, middle, p = 0.006, and late, p = 0.004). (C) Cumulative probability of the proportion of the cue onset-related HR type neuron number (Kruskal-Wallis test, χ2 = 51.114, p = 8.0 × 10⁻¹²; post hoc Tukey-Kramer test, early vs. middle, p = 9.6 × 10⁻¹⁰, early vs. late, p = 0.002, and middle vs. late, p = 6.4 × 10⁻⁴). (D) Firing rate (top rows) and auROC values (bottom rows) of the choice response-related HR type neurons in the pVLS at the early (n = 11 neurons), middle (n = 22 neurons), and late (n = 41 neurons) stages. These data are aligned to the choice response. The timing of the reward sound is presented. Time bins with significant differences between the mean rate in the HR trial and any of the rates in other trials or the distribution of auROC values and 0.5 are represented as above. (E) Averaged firing rate of the choice response-related HR type neurons in HR and LL trials (0–600 ms after the choice response) (Wilcoxon signed rank test; early, p = 0.278, middle, p = 0.758, and late, p = 0.279). (F) Cumulative probability of the proportion of the choice response-related HR type neuron number (Kruskal-Wallis test, χ2 = 13.786, p = 0.001; post hoc Tukey-Kramer test, early vs. middle, p = 0.003, early vs. late, p = 0.005, and middle vs. late, p = 0.976). Data are indicated as the mean ± s.e.m. (A, D) or the median and quartiles with the maximal and minimal values (B, E). **p < 0.01 and ***p < 0.001. Abbreviation: RS, reward sound.
-
Figure 7—source data 1
Firing activity of cue onset- and choice response-related HR type neurons in the pVLS.
- https://cdn.elifesciences.org/articles/97326/elife-97326-fig7-data1-v1.xlsx
Figure 7—figure supplement 1
Firing activity of cue onset-related HR and LL type neurons in the aDLS.
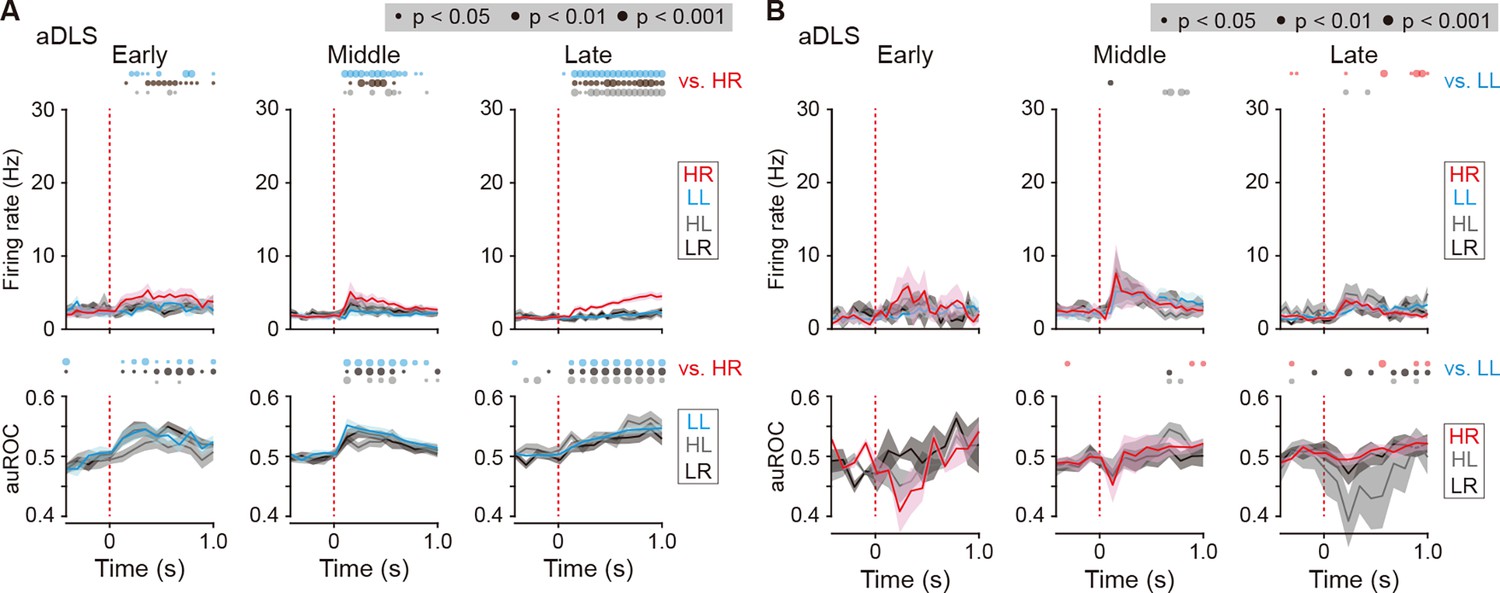
(A) Mean firing rate (top rows) and auROC values (bottom rows) of cue onset-related HR type neurons in the aDLS at the early (n = 14 neurons), middle (n = 29 neurons), and late (n = 43 neurons) stages. (B) Mean firing rate (top rows) and auROC values (bottom rows) of aDLS cue onset-related LL type neurons at the early (n = 3 neurons), middle (n = 9 neurons), and late (n = 12 neurons) stages. These data are aligned to the cue onset. Time bins with significant differences between the mean firing rate in the HR (A) or LL (B) trial and any of the rates in the other three trials (Wilcoxon signed rank test) or the distribution of auROC values and 0.5 (Wilcoxon rank-sum test) are represented by the circles at the top. Data are indicated as the mean ± s.e.m. Abbreviation: RS, reward sound.
-
Figure 7—figure supplement 1—source data 1
Firing activity of cue onset-related neurons in the aDLS.
- https://cdn.elifesciences.org/articles/97326/elife-97326-fig7-figsupp1-data1-v1.xlsx
Figure 7—figure supplement 2
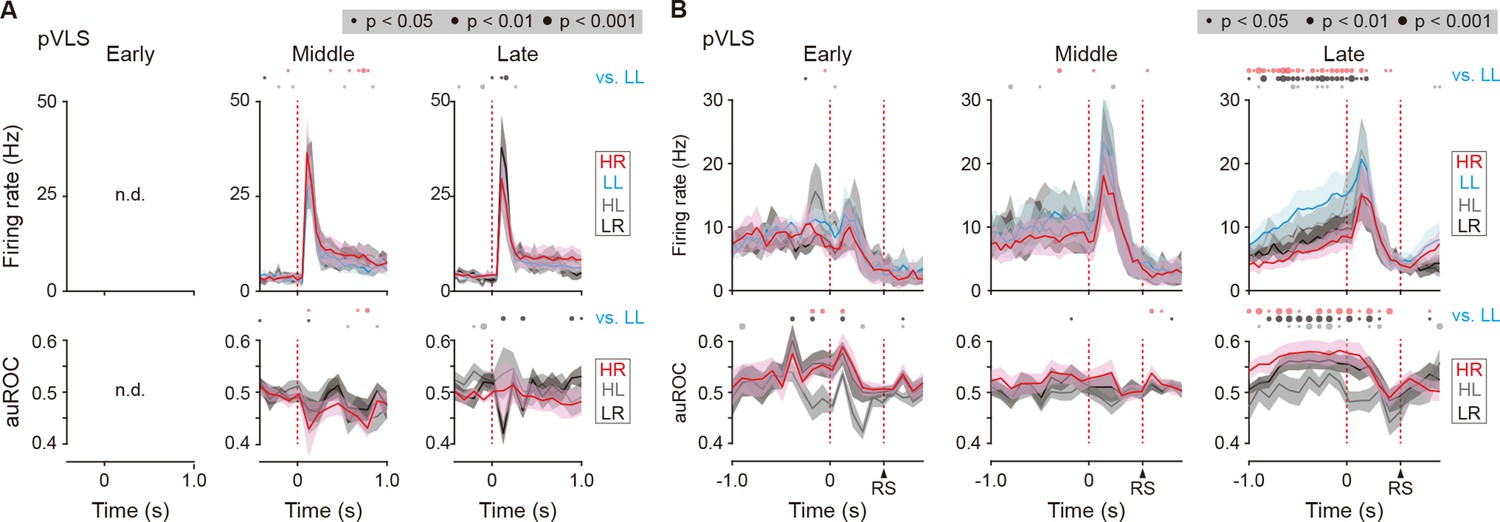
Firing activity of cue onset- and choice response-related LL type neurons in the pVLS.
(A) Mean firing rate (top rows) and auROC values (bottom rows) of pVLS cue onset-related LL type neurons at the middle (n = 10 neurons) and late (n = 16 neurons) stages. (B) Mean firing rate (top rows) and auROC values (bottom rows) of pVLS choice response-related LL type neurons at the early (n = 8 neurons), middle (n = 17 neurons), and late (n = 36 neurons) stages. The data are aligned to the cue onset (A) or choice response (B). The timing of the reward sound is indicated (B). Time bins with significant differences between the mean firing rate in the LL trial and any of the rates at the other three trials (Wilcoxon signed rank test) or the distribution of auROC values and 0.5 (Wilcoxon rank-sum test) are represented by the circles at the top. n.d., not detected. Data are indicated as the mean ± s.e.m. Abbreviation: RS, reward sound.
-
Figure 7—figure supplement 2—source data 1
Firing activity of cue onset- and choice response-related LL type neurons in the pVLS.
- https://cdn.elifesciences.org/articles/97326/elife-97326-fig7-figsupp2-data1-v1.xlsx
Figure 7—figure supplement 3
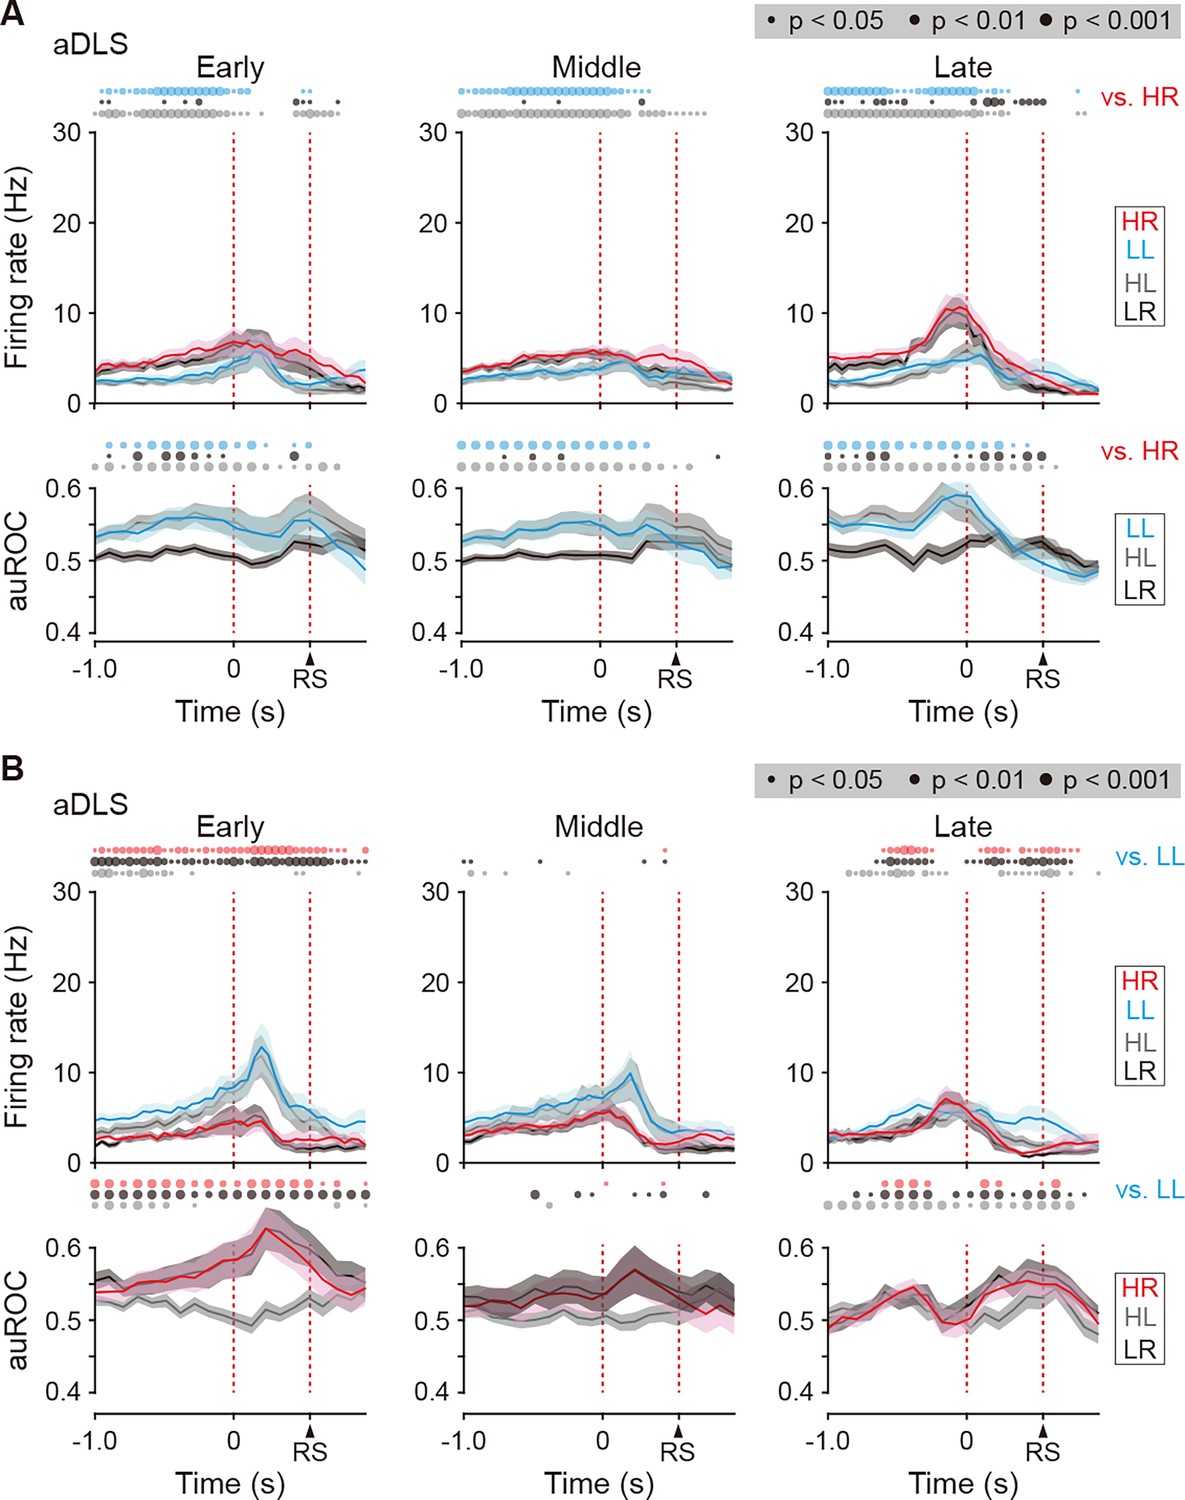
Firing activity of choice response-related HR and LL type neurons in the aDLS.
(A) Firing rate (top rows) and auROC values (bottom rows) in aDLS choice response-related HR type neurons at the early (n = 52 neurons), middle (n = 73 neurons), and late (n = 75 neurons) stages. (B) Firing rate (top rows) and auROC values (bottom rows) in the aDLS choice response-related LL type neurons at the early (n = 40 neurons), middle (n = 36 neurons), and late (n = 77 neurons) stages. These data are aligned to the choice response. Time bins with significant differences between the mean firing rate in the HR or LL trial and any of the rates in the other three trials (Wilcoxon signed rank test) or the distribution of auROC values and 0.5 (Wilcoxon rank-sum test) are represented by the circles at the top. Data are indicated as the mean ± s.e.m. Abbreviation: RS, reward sound.
-
Figure 7—figure supplement 3—source data 1
Firing activity of choice response-related neurons in the aDLS.
- https://cdn.elifesciences.org/articles/97326/elife-97326-fig7-figsupp3-data1-v1.xlsx
Figure 8
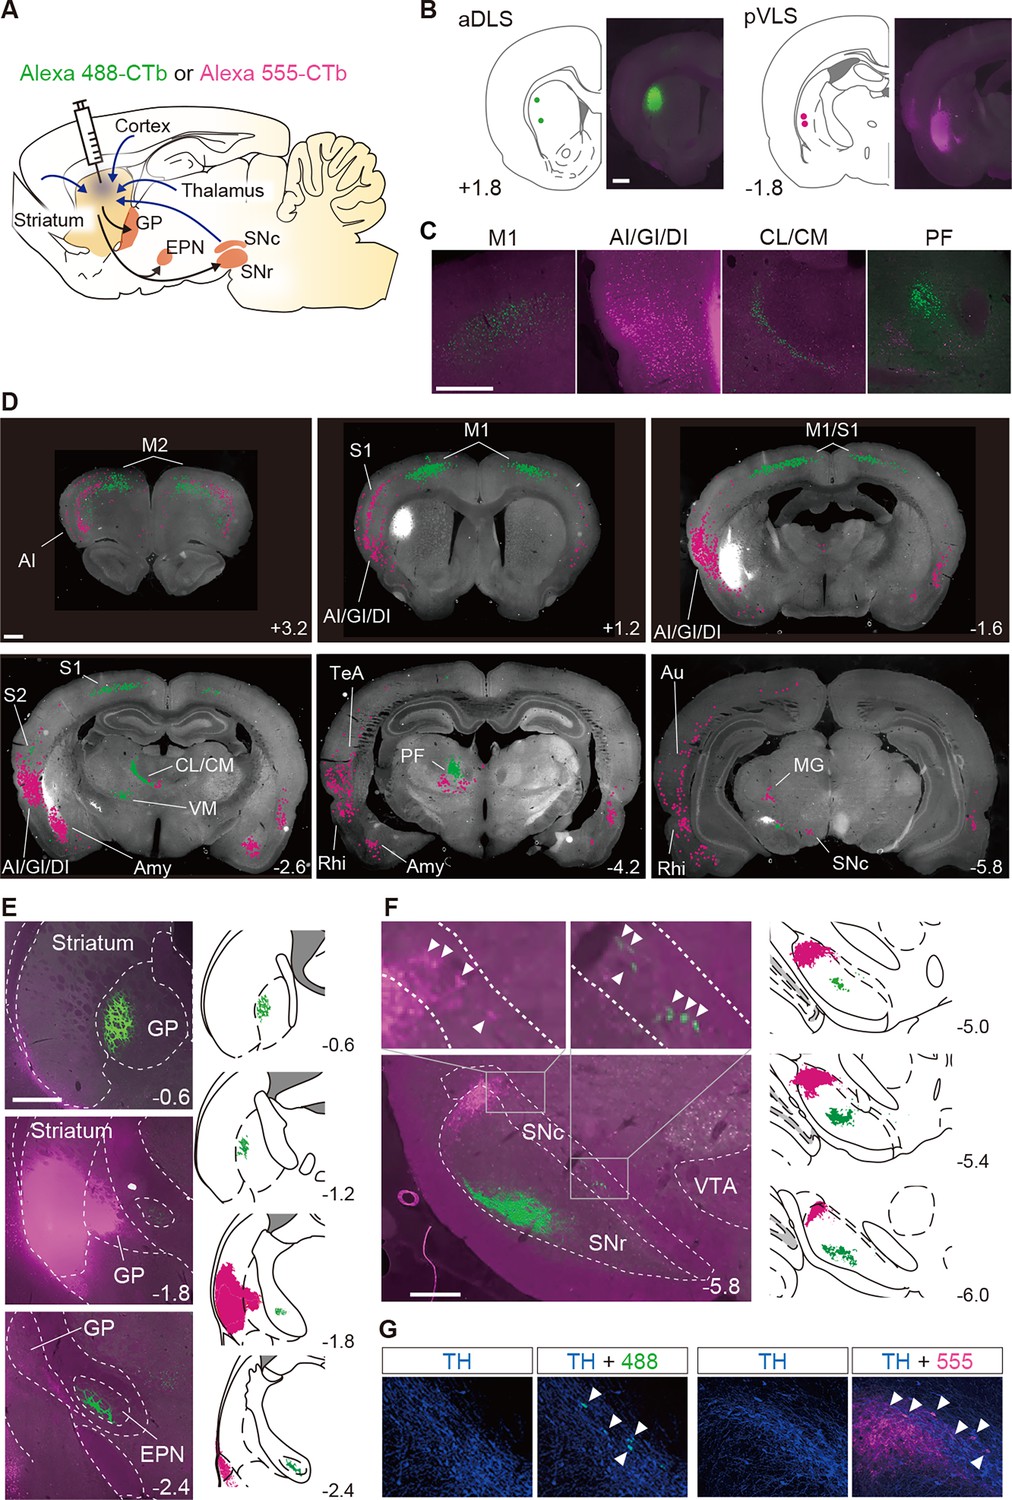
Segregation of neural circuits linked to the aDLS and pVLS.
(A) Schematic illustration of the major inputs to and outputs from the striatum. A solution containing CTb labeled with Alexa 488 (green) or Alexa 555 (magenta) was injected into the aDLS and pVLS of the same animals (n = 2). (B) Coordinates for tracer injection into the aDLS and pVLS. Right, representative fluorescence images of sections through the injection sites. (C) Typical images of sections through the cerebral cortex and intralaminar thalamus. (D) Distribution of cell bodies innervating the aDLS and pVLS. Fluorescence signals in the cell bodies were marked by green or magenta dots using ImageJ (version 1.53) and overlaid on gray-scaled images of a brain section. (E) Axonal terminals arising from the aDLS and pVLS to the GP or EPN. Representative images of tracing are shown in the left panels. Camera lucida drawings of labeled signals are shown in the right panels. (F) Labeling of axonal terminals and cell bodies in the ventral midbrain. Representative images are shown in the left panels. Upper images are magnified views of the rectangles in the lower image. Camera lucida drawings are shown in the right panels. Arrowheads in the magnified images indicate labeled cell bodies. (G) Triple-fluorescence histochemistry with sections through the ventral midbrain. The sections were stained with an anti-TH antibody and then with a secondary IgG conjugated with Alexa 647. Representative images of the centromedial (left) and lateral (right) parts of the SNc are shown. Arrowheads indicate TH-positive cells with CTb-labeled signals in each image. The anteroposterior coordinates from bregma (mm) are shown. Scale bars; 1 mm (B–D), 500 μm (E), 100 μm (F, G). Abbreviations: AI, agranular insular cortex; Amy, amygdala nucleus; Au, auditory cortex; CL, centrolateral nucleus; CM, centromedian nucleus; DI, dysgranular insular cortex; GI, granular insular cortex; M1, primary motor cortex; M2, secondary motor cortex; MG, medial geniculate nucleus; PF, parafascicular nucleus; Rhi, rhinal cortex; S1, primary somatosensory cortex; S2, secondary somatosensory cortex; TeA, temporal association cortex; VM, ventromedial nucleus; and VTA, ventral tegmental area.
Tables
Key resources table
| Reagent type (species) or resource | Designation | Source or reference | Identifiers | Additional information |
|---|---|---|---|---|
| Strain, strain background (Rattus norvegicus, Long-Evans) | Long-Evans Rats | Institute for Animal Reproduction | Wild-type rats | |
| Antibody | Donkey anti-mouse IgG antibody conjugated with Alexa Fluor 647 (polyclonal) | Thermo Fisher Scientific | Cat# A-31571; RRID:AB_162542 | 1:1,000 |
| Antibody | Goat anti-mouse IgG antibody conjugated with Alexa Fluor 488 (polyclonal) | JacksonImmunoresearch Laboratories | Cat# 715-545-151; RRID:AB_2341099 | 1:1,000 |
| Antibody | Mouse anti-NeuN antibody (monoclonal) | Millipore | Cat# MAB377; RRID:AB_2298772 | 1:1,000 |
| Antibody | Mouse anti-TH antibody (monoclonal) | Millipore | Cat# MAB318-AF488; RRID:AB_2201528 | 1:1,000 |
| Chemical compound, drug | (±)-Ibotenic acid | FUJIFILM Wako Pure Chemical | Cat# 533–54971 | 0.8 mg/mL |
| Chemical compound, drug | Muscimol | Sigma-Aldrich | Cat# M1523 | 0.1 μg/μL |
| Chemical compound, drug | Saccharin sodium salt dihydrate | Tokyo Chemical Industry | Cat# B0131 | 0.02% |
| Software, algorithm | Kilosort2 | Marius Pachitariu; Stringer et al., 2019 | RRID:SCR_016422 | https://www.github.com/MouseLand/Kilosort2 |
| Software, algorithm | KlustaKwik2 | Kadir et al., 2014; Goodman et al., 2015 | RRID:SCR_014480 | https://github.com/kwikteam/klustakwik2 |
| Software, algorithm | MATLAB | MathWorks | RRID:SCR_001622 | |
| Software, algorithm | phy | cortex-lab; Rossant et al., 2024 | RRID:SCR_016249 | https://github.com/cortex-lab/phy |
| Software, algorithm | PMOD version 3.2 | PMOD Technologies | RRID:SCR_016547 | https://www.pmod.com/web/ |
| Software, algorithm | SPM version 8 | Wellcome Department of Imaging Neuroscience | RRID:SCR_007037 | https://www.fil.ion.ucl.ac.uk/spm/ |
| Software, algorithm | SPSS version 27 | IBM | RRID:SCR_002865 | |
| Other | Cholera toxin subunit B conjugated to Alexa 488 | Invitrogen | Cat# C34775; RRID:AB_2536189 | 1.0 mg/mL |
| Other | Cholera toxin subunit B conjugated to Alexa 555 | Invitrogen | Cat# C34776; RRID:AB_968419 | 1.0 mg/mL |
| Other | Cresyl violet | Muto Pure Chemicals | Cat# 41021 | 0.1% |
| Other | DAPI | Thermo Fisher Scientific | Cat# D1306; RRID:AB_2629482 | 0.1 μg/mL |
| Other | DAPI and red fluorescent Nissl stain solution | Thermo Fisher Scientific | Cat# N21482; RRID:AB_2620170 | 1:10,000/ 1:200 |
| Other | Grain-based precision pellets | Bio-serv | Cat# F0021 | 45 mg |
| Other | Guide cannula | P1 Technologies | Cat# C315I | 26 gauge |
| Other | Internal cannula | P1 Technologies | Cat# C315G | 30 gauge |
| Other | Laboratory chow | CLEA Japan | Cat# CE-2 | |
| Other | Silicon probe | NeuroNexus | Buzsaki64spL | 64-channel (6-shank) |
| Other | Templates for the Long-Evans rat brain | Neuroimaging Tools and Resources Collaboratory | RRID:SCR_003430 | https://www.nitrc.org/projects/tpm_rat/ |
| Other | Thin wall borosilicate glass | Sutter Instrument | Cat# B100-75-10 | 60 μm diameter |
Additional files
-
MDAR checklist
- https://cdn.elifesciences.org/articles/97326/elife-97326-mdarchecklist1-v1.docx
-
Source data 1
Behavioral strategies on Day N-1 of rats used for the injection into striatal subregions.xlsx.
- https://cdn.elifesciences.org/articles/97326/elife-97326-data1-v1.xlsx
Download links
A two-part list of links to download the article, or parts of the article, in various formats.
Downloads (link to download the article as PDF)
Open citations (links to open the citations from this article in various online reference manager services)
Cite this article (links to download the citations from this article in formats compatible with various reference manager tools)
Acquisition of auditory discrimination mediated by different processes through two distinct circuits linked to the lateral striatum
eLife 13:RP97326.
https://doi.org/10.7554/eLife.97326.4


