MftG is crucial for ethanol metabolism of mycobacteria by linking mycofactocin oxidation to respiration
- Leibniz Institute for Natural Product Research and Infection Biology – Hans Knöll Institute, Junior Research Group Synthetic Microbiology, Germany
- University of Bayreuth, Chair of Biochemistry of Microorganisms, Germany
- Leibniz Institute for Natural Product Research and Infection Biology– Hans Knöll Institute, Department of Infection Biology, Germany
- Respiratory Infection Dynamics, Helmholtz Centre for Infection Research - HZI Braunschweig, Germany
- Department of Respiratory Medicine and Infectious Diseases, Hannover Medical School, German Center for Lung Research (DZL), BREATH, Germany
- Friedrich Schiller University Jena, Institute of Microbiology, Germany
- Microverse Cluster, Friedrich Schiller University Jena, Germany
- Friedrich Schiller University Jena, Institute of Organic Chemistry and Macromolecular Chemistry, Germany
Figures
Figure 1
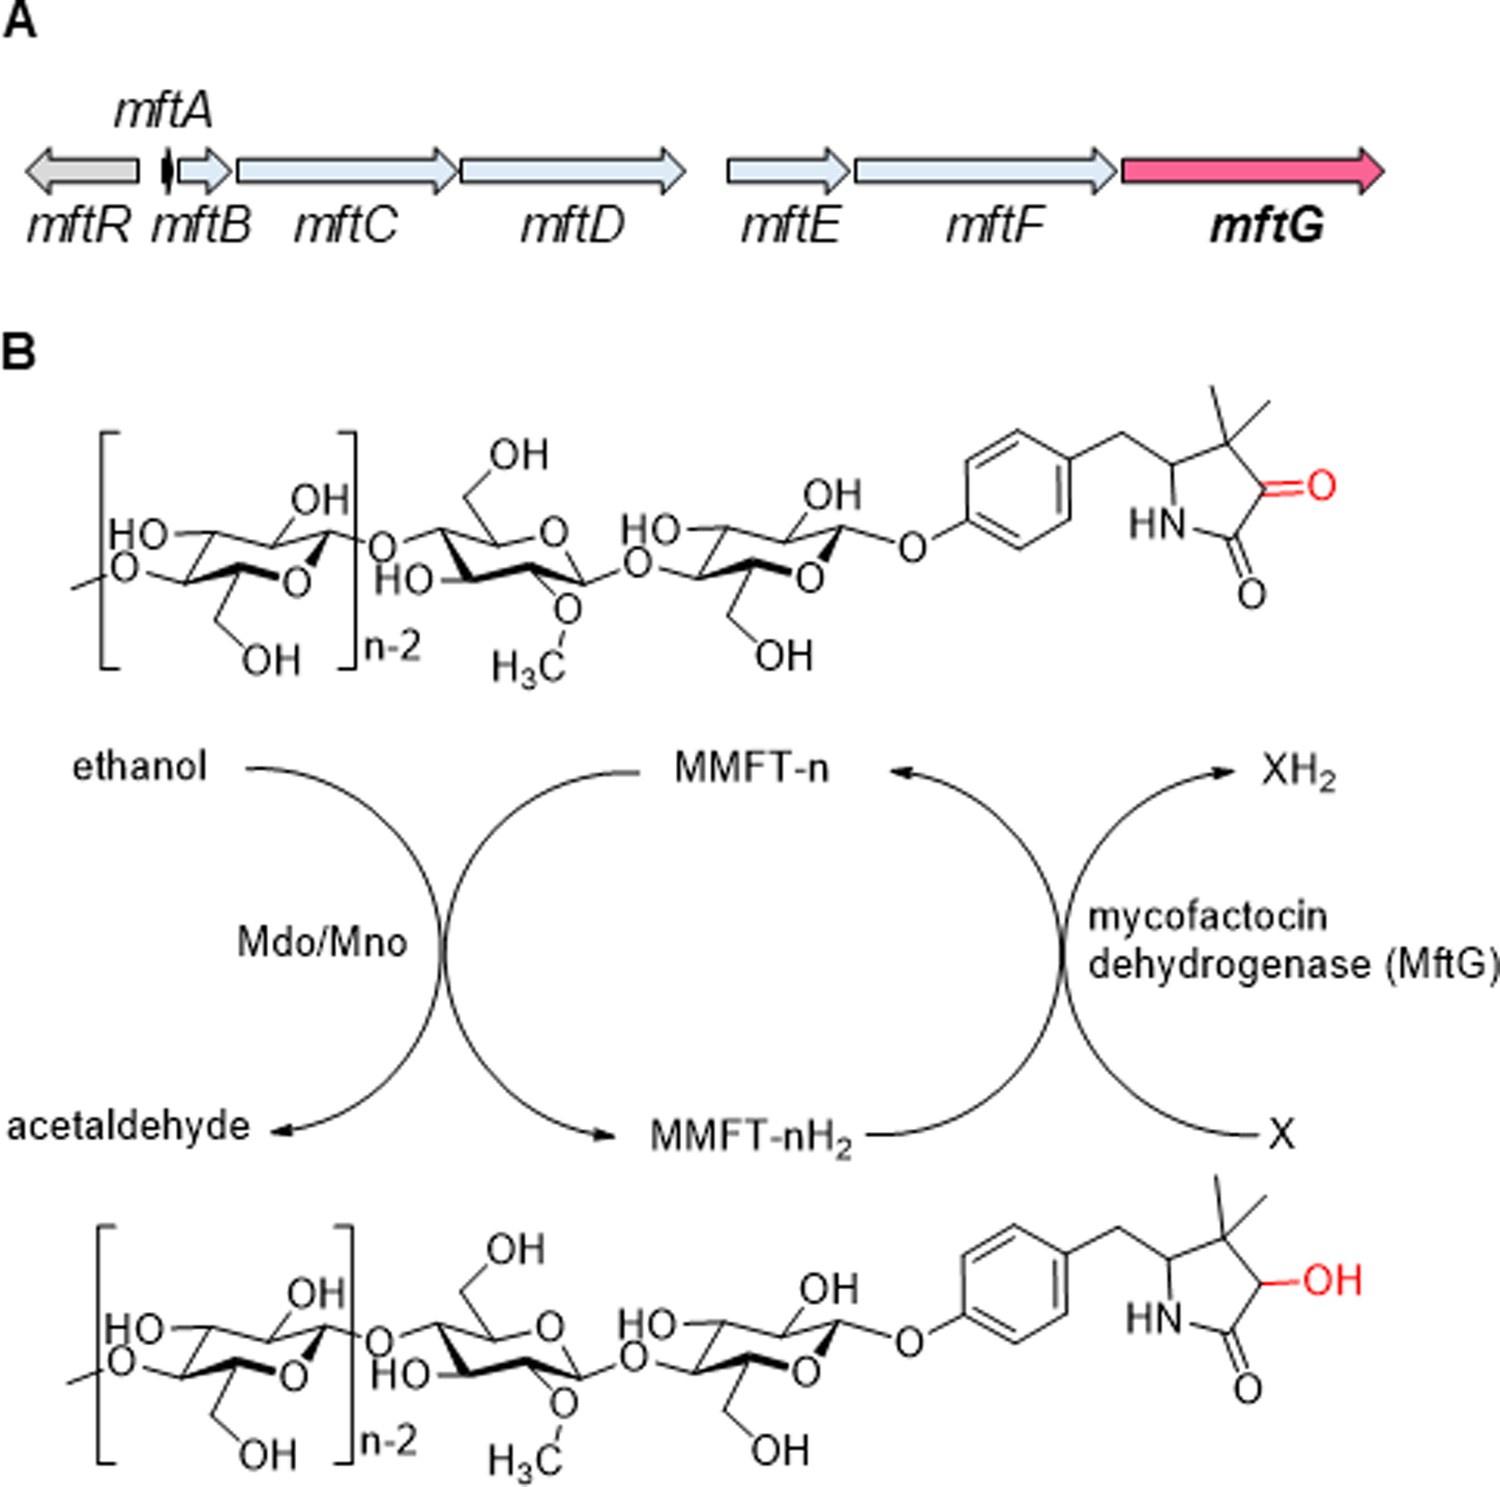
The mycofactocin redox system.
(A) Schematic representation of the mft gene cluster of M. smegmatis. mftA-F: MFT biosynthetic genes. mftR: TetR-like regulator. mftG: GMC oxidoreductase (subject of this study). (B) Chemical structures of MMFT-n (oxidized methylmycofactocin) and MMFT-nH2 (reduced form) and hypothetical scheme of MFT reduction by the ethanol dehydrogenase Mdo/Mno. The proposed mycofactocin dehydrogenase MftG is the subject of this study. X: Unknown electron acceptor.
Figure 2 with 1 supplement
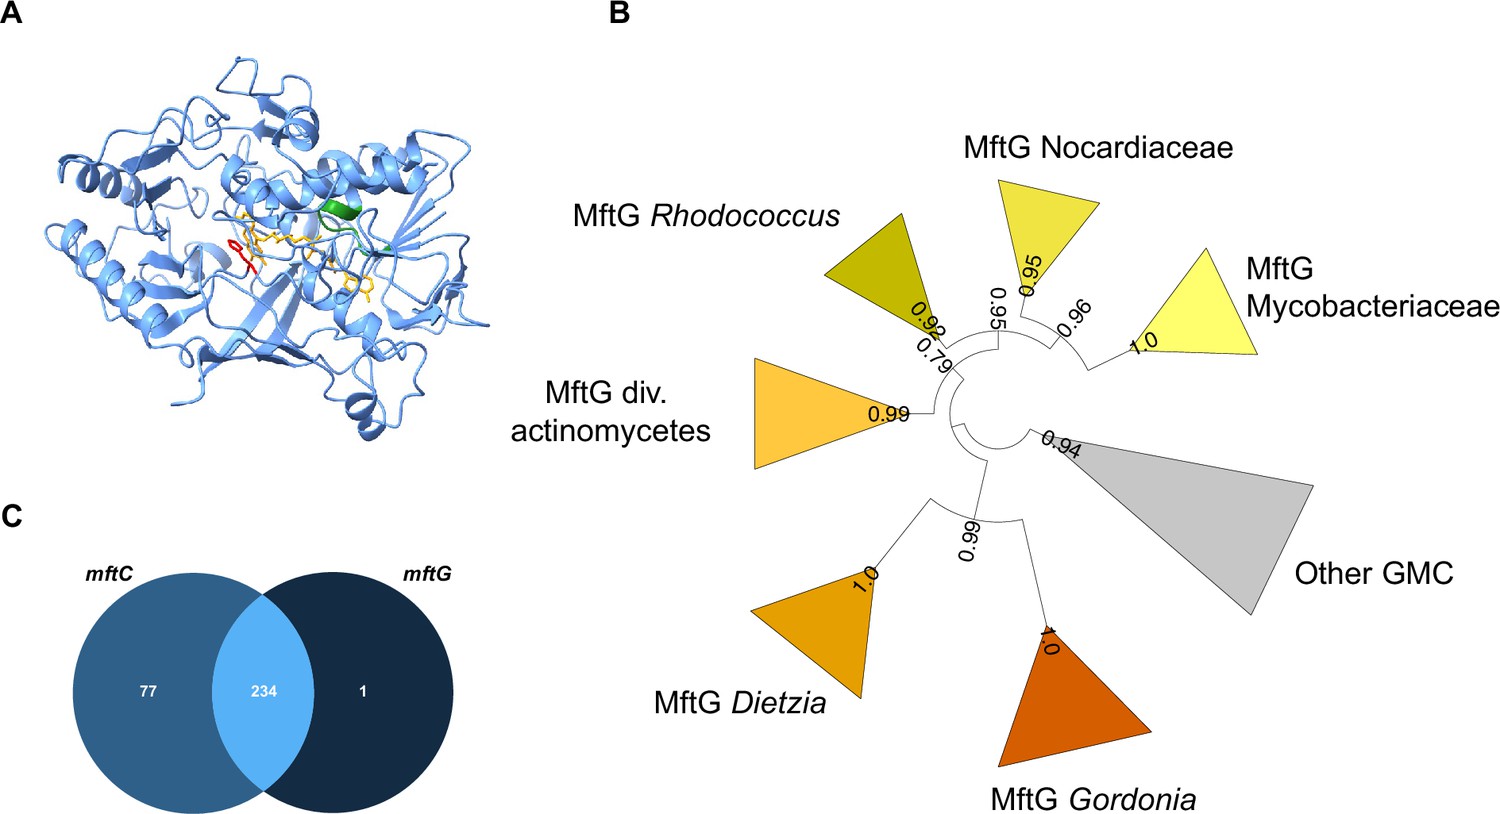
Bioinformatics analysis of MftG.
(A) Structural model of MftG from M. smegmatis retrieved from the Alphafold database (Gao et al., 2021) with the FAD prosthetic group (yellow) modeled into the structure. Green: Rossman fold motif (GxGxxG), red: active site histidine (His411). (B) Collapsed phylogenetic tree (maximum likelihood) of GMC enzymes showing major MftG subfamilies. FastTree support values are shown on branches. The full tree is provided as Figure 2—figure supplement 1 (C) Venn diagram representing the frequency of co-occurrence of mftC (left-medium blue) and mftG (right-dark blue) genes in 312 organisms that encode the MFT gene locus or MftG-like proteins.
Figure 2—figure supplement 1
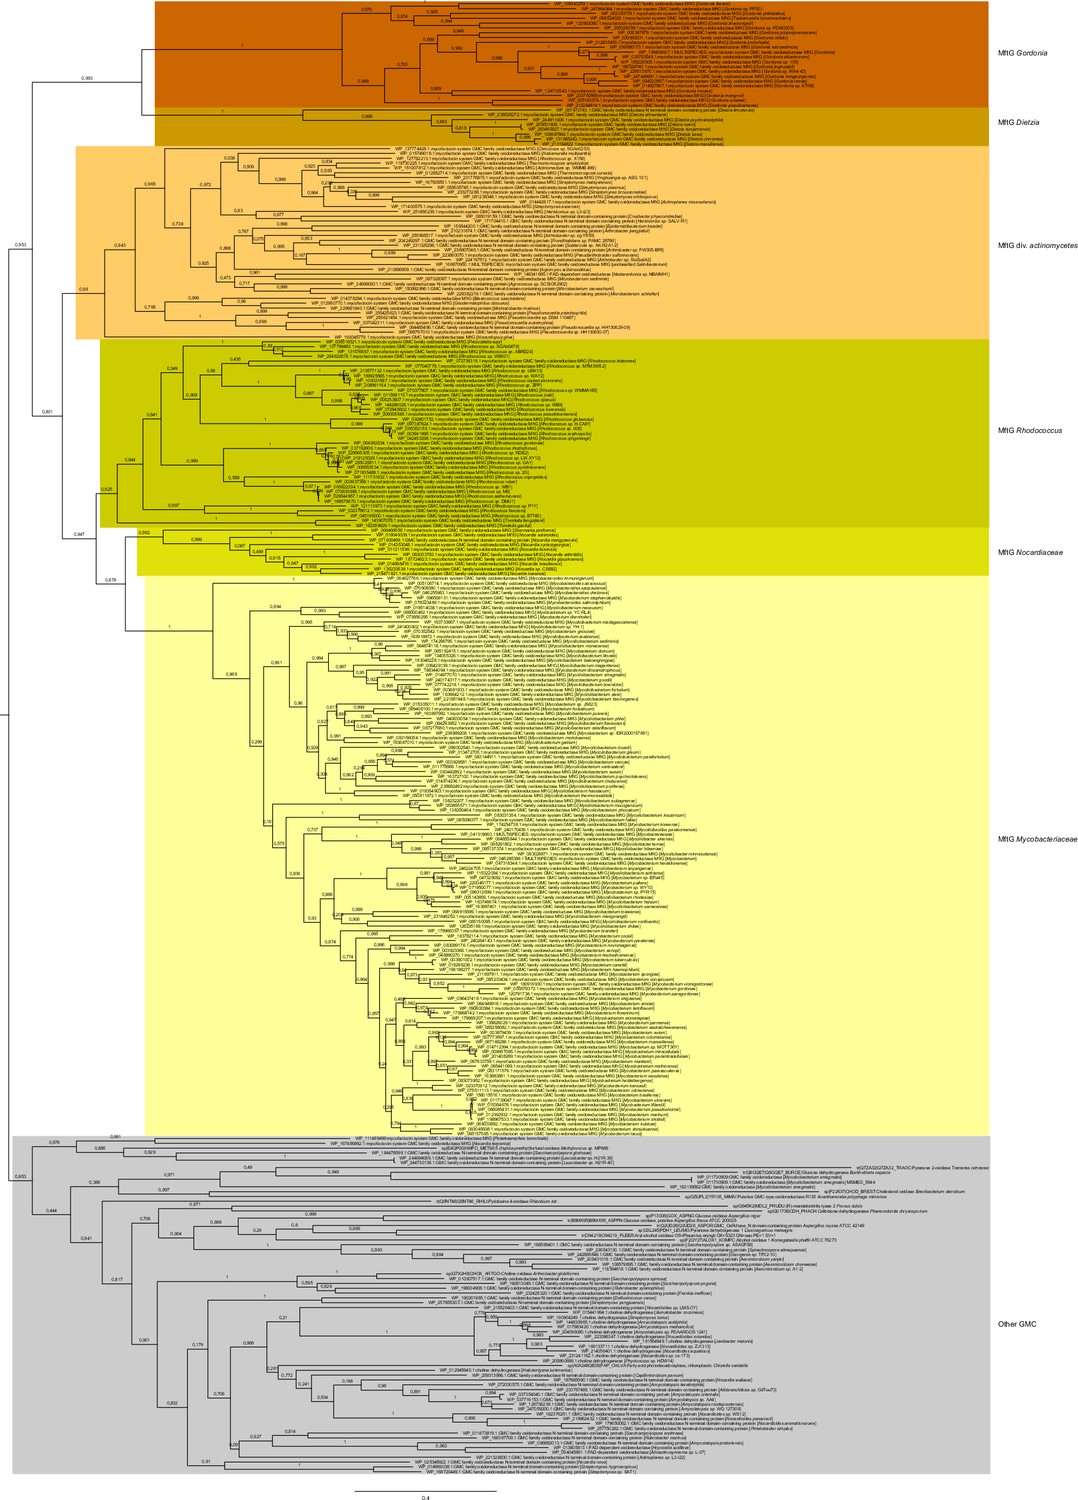
Phylogenetic tree (maximum likelihood) of the MftG and GMC sequences described in Supplementary file 2, table S1.
Figure 3 with 2 supplements
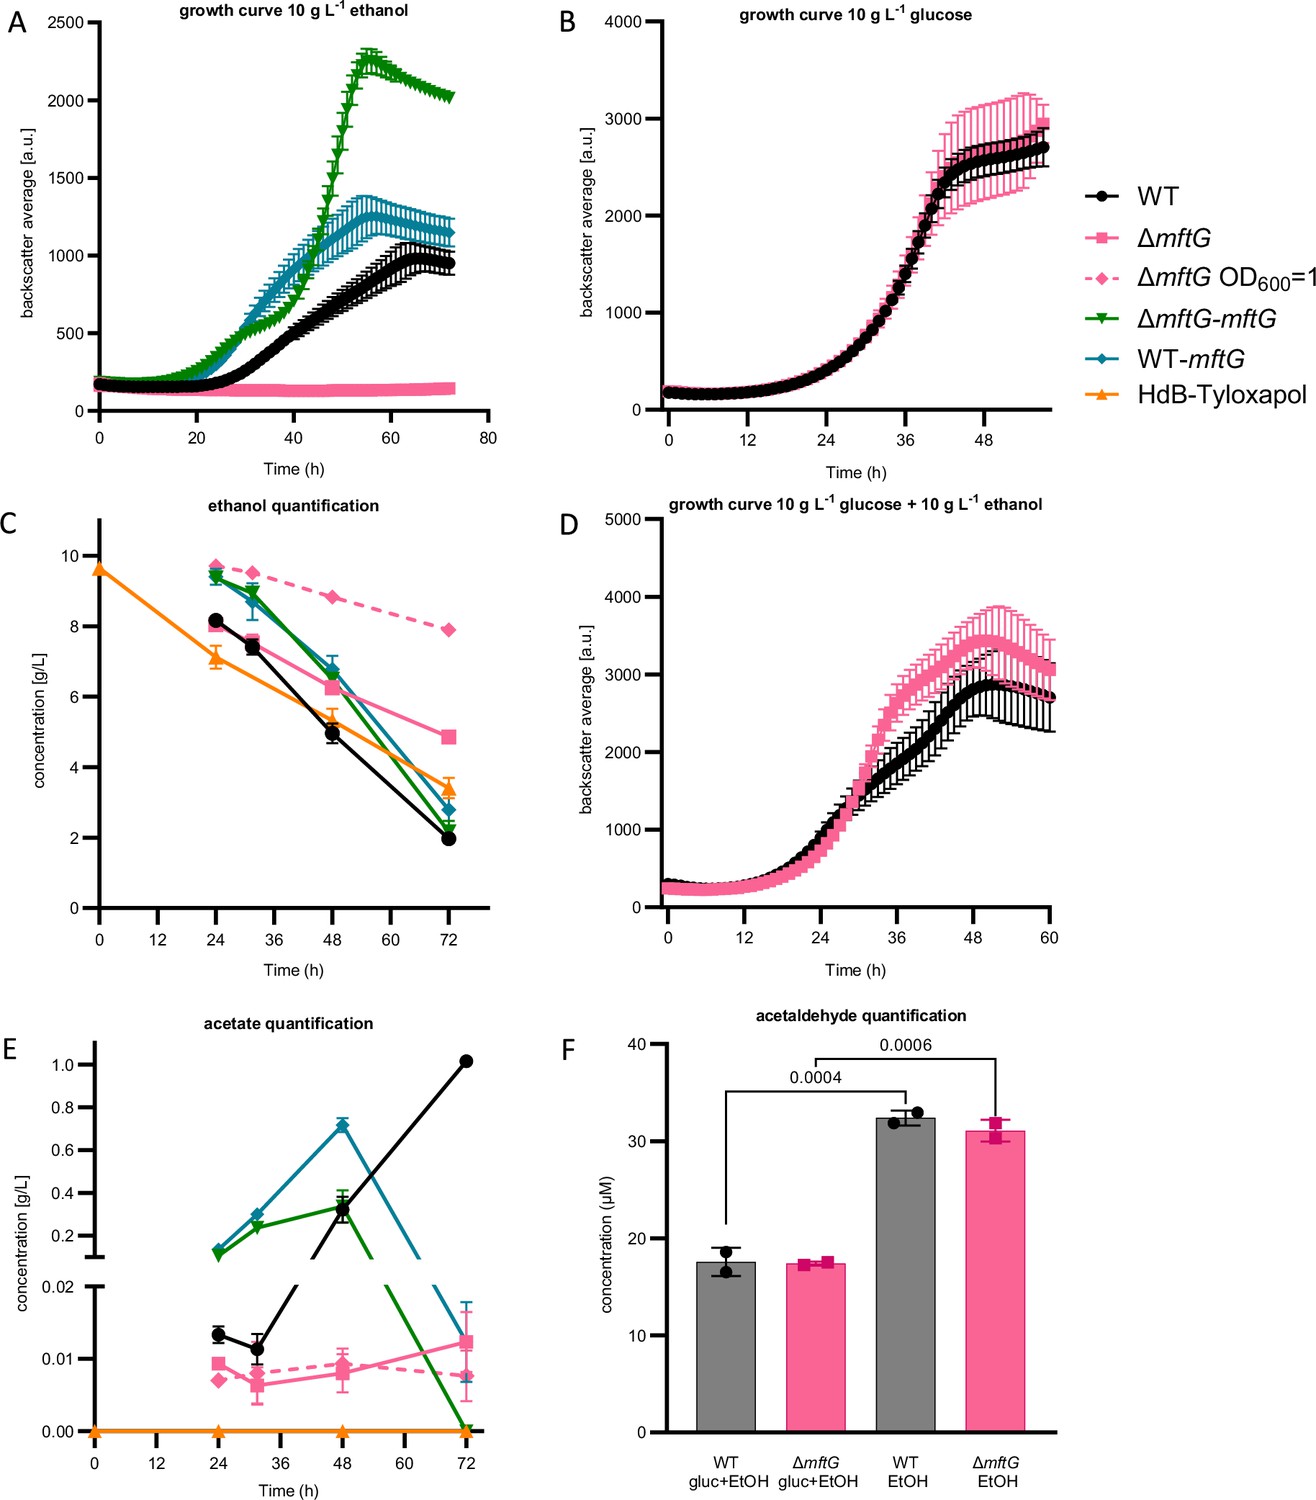
Effect of mftG gene deletion on mycobacterial ethanol metabolism.
(A) Growth curve of M. smegmatis WT, ∆mftG, ∆mftG-mftG, and WT-mftG growing in HdB-Tyl with 10 g L–1 ethanol as the sole carbon source. (B) Growth curve of WT and ∆mftG growing on 10 g L–1 glucose (C, E). Ethanol and acetic acid quantification over time in M. smegmatis WT, ∆mftG, ∆mftG-mftG, and WT-mftG cultures in HdB-Tyl with 10 g L–1 of ethanol and in uninoculated media as control. (D) Growth curve of WT and ∆mftG on 10 g L–1 glucose and 10 g L–1 ethanol combined. (F) Acetaldehyde quantification in culture supernatants of the WT and ∆mftG strains grown with 10 g L–1 glucose and/or 10 g L–1 ethanol. (●) M. smegmatis WT; (■) M. smegmatis ∆mftG mutant; (♦-dashed) M. smegmatis ∆mftG mutant grown with starting OD600 1; (▼) M. smegmatis ∆mftG-mftG complementation mutant; (♦) M. smegmatis double presence of the mftG gene; (▲) Medium with 10 g L–1 of ethanol without bacterial inoculation. Measurements were performed in biological replicates, (growth curves: n≥3, ethanol and acetate quantification: n=3). Error bars represent standard deviations. Statistical analysis was performed with ordinary one-way ANOVA with Tukey’s multiple comparison test, p-values depicted in the figure.
Figure 3—figure supplement 1
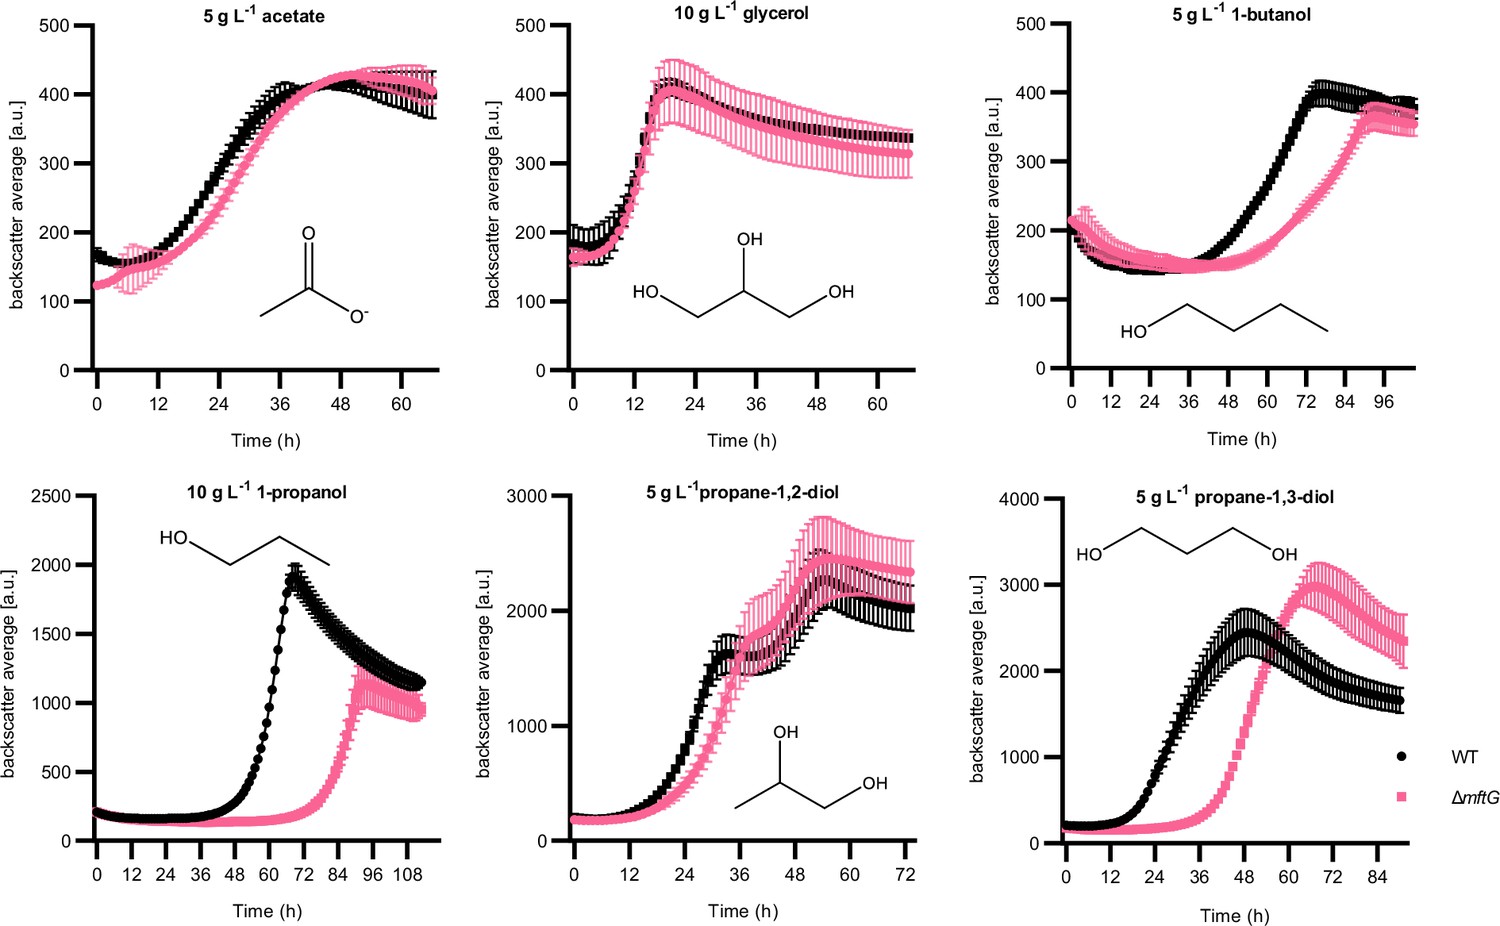
Effect of mftG gene deletion on mycobacterial growth using different carbon sources.
Growth curve of M. smegmatis WT and ∆mftG growing on HdB-Tyl supplemented with 5 g L–1 acetate, 10 g L–1 glycerol, 10 g L–1 1-propanol, 5 g L–1 1-butanol, 5 g L–1 propane-1,2-diol and 5 g L–1 propane-1,3-diol. Measurements were performed in at least biological duplicates (n≥2). Error bars represent standard deviations.
Figure 3—figure supplement 2
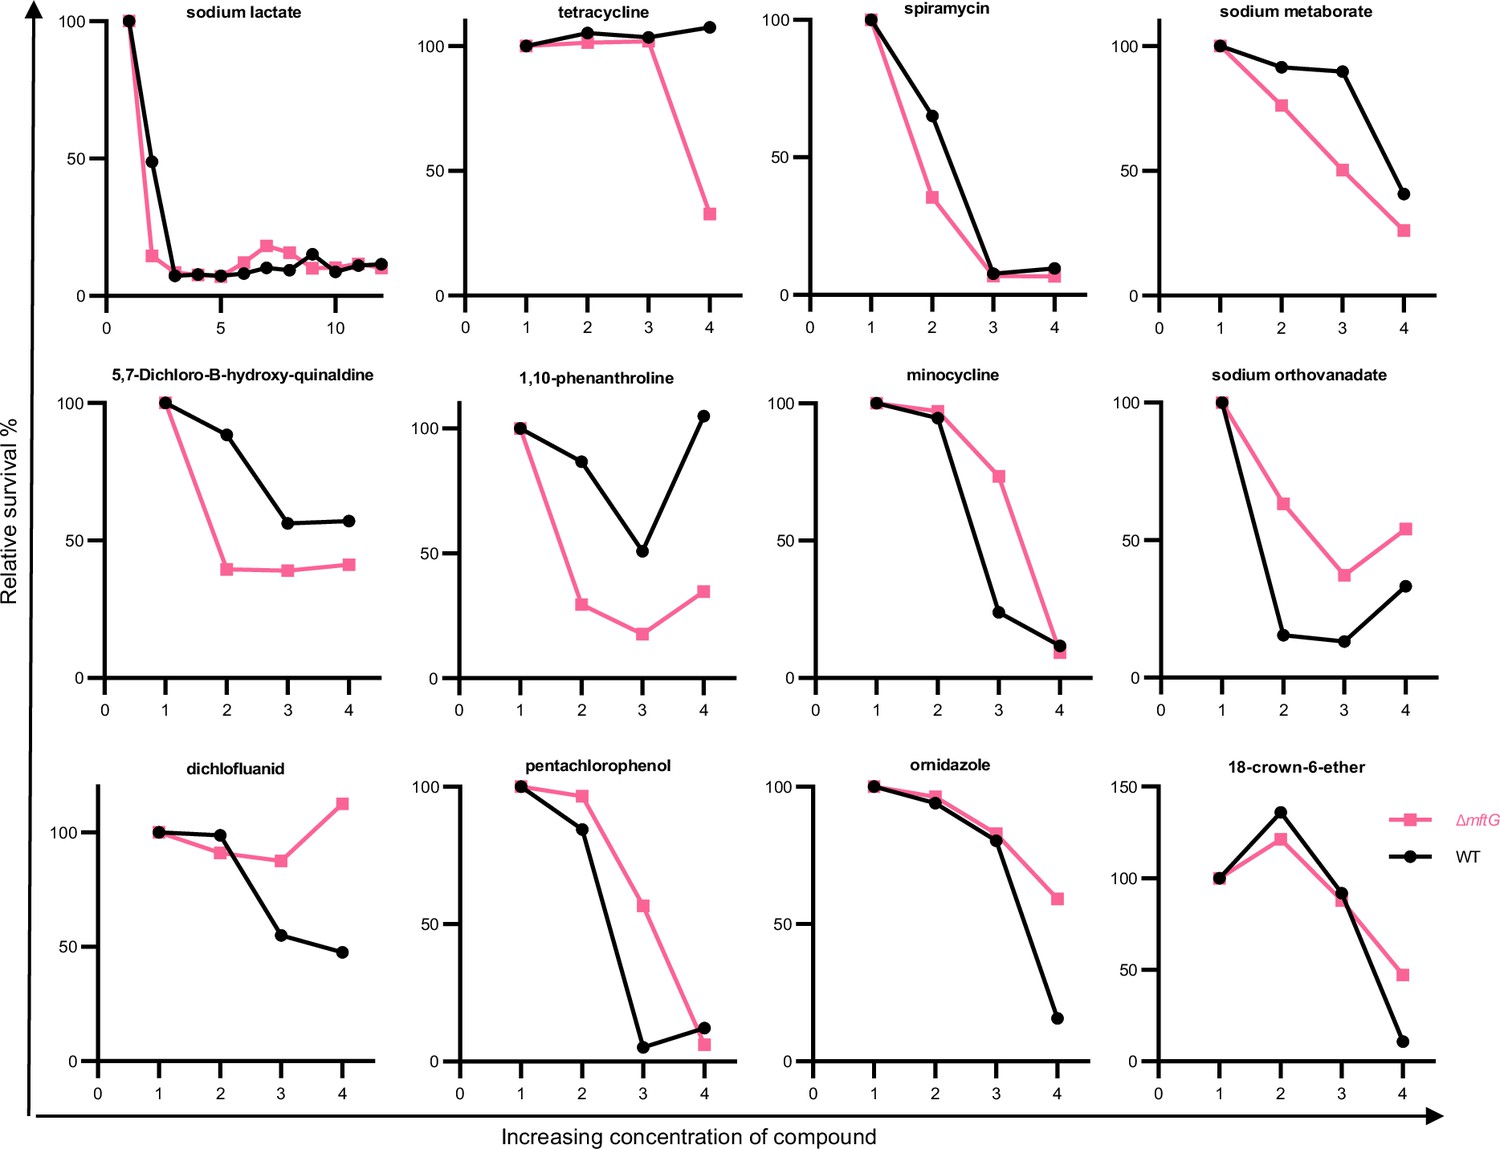
Differences between the relative growth of the M. smegmatis WT (black) and ∆mftG (pink) strains using the phenotypic arrays.
Shown are selected compounds from Biolog PM10-20 that modulated the growth behavior. The x-axis represents the concentrations of compounds as multiples of their initial concentration (1 x, 2 x, 3 x, and 4 x). The Y-axis shows the relative survival of each strain compared to the starting condition.
Figure 4
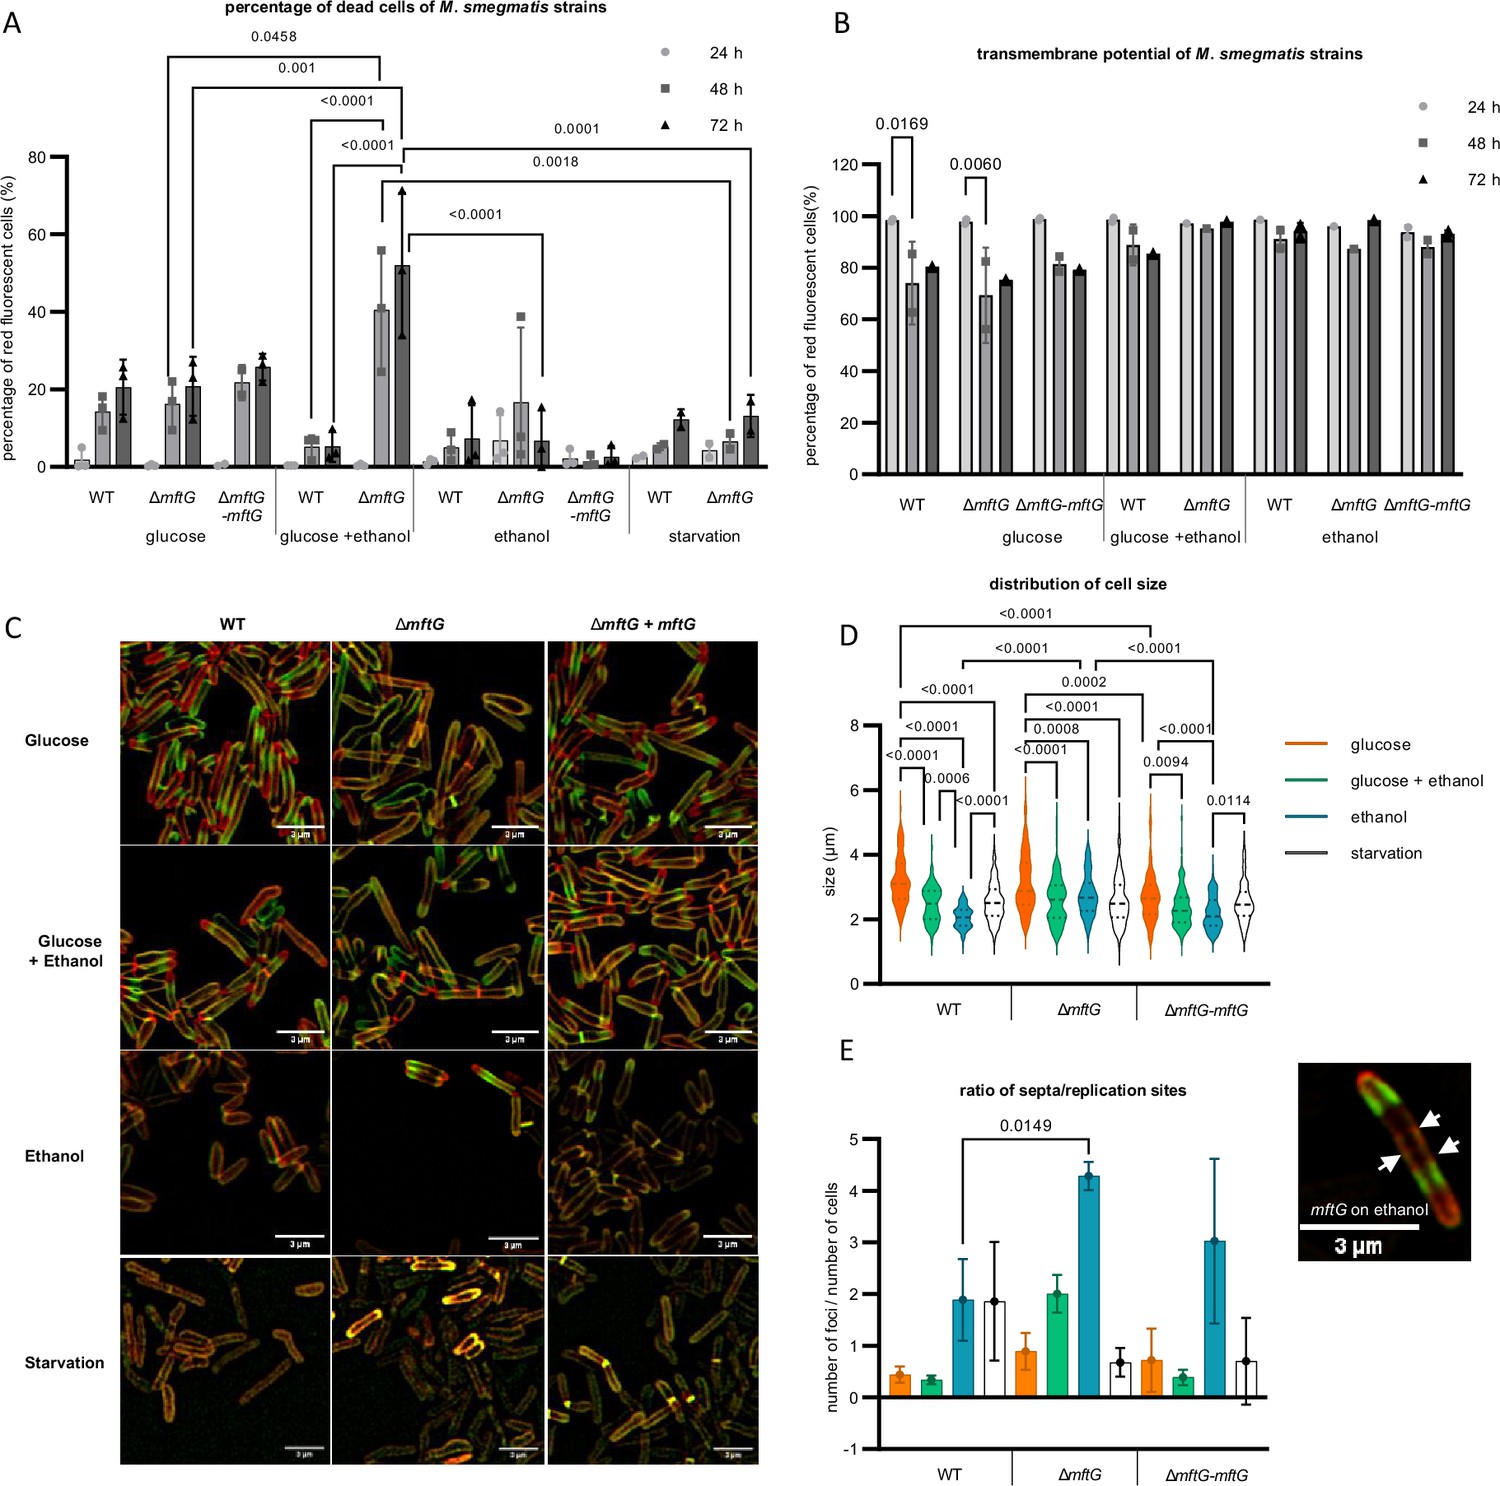
Phenotypic characterization of mycobacterial strains grown on HdB-Tyl with glucose and/or ethanol or starvation.
(A) Quantification of dead cells by flow cytometry using propidium iodide of M. smegmatis strains grown throughout 72 hr. Biological replicates, starvation cells n=2, other conditions n=3. (B) Quantification of cells with normal transmembrane potential by flow cytometry of the M. smegmatis cultures throughout 72 h. Biological replicates n=3. (C) Super-resolution microscopy images of M. smegmatis strains at exponential phase or 48 h of starvation, labeled with NADA (green), RADA (red), superposition of NADA and RADA (yellow). Bar size: 3 µm. (D) Cell size distribution obtained from super-resolution microscopy of the M. smegmatis strains at exponential phase or 48 h of starvation. (E) Ratio of the number of replication sites to the number of cells of the M. smegmatis strains cultures at exponential phase or 48 h of starvation, together with a microscopy image of a single ∆mftG cell at 48 h grown on ethanol, with arrows pointing to the several septa stained with NADA (green) and RADA (red). Bar size: 3 µm. Color legend: (A,B): ● – sample at 24 h; ■– sample at 48 h; ▲– 72 h. (C) (D,E): orange – 10 g L–1 glucose; green – 10 g L–1 glucose and 10 g L–1 ethanol; blue – 10 g L–1 ethanol; white – starvation for 48 h. Statistical analysis was performed for PI, cell size and ratio of replication sites per cell with ordinary one-way ANOVA, for transmembrane potential with ordinary two-way ANOVA, all using Tukey’s multiple comparison test. The p-values are depicted on the figure, microscopy-based analysis performed with technical replicates (n=3). Error bars represent standard deviations.
Figure 5
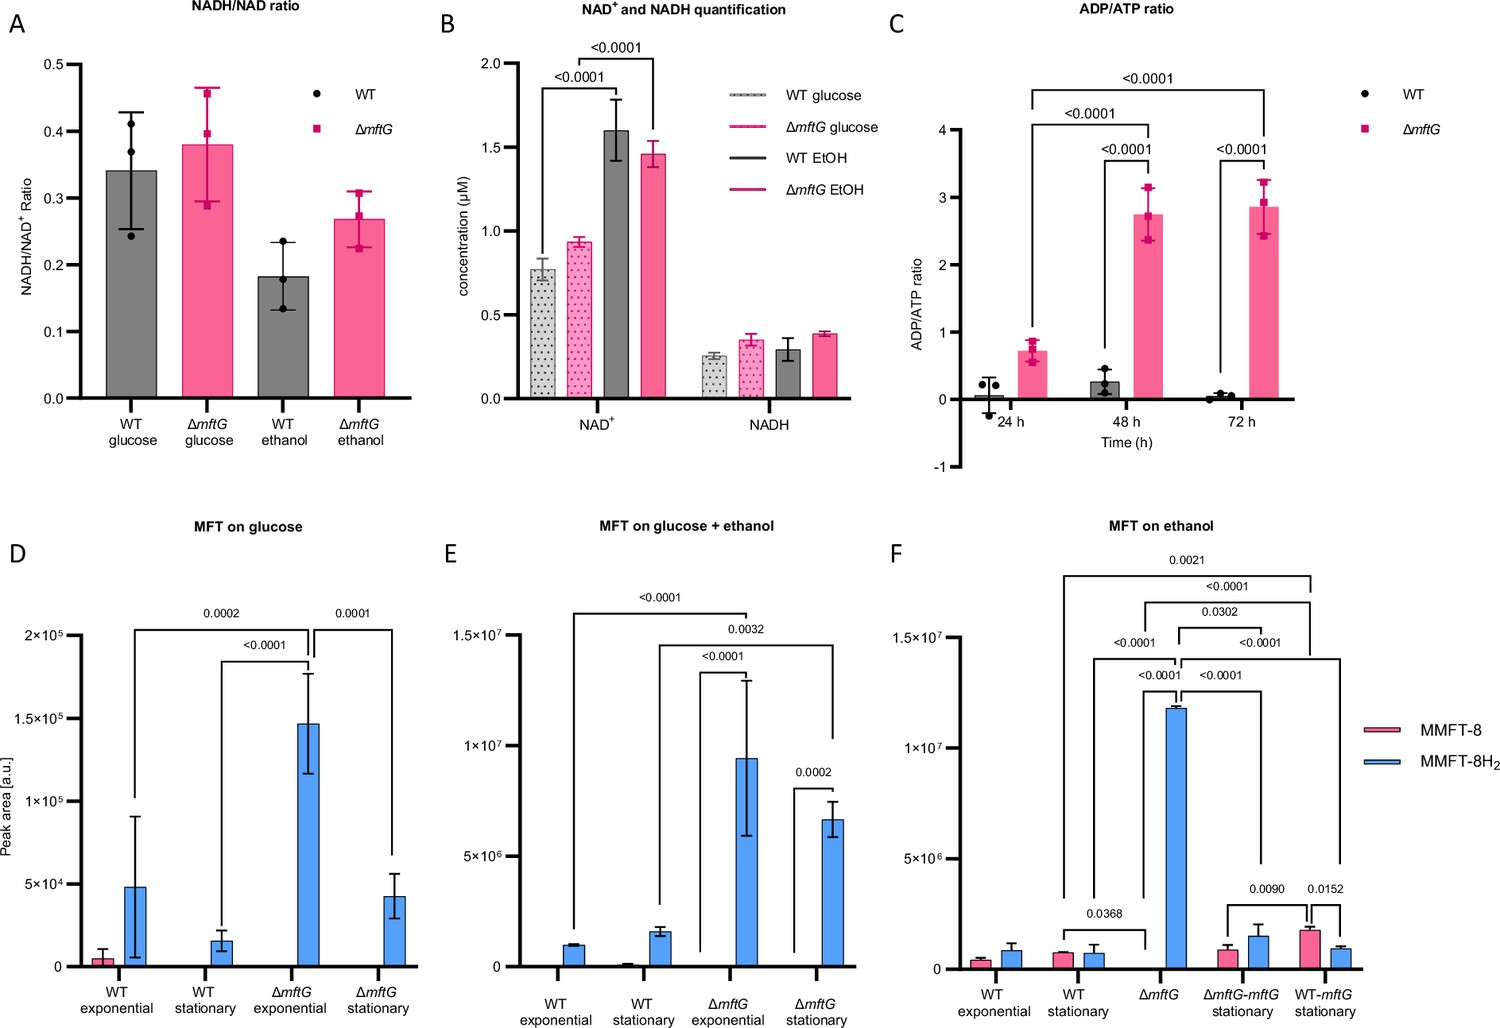
Cofactor metabolism of M. smegmatis strains.
(A) NADH/NAD+ ratio of M. smegmatis WT and ∆mftG grown on HdB-Tyl with either 10 g L–1 glucose or 10 g L–1 ethanol at exponential phase. (B) NADH and NAD+ quantification of M. smegmatis WT and ∆mftG grown on HdB-Tyl with either 10 g L–1 glucose or 10 g L–1 ethanol at exponential phase. (C) ADP/ATP ratio of M. smegmatis WT and ∆mftG grown on HdB-Tyl with 10 g L–1 ethanol at 24 hr, 48 h and 72 h. (D, E, F) Targeted comparative metabolomics of M. smegmatis WT, ∆mftG, ∆mftG-mftG, and WT-mftG strains. The most representative MFT species, methylmycofactocinone with 8 glucose moieties (MMFT-8H2, sum formula: C62H99NO43, RT: 6.82 min, m/z 1546.5665 [M+H]+) and methylmycofactocinol with 8 glucose moieties (MMFT-8, sum formula: C62H97NO43, RT: 7.18 min, m/z 1544.5507 [M+H]+), was used to reflect MFT obtained from M. smegmatis strains. The bacteria were grown in HdB-Tyl with either (D) 10 g L–1 glucose, (E) 10 g L–1 ethanol, or (F) 10 g L–1 glucose combined with 20 g L–1 ethanol. Samples of the different growth phases are represented in the chart. A sampling at 60 h of ∆mftG was chosen to sample the residual growth of the strain on ethanol as the sole carbon source. Statistical analysis was performed with one- or two-way ANOVA with Dunnett’s multiple comparison test for NADH/NAD+ ratio and, Tukey’s test for the rest, with most relevant p-values depicted on the figure. Measurements were performed in biological replicates (n=3), error bars represent standard deviations.
Figure 6 with 1 supplement
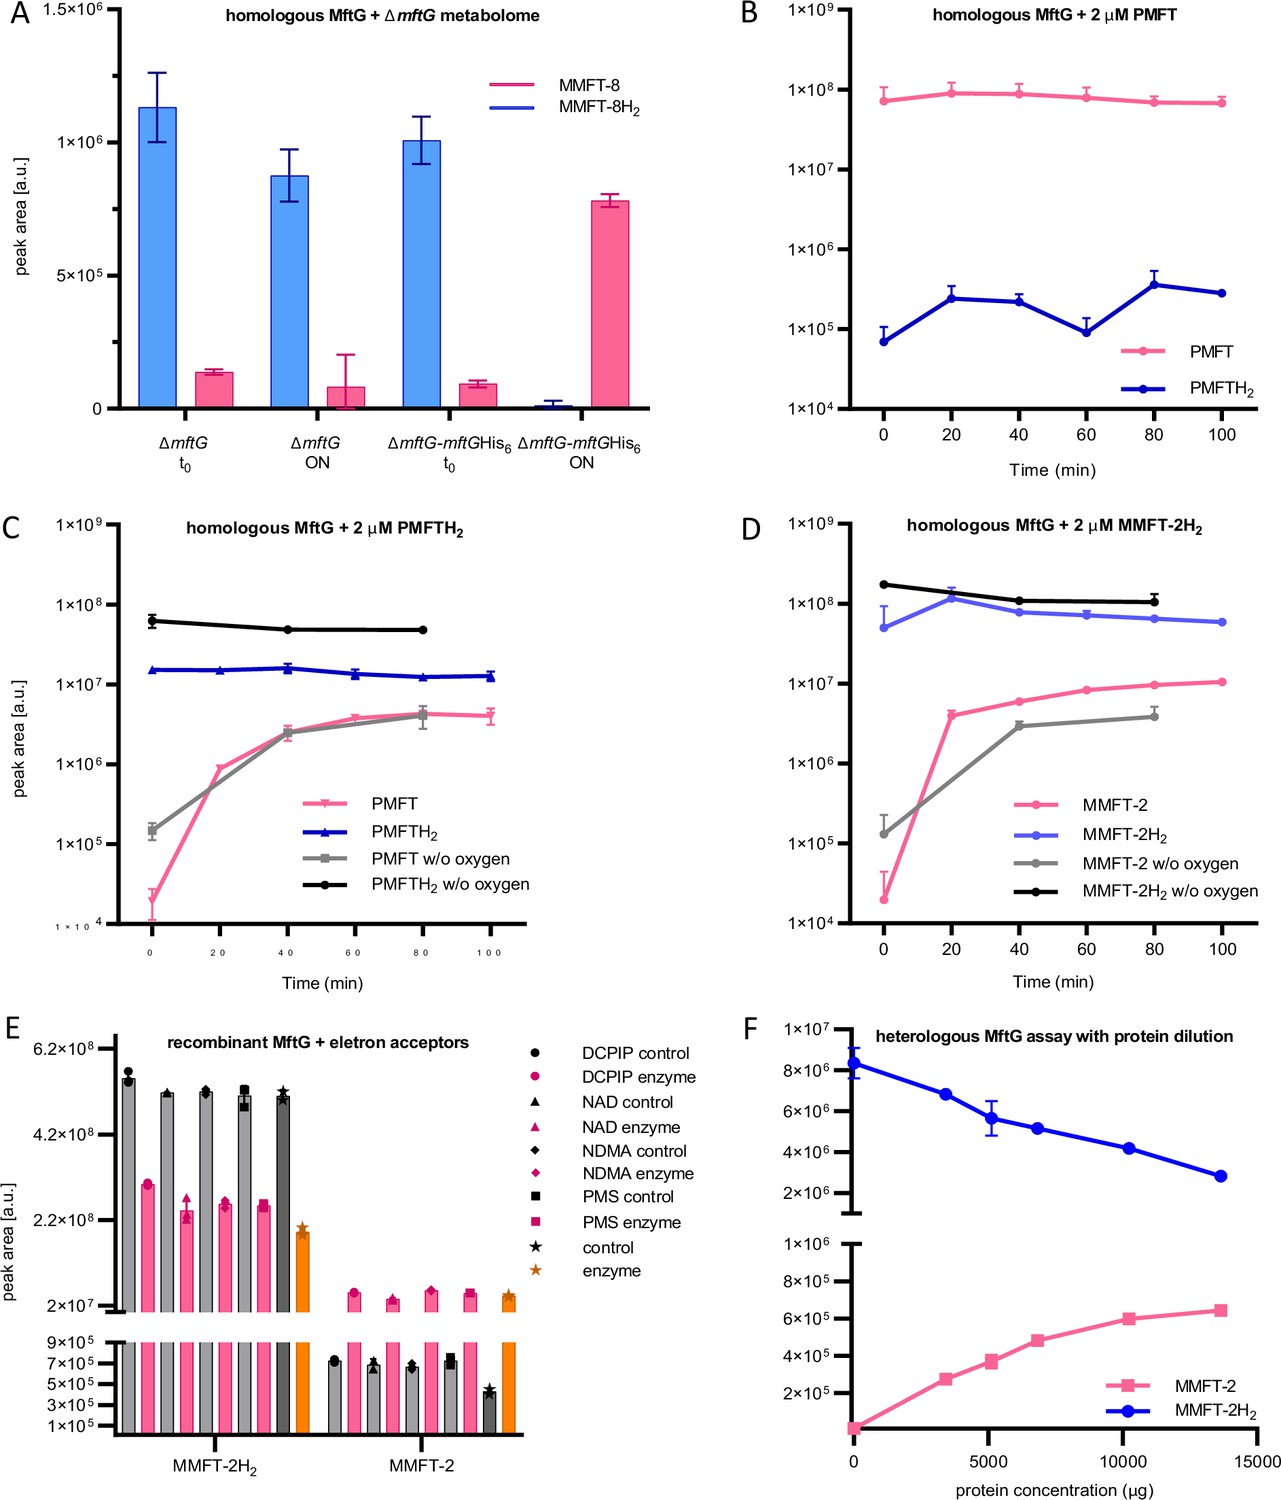
MftG assays with recombinant enzymes and MFTs as substrates.
(A) Mycofactocinol oxidation assay with semi-purified cell-free extract of M. smegmatis ∆mftG or ∆mftG-mftGHis6 using ∆mftG metabolome extract as substrate (naturally enriched in reduced MFT as described in Figure 5F). Result showing the oxidation of MMFT-8H2 to MMFT-8 after overnight incubation (ON) when semi-purified cell-free extract from ∆mftG-mftGHis6 is used. t0 – start of the assay. (B) Assay with semi-purified cell-free extract of ∆mftG-mftGHis6 using synthetic PMFT as a control substrate showed no relevant reaction. (C) Successful oxidation of PMFTH2 when synthetic PMFTH2 was used as substrate (C13H17NO3, RT: 7.84 min, m/z 236.1281 [M+H]+) to PMFT (C13H15NO3, RT: 8.40 min, m/z 234.1125 [M+H]+). Black and grey lines depict reactions performed in an anaerobic chamber. (D) Successful oxidation of MMFT-2H2 (C26H39NO13, RT: 7.10 min, m/z: 574.2494 [M+H]+) to MMFT-2 (C26H37NO13, RT: 7.47 min, m/z 572.2338 [M+H]+). Black and grey lines depict assays performed in the anaerobic chamber (E) Mycofactocinol (MMFT-2H2) oxidation using MftG heterologously produced in E. coli and DCPIP, NAD+, NDMA, and PMS as potential electron acceptors. Control – no MftG added; Enzyme – MftG added. (F) Dose-dependent effect of heterologously expressed MftG on the oxidation of MMFT-2H2 to MMFT-2 was observed after a 24 h incubation period. Sample size of all experiments n=3. Error bars represent standard deviations.
Figure 6—figure supplement 1

Mycofactocin dehydrogenase activity of MftG and enzyme preparations obtained from E. coli BL21 (DE3).
Experimental conditions were similar to assays shown in Figure 6E of the manuscript, except that metabolome extract from M. smegmatis containing MMFT-8H2 and MMMT-8 was used as a substrate. MftG: enzyme preparation from E. coli expressing mftG. Empty vector: enzyme preparation obtained from E. coli with empty expression vector. Inactivated MftG: enzyme preparation of E. coli expressing mftG, heat-treated at 99 °C for 10 min. Oxidation of MMFT-8H2 to MMFT-8 was associated with the presence of active MftG.
Figure 7
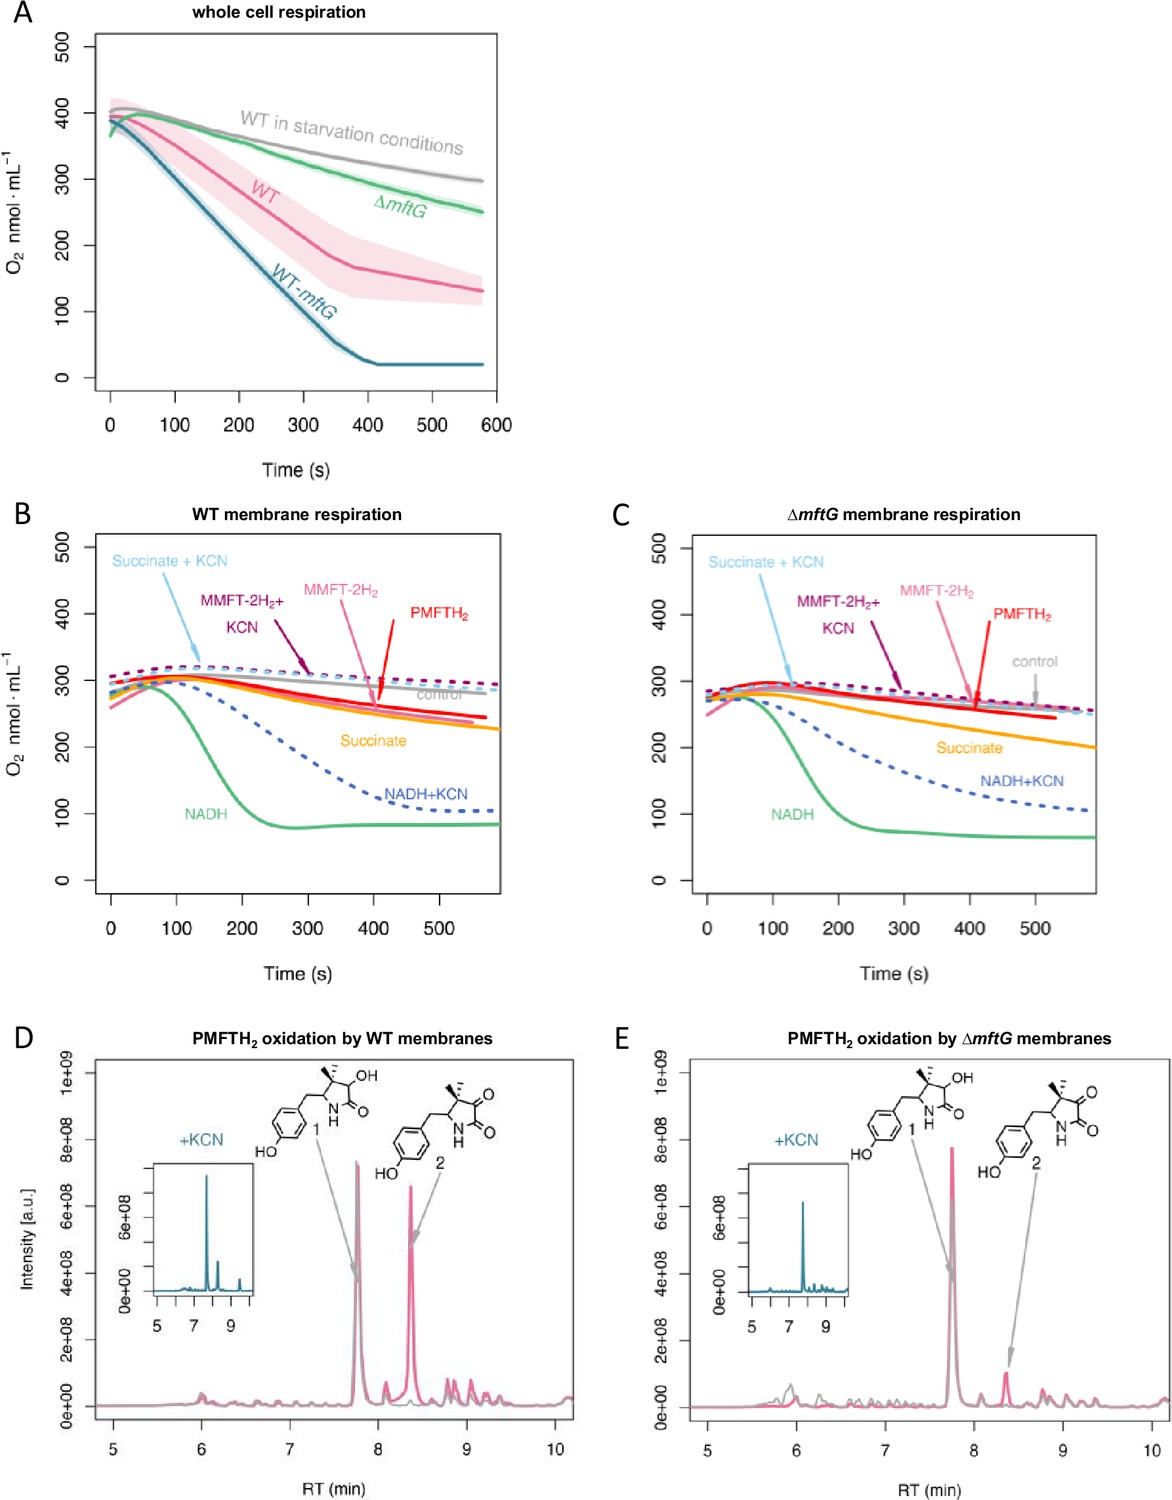
Respiratory activity (oxygen consumption) of M. smegmatis WT and ΔmftG mutants.
(A) Respiration of intact cells. Average of n=3 (B) Respiration of WT isolated cell membranes and addition of electron donors as indicated in the figure. (C) Respiration of ΔmftG isolated cell membranes and addition of electron donors as indicated in the figure. NADH and succinate served as positive controls, and water as a negative control. KCN treatment served as inhibitor control. MMFT-2H2 and PMFTH2 were added to confirm MFT’s role as an electron donor. (D) Oxidation of PMFTH2 to PMFT in WT isolated membranes (combined LC-MS profiles). (E) Oxidation of PMFTH2 to PMFT of the ΔmftG isolated membranes (combined LC-MS profiles). Each inset depicts the profile after KCN treatment. Representative data was selected from independent experiments n≥3.
Figure 8
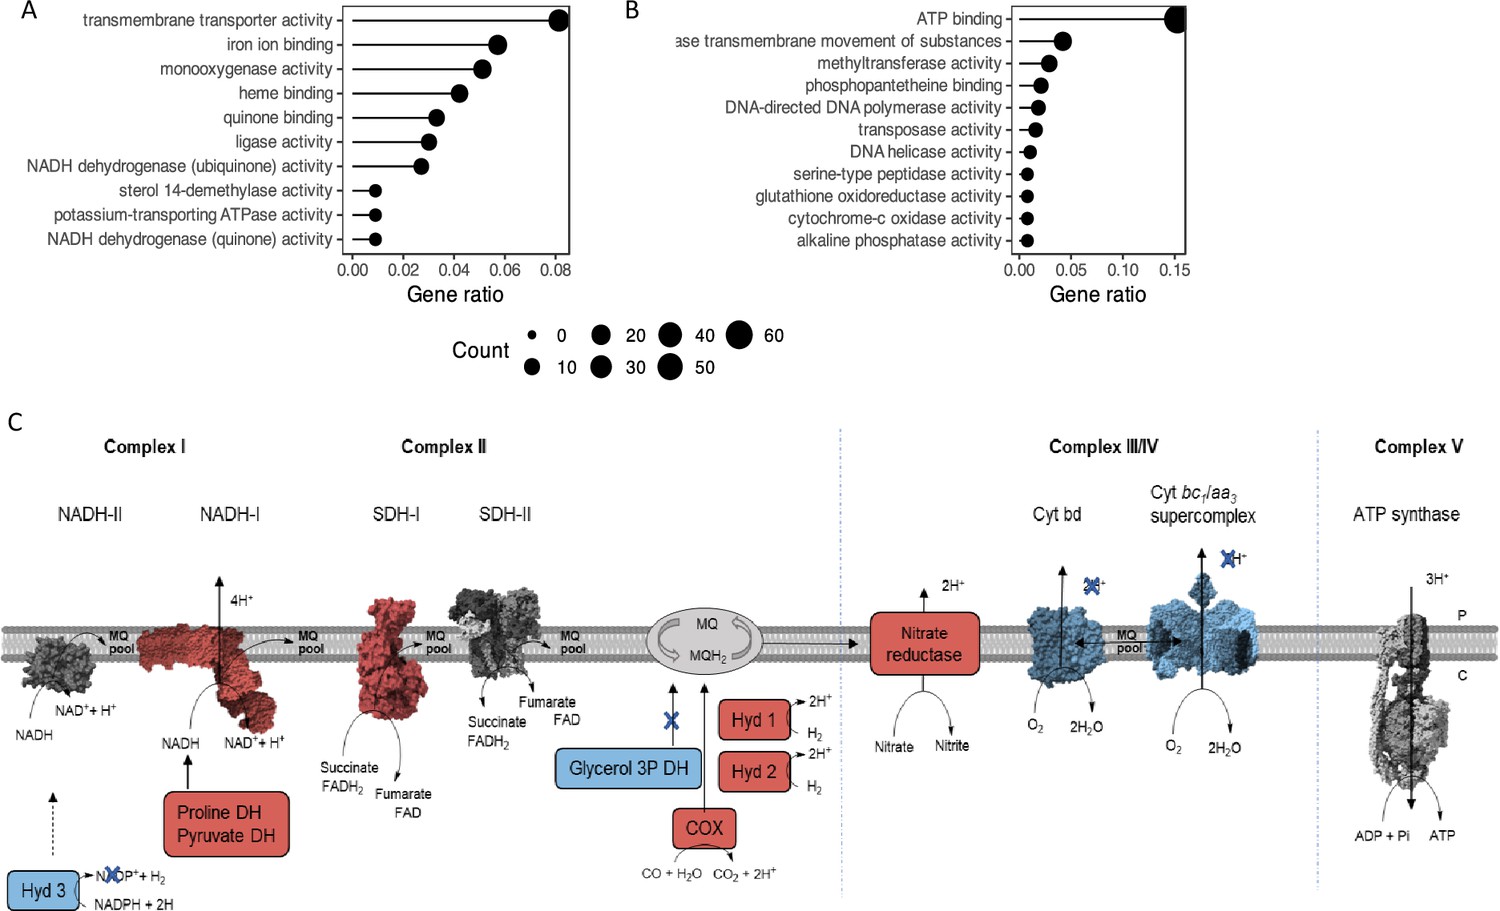
Representation of the main metabolic activities affected by mftG deletion in M. smegmatis grown on 10 g L–1 ethanol as the sole carbon source compared to WT.
(A,B) Functional annotation chart (Gene ontology enrichment analysis) of the (A) up- and (B) down-regulated processes. Gene ratio denotes the ratio of the involved genes (count) to the quantity of the genes making up the enriched terms. (C) Impact on the respiration of the mutant strain ∆mftG grown on 10 g L–1 ethanol compared to WT strain. Blue represents genes downregulated p<0.05 and log2FC< –2. Red represents genes upregulated p<0.05 and log2FC >2. Protein figures retrieved from public databases NADH-II: A0QYD6, NADH-I: 8E9G, Cyt bd: 7D5I, Cyt bc1-aa3: 7RH5, SDH-II: 6LUM, Sdh-I: 7D6X, ATP synthase: 7NJK.
Tables
Table 1
List of M. smegmatis and E. coli strains, vectors, plasmids and primers used and generated on the course of this study.
| Strain | Description | Reference |
|---|---|---|
| WT | Mycolicibacterium smegmatis MC2 155 | Krishnamoorthy et al., 2019 |
| ∆mftG | derivate of WT without mftG replaced with loxP site | this study |
| ∆mftG-mftG | derivate of ∆mftG integrated with pPG29 at the attB site | this study |
| WT-mftG | derivate of WT integrated with pPG29 at the attB site | this study |
| ∆mftG- mftGHis6 | derivate of ∆mftG integrated with pPG32 at the attB site | this study |
| WT-mftABCDEF | derivate of WT integrated with pPG23 at the attB site | this study |
| NiCo21(DE3) Competent E. coli | derived from E. coli BL21 (DE3) | New England Biolabs |
| Escherichia coli TOP10 | F–mcrA Δ(mrr-hsdRMS-mcrBC) φ80lacZΔM15 ΔlacX74 recA1 araD139 Δ(ara-leu)7697 galU galK λ–rpsL(StrR) endA1 nupG | Thermo Fischer |
| Plasmid name | Backbone | Reference |
| pML2424 | vector for double crossover event with tdTomato, gfp-hyg cassette, and PAL5000ts | Ofer et al., 2012 |
| pML2714 | vector with kanamycin resistance for Cre recombinase expression and gfp-hyg cassette removal | Ofer et al., 2012 |
| pPG20 | pMCpAINT derivate with kanamycin resistance, potential mycofactocin promotor, and mftF | Peña-Ortiz et al., 2020a |
| pPG17 | pML2424 with up and downstream regions of mftG | this study |
| pPG23 | pMCpAINT derivate with kanamycin resistance, potential mycofactocin promotor, and mftABCDEF | this study |
| pPG29 | pPG20 with mftF replaced with mftG | this study |
| pPG32 | pPG29 with mftG replaced with mftGHis6 | this study |
| pPG36 | pMAL-C4X with malE fused with mftG codon optimized for E. coli expression | this study |
| Primer name | Primer sequence 5’–3’ | Amplicon |
| GMC_up_F1 | GCTACACTAGTCGGTGTCGTATGTGCCGAG | upstream region of mftG |
| GMC_up_R1 | GCTACATTTAAATTCAAAGTCGGCGGCTAACTC | |
| GMC_dn_F1 | GCTACTTAATTAATCGACGGCTCGATCATGC | downstream region of mftG |
| GMC_dn_R1 | GCTACATGCATGTTGTCGAGGCTCCGGTG | |
| INT_GMC_F1 | CACTATGGGTCGACGCTGAC | internal region of mftG |
| INT_GMC_R1 | GCGTGACTTACCAATTCGCG | |
| EXT_GMC_F1 | AACATCGTGGCCCGGTAC | external region of mftG |
| EXT_GMC_R1 | CTCCTCACGCGACGACTC | |
| pMCpAINT_FC_F | GCTACAAGCTTATCGATGTCGACGTAGTTAAC | backbone pMCpAINT introducing NdeI |
| pPG20_NdeI_R | GCTACCCATATGCGTATGGTCTCGACAGTTGT | |
| GMC_COMP_F1 | GCTACCCATATGGAGTTAGCCGCCGACTTT | insertion of 6 histidines C-terminally |
| GMC_Hist_R3 | GCTACAAGCTTACTATTAGTGGTGGTGGTGGTGGTGGGTCGCGATG AACTCGGC | |
| pMCpAINT_conf_2_F | CTGATACCGCTCGCCGCA | sequencing confirmation |
| pMCpAINT_conf_2_R | CTTTCGACTGAGCCTTTCGT | |
| MFTKIMS_FC_KI_CLUSTER_F2 | GCTACCCATGGTCGGACATCTCTCACACCCC | region from hypothetical mycofactocin precursor until end of mftF |
| MS_FC_KI_CLUSTER_R1 | GTTAACTACGTCGACATCGATAAGCTTTCAAAGTCGGCGGCTAACTC |
Appendix 1—key resources table
| Reagent type (species) or resource | Designation | Source or reference | Identifiers | Additional information |
|---|---|---|---|---|
| Strain, strain background (Escherichia coli) | NiCo21 (DE3) | New England BioLabs | C2529H | Derivative of BL21 (DE3) |
| Strain, strain background (Mycolicibacterium smegmatis) | MC2 155 | ATCC | 700084 | Also referred to as wild type (WT) in this paper |
| Strain, strain background (Escherichia coli) | TOP10 | Thermo Fischer Scientific | C404010 | Derivative of K12, cloning strain |
| Gene (Mycolicibacterium smegmatis MC2 155) | mftG | GenBank | MSMEG_1428 | Corresponding Protein_ID: WP_014877070 |
| Genetic reagent (Mycolicibacterium smegmatis MC2 155) | ΔmftG | This paper | Deletion mutant of mftG | |
| Genetic reagent (Mycolicibacterium smegmatis MC2 155) | ΔmftG-mftG | This paper | Complement mutant of mftG | |
| Genetic reagent (Mycolicibacterium smegmatis MC2 155) | WT-mftG | This paper | Overexpression mutant of mftG | |
| Genetic reagent (Mycolicibacterium smegmatis MC2 155) | ∆mftG-mftGHis6 | This paper | Overexpression mutant of His-tagged mftG in ∆mftG | |
| Genetic reagent (Mycolicibacterium smegmatis MC2 155) | WT- mftABCDEF | This paper | Overexpression mutant of mftABCDEF | |
| Recombinant DNA reagent | pML2424 (plasmid vector) | Ofer et al., 2012 | vector for double crossover event with tdTomato, gfp-hyg cassette, and PAL5000ts | |
| Recombinant DNA reagent | pML2714 (plasmid vector) | Ofer et al., 2012 | vector with kanamycin resistance for Cre recombinase expression and gfp-hyg cassette removal | |
| Recombinant DNA reagent | pPG17 (plasmid) | This paper | pML2424 with up and downstream regions of mftG | |
| Recombinant DNA reagent | pPG20 (plasmid) | Peña-Ortiz et al., 2020a | pMCpAINT derivate with kanamycin resistance, potential mycofactocin promotor, and mftF | |
| Recombinant DNA reagent | pPG23 (plasmid) | This paper | pMCpAINT derivate with kanamycin resistance, potential mycofactocin promotor, and mftABCDEF | |
| Recombinant DNA reagent | pPG29 (plasmid) | This paper | pPG20 with mftF replaced with mftG | |
| Recombinant DNA reagent | pPG32 (plasmid) | This paper | pPG29 with mftG replaced with mftGHis6 | |
| Recombinant DNA reagent | pPG36 (plasmid) | This paper | pMAL-C4X with malE fused with mftG codon optimized for E. coli expression | |
| Sequence-based reagent | GMC_up_F1 | This paper | PCR primers | GCTACACTAGTCGGTGTCGTATGTGCCGAG |
| Sequence-based reagent | GMC_up_R1 | This paper | PCR primers | GCTACATTTAAATTCAAAGTCGGCGGCTAACTC |
| Sequence-based reagent | GMC_dn_F1 | This paper | PCR primers | GCTACTTAATTAATCGACGGCTCGATCATGC |
| Sequence-based reagent | GMC_dn_R1 | This paper | PCR primers | GCTACATGCATGTTGTCGAGGCTCCGGTG |
| Peptide, recombinant protein | MftGHis6 | This paper | MftG (WP_014877070) with C-terminal hexahistidine tag | |
| Commercial assay or kit | NAD+/NADH Assay Kit | Merck | Sigma-Aldrich: MAK460 | |
| Commercial assay or kit | ADP/ATP Ratio Assay | Merck | Sigma-Aldrich: MAK135 | |
| Commercial assay or kit | Acetaldehyde Assay Kit | Merck | Sigma-Aldrich: MAK321 | |
| Commercial assay or kit | InnuPREP RNA Mini kit 2.0 | Analytik Jena | Analytik Jena: 845-KS-2040010 | |
| Commercial assay or kit | Illumina Stranded Total RNA Prep, Ligation with Ribo-Zero Plus | Illumina | Illumina: 20040525 | |
| Commercial assay or kit | IDT for Illumina RNA UD Indexes Set A, Ligation | Ilumina | 20040553 | |
| Commercial assay or kit | AMPURE XP Beads | Beckman | A63881 | |
| Commercial assay or kit | Roti-Nanoquant | Carl Roth | Carl Roth: K880 | Protein Concentration Determination Kit |
| Chemical compound, drug | premycofactocinone (PMFT) | Ellerhorst et al., 2022 | ||
| Chemical compound, drug | premycofactocinol (PMFTH2) | Ellerhorst et al., 2022 | ||
| Chemical compound, drug | methylmycofactocinol-2 (MMFT-2H2) | This study | methylmycofactocinol-2 purified from WT- mftABCDEF | |
| Chemical compound, drug | cellulase from Trichoderma reesei ATCC 26921 | Sigma-Aldrich | Sigma-Aldrich: C8546 | |
| Chemical compound | HADA | Bio-Techne | Bio-Techne: 6647 | 3-[[(7-Hydroxy-2-oxo-2H-1-benzopyran-3- yl)carbonyl]amino] -D-alanine hydrocholoride |
| Chemical compound | NADA | Bio-Techne | Bio-Techne: 6648 | 3-[(7-Nitro-2,1,3-benzoxadiazol-4-yl)amino] -D-alanine hydrochloride |
| Chemical compound | RADA | Bio-Techne | Bio-Techne: 6649 | (S)‐N‐(9‐(4‐((2‐amino‐2‐carboxyethyl)carbamoyl)‐2‐carboxyphenyl) ‐6‐(dimethylamino)3 H‐xanthen‐3‐ylidene)‐N‐methylmethanaminium |
| Chemical compound, drug | Tyloxapol | BioXtra (Sigma-Aldrich) | Sigma-Aldrich: T0307 | |
| Chemical compound, drug | Tween 80 | Sigma-Aldrich | Sigma-Aldrich: P1754 | |
| Chemical compound, drug | 3,3'-diethyloxacarbocy-anine iodide (DIOC2(3)) | Sigma-Aldrich | Sigma-Aldrich: 320684 | |
| Chemical compound, drug | Carbonyl cyanide 3-chlorophenylhydrazone (CCCP) | Sigma-Aldrich | Sigma-Aldrich: C2759 | |
| Chemical compound, drug | Isopropyl-β -D-thiogalacto-pyranoside (IPTG) | Carl Roth | Carl Roth: 2316.3 | |
| Chemical compound, drug | Flavine adenine dinucleotide disodium salt (FAD) | Carl Roth | Carl Roth: 5581.1 | |
| Chemical compound, drug | β-Nicotiamid adenin dinucleotide (NAD) hydrate | Sigma-Aldrich | Sigma-Aldrich: N1511 | |
| Chemical compound, drug | β-Nicotiamid adenin dinucleotide (NADH) disodium salt | Carl Roth | Carl Roth: AE12 | |
| Chemical compound, drug | N,N-Dimethyl-4-nitrosoaniline (NDMA) | Sigma-Aldrich | Sigma-Aldrich: D172405 | Electron Acceptor |
| Chemical compound, drug | 2,6-Dichloro-phenolindophenol sodium salt hydrate | Sigma-Aldrich | Sigma-Aldrich: D1878 | Electron Acceptor |
| Chemical compound, drug | Phenazine methosulfate | Sigma-Aldrich | Sigma-Aldrich: P7625 | Electron Acceptor |
| Chemical compound, drug | Potassium cyanide (KCN) | Sigma-Aldrich | Sigma-Aldrich: 60178 | |
| Other, FPLC column | MBPTrap HP 1 mL | Cytiva | Cytiva: 29048641 | |
| Other, FPLC column | Superdex 30 Increase 10/300 GL | Cytiva | Cytiva: 29219757 | |
| Other, HPLC column | Kinetex 2.6 µm XB-C18 100 Å LC-Column, 150x2.1 mm | Phenomenex | Phenomenex: 00F-4496-AN | Column for LC-MS/MS |
| Other, HPLC column | SecurityGuard ULTRA Cartridge, UHPLC C18, 2.1 mm | Phenomenex | Phenomenex: AJ0-8782 | Guard Column for LC-MS/MS Column |
| Other, HPLC column | Kromasil 5 µm C18 100 Å LC-Column, 40x4 mm | Dr. Maisch GmbH | Dr. Maisch GmbH: k15.9e.s0404 | Guard Column for HPLC-RI/-UV Column |
| Other, HPLC column | Aminex HPX-87H 9 µm Ion Exclusion Column, 300x7.8 mm, 9 µm | Bio-Rad | Bio-Rad: #1250140 | Column for HPLC-RI/-UV |
| Other, solid phase extraction (SPE) column | CHROMABOND C18, 45 µm, 70 mL/10,000 mg | Machery-Nagel | Machery-Nagel: 730261 | |
| Software, algorithm | ggVennDiagram 1.2.3 | Aleksenko et al., 2020 | R Package for Venn Diagram Construction | |
| Software, algorithm | FastTree 2.1.11 | Price et al., 2010 | Software for fast phylogenetic analysis using a Maximum Likelihood algorithm | |
| Software, algorithm | Geneious Prime 2022.2.2 | Dotmatics | RRID:SCR_010519 | Molecular Biology software |
| Software, algorithm | GraphPad Prism 9 | Dotmatics | RRID:SCR_002798 | Statistics software |
| Software, algorithm | CGQuant | Aquila Biolabs | Software for processing data acquired by CGQ (Cell Growth Quantifier) instrument | |
| Software, algorithm | mzMine 2.53 | Pluskal et al., 2010 | Metabolomics software | |
| Software, algorithm | fastP | Chen et al., 2018 | ||
| Software, algorithm | BWA-MEM | Vasimuddin et al., 2019 | ||
| Software, algorithm | DESeq2 | Love et al., 2014 | ||
| Software, algorithm | flowCore_2.2.0 | Hahne et al., 2009 | Analysis of flow-cytometric data | |
| Software, algorithm | ggcyto_1.18.0 | Van et al., 2018 | Analysis of flow-cytometric data | |
| Software, algorithm | ChimeraX 1.2.5 | Goddard et al., 2018 | Protein visualization and structure analysis software | |
| Software, algorithm | BLAST | Altschul et al., 1990 | Biological sequence similarity search software | |
| Software, algorithm | FlowJo v10.8 | BD Life Sciences | Flow cytometry software | |
| Software, algorithm | enviPat | Loos et al., 2015 | ||
| Software, algorithm | ZenBlack | Zeiss | Software for image analysis and acquisition | |
| Software, algorithm | Fiji ImageJ | Schindelin et al., 2012 | Software for image analysis | |
| Software, algorithm | FlowJo v10.8 | BD Life Sciences | Software for flow cytometry data acquisition and analysis | |
| Software, algorithm | Oxytherm+ | Hansatech Instruments | Respirometer software |
Additional files
-
Supplementary file 1
Sequences of the plasmids generated in this study.
- https://cdn.elifesciences.org/articles/97559/elife-97559-supp1-v1.pdf
-
Supplementary file 2
Set of organisms encoding MftG or MftC homologs (co-occurrence table).
The co-occurrence table (sheet 1) contains accession numbers of MftG and MftC candidate proteins, as well as further GMC proteins found in each organism. The phylogenetic analysis was based on all GMC enzymes including MftG listed in the co-occurrence table as well as the GMC proteins listed‚ under ‘Reference GMC enzymes’ (sheet 2).
- https://cdn.elifesciences.org/articles/97559/elife-97559-supp2-v1.xlsx
-
Supplementary file 3
Gene expression analysis of M. smegmatis MC2 155 ∆mftG compared to WT grown on either ethanol or glucose as a carbon source.
Sheet 1: Gene expression in ∆mftG mutants compared to WT of M. smegmatis MC2 155 grown on 10 g L–1 ethanol as the sole carbon source. Sheet 2: Gene expression in ∆mftG mutants compared to WT of M. smegmatis MC2 155 grown on 10 g L–1 glcuose as the sole carbon source. Black: all the genes with adjusted P-value ≤0.05. Grey: all the genes that with adjusted P-value >0.05.
- https://cdn.elifesciences.org/articles/97559/elife-97559-supp3-v1.xlsx
-
MDAR checklist
- https://cdn.elifesciences.org/articles/97559/elife-97559-mdarchecklist1-v1.docx
Download links
A two-part list of links to download the article, or parts of the article, in various formats.
Downloads (link to download the article as PDF)
Open citations (links to open the citations from this article in various online reference manager services)
Cite this article (links to download the citations from this article in formats compatible with various reference manager tools)
MftG is crucial for ethanol metabolism of mycobacteria by linking mycofactocin oxidation to respiration
eLife 13:RP97559.
https://doi.org/10.7554/eLife.97559.4


