Downregulation of semaphorin 4A in keratinocytes reflects the features of non-lesional psoriasis
- Department of Dermatology, Course of Integrated Medicine, Graduate School of Medicine, Osaka University, Japan
- Department of Neurocutaneous Medicine, Division of Health Sciences, Graduate School of Medicine, Osaka University, Japan
- Research Department, Maruho Co, Ltd., Japan
- Cutaneous Allergy and Host Defense, Immunology Frontier Research Center (iFReC), Osaka University, Japan
- Department of Plastic Surgery, Course of Organ Regulation Medicine, Graduate School of Medicine, Osaka University, Japan
- Department of Plastic and Reconstructive Surgery, Kindai University, Japan
- Department of Respiratory Medicine and Clinical Immunology, Course of Internal Medicine, Graduate School of Medicine, Osaka University, Japan
- Department of Medicine for Cutaneous Immunological Diseases, Course of Integrated Medicine, Graduate School of Medicine, Osaka University, Japan
Figures
Figure 1 with 2 supplements
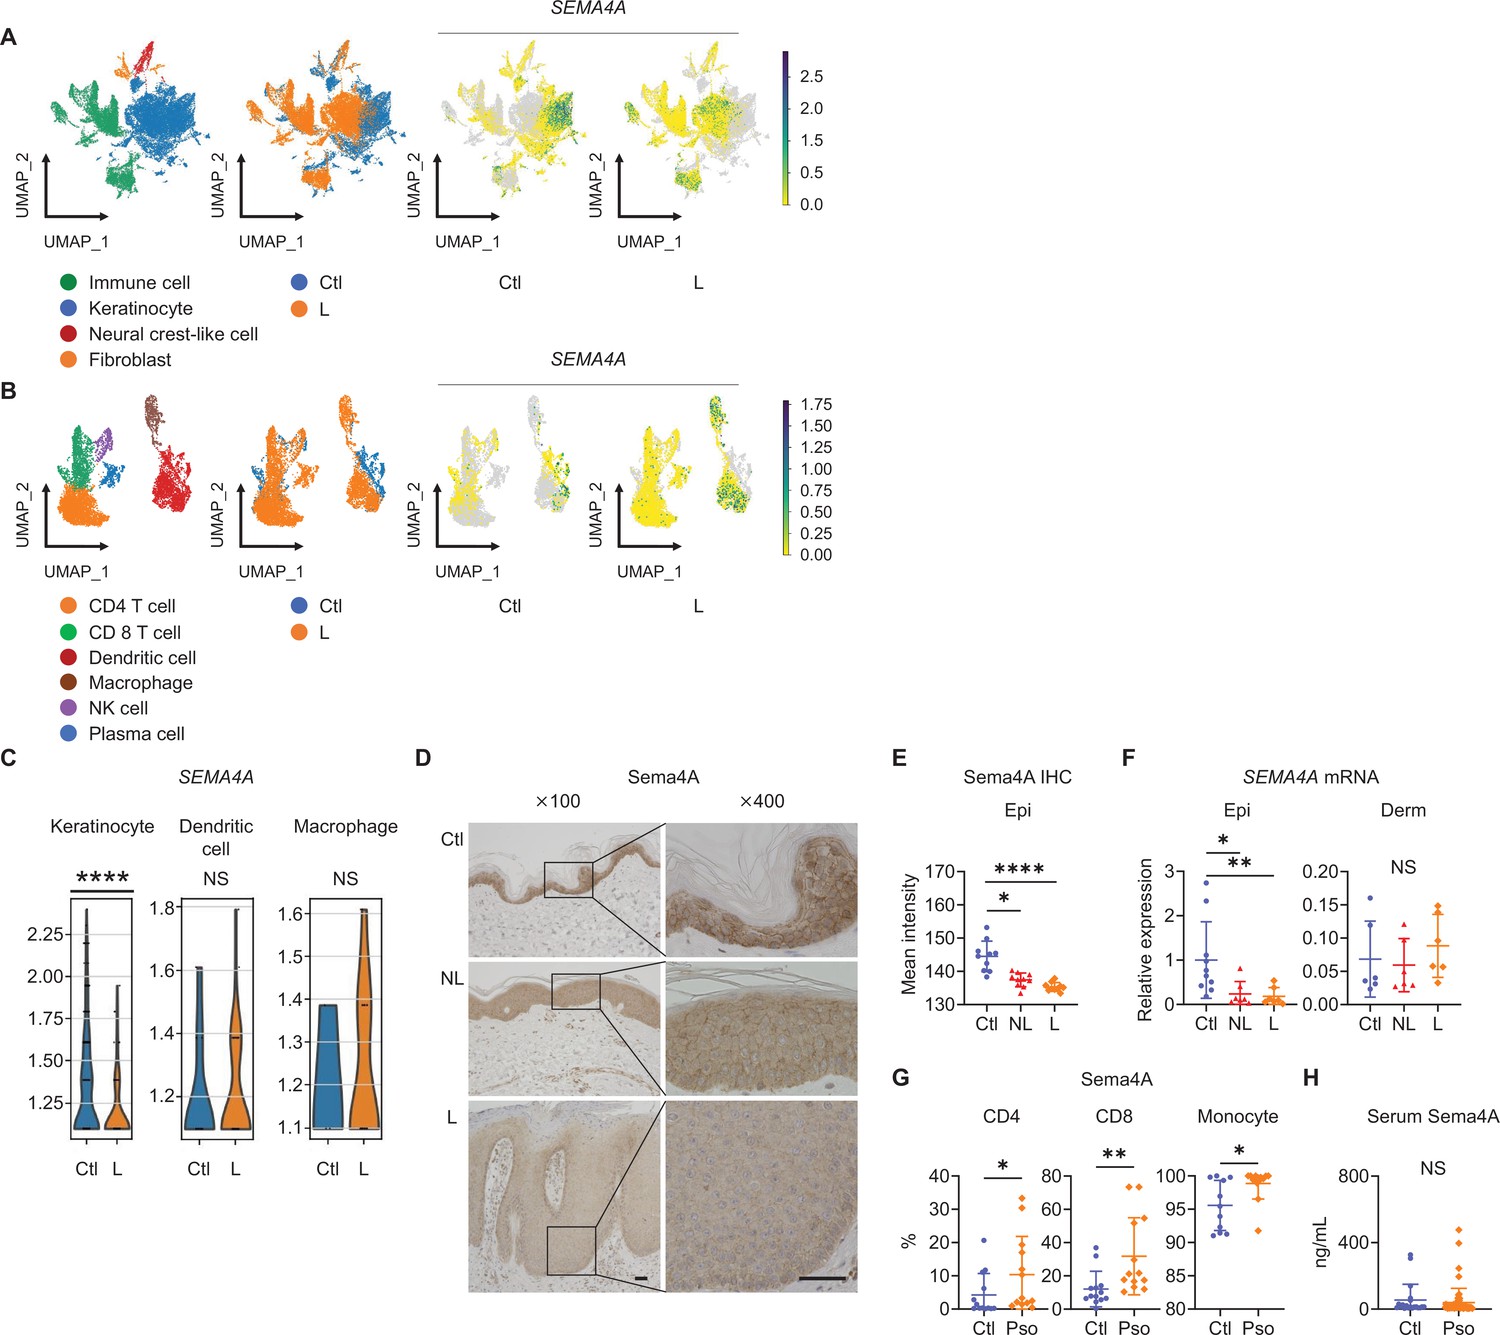
Epidermal Sema4A expression is downregulated in psoriasis.
(A) UMAP plots, generated from single-cell RNA-sequencing data (GSE220116), illustrate cell distributions from control (Ctl) and psoriatic lesion (L) samples (n=10 for Ctl, n=11 for L). (B) Subclustering of immune cells. (C) SEMA4A expression in keratinocytes, dendritic cells, and macrophages. ****padj<0.001. NS, not significant. Analyzed using Python and cellxgene VIP. (D) Representative immunohistochemistry and magnified views showing Sema4A expression in Ctl, psoriatic non-lesion (NL), and L. Scale bar = 50 μm. (E) Mean epidermal (Epi) Sema4A intensity in immunohistochemistry (n=10 per group). Each dot represents the average intensity from 5 unit areas per sample. (F) Relative SEMA4A expression in Epi (n=10 for Ctl, n=7 for L and NL) and dermis (Derm, n=6 per group). (G) Proportions of Sema4A-expressing cells in blood CD4 T cells (left), CD8 T cells (middle), and monocytes (right) from Ctl and psoriatic (Pso) patients (n=13 per group in CD4 and CD8, n=11 for Ctl and n=13 for Pso in monocytes). (H) Serum Sema4A levels in Ctl (n=20) and Pso (n=60). (E–H) *p<0.05, **p<0.01, ****p<0.0001. NS, not significant. The error bars represent the standard deviation.
-
Figure 1—source data 1
Excel file containing quantitative data for Figure 1.
- https://cdn.elifesciences.org/articles/97654/elife-97654-fig1-data1-v1.xlsx
Figure 1—figure supplement 1
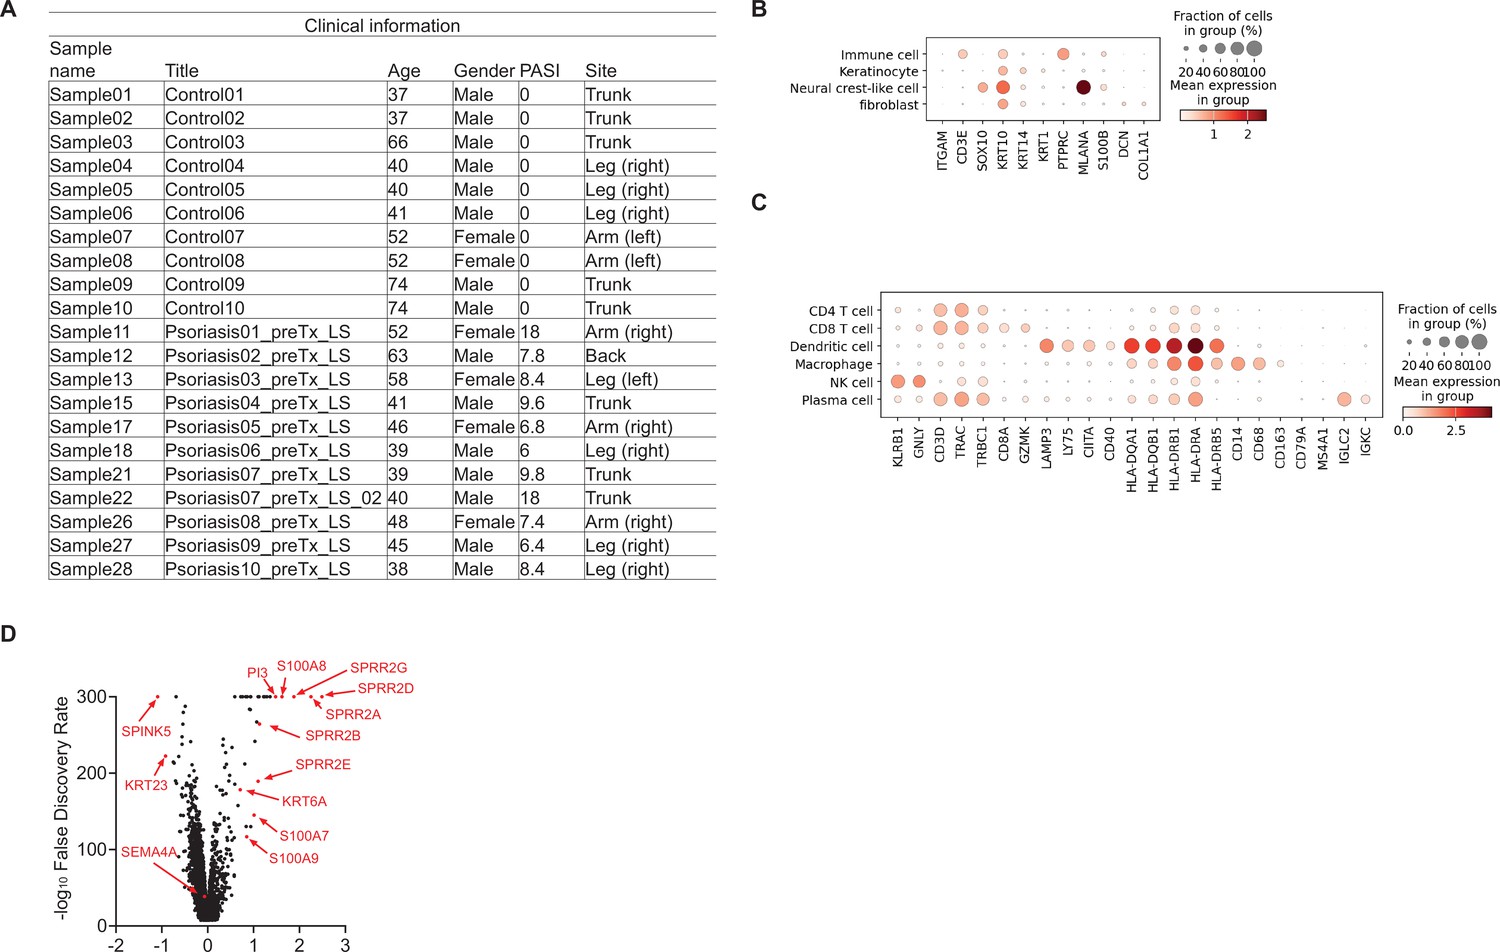
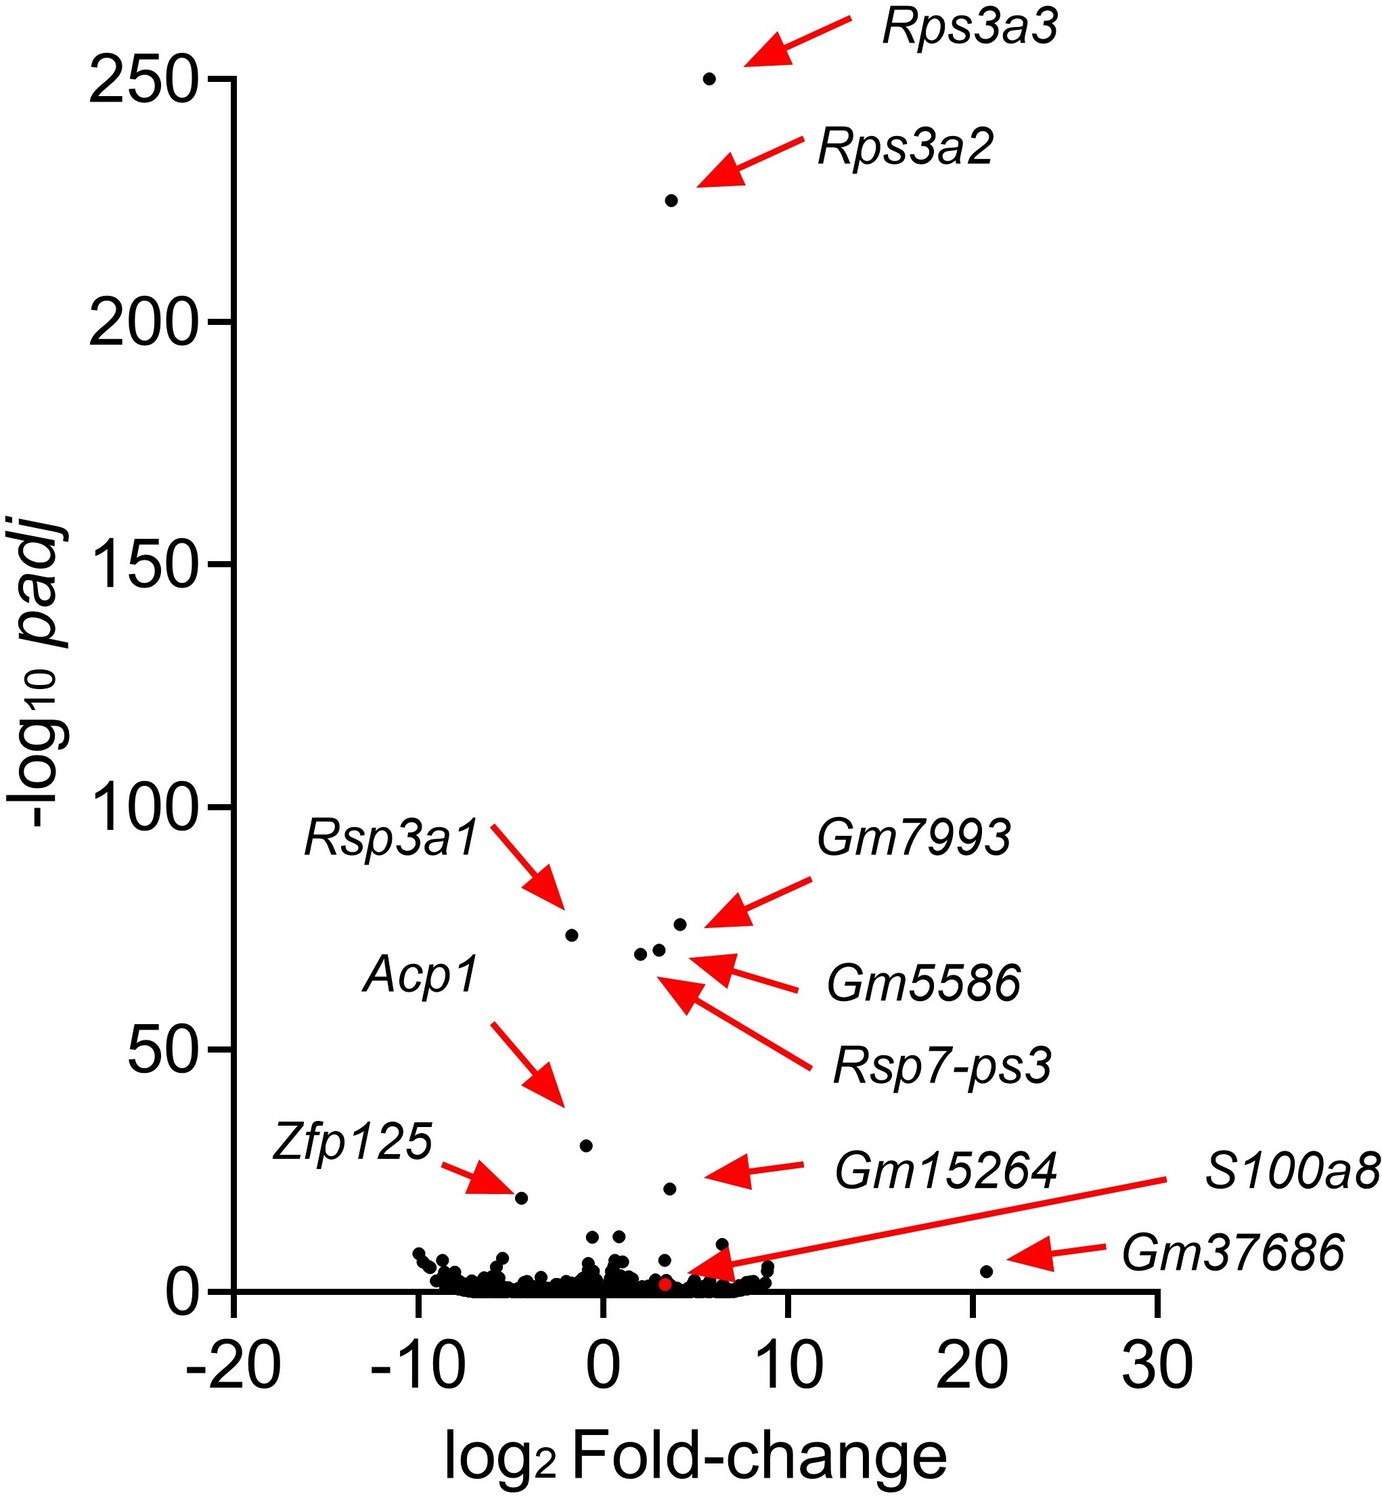
Sema4A is downregulated in the keratinocytes of lesional psoriasis in the single-cell RNA-sequencing data.
(A) Sample information for specimens from Ctl and psoriatic L (GSE220116). (B, C) Clusters of cells were identified by their expression patterns of signature genes. (D) The volcano plot displays changes in gene expression in psoriatic L compared to Ctl.
-
Figure 1—figure supplement 1—source data 1
Excel file containing quantitative data for Figure 1—figure supplement 1.
- https://cdn.elifesciences.org/articles/97654/elife-97654-fig1-figsupp1-data1-v1.xlsx
Figure 1—figure supplement 2
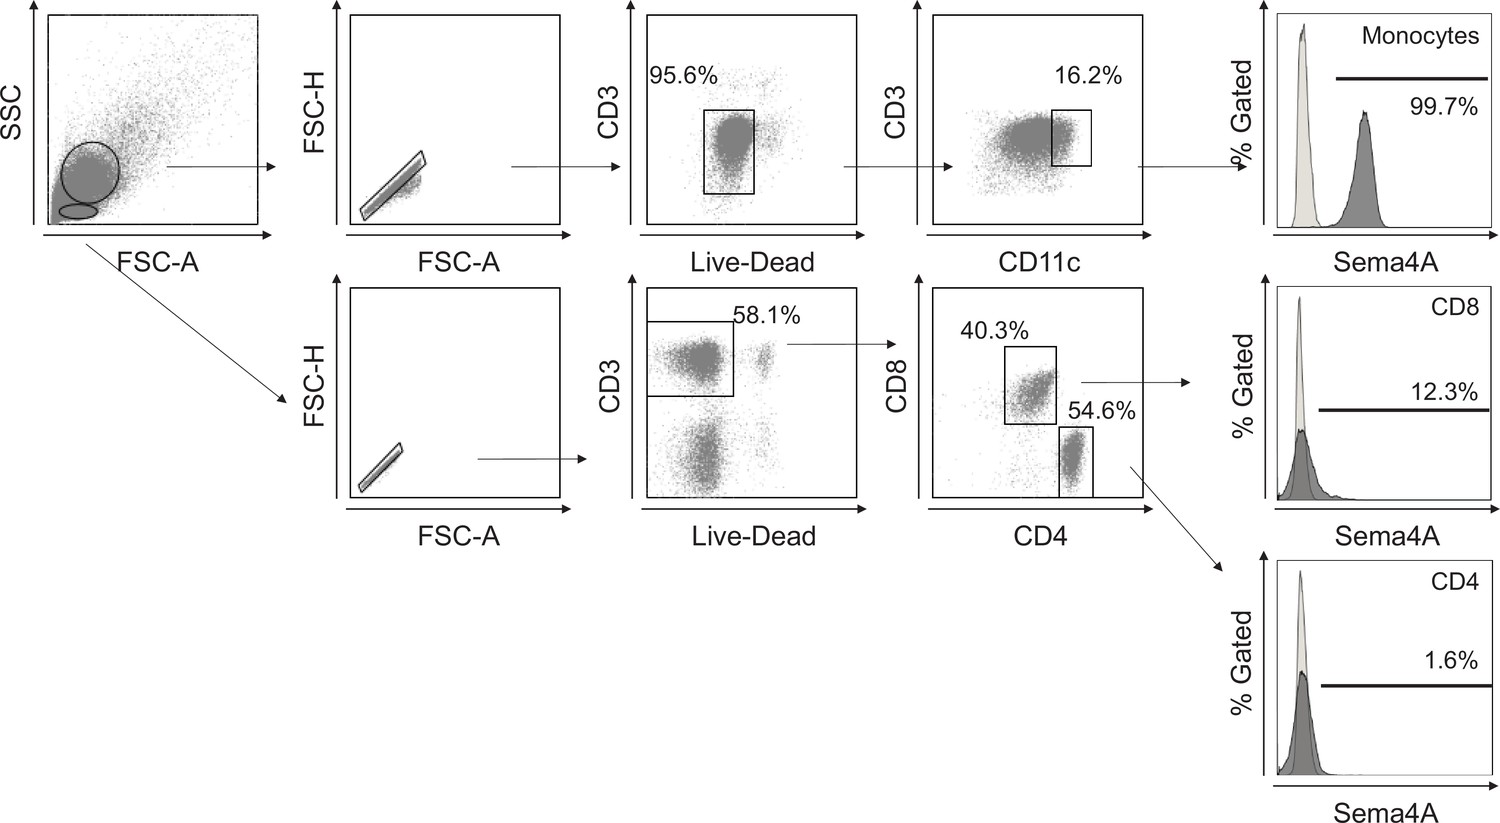
Gating strategy in flow cytometry.
Gating strategy for human Sema4A expression in blood cells. Large and small cells were distinguished using forward scatter (FCS) and side scatter (SSC) in a dot plot panel, with dead cells being excluded. Monocytes were defined within the live large cell population as CD11c positive. CD4 and CD8 T cells were identified within the live small cell population as CD3-positive CD4-positive and CD3-positive CD8-positive populations, respectively. The empty histogram represents the flow cytometry minus one control for Sema4A.
Figure 2 with 2 supplements
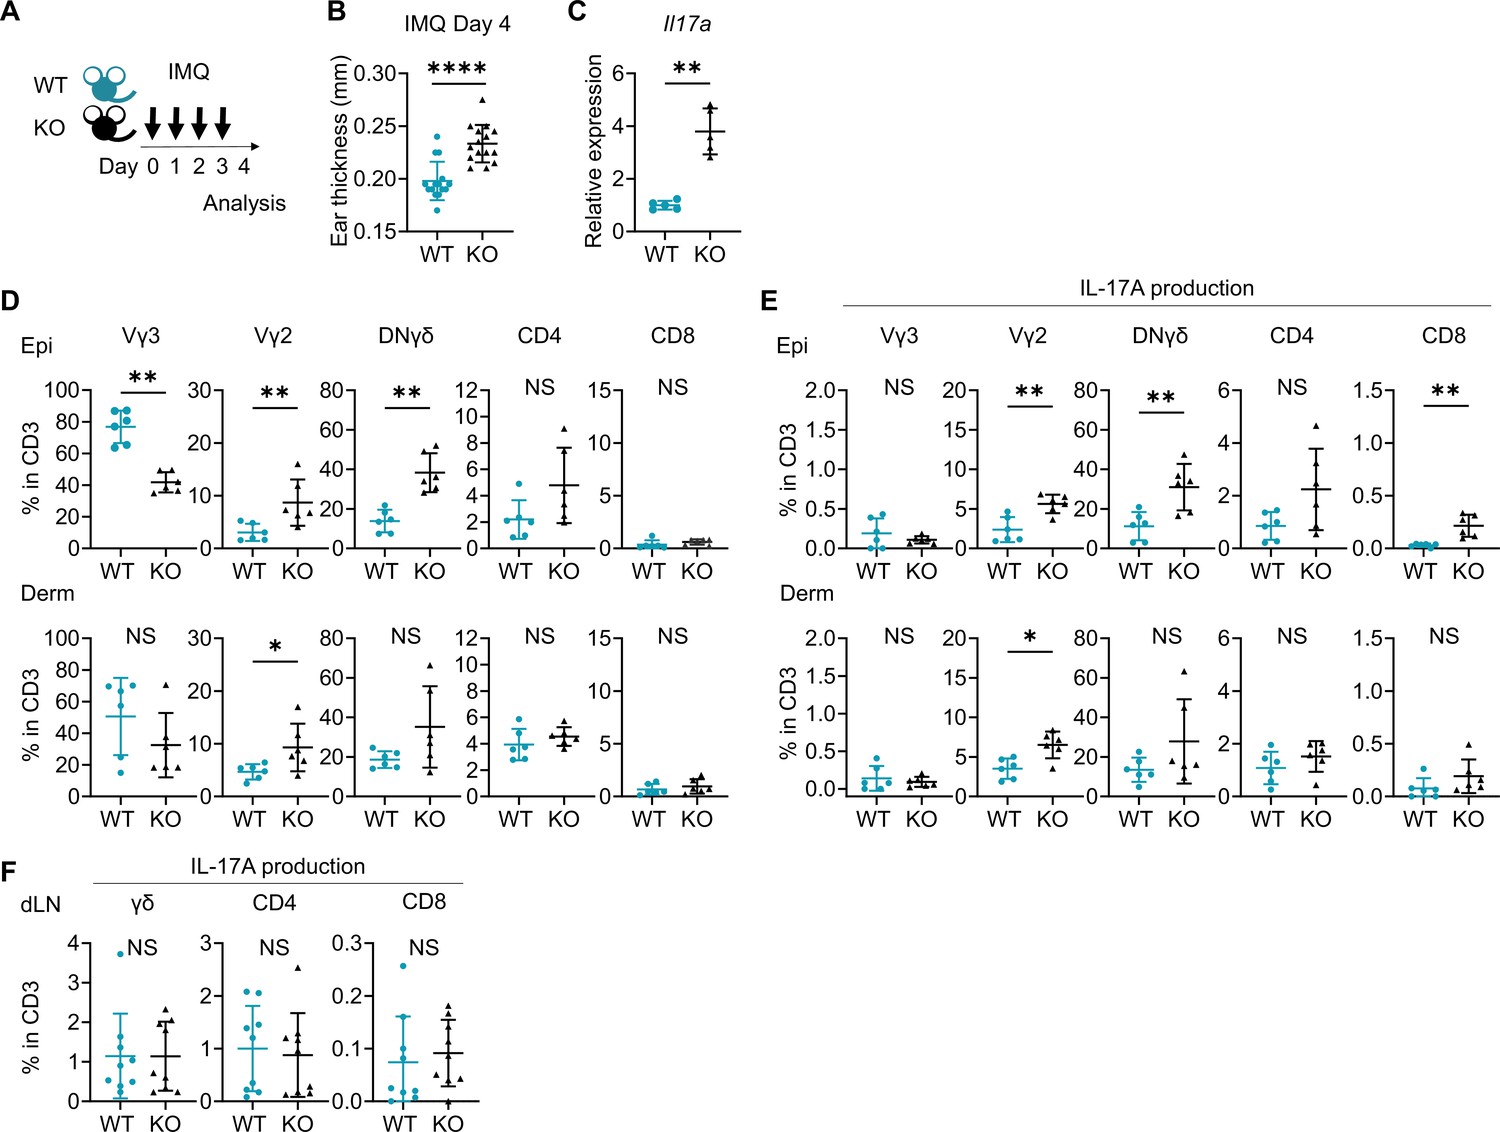
Imiquimod (IMQ)-induced psoriasis-like dermatitis is augmented in Sema4A knockout (KO) mice.
(A) Experimental scheme. Wild-type (WT, green) mice and Sema4A KO (black) mice were treated with 10 mg/ear of 5% IMQ for 4 consecutive days. Samples for flow cytometry analysis were collected on day 4. (B) Ear thickness of WT mice and KO mice on day 4 (n=15 per group). (C) Relative expression of Il17a in epidermis (n=5 per group). (D, E) The percentages of Vγ3, Vγ2, Vγ2-Vγ3-γδ (DNγδ), CD4, and CD8 T cells (D) and those with IL-17A production (E) in CD3 fraction in the Epi (top) and Derm (bottom) of WT and KO ears (n=6 per group, each dot represents the average of 4 ear specimens). (F) The percentages of IL-17A-producing γδ, CD4, and CD8 T cells in CD3 fraction in skin-draining lymph nodes (dLN) (n=9 per group). (B–F) *p<0.05, **p<0.01, ****p<0.0001. NS, not significant. The error bars represent the standard deviation.
-
Figure 2—source data 1
Excel file containing quantitative data for Figure 2.
- https://cdn.elifesciences.org/articles/97654/elife-97654-fig2-data1-v1.xlsx
Figure 2—figure supplement 1
Gating strategy in flow cytometry.
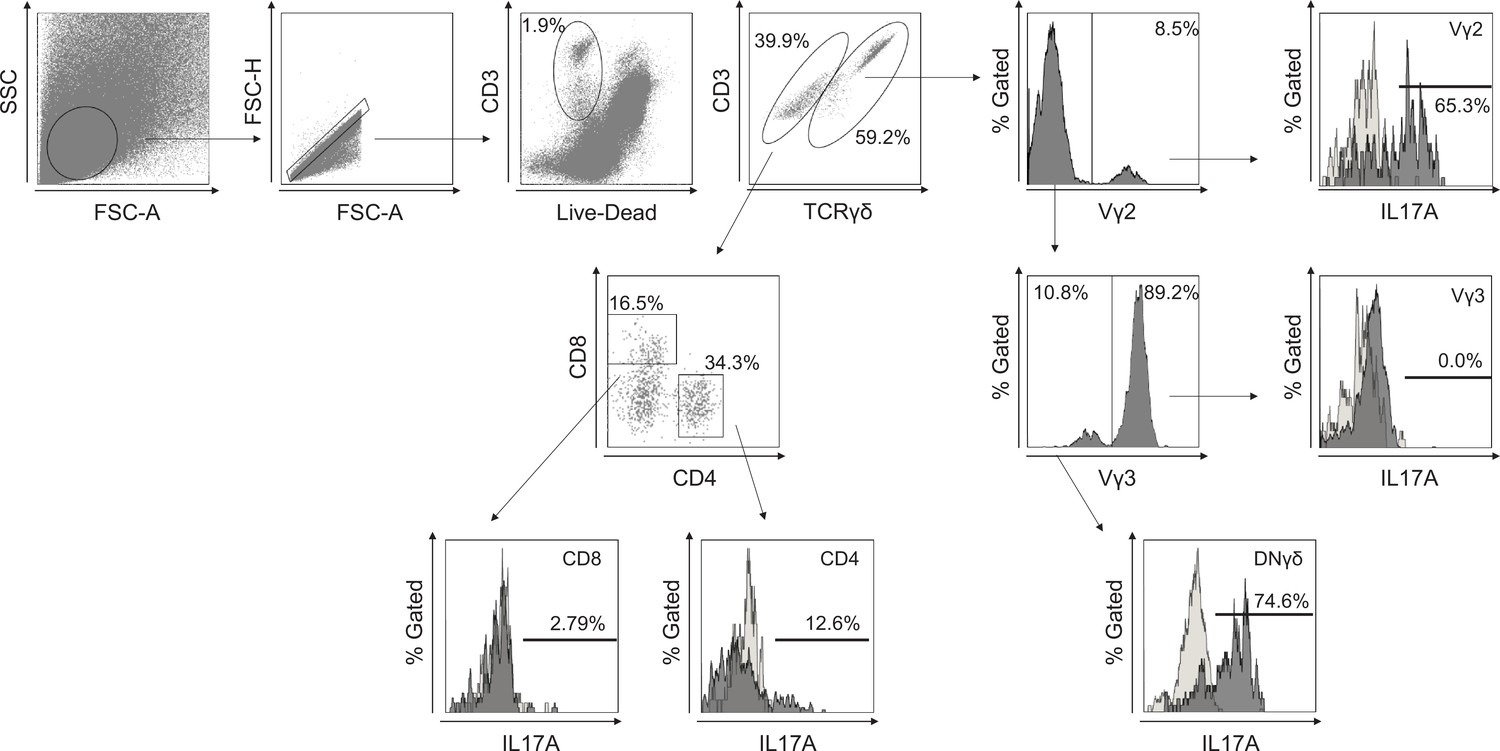
Gating strategy for murine T cells infiltrating the epidermis and dermis. After excluding dead cells, TCRγδ-positive T cells were evaluated for the expression of Vγ2. TCRγδ-positive Vγ2-negative population was further assessed the expression of Vγ3. The CD3-positive TCRγδ-negative population was evaluated for the expression of CD4 and CD8. Each population was analyzed for cytokine production. The empty histogram represents the isotype control for IL-17A.
Figure 2—figure supplement 2
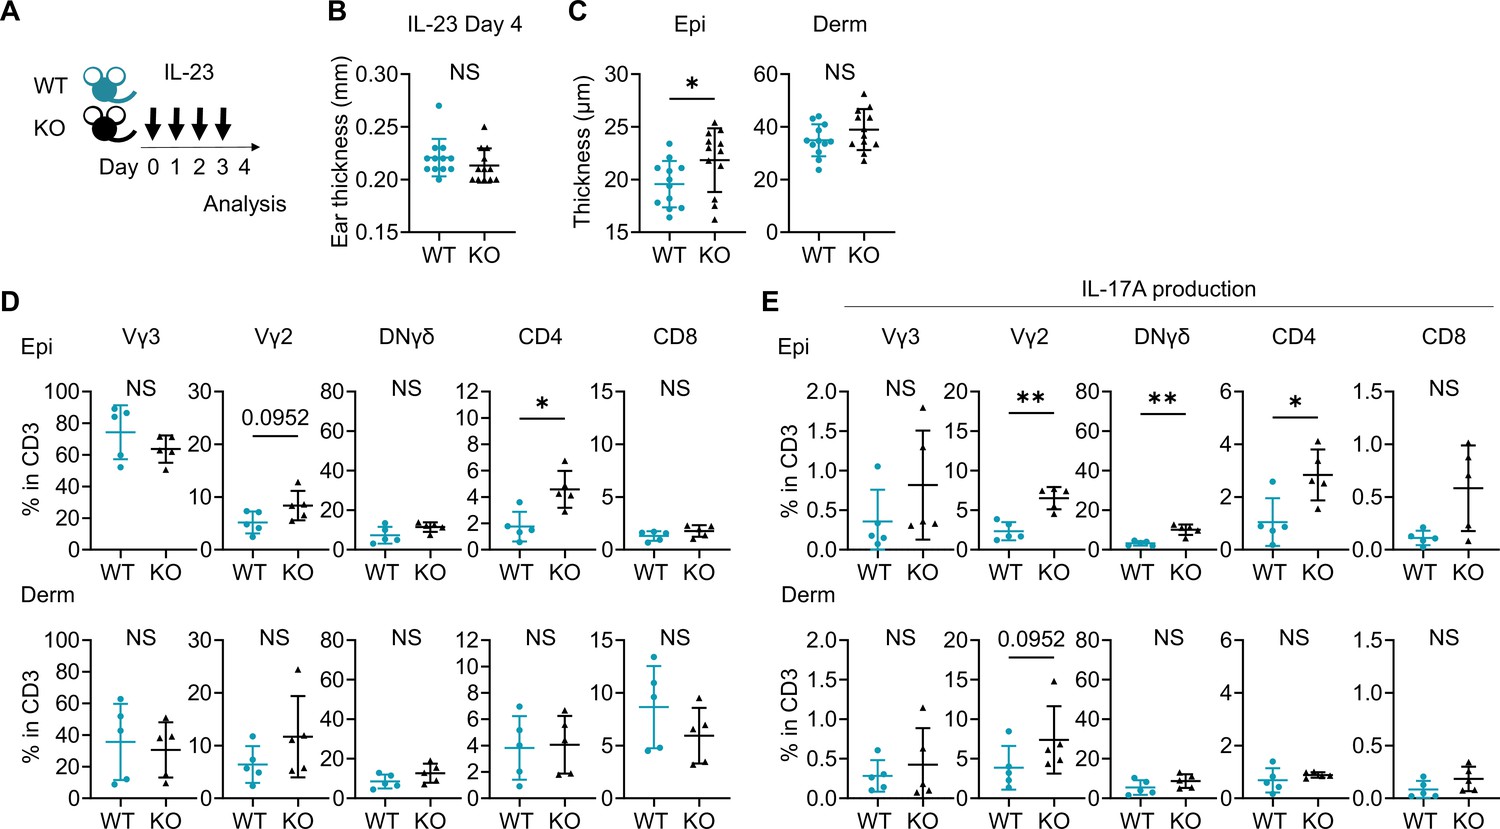
IL-23-mediated psoriasis-like dermatitis is augmented in Sema4A knockout (KO) mice.
(A) An experimental scheme involved intradermally injecting 20 μL of phosphate-buffered saline containing 500 ng of recombinant mouse IL-23 into both ears of wild-type (WT) mice and KO mice for 4 consecutive days. Samples for following analysis were collected on day 4. (B, C) Ear thickness (B) and Epi and Derm thickness (C) of WT mice and KO mice on day 4 (n=12 per group). (D, E) The percentages of Vγ3, Vγ2, DNγδ, CD4, and CD8 T cells (D) and those with IL-17A production (E) in CD3 fraction in the Epi (top) and Derm (bottom) of WT and KO ears (n=5 per group). Each dot represents the average of 4 ear specimens. (B–E) *p<0.05, **p<0.01. NS, not significant. The error bars represent the standard deviation.
-
Figure 2—figure supplement 2—source data 1
Excel file containing quantitative data for Figure 2—figure supplement 2.
- https://cdn.elifesciences.org/articles/97654/elife-97654-fig2-figsupp2-data1-v1.xlsx
Figure 3 with 1 supplement
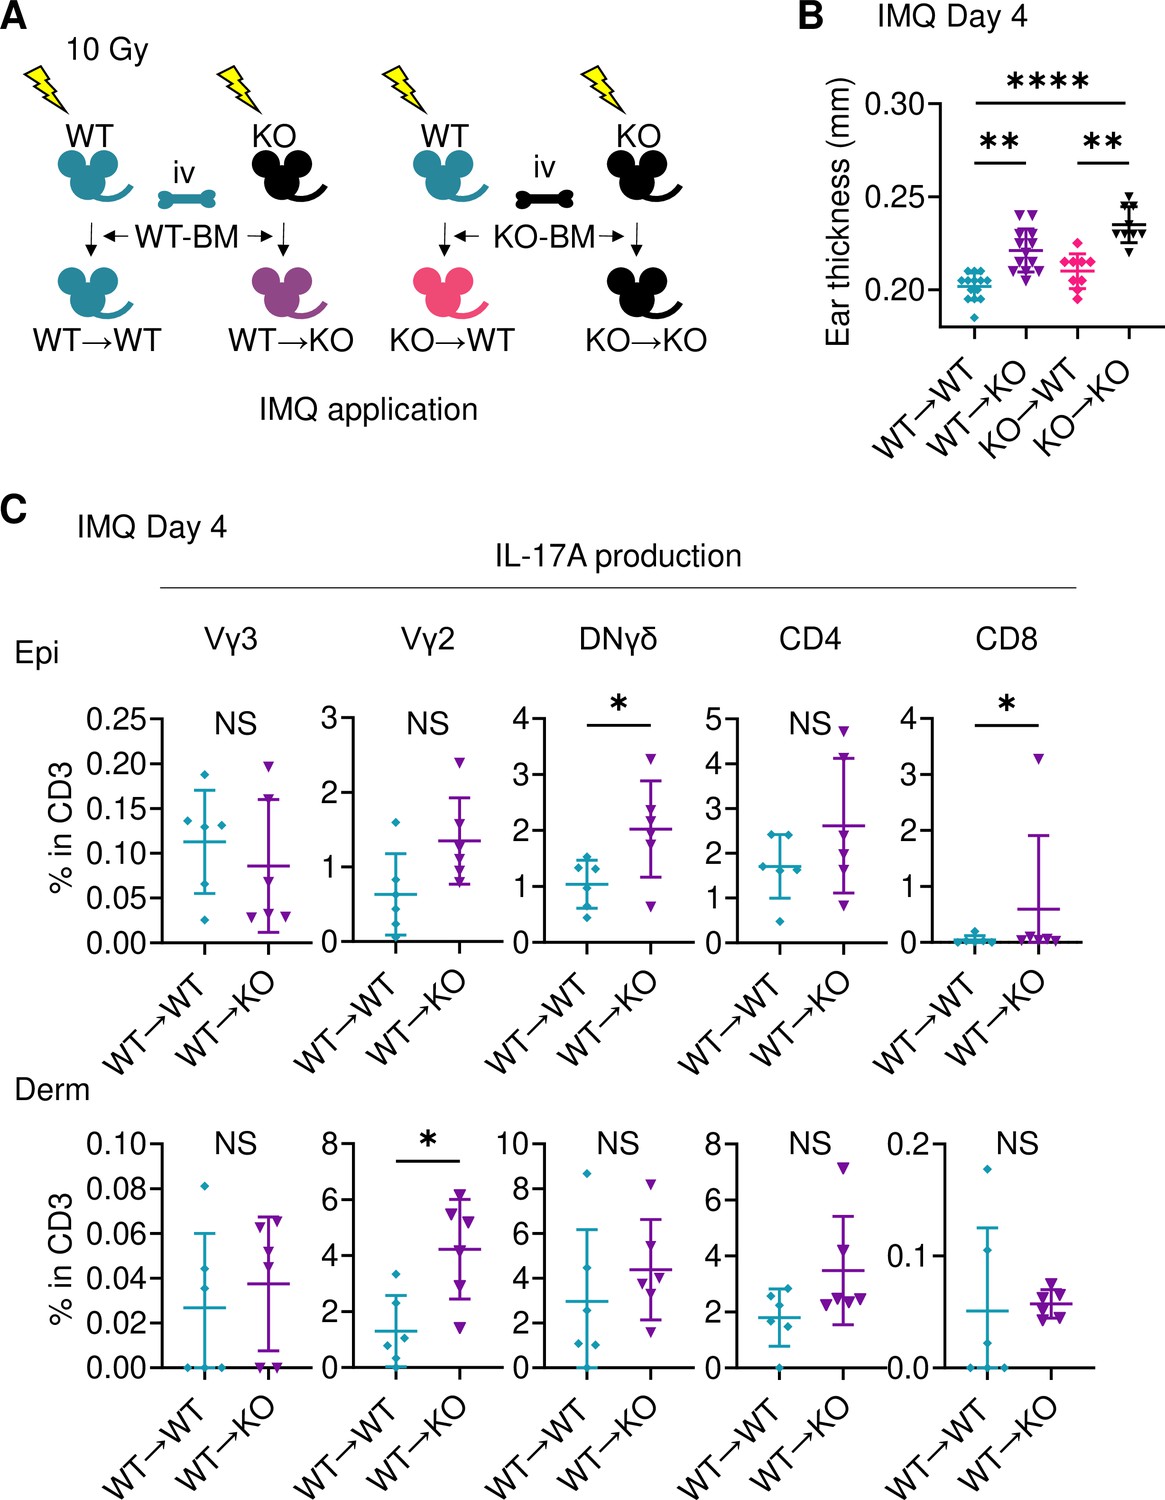
Sema4A in keratinocytes may play a role in preventing murine psoriasis-like dermatitis.
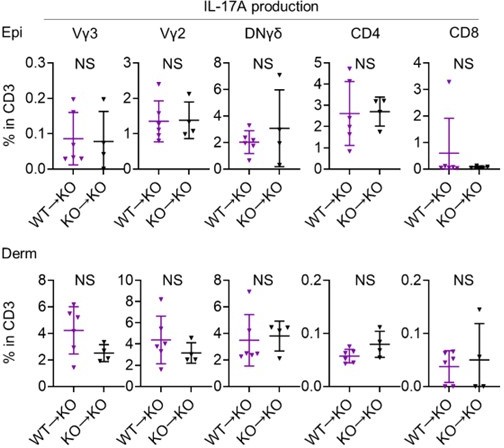
(A) Experimental scheme for establishing BM chimeric mice. (B) Imiquimod (IMQ) day 4 ear thickness in the mice with the indicated genotypes (n=14 for WT→WT, n=13 for WT→KO, n=9 for KO→WT, n=9 for KO→KO). (C) The percentages of IL-17A-producing Vγ3, Vγ2, DNγδ, CD4, and CD8 T cells in CD3 fraction from IMQ day 4 Epi (top) and Derm (bottom) of the ears from WT→ WT mice and WT→ KO mice (n=6 per group). Each dot represents the average of 4 ear specimens. (B, C) *p<0.05, **p<0.01, ****p<0.0001. NS, not significant. The error bars represent the standard deviation.
-
Figure 3—source data 1
Excel file containing quantitative data for Figure 3.
- https://cdn.elifesciences.org/articles/97654/elife-97654-fig3-data1-v1.xlsx
Figure 3—figure supplement 1
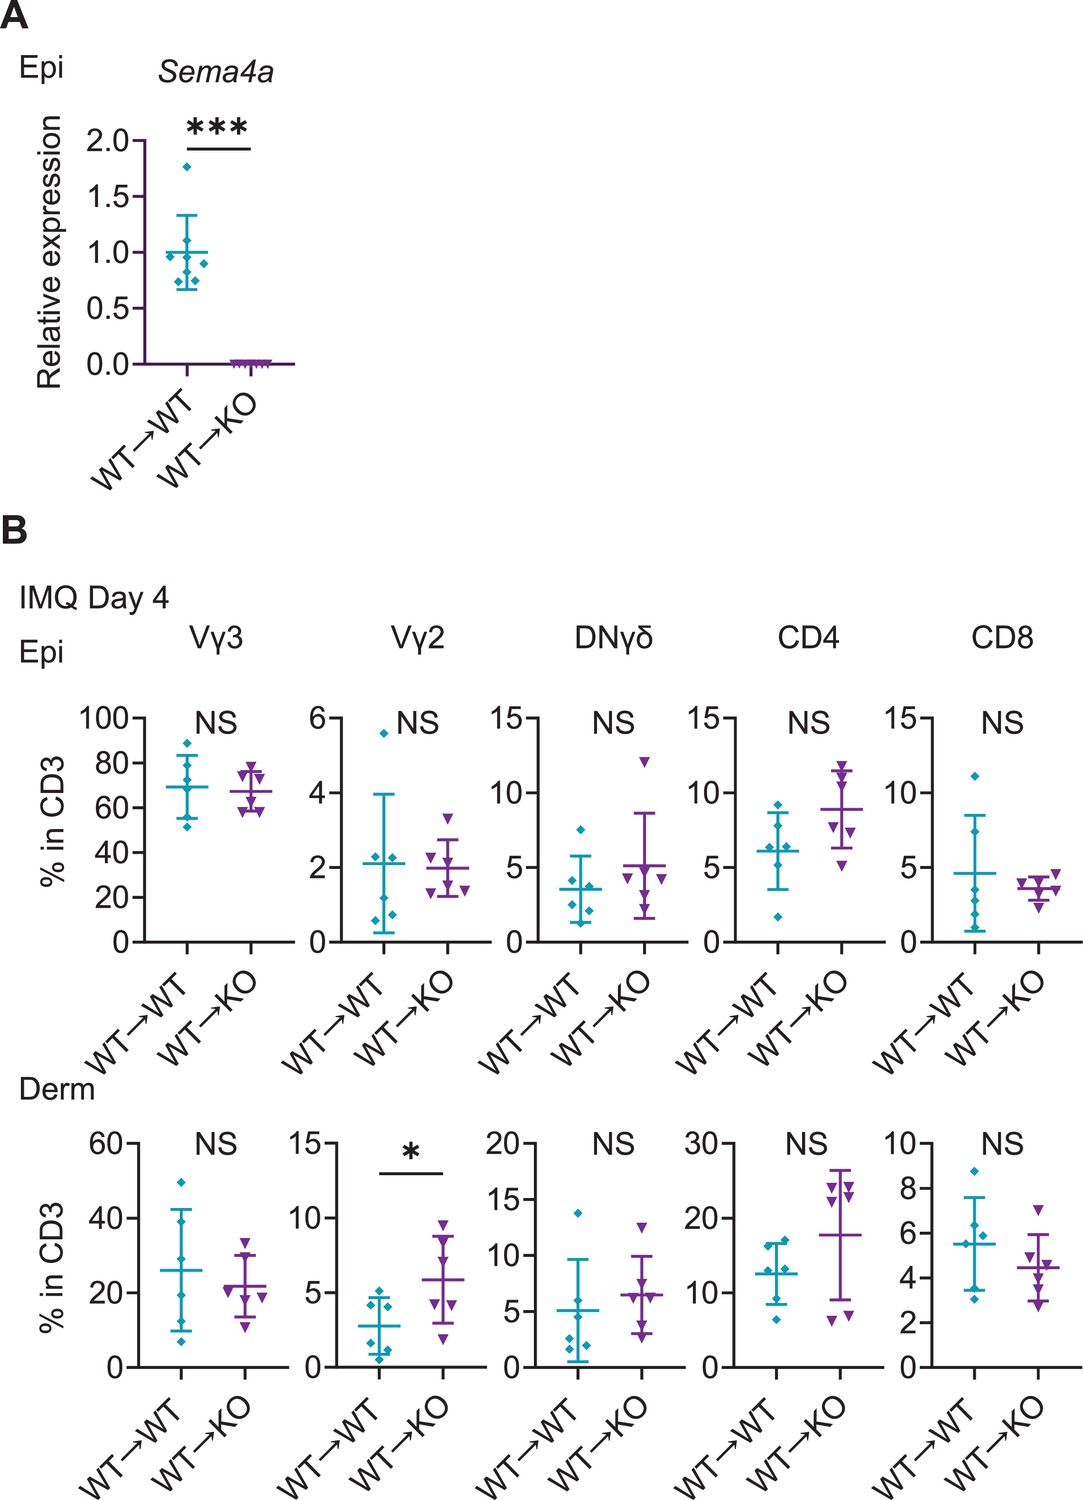
T cells’ fractions infiltrating in the chimeric mice ear.
(A) Sema4a expression in the Epi of WT→ WT mice and WT→ KO mice (n=8 for WT→ WT, n=7 for WT→ KO). (B) The percentages of Vγ3, Vγ2, DNγδ, CD4, and CD8 T cells in CD3 fraction from imiquimod (IMQ) day 4 Epi (top) and Derm (bottom) of the ears from WT→ WT mice and WT→ KO mice (n=6 per group). Each dot represents the average of 4 ear specimens. (A, B) *p<0.05, ***p<0.001. NS, not significant. The error bars represent the standard deviation.
-
Figure 3—figure supplement 1—source data 1
Excel file containing quantitative data for Figure 3—figure supplement 1.
- https://cdn.elifesciences.org/articles/97654/elife-97654-fig3-figsupp1-data1-v1.xlsx
Figure 4 with 3 supplements
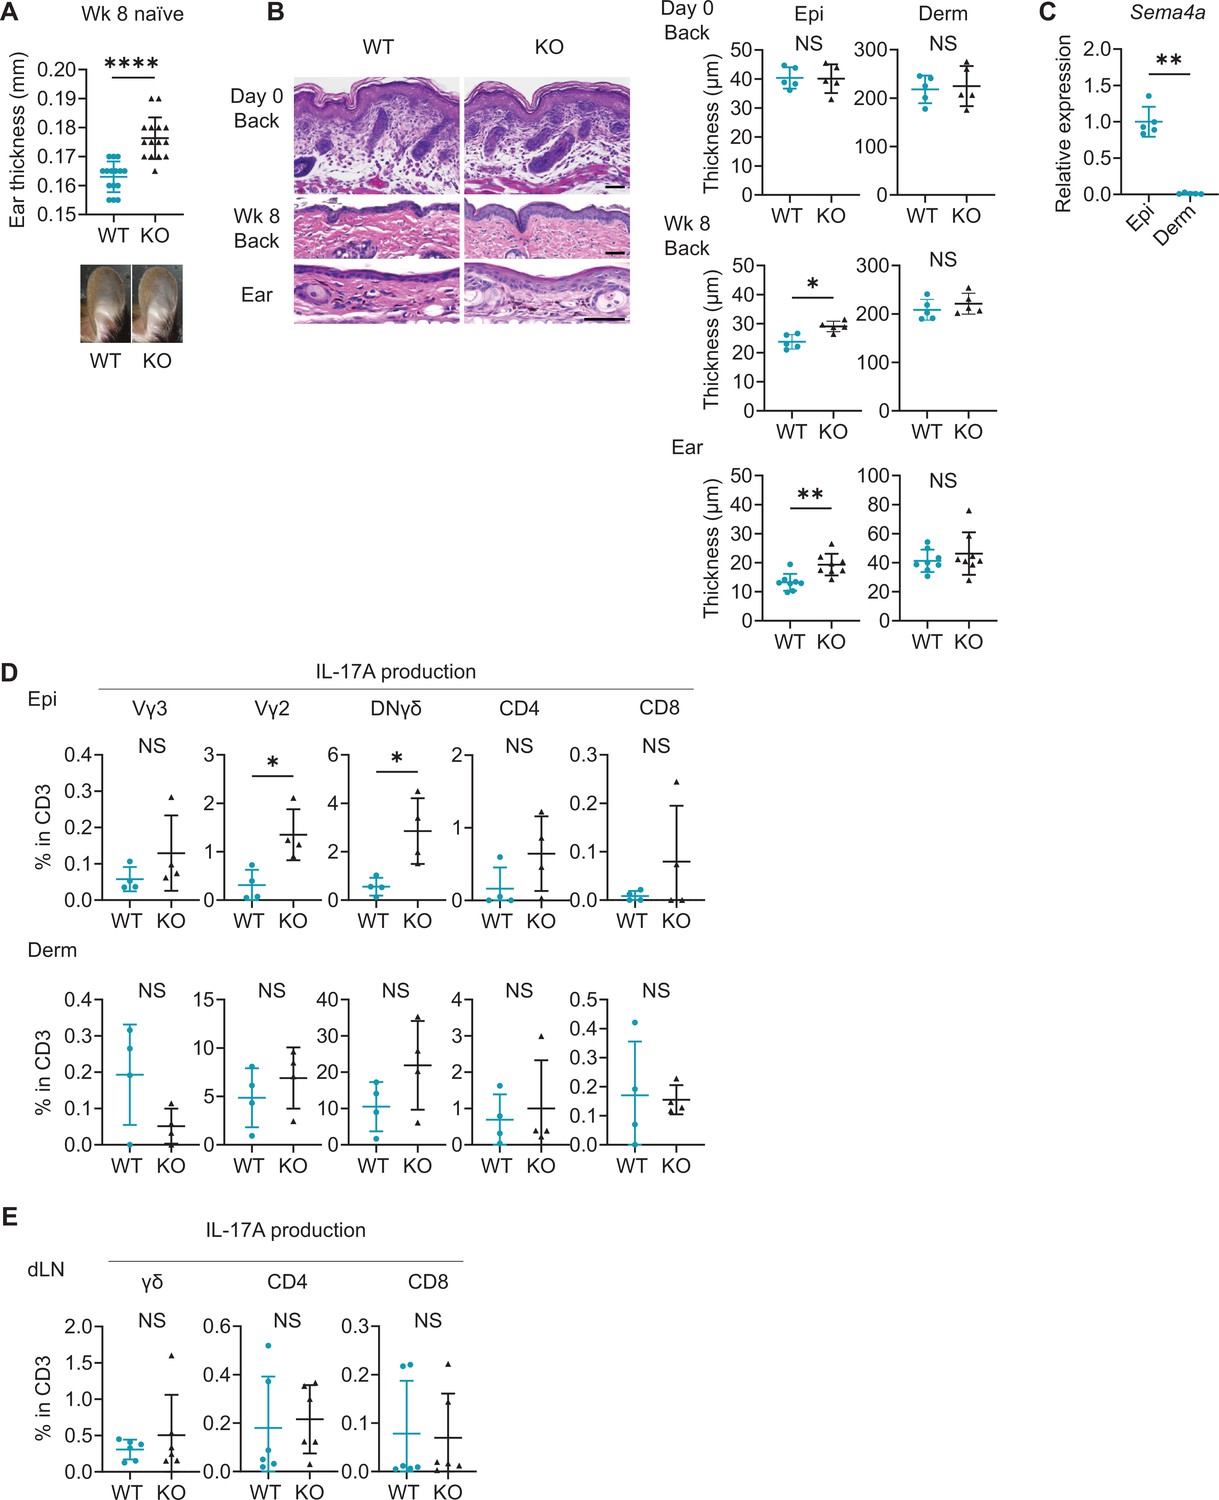
Naïve Sema4A knockout (KO) epidermis is thicker than wild-type (WT) epidermis with increased γδ T17 infiltration.
(A) Ear thickness of WT mice and KO mice at week (Wk) 8 (n=15 per group) and representative images. (B) Left: representative hematoxylin and eosin staining of day 0 back and Wk 8 back and ear. Scale bar = 50 μm. Right: Epi and Derm thickness in day 0 back (n=5) and Wk 8 back (n=5) and ear (n=8). (C) Relative Sema4a expression in WT Epi and Derm (n=5 per group). (D) The percentages of the IL-17A-producing Vγ3, Vγ2, DNγδ, CD4, and CD8 T cells in CD3 fraction (n=4 per group) in Epi (top) and Derm (bottom). Each dot represents the average of 4 ear specimens. (E) The graphs showing the percentages of IL-17A-producing γδ, CD4, and CD8 T cells in CD3 fraction from draining LN (dLN) of WT mice and Sema4A KO mice (n=6 per group). (A–E) *p<0.05, **p<0.01, ****p<0.0001. NS, not significant. The error bars represent the standard deviation.
-
Figure 4—source data 1
Excel file containing quantitative data for Figure 4.
- https://cdn.elifesciences.org/articles/97654/elife-97654-fig4-data1-v1.xlsx
Figure 4—figure supplement 1
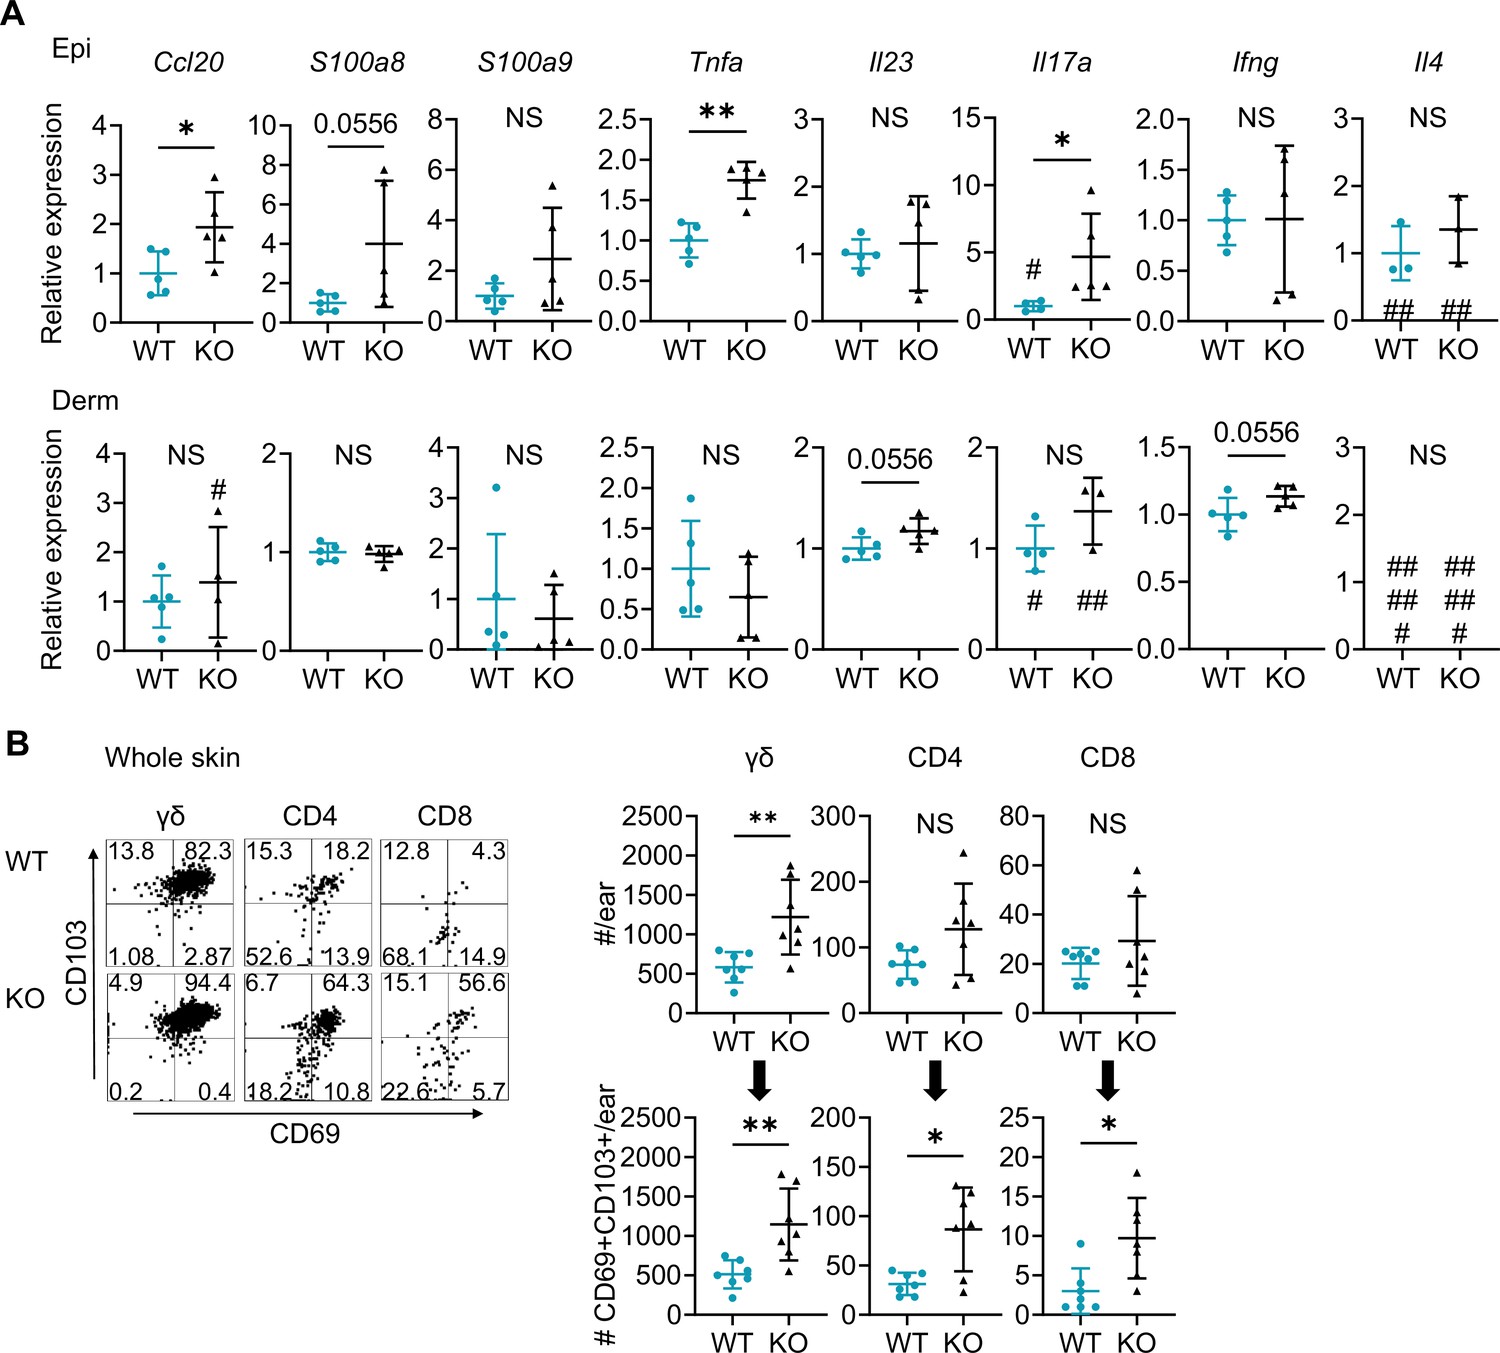
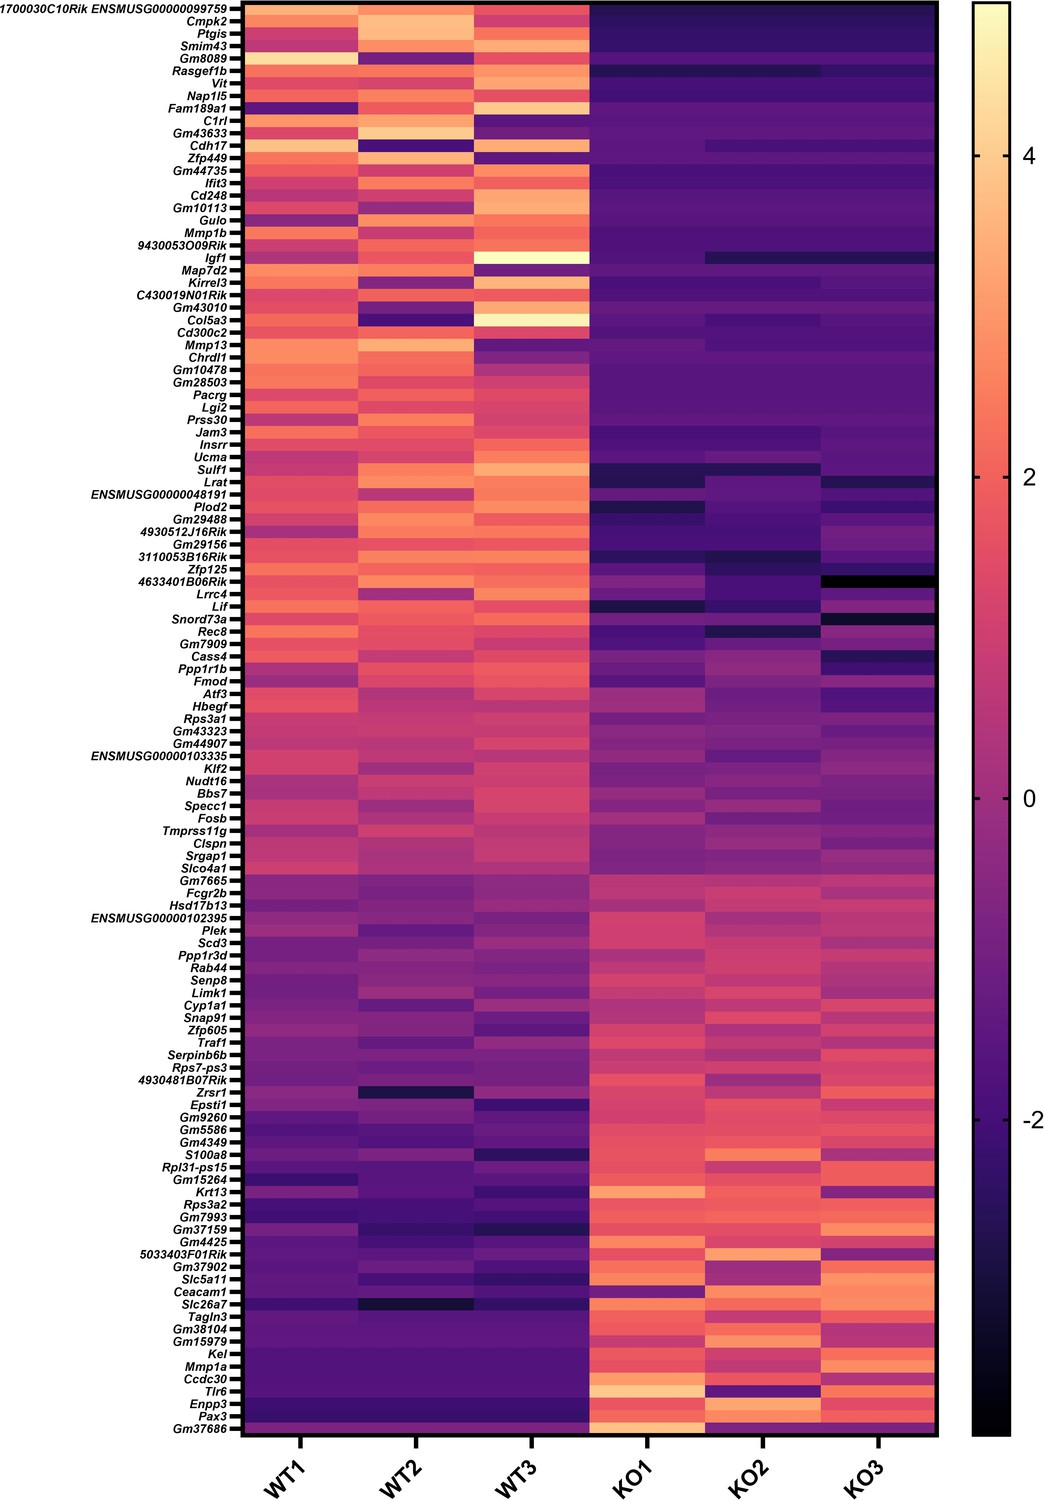
Naive Sema4A knockout (KO) skin shows upregulation of psoriasis-related genes and an increase in resident memory T cells.
(A) Relative expression of psoriasis-associated genes in Epi (top) and Derm (bottom) of wild-type (WT) mice and KO mice (n=5 per group, #: not detected). (B) Representative dot plots showing CD69 and CD103 expression in the indicated T cell fractions from whole skin. The graphs show T cell counts per ear (top) and those with resident memory phenotype (bottom) (n=7 per group). Each dot represents the average of 4 ear specimens. (A, B) *p<0.05, **p<0.01. NS, not significant. The error bars represent the standard deviation.
-
Figure 4—figure supplement 1—source data 1
Excel file containing quantitative data for Figure 1—figure supplement 1.
- https://cdn.elifesciences.org/articles/97654/elife-97654-fig4-figsupp1-data1-v1.xlsx
Figure 4—figure supplement 2
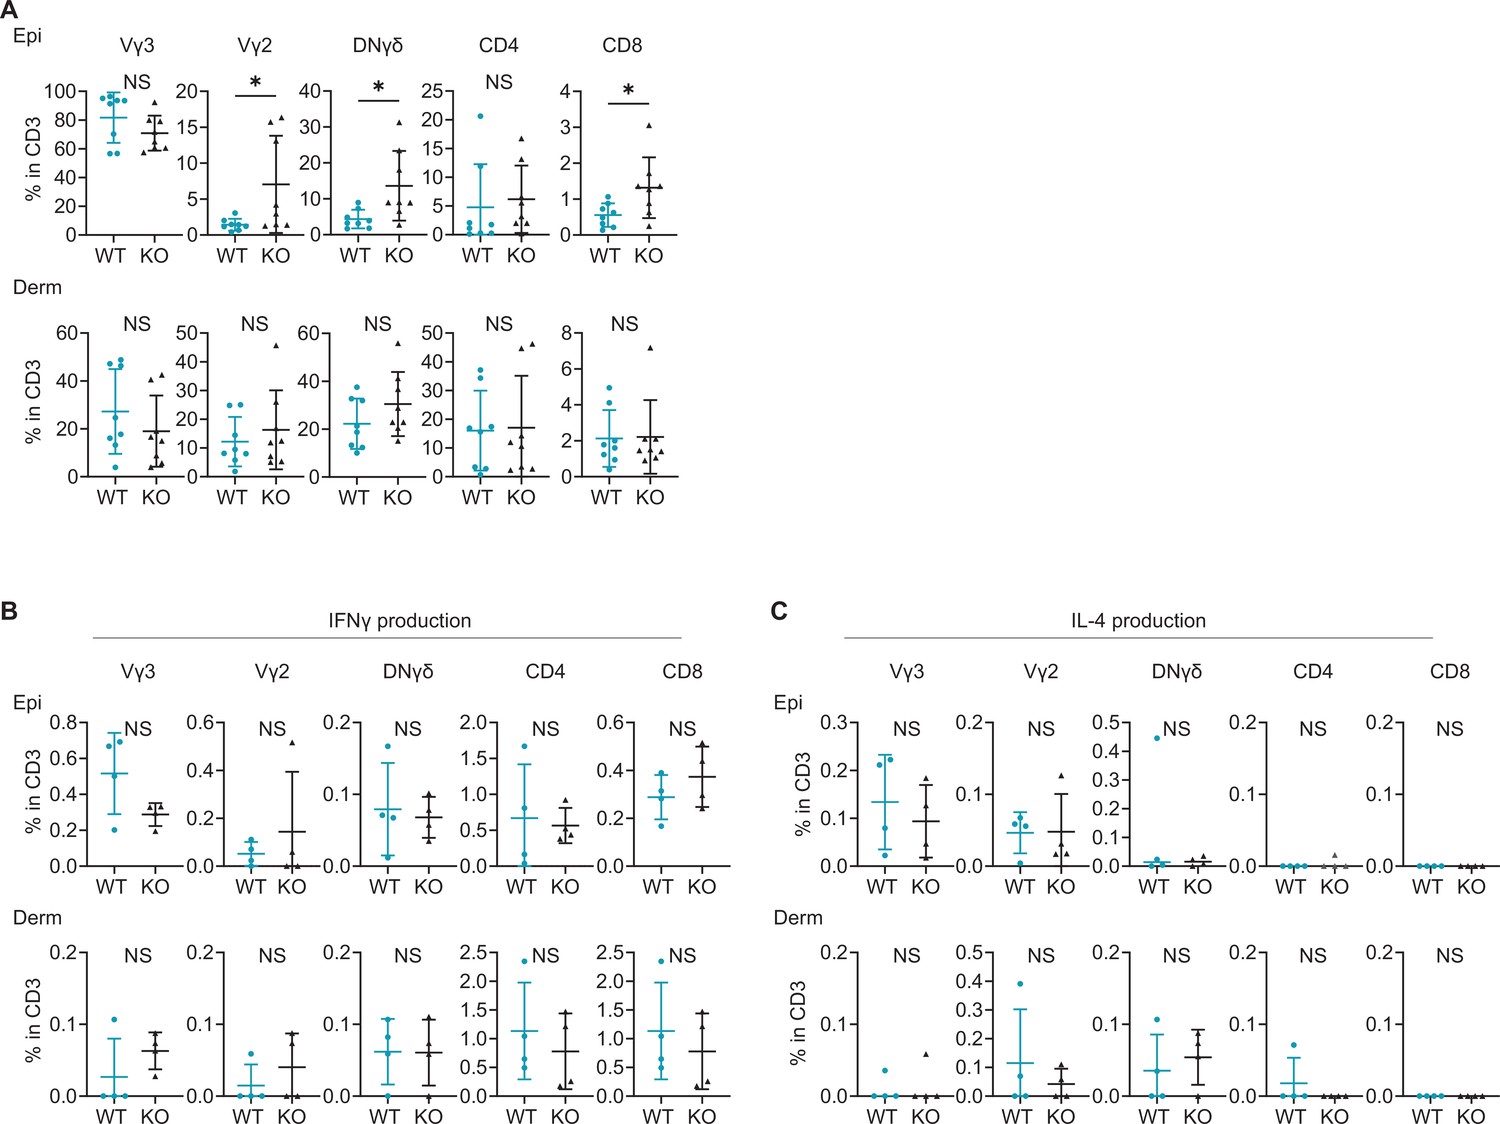
Expression of IFNγ and IL-4 is comparable between naive wild-type (WT) and Sema4A knockout (KO) skin.
(A) The percentages of Vγ3, Vγ2, DNγδ, CD4, and CD8 T cells in CD3 fraction from naive WT and KO mice. (B, C) The graphs presenting the percentages of IFNγ (B) and IL-4 (C) -producing Vγ2, DNγδ, CD4, and CD8 T cells in CD3 fraction in the Epi (top) and Derm (bottom) of naive WT mice and KO mice (n=4 per group). (A–C) Each dot represents the average of 4 ear specimens. *p<0.05. NS, not significant. The error bars represent the standard deviation.
-
Figure 4—figure supplement 2—source data 1
Excel file containing quantitative data for Figure 4—figure supplement 2.
- https://cdn.elifesciences.org/articles/97654/elife-97654-fig4-figsupp2-data1-v1.xlsx
Figure 4—figure supplement 3
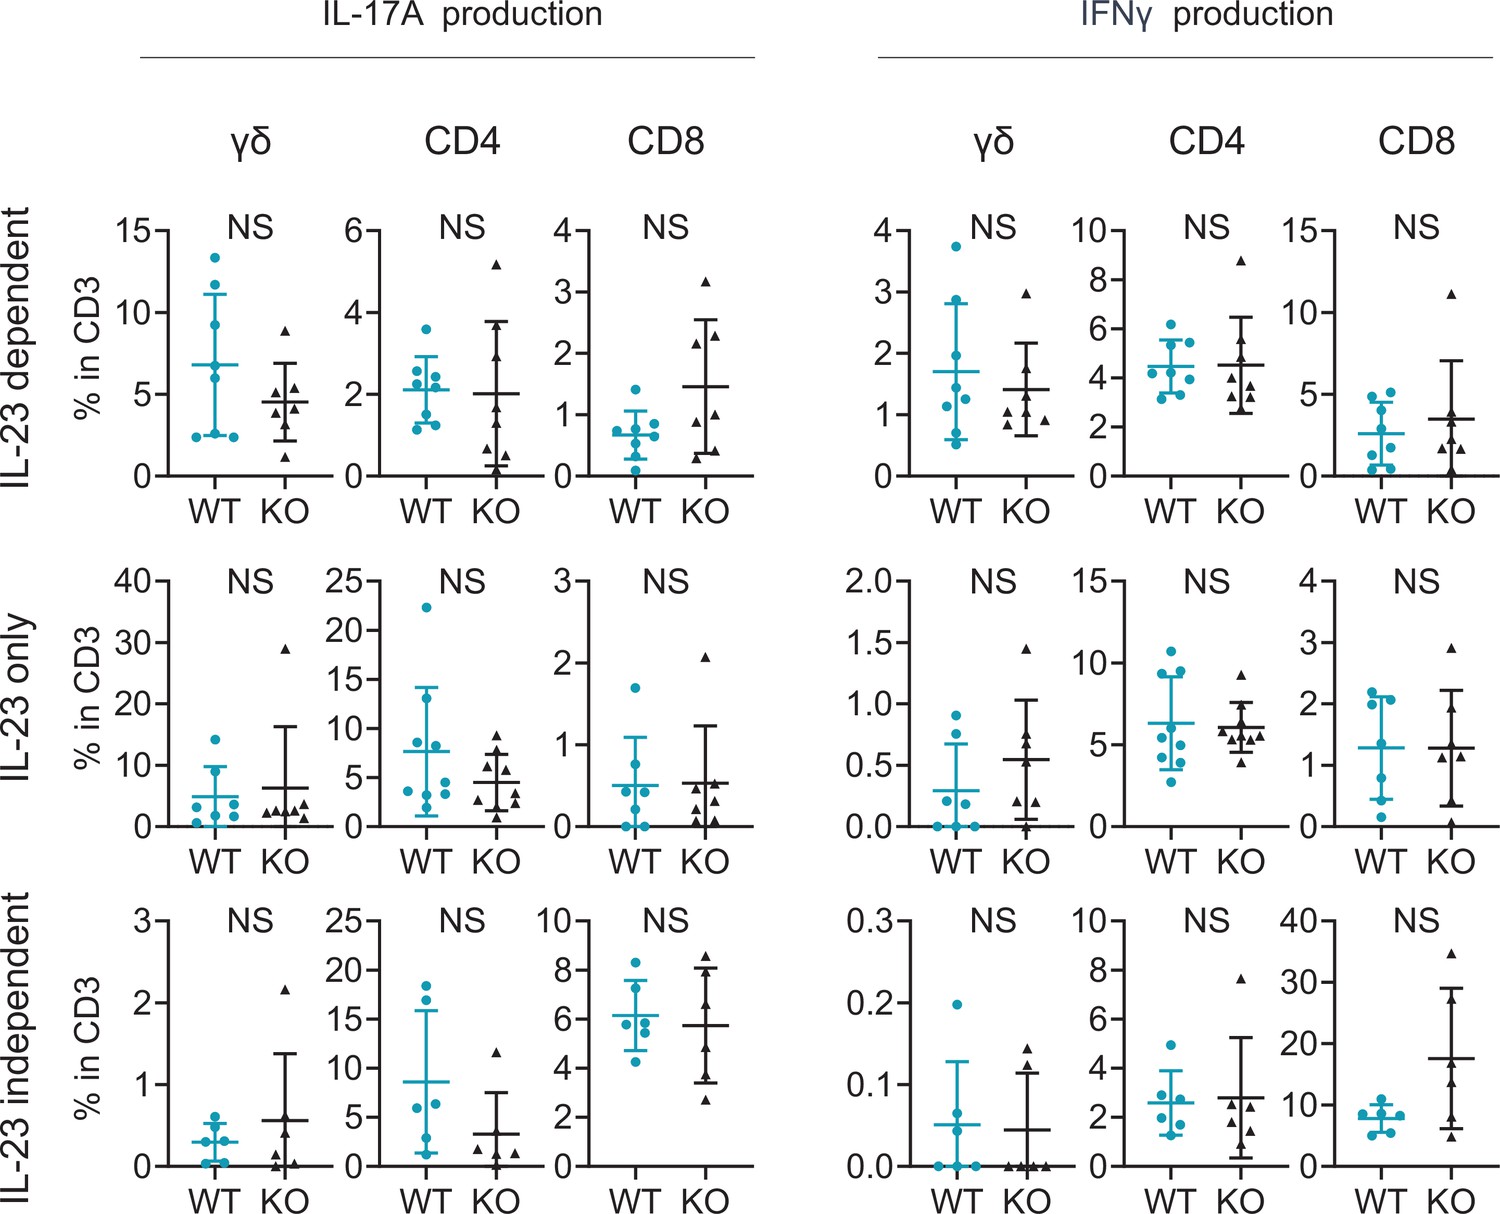
Comparable T17 differentiation potential under Th17-skewing conditions between wild-type (WT) mice and Sema4A knockout (KO) mice.
Splenic T cells were cultured for 2 weeks, followed by flow cytometry analysis. The accumulated data display the percentages of IL-17A-producing (right) and IFNγ-producing (left) γδ, CD4, and CD8 T cells within CD3 fraction under various conditions: IL-23-dependent Th17-skewing condition (top), IL-23 only Th17-skewing condition (middle), and IL-23-independent Th17-skewing condition (bottom). NS, not significant. The error bars represent the standard deviation.
-
Figure 4—figure supplement 3—source data 1
Excel file containing quantitative data for Figure 4—figure supplement 3.
- https://cdn.elifesciences.org/articles/97654/elife-97654-fig4-figsupp3-data1-v1.xlsx
Figure 5 with 2 supplements
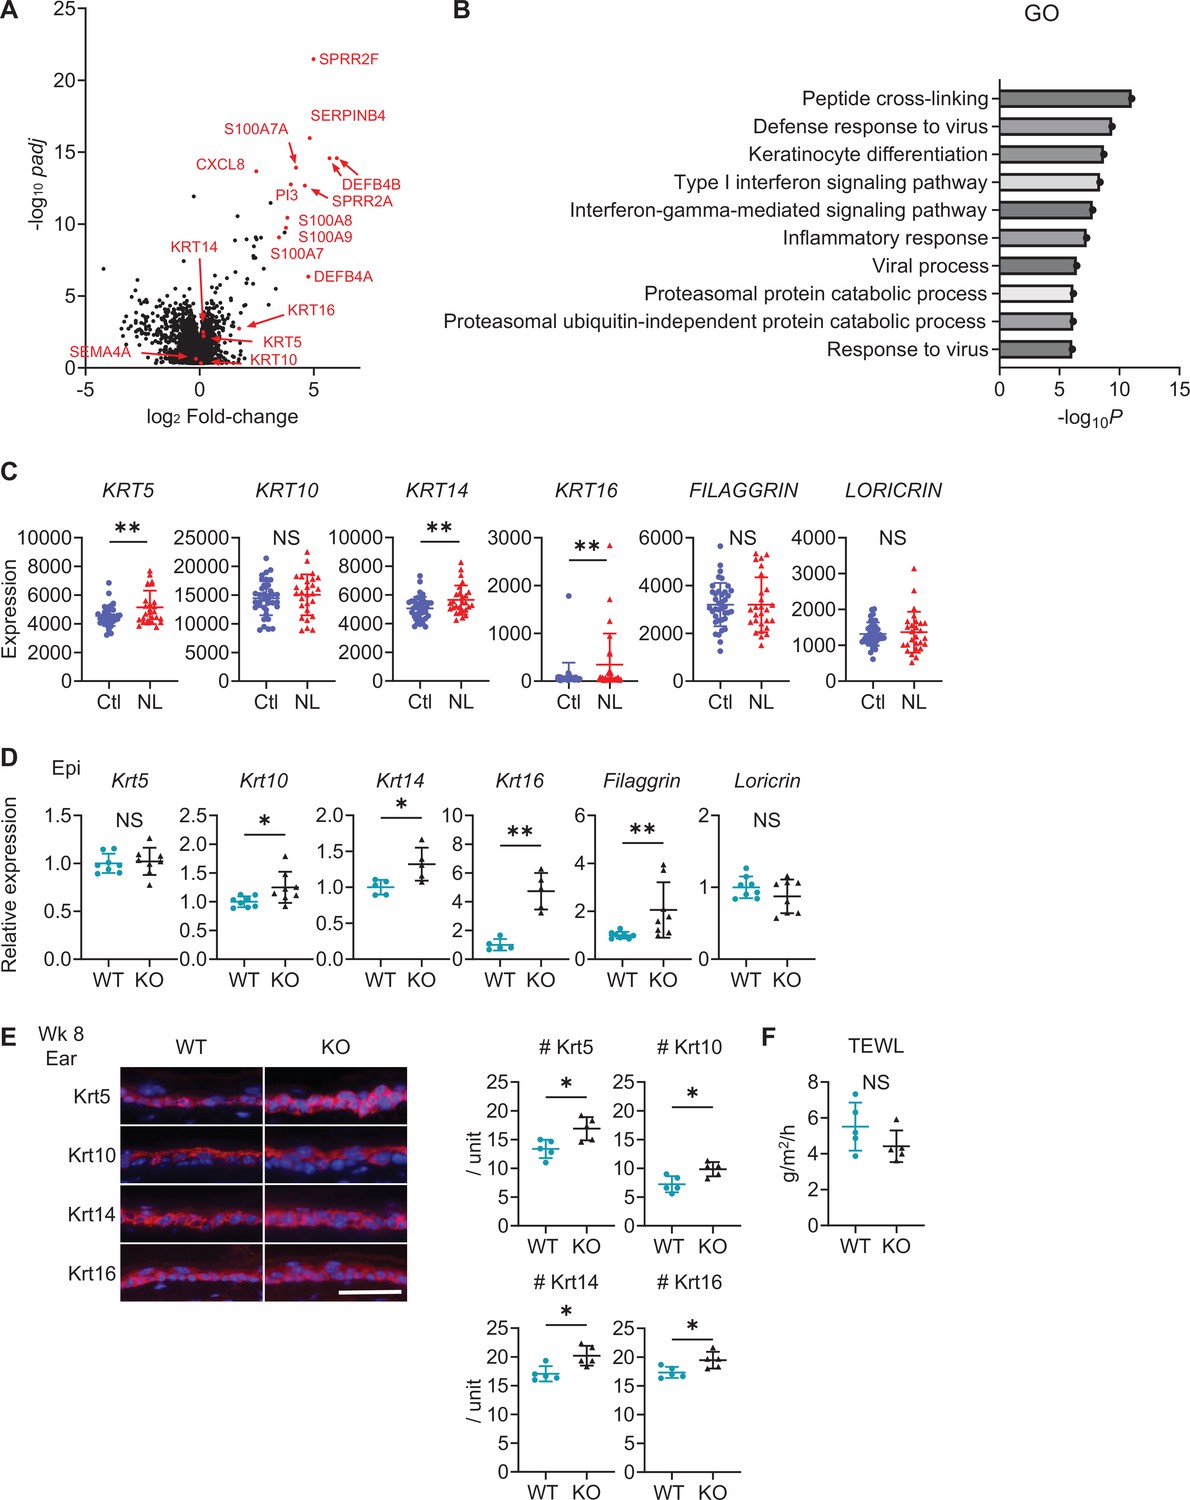
Sema4A knockout (KO) skin shares the features of human psoriatic non-lesions (NL).
(A, B) The volcano plot (A) and Gene Ontology (GO) analysis (B), generated from RNA-sequencing data (GSE121212) using RaNAseq, display changes in gene expression in psoriatic NL compared to Ctl. (C) The difference in the expression of epidermal differentiation markers between Ctl and NL (n=38 for Ctl, n=27 for NL) was calculated with the transcripts per million values. **padj<0.01. NS, not significant. The error bars represent the standard deviation. (D) Relative gene expression of epidermal differentiation markers between wk 8 Epi of wild-type (WT) mice and KO mice (n=5 for Krt14 and Krt16, n=8 for Krt5, Krt10, Filaggrin, and Loricrin). (E) Left: Representative immunofluorescence pictures of Krt5, Krt10, Krt14, and Krt16 (red) overlapped with DAPI. Scale bar = 50 μm. Right: Accumulated graphs showing the numbers of Krt5, Krt10, Krt14, and Krt16 positive cells per 100 μm width (n=5 per group) of wk 8 ear (right). Each dot represents the average from 5 unit areas per sample. (F) Transepidermal water loss (TEWL) in back skin of WT mice and KO mice at wk 8 (n=5 per group). (D–F) *p<0.05, **p<0.01. NS, not significant. The error bars represent the standard deviation.
-
Figure 5—source data 1
Excel file containing quantitative data for Figure 5.
- https://cdn.elifesciences.org/articles/97654/elife-97654-fig5-data1-v1.xlsx
Figure 5—figure supplement 1
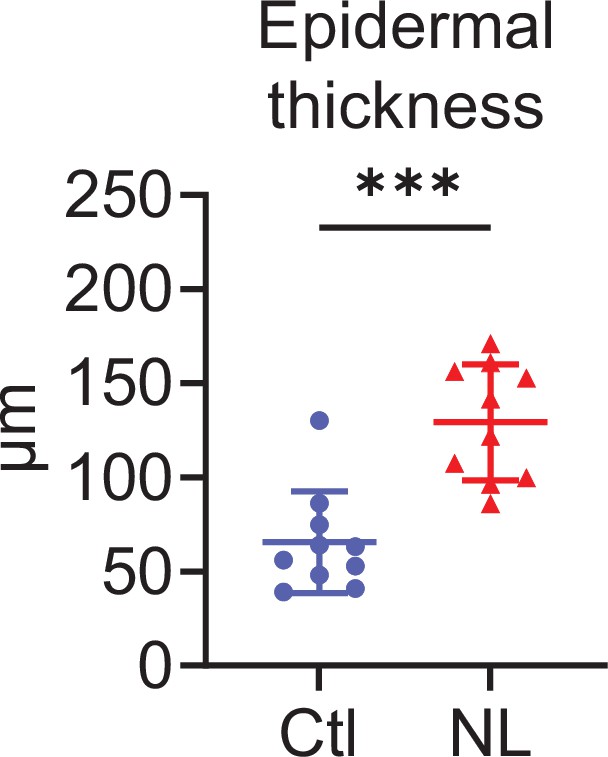
The epidermis of psoriatic non-lesion is thicker than that of control skin.
Epidermal thickness of Ctl and psoriatic non-lesions (NL) (n=10 per group). ***p<0.001. The error bars represent the standard deviation.
-
Figure 5—figure supplement 1—source data 1
Excel file containing quantitative data for Figure 5—figure supplement 1.
- https://cdn.elifesciences.org/articles/97654/elife-97654-fig5-figsupp1-data1-v1.xlsx
Figure 5—figure supplement 2
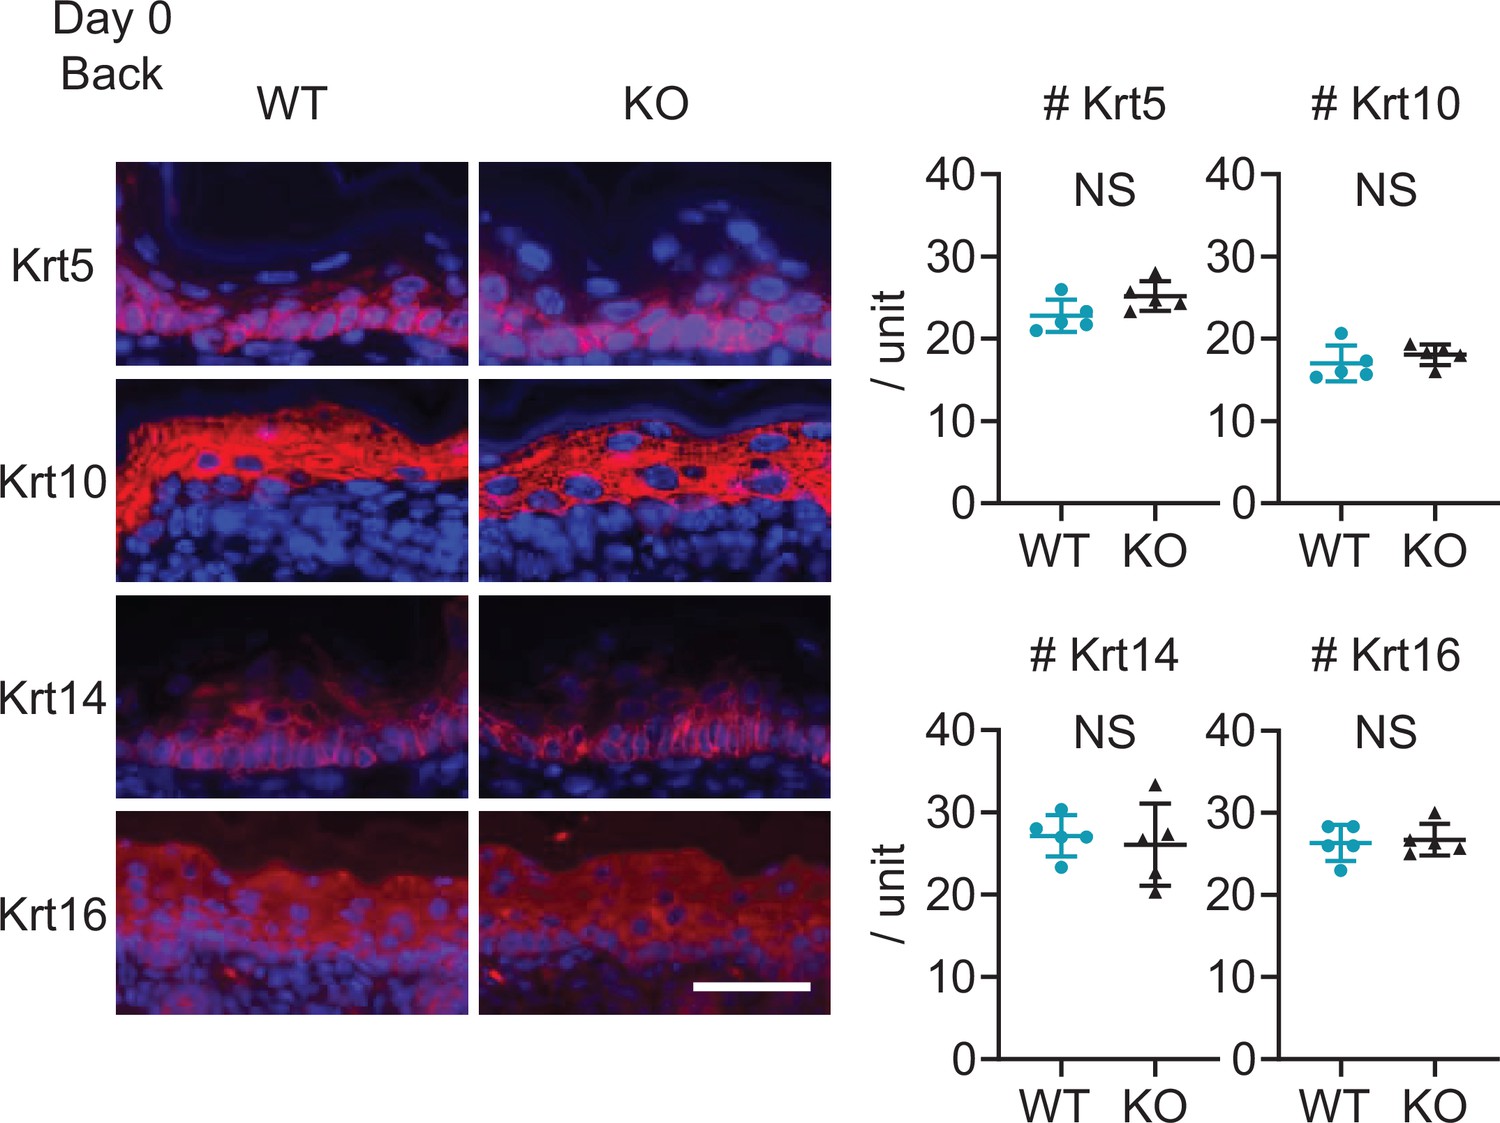
Upregulation of cytokeratin expression related to psoriasis is not detected at birth in Sema4A knockout (KO) mice.
Representative immunofluorescence pictures of Krt5, Krt10, Krt14, and Krt16 (red) overlapped with DAPI, and the accumulated graphs showing the numbers of Krt5, Krt10, Krt14, and Krt16 positive cells per 100 μm width (n=5 per group) in the epidermis of day 0 back. Scale bar = 50 μm. Each dot represents the average from 5 unit areas per sample. NS, not significant. The error bars represent the standard deviation.
-
Figure 5—figure supplement 2—source data 1
Excel file containing quantitative data for Figure 5—figure supplement 2.
- https://cdn.elifesciences.org/articles/97654/elife-97654-fig5-figsupp2-data1-v1.xlsx
Figure 6
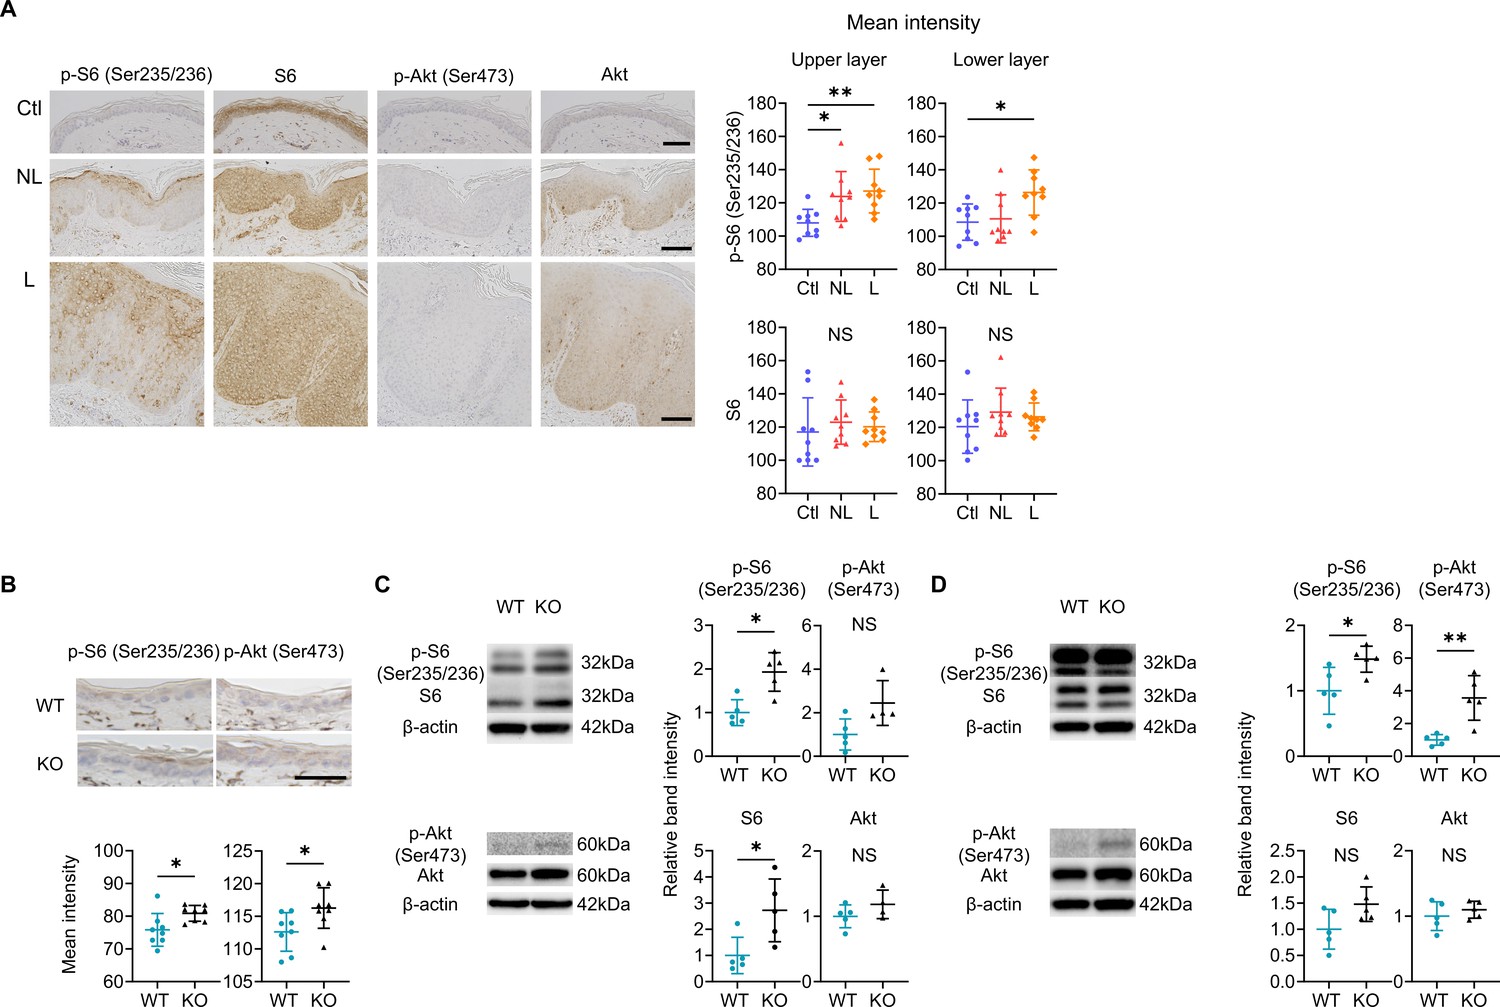
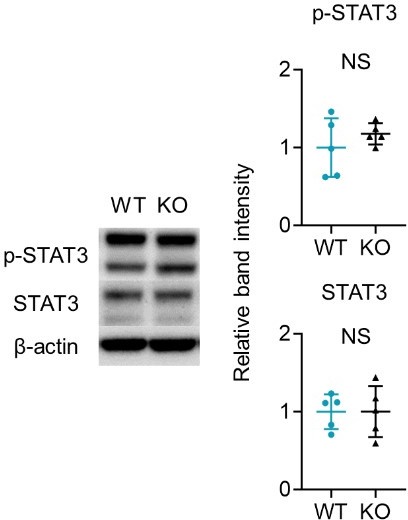
mTOR signaling is upregulated in the epidermis of psoriatic non-lesions (NL) and Sema4A knockout (KO) mice.
(A) Representative results of immunohistochemistry displaying cells positive for phospho-S6 (p-S6) (Ser235/236), S6, phospho-Akt (p-Akt) (Ser473), and Akt in Ctl, NL, and L. The graphs of accumulated data show the mean intensity of p-S6 and S6 in the upper and lower epidermal layers (n=9 per group). Scale bar = 100 μm. Each dot represents the average mean intensity from 5 unit areas per sample. (B) The mean intensity of p-S6 (Ser235/236) and p-Akt (Ser473), detected by immunohistochemistry in the epidermis of wild-type (WT) mice and KO mice, were analyzed. Scale bar = 50 μm. Each dot represents the average intensity from 5 unit areas per sample (n=8 per group). (C, D) Immunoblotting of p-S6 (Ser235/236), S6, p-Akt (Ser473), and Akt in tissue lysates from epidermis without treatment (C) and with imiquimod (IMQ) treatment for consecutive 4 days (D) (n=5 per group, except for p-Akt and Akt in C, for which n=4). (A–D) *p<0.05, **p<0.01. NS, not significant. The error bars represent the standard deviation.
-
Figure 6—source data 1
Excel file containing quantitative data for Figure 6.
- https://cdn.elifesciences.org/articles/97654/elife-97654-fig6-data1-v1.xlsx
-
Figure 6—source data 2
PDF file containing original western blots for Figure 6C and D.
- https://cdn.elifesciences.org/articles/97654/elife-97654-fig6-data2-v1.zip
-
Figure 6—source data 3
Original JPG files for western blot analysis displayed in Figure 6C and D.
- https://cdn.elifesciences.org/articles/97654/elife-97654-fig6-data3-v1.zip
Figure 7 with 2 supplements
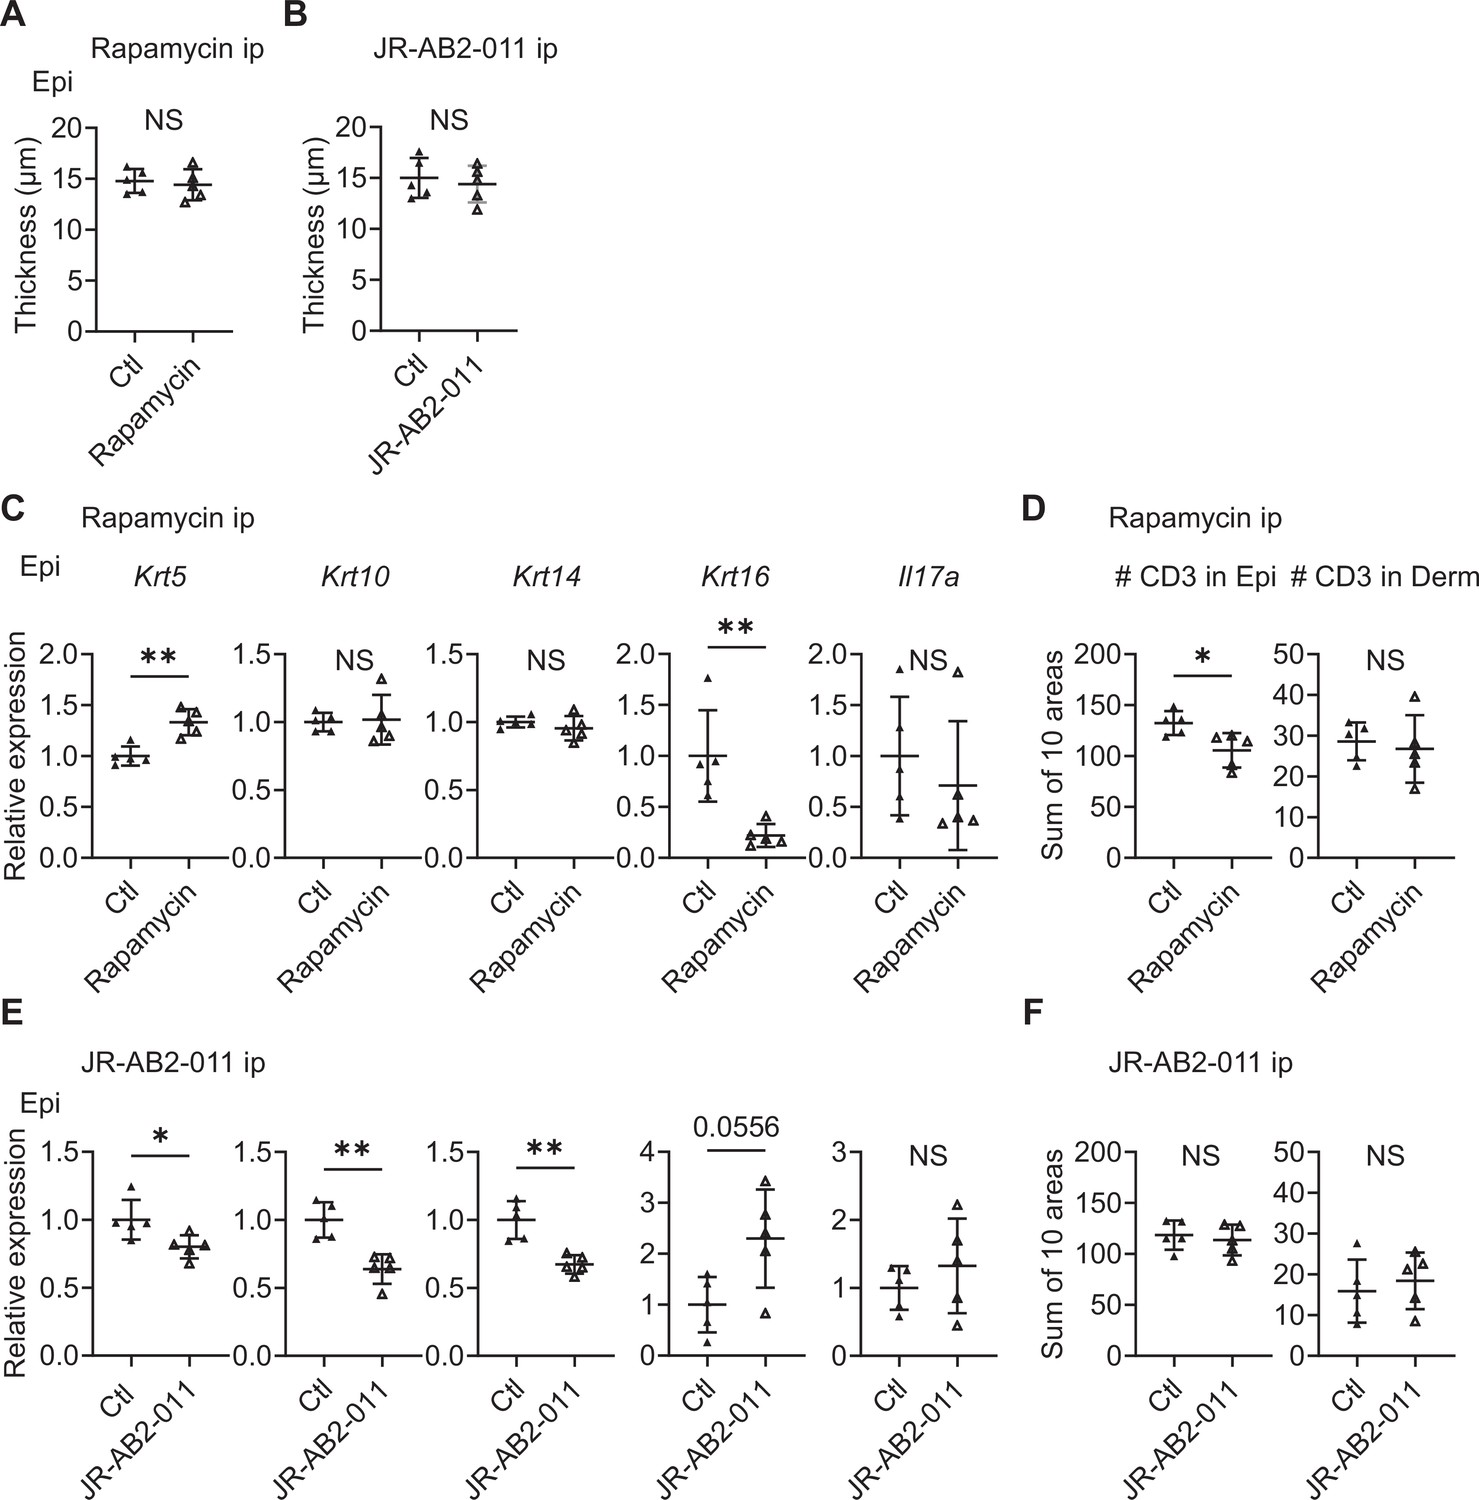
Inhibitors of mTOR signaling modulate the expression of cytokeratins in Sema4A knockout (KO) mice.
(A, B) Epidermal thickness of Sema4A KO mice treated intraperitoneally with vehicle (Ctl) or rapamycin (A), and Ctl or JR-AB2-011 (B) (n=5 per group). (C, D) Relative expression of keratinocyte differentiation markers and Il17a in Sema4A KO Epi (C), and the number of T cells in Epi and Derm under Ctl or rapamycin (D) (n=5 per group). (E, F) Relative expression of keratinocyte differentiation markers and Il17a in Sema4A KO Epi (E), and the number of T cells in Epi and Derm under Ctl or JR-AB2-011 (F) (n=5 per group). (D and F) Each dot represents the sum of numbers from 10 unit areas across 3 specimens. (A–F) *p<0.05, **p<0.01. NS, not significant. The error bars represent the standard deviation.
-
Figure 7—source data 1
Excel file containing quantitative data for Figure 7.
- https://cdn.elifesciences.org/articles/97654/elife-97654-fig7-data1-v1.xlsx
Figure 7—figure supplement 1
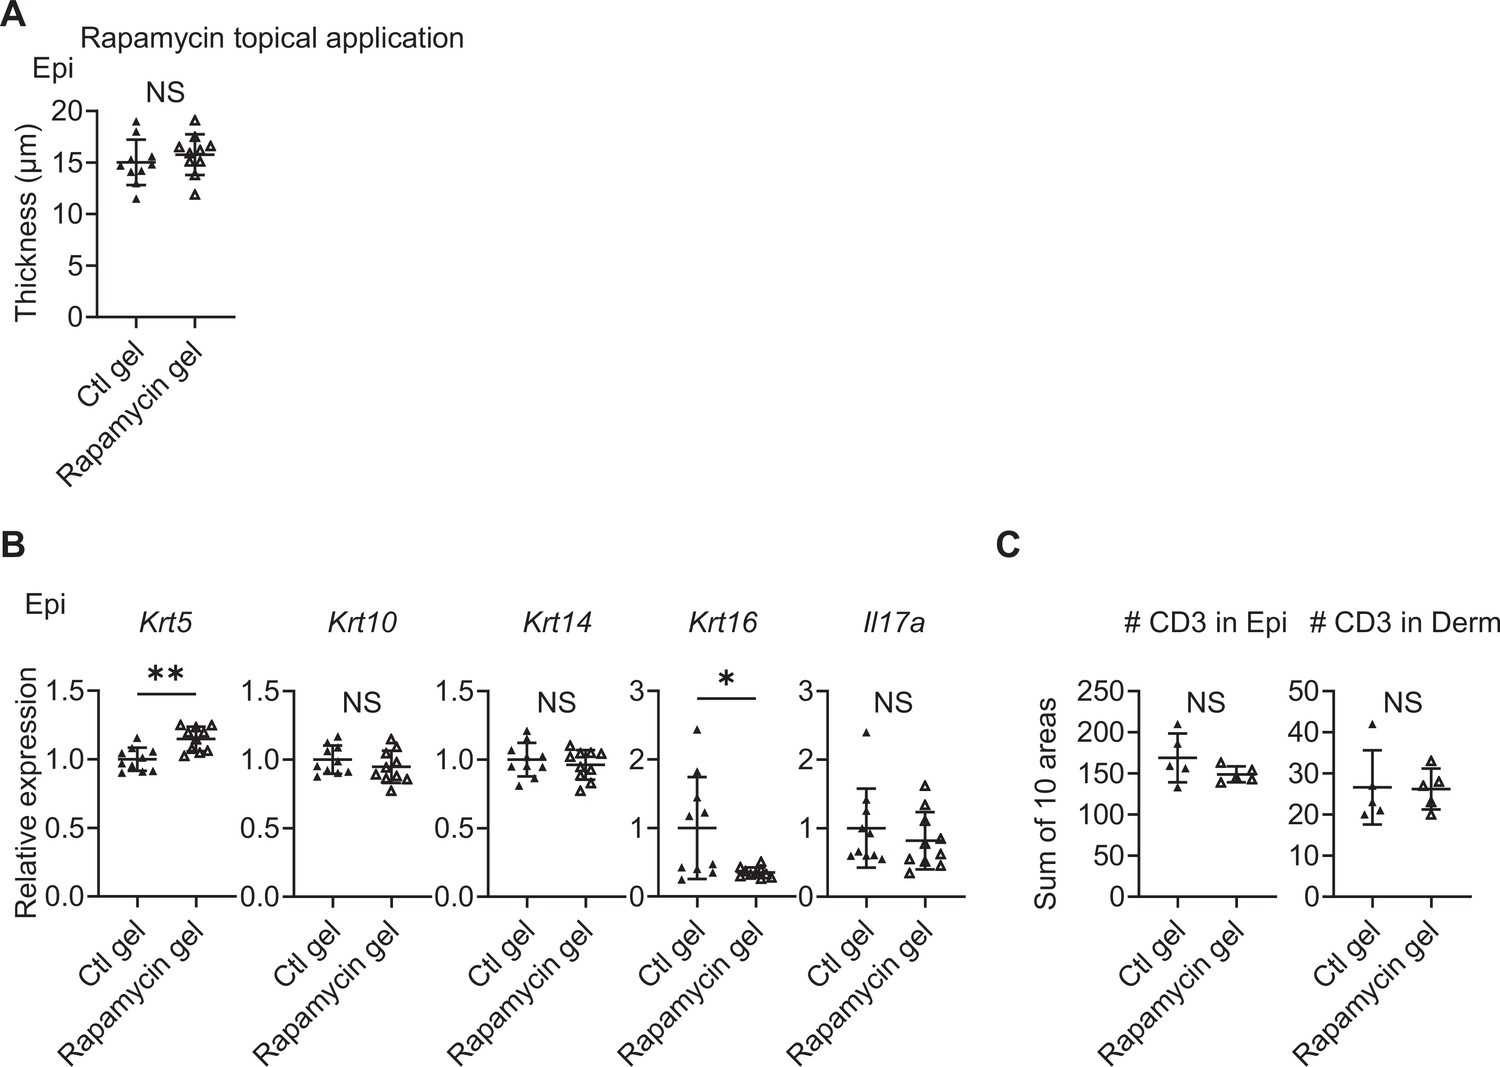
Topical application of rapamycin gel yields partially similar results to intraperitoneal treatment.
(A) Comparison of Epi thickness between vehicle (Ctl) gel-treated right ears and rapamycin gel-treated left ears of Sema4A knockout (KO) mice (n=10 per group). (B) Relative expression of keratinocyte differentiation markers and Il17a in Sema4A KO Epi under Ctl gel or rapamycin gel treatments (n=5 per group). (C) The number of T cells in the Epi (left) and Derm (right), under Ctl gel or rapamycin gel treatments (n=5 per group). Each dot represents the sum of numbers from 10 unit areas across 3 specimens. (A–C) *p<0.05, **p<0.01. NS, not significant. The error bars represent the standard deviation.
-
Figure 7—figure supplement 1—source data 1
Excel file containing quantitative data for Figure 7—figure supplement 1.
- https://cdn.elifesciences.org/articles/97654/elife-97654-fig7-figsupp1-data1-v1.xlsx
Figure 7—figure supplement 2
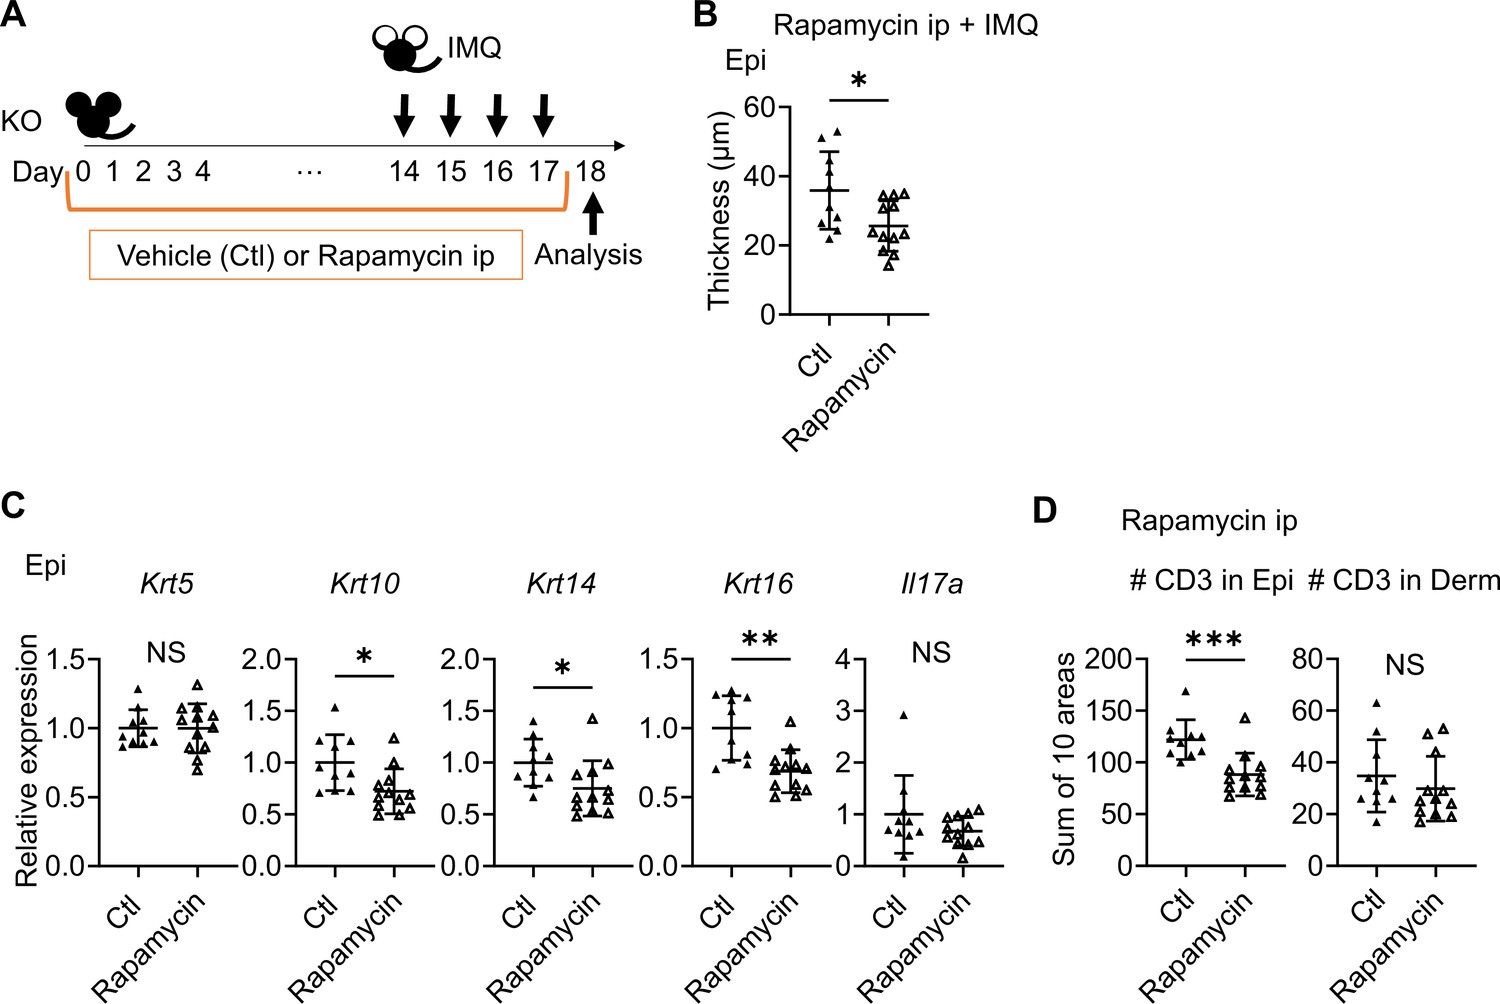
Rapamycin treatment reduced the epidermal swelling observed in imiquimod (IMQ)-treated Sema4A knockout (KO) mice.
(A) Experimental scheme. (B) The Epi thickness on day 18 (n=10 for Ctl, n=12 for rapamycin). (C) Relative expression of keratinocyte differentiation markers and Il17a in Sema4A KO Epi (n=10 for Ctl, n=12 for rapamycin). (D) The number of T cells in the Epi (left) and Derm (right), under Ctl or rapamycin and IMQ treatments (n=10 for Ctl, n=12 for rapamycin). Each dot represents the sum of numbers from 10 unit areas across 3 specimens. (A–C) *p<0.05, **p<0.01. NS, not significant. The error bars represent the standard deviation.
-
Figure 7—figure supplement 2—source data 1
Excel file containing quantitative data for Figure 7—figure supplement 2.
- https://cdn.elifesciences.org/articles/97654/elife-97654-fig7-figsupp2-data1-v1.xlsx
Author response image 1
Author response image 2
Author response image 3
Author response image 4
Tables
Appendix 1—key resources table
| Reagent type (species) or resource | Designation | Source or reference | Identifiers | Additional information |
|---|---|---|---|---|
| Strain, strain background (Mus musculus) | C57BL/6J WT mice | CLEA Japan | ||
| Strain, strain background (M. musculus) | Semaphorin 4A knockout mice | Dr. Atsushi Kumanogoh (Osaka University, Osaka, Japan) | ||
| Biological sample (Homo sapiens) | Skin specimens from 17 psoriasis patients | Osaka University | ||
| Biological sample (H. sapiens) | Skin specimens from 19 subjects who underwent tumor resection or reconstructive surgery | Osaka University | ||
| Biological sample (H. sapiens) | Blood samples from 73 psoriasis patients | Osaka University | ||
| Biological sample (H. sapiens) | Blood samples from 33 Ctl | Osaka University | ||
| Antibody | Sema4A (Rabbit polyclonal) | Abcam | Cat# Ab70178; RRID:AB_1270611 | IHC (1:100) |
| Antibody | Phospho-S6 (Ser235/236) (Rabbit monoclonal) | Cell Signaling Technology | Cat# 4858; RRID:AB_916156 | IHC (1:400), WB (1:2000) |
| Antibody | S6 (Rabbit monoclonal) | Cell Signaling Technology | Cat# 2217; RRID:AB_331355 | IHC (1:100), WB (1:1000) |
| Antibody | Phospho-Akt (Ser473) (Rabbit monoclonal) | Cell Signaling Technology | Cat# 4060; RRID:AB_2315049 | IHC (1:50), WB (1:1000) |
| Antibody | Akt (Rabbit monoclonal) | Cell Signaling Technology | Cat# 4691; RRID:AB_915783 | IHC (1:300), WB (1:1000) |
| Antibody | Keratin 5 (Rabbit polyclonal) | BioLegend | Cat# 905503; RRID:AB_2734679 | IF (1:800) |
| Antibody | Keratin 10 (Rabbit polyclonal) | BioLegend | Cat# 905403; RRID:AB_2749902 | IF (1:400) |
| Antibody | Keratin 14 (Rabbit polyclonal) | BioLegend | Cat# 905303; RRID:AB_2734678 | IF (1:400) |
| Antibody | Cytokeratin 16 (Rabbit monoclonal) | Invitrogen | Cat# MA5-42892; RRID:AB_2912033 | IF (1:100) |
| Antibody | CD3 (Rat monoclonal) | Bio-Rad | Cat# MCA1477; RRID:AB_321245 | IF (1:100) |
| Antibody | Rabbit IgG H&L (Alexa Fluor 555) (Donkey polyclonal) | Abcam | Cat# ab150074; RRID:AB_2636997 | IF (1:1000) |
| Antibody | Rat IgG H&L (Alexa Fluor 555) (Donkey polyclonal) | Abcam | Cat# ab150154; RRID:AB_2813834 | IF (1:1000) |
| Antibody | β-Actin (Mouse monoclonal) | Sigma-Aldrich | Cat# A5441; RRID:AB_476744 | WB (1:5000) |
| Antibody | Anti-Mouse IgG, HRP-Linked Whole Ab (Sheep monoclonal secondary) | Cytiva | Cat# NA931; RRID:AB_772210 | WB (1:10,000) |
| Antibody | Anti-Rabbit IgG, HRP-Linked Whole Ab (Donkey polyclonal secondary) | Cytiva | Cat# NA934; RRID:AB_772206 | WB (1:10,000) |
| Antibody | CD3 (Mouse monoclonal) | BioLegend | Cat# 317335; RRID:AB_2561627 | FCM (1:100) |
| Antibody | CD4 (Mouse monoclonal) | BioLegend | Cat# 300512; RRID:AB_314080 | FCM (1:100) |
| Antibody | CD8a (Mouse monoclonal) | eBioscience | Cat# 47-0088-42; RRID:AB_1272046 | FCM (1:100) |
| Antibody | CD11c (Mouse monoclonal) | BioLegend | Cat# 301628; RRID:AB_11203895 | FCM (1:100) |
| Antibody | SEMA4A (Mouse monoclonal) | BioLegend | Cat# 148404; RRID:AB_2565287 | FCM (1:100) |
| Antibody | CD3ε (Armenian Hamster monoclonal) | BioLegend | Cat# 100328; RRID:AB_893318 | FCM Skin specimens (1:20), Others (1:100) |
| Antibody | CD4 (Rat monoclonal) | BioLegend | Cat# 100406; RRID:AB_312691 | FCM (1:100) |
| Antibody | CD8a (Rat monoclonal) | BioLegend | Cat# 100714; RRID:AB_312753 | FCM (1:100) |
| Antibody | CD16/32 (Rat monoclonal) | BioLegend | Cat# 101301; RRID:AB_312800 | FCM (1:100) |
| Antibody | CD69 (Armenian Hamster monoclonal) | BioLegend | Cat# 104514; RRID:AB_492843 | FCM (1:10) |
| Antibody | CD103 (Armenian Hamster monoclonal) | BioLegend | Cat# 121422; RRID:AB_2562901 | FCM (1:100) |
| Antibody | TCR Vγ2 (Armenian Hamster monoclonal) | BioLegend | Cat# 137705; RRID:AB_10643997 | FCM (1:100) |
| Antibody | TCR Vγ3 (Syrian Hamster monoclonal) | BD Biosciences | Cat# 743241; RRID:AB_2741371 | FCM (1:100) |
| Antibody | TCRγδ (Armenian Hamster monoclonal) | BioLegend | Cat# 118124; RRID:AB_11204423 | FCM (1:100) |
| Antibody | IFNγ (Rat monoclonal) | BioLegend | Cat# 505813; RRID:AB_493312 | FCM (1:40) |
| Antibody | IL-4 (Rat monoclonal) | BD Biosciences | Cat# 562915; RRID:AB_2737889 | FCM (1:40) |
| Antibody | IL-17A (Rat monoclonal) | BioLegend | Cat# 506925; RRID:AB_10900442 | FCM (1:40) |
| Sequence-based reagent | Human GAPDH_F | This paper | PCR primers | GTCTCCTCTGACTTCAACAGCG |
| Sequence-based reagent | Human GAPDH_R | This paper | PCR primers | ACCACCCTGTTGCTGTAGCCAA |
| Sequence-based reagent | Human SEMA4A_F | Carvalheiro et al., 2019 | PCR primers | TCTGCTCCTGAGTGGTGATG |
| Sequence-based reagent | Human SEMA4A_R | Carvalheiro et al., 2019 | PCR primers | AAACCAGGACACGGATGAAG |
| Peptide, recombinant protein | Recombinant Mouse IL-1β (carrier-free) | BioLegend | Cat# 575102 | |
| Peptide, recombinant protein | Recombinant Mouse IL-6 (carrier-free) | BioLegend | Cat# 575702 | |
| Peptide, recombinant protein | Recombinant Mouse IL-23 (carrier-free) | BioLegend | Cat# 589006 | |
| Peptide, recombinant protein | Recombinant Mouse TGF-β1 (carrier-free) | BioLegend | Cat# 763102 | |
| Commercial assay or kit | BD Cytofix/Cytoperm Fixation/Permeabilization Kit | BD Biosciences | Cat# 554714 | |
| Commercial assay or kit | Dako REAL EnVision Detection System, Peroxidase/DAB, Rabbit/Mouse, HRP kit | Agilent | Cat# K5007; RRID:AB_2888627 | |
| Commercial assay or kit | Direct-zol RNA Miniprep Kits | Zymo Research | Cat# R2050 | |
| Commercial assay or kit | High-Capacity RNA-to-cDNA Kit | Thermo Fisher scientific | Cat# 4387406 | |
| Commercial assay or kit | LIVE/DEAD Fixable Dead Cell Stain Kit | Thermo Fisher Scientific | Cat# L34965 | |
| Commercial assay or kit | Pan T Cell Isolation Kit II, mouse | Miltenyi Biotec | Cat# 130-095-130 | |
| Commercial assay or kit | T Cell Activation/Expansion Kit, mouse | Miltenyi Biotec | Cat# 130-093-627 | |
| Commercial assay or kit | TB Green Premix Ex Taq II (Tli RNaseH Plus) | Takara Bio | Cat# RR820A | |
| Chemical compound, drug | 5% imiquimod cream | Mochida | Global Trade Item Number: 224130002 | |
| Chemical compound, drug | BD Golgiplug | BD Biosciences | Cat# 555029 | |
| Chemical compound, drug | Collagenase type III | Worthington Biochemical Corporation | Cat# LS004183 | |
| Chemical compound, drug | CountBright Absolute Counting Beads, for flow cytometry | Thermo Fisher Scientific | Cat# C36950 | |
| Chemical compound, drug | Dispase II | Wako | Cat# 383-02281 | |
| Chemical compound, drug | Ionomycin | Wako | Cat# 095-05831 | |
| Chemical compound, drug | JR-AB2-011 | MedChemExpress | Cat# HY-122022 | |
| Chemical compound, drug | Mounting medium with DAPI | Vector Laboratories | Cat# H-1200; RRID:AB_2336790 | |
| Chemical compound, drug | Phorbol 12-Myristate 13-Acetate | Wako | Cat# 162-23591 | |
| Chemical compound, drug | Phosphatase Inhibitor Cocktail (100×) | Nacalai Tesque | Cat# 07574-61 | |
| Chemical compound, drug | Protease Inhibitor Cocktail for Use with Mammalian Cell and Tissue Extracts | Nacalai Tesque | Cat# 25955-11 | |
| Chemical compound, drug | Protein Block Serum-Free | Agilent | Cat# X0909 | |
| Chemical compound, drug | Rapamycin | Sanxin Chempharma | CAS# 53123-88-9 | |
| Chemical compound, drug | RBC Lysis Buffer (10×) | BioLegend | Cat# 420301 | |
| Chemical compound, drug | WB Stripping Solution | Nacalai Tesque | Cat# 05364-55 | |
| Software, algorithm | Cellxgene VIP | Li et al., 2022 | ||
| Software, algorithm | GraphPad Prism 10 | GraphPad Software | RRID:SCR_002798 | |
| Software, algorithm | ImageJ | National Institutes of Health | RRID:SCR_003070 | |
| Software, algorithm | Kaluza | Beckman Coulter | RRID:SCR_016182 | |
| Software, algorithm | RaNAseq | https://ranaseq.eu/; Prieto and Barrios, 2019 |
Additional files
-
Supplementary file 1
Patient information.
This table provides patient information used in this study. Psoriasis severity was defined by the total body surface area (BSA) affected: <3% BSA for mild, 3–10% BSA for moderate, and >10% BSA for severe disease.
- https://cdn.elifesciences.org/articles/97654/elife-97654-supp1-v1.xlsx
-
Supplementary file 2
Antibodies used for immunohistochemical, immunofluorescence, and western blot analyses.
- https://cdn.elifesciences.org/articles/97654/elife-97654-supp2-v1.xlsx
-
Supplementary file 3
Primer sequences used for real-time quantitative PCR in experiments with human and murine samples.
- https://cdn.elifesciences.org/articles/97654/elife-97654-supp3-v1.xlsx
-
Supplementary file 4
Antibodies used for flow cytometry analysis.
- https://cdn.elifesciences.org/articles/97654/elife-97654-supp4-v1.xlsx
-
Supplementary file 5
Mouse recombinant cytokines.
- https://cdn.elifesciences.org/articles/97654/elife-97654-supp5-v1.xlsx
-
MDAR checklist
- https://cdn.elifesciences.org/articles/97654/elife-97654-mdarchecklist1-v1.docx
Download links
A two-part list of links to download the article, or parts of the article, in various formats.
Downloads (link to download the article as PDF)
Open citations (links to open the citations from this article in various online reference manager services)
Cite this article (links to download the citations from this article in formats compatible with various reference manager tools)
Downregulation of semaphorin 4A in keratinocytes reflects the features of non-lesional psoriasis
eLife 13:RP97654.
https://doi.org/10.7554/eLife.97654.3


