Muscle-resident mesenchymal progenitors sense and repair peripheral nerve injury via the GDNF-BDNF axis
- School of Biological Sciences, Seoul National University, Republic of Korea
- Molecular Recognition Research Center, Korea Institute of Science and Technology, Republic of Korea
Figures
Figure 1 with 2 supplements
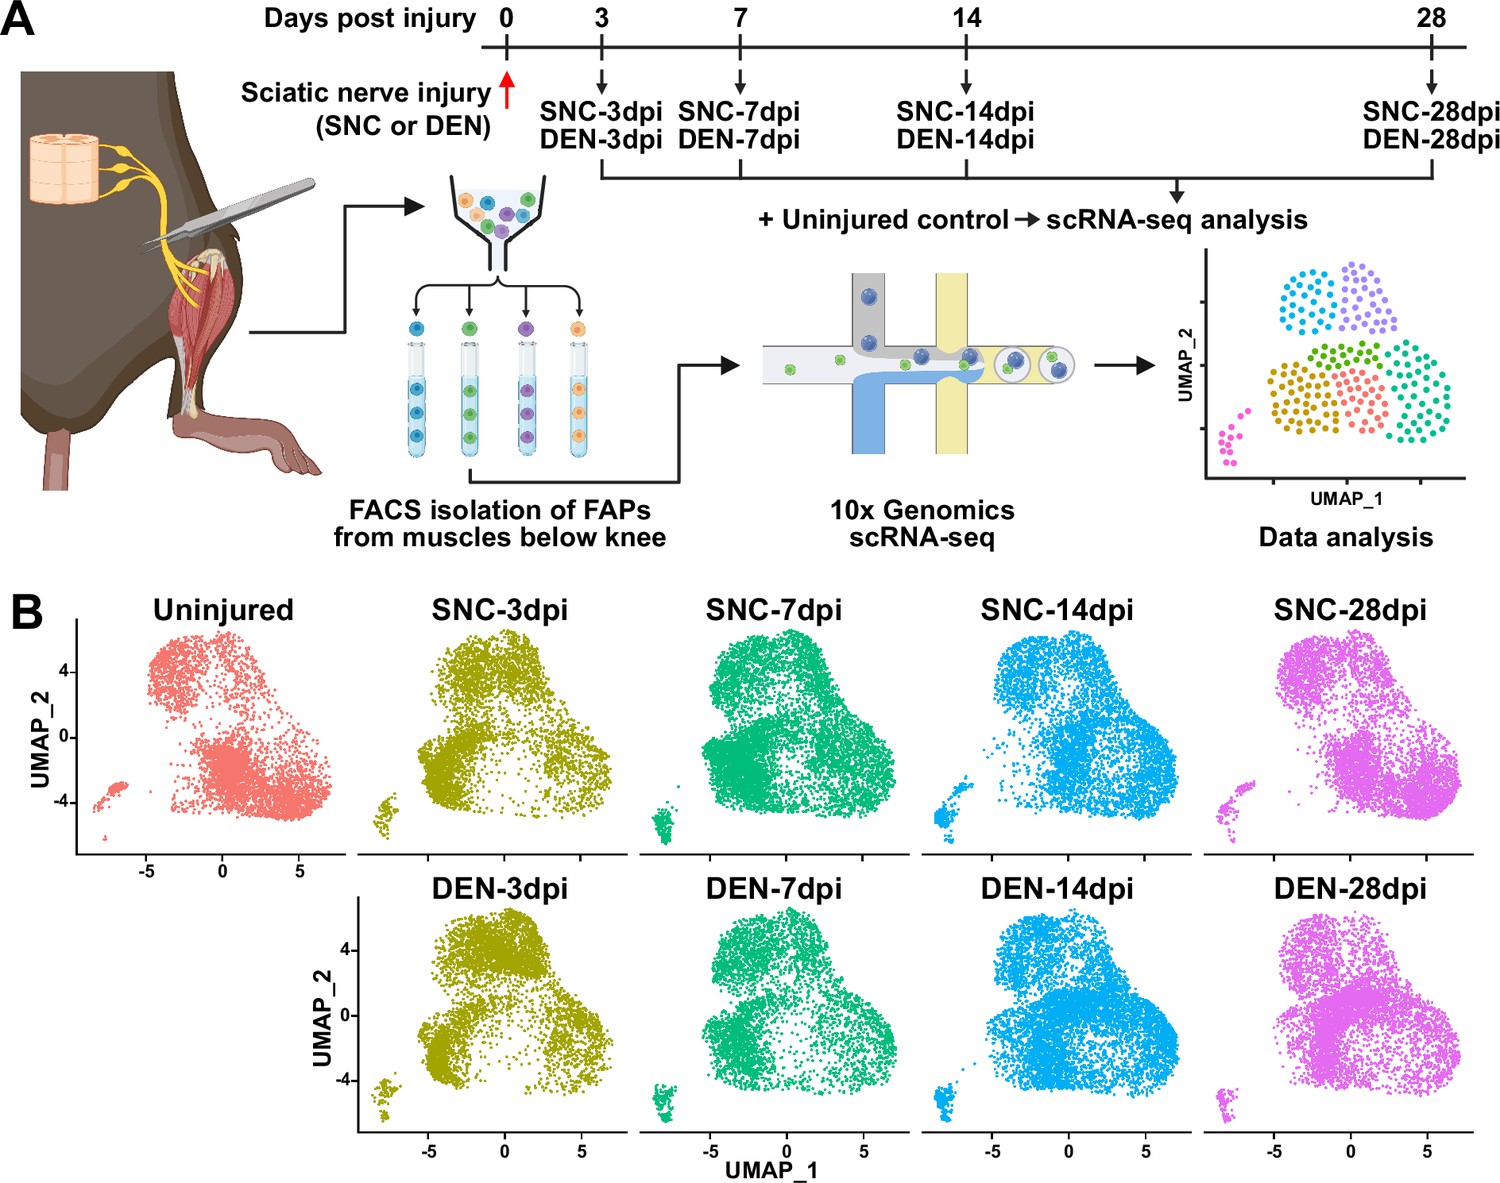
Single-cell transcriptome profiling of nerve injury-affected fibro-adipogenic progenitors (FAPs).
(A) Experimental scheme depicting the procedures for sample collection and single-cell RNA-sequencing (scRNA-seq). The types of nerve injuries and time points for FAP isolation for each sample are specified. (B) Single-cell transcriptome data of nerve injury-affected FAPs displayed separately by samples on uniform manifold approximation and projection (UMAP) plots.
© 2024, BioRender Inc. Figure 1A was created using BioRender, and is published under a CC BY-NC-ND license. Further reproductions must adhere to the terms of this license.
Figure 1—figure supplement 1
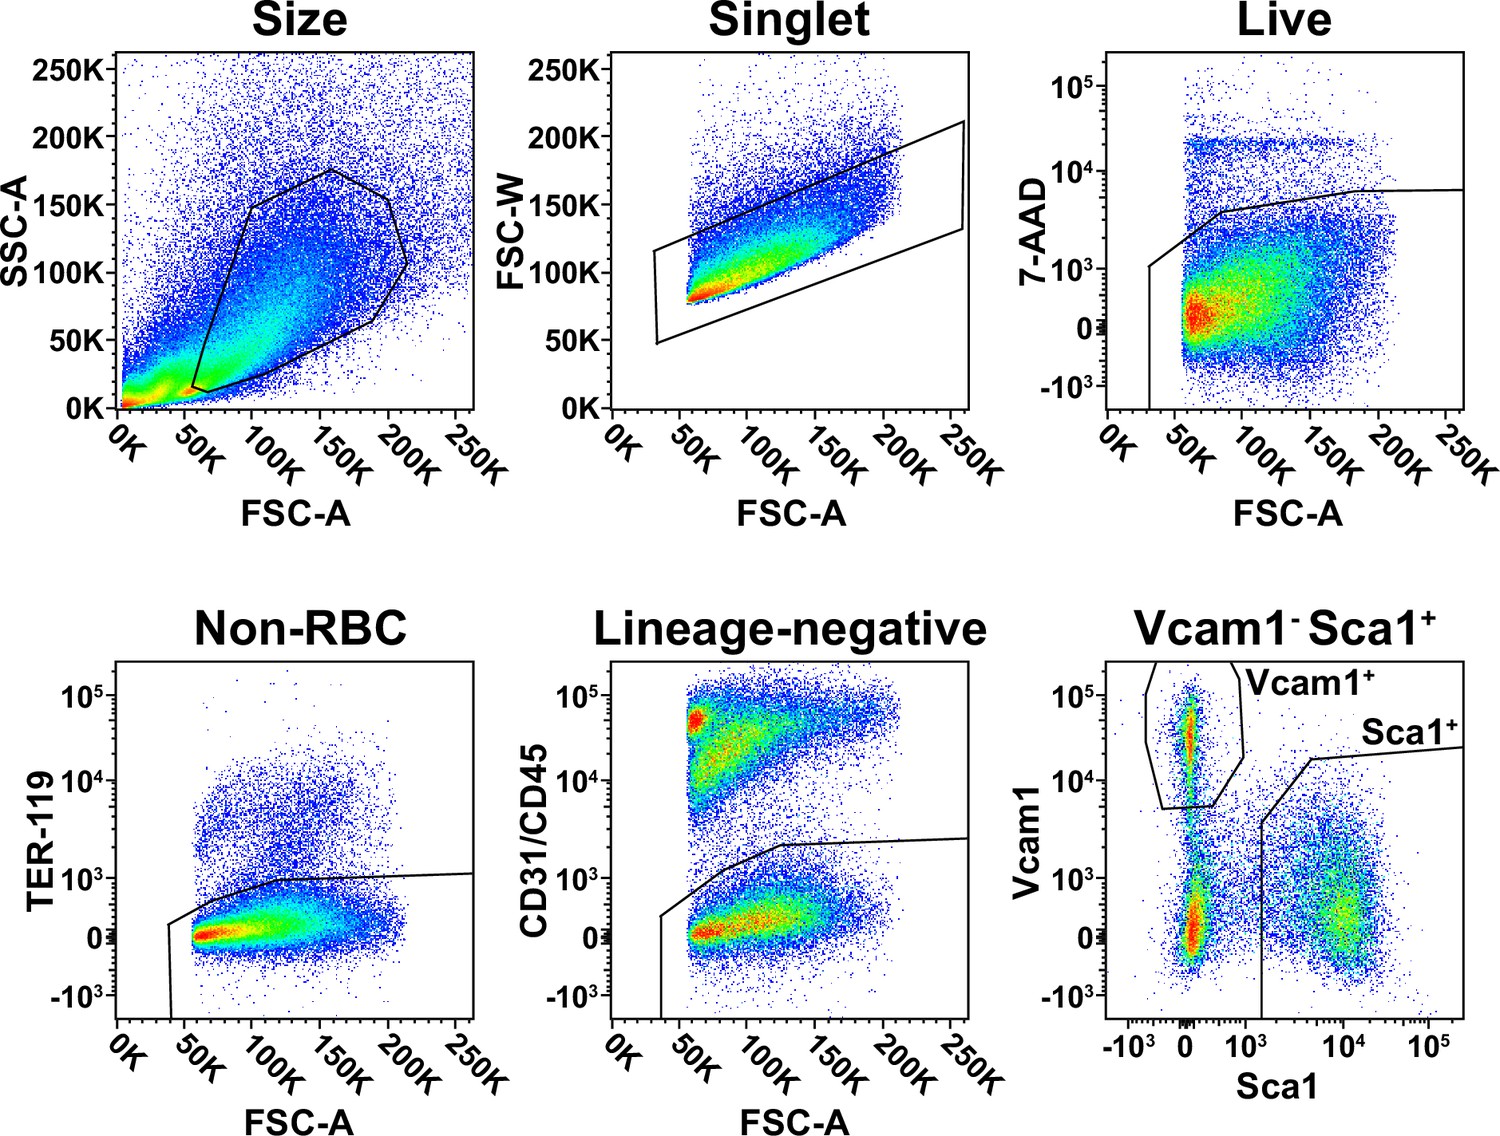
Fluorescence-activated cell sorting (FACS) isolation of muscle-resident fibro-adipogenic progenitors (FAPs).
Gating strategies used for FACS isolation of FAPs.
Figure 1—figure supplement 2
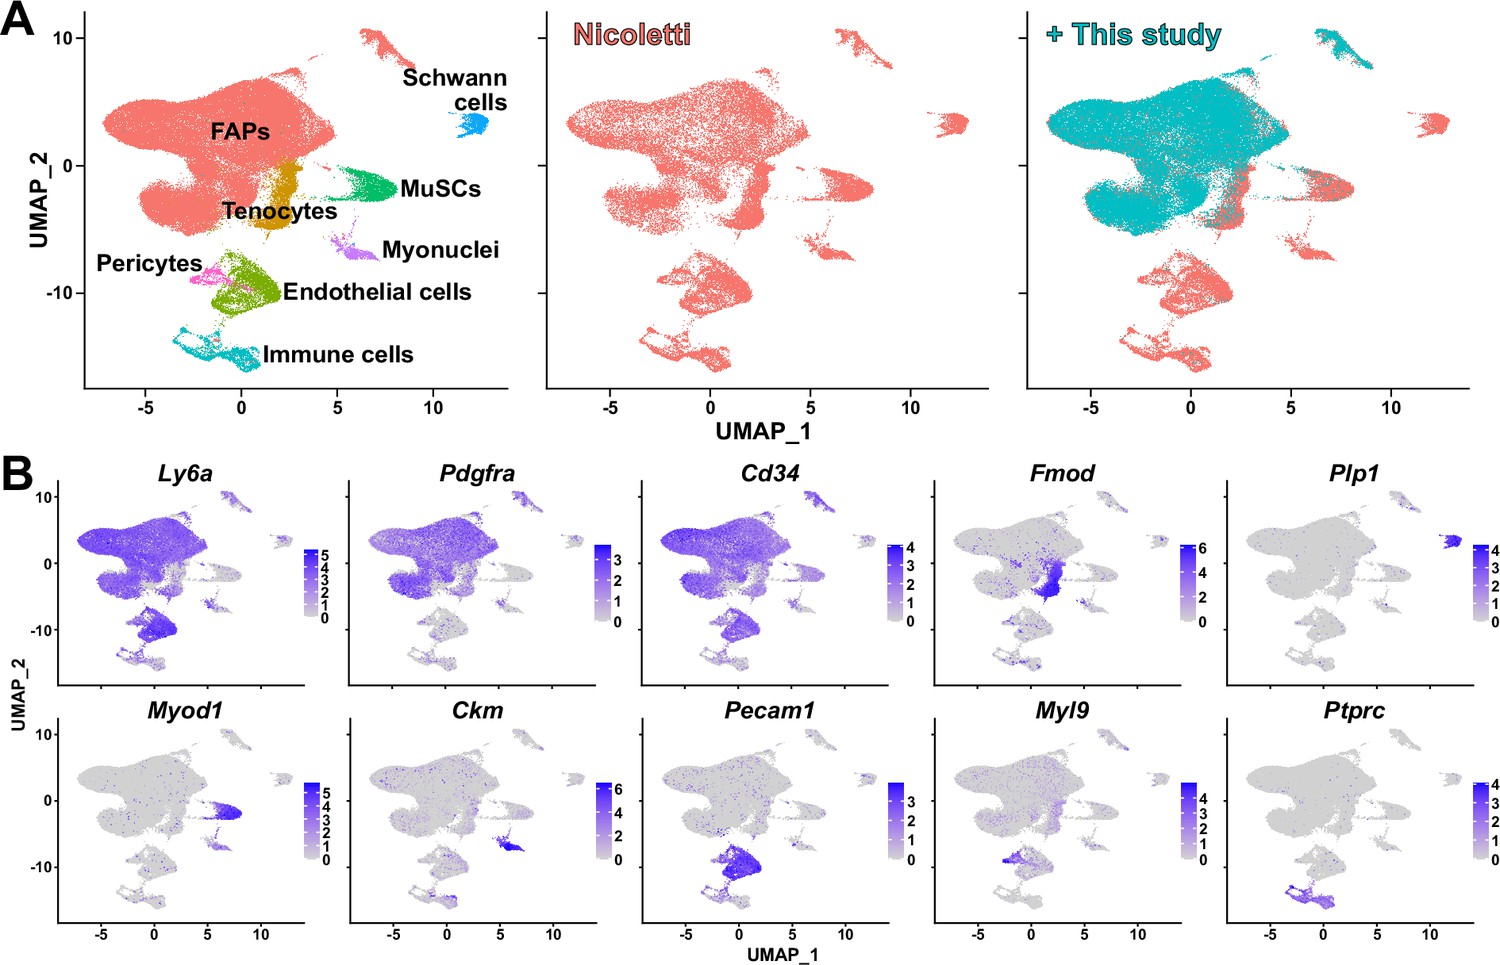
Validation of single-cell RNA-sequencing (scRNA-seq) data produced in this study.
(A) Integration of scRNA-seq data obtained in this study and data from Nicoletti et al., 2023 visualized on uniform manifold approximation and projection (UMAP) plots. Left: integrated data labeled with cell types; middle: cells from Nicoletti et al., 2023 only; right: data from this study overlaid on top of data from Nicoletti et al., 2023. (B) Expressions of marker genes that distinguish cell types within skeletal muscle in the integrated scRNA-seq data visualized on UMAP plots.
Figure 2 with 3 supplements
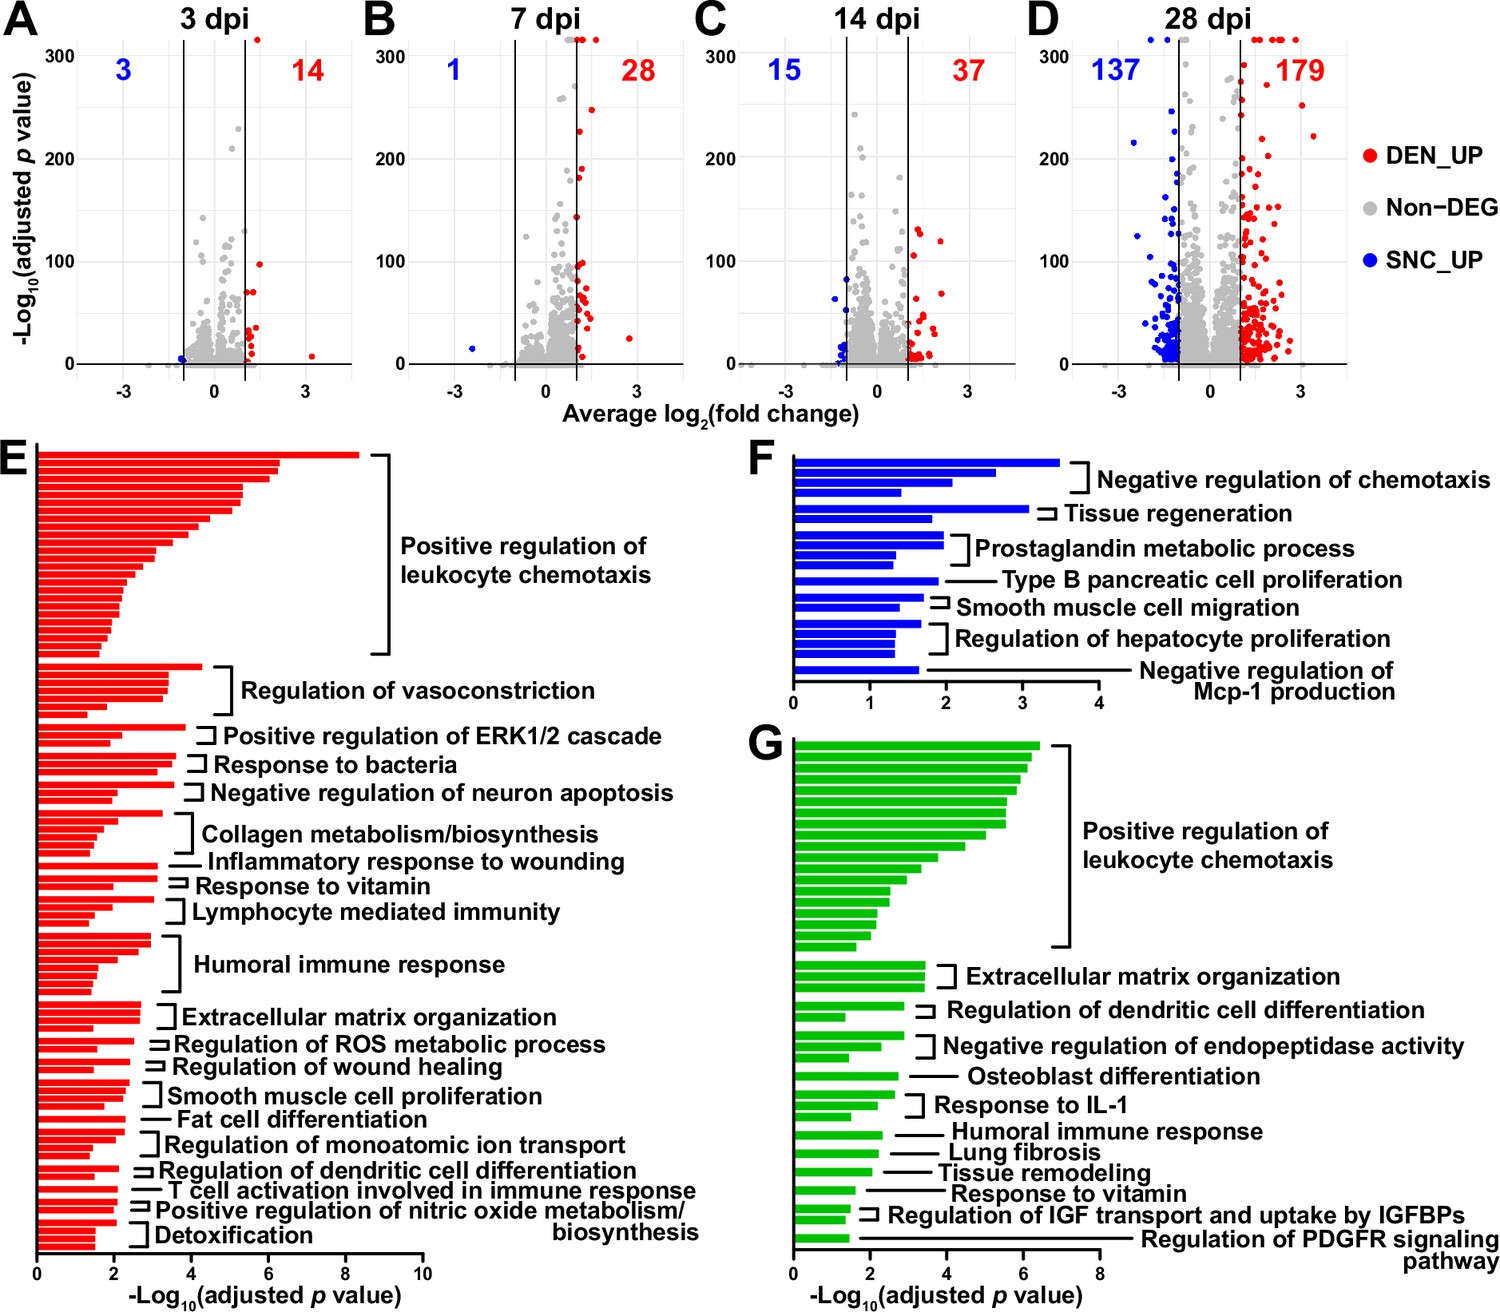
Distinct response profiles of fibro-adipogenic progenitors (FAPs) upon nerve crush injury versus denervation.
(A–D) Volcano plots showing different numbers of differentially expressed genes (DEGs) identified from comparing sciatic nerve crush (SNC)- versus denervation (DEN)-affected FAPs at (A) 3, (B) 7, (C) 14, (D) 28 days post injury (dpi). (E–G) Pathway terms enriched from gene set overrepresentation analyses using g:Profiler. DEGs used as input were (E) DEN-28dpi-upregulated versus SNC-28dpi, (F) SNC-28dpi-upregulated versus DEN-28dpi, and (G) DEGs upregulated commonly in SNC-3dpi, SNC-7dpi, DEN-3dpi, and DEN-7dpi versus uninjured control.
Figure 2—figure supplement 1
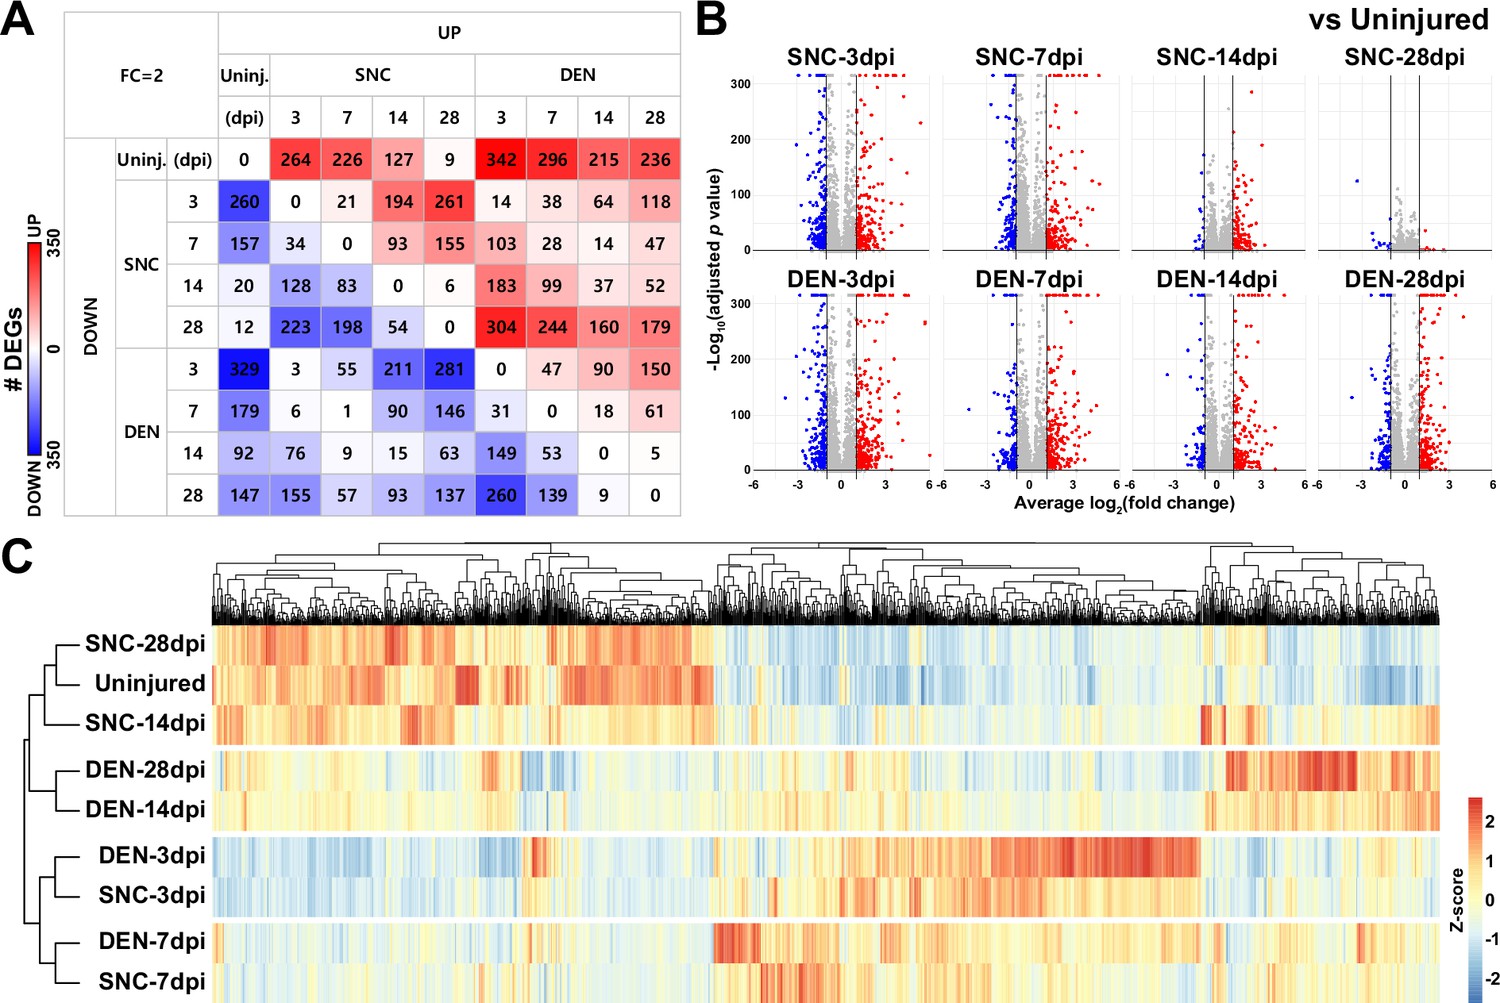
Differentially expressed gene (DEG) analyses reveal similarities and differences between fibro-adipogenic progenitors (FAPs) affected by sciatic nerve crush (SNC) or denervation (DEN) at different time points.
(A) Number of DEGs identified from pairwise comparisons of all nine single-cell RNA-sequencing (scRNA-seq) samples visualized as a heatmap. (B) DEGs were identified by comparing nerve injury-affected FAPs versus uninjured control shown on volcano plots. (C) Hierarchical clustering of the nine scRNA-seq samples using DEGs identified in (A) displayed as a heatmap.
Figure 2—figure supplement 2
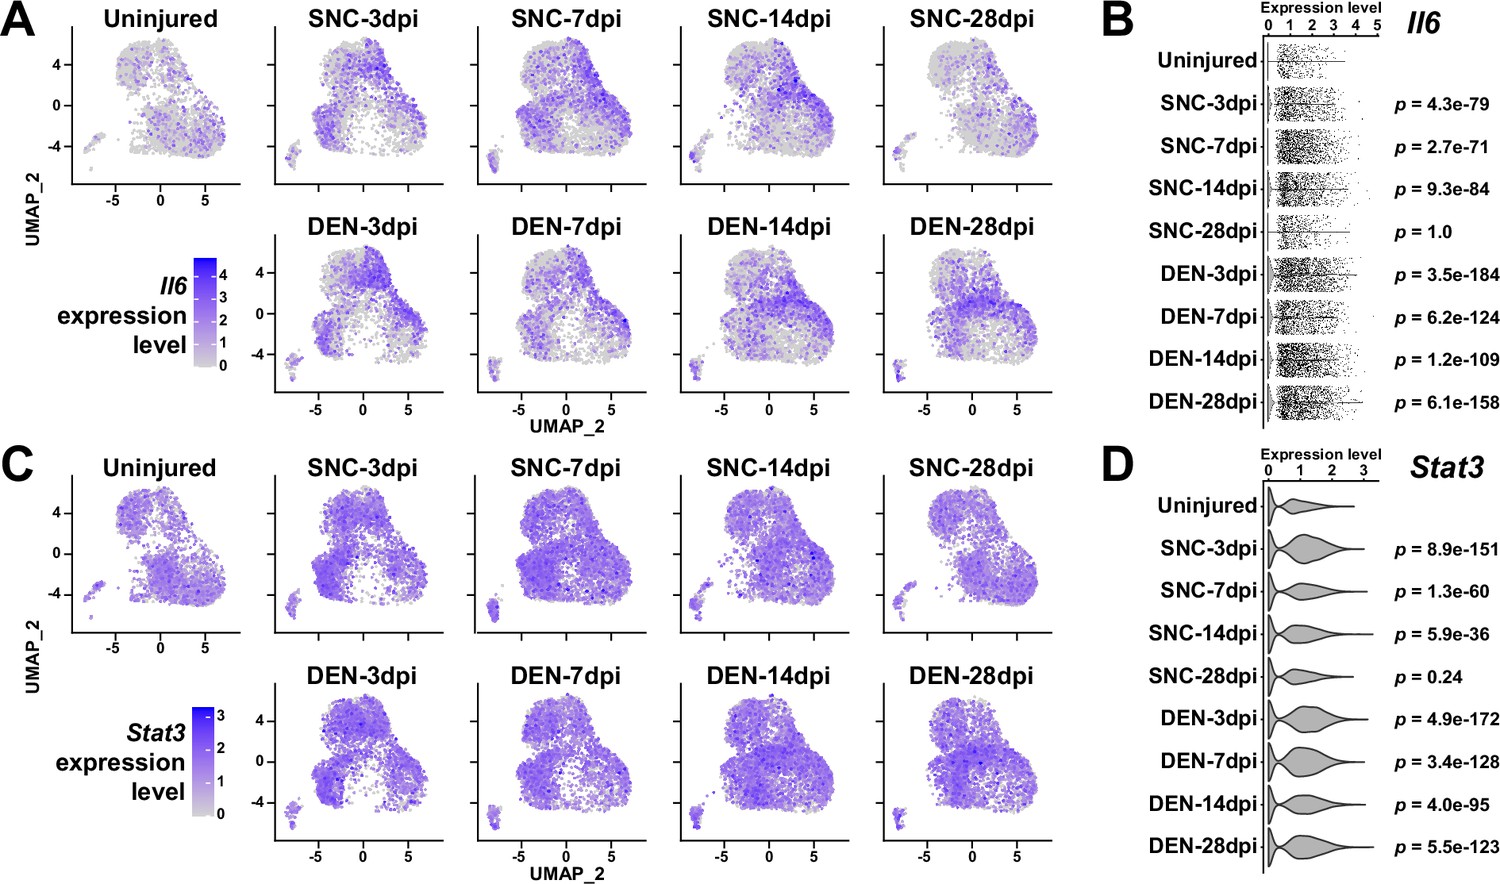
Expression patterns of Il6 and Stat3 in nerve injury-affected fibro-adipogenic progenitors (FAPs).
(A, C) Uniform manifold approximation and projection (UMAP) plots showing the expressions of (A) Il6 and (C) Stat3. (B, D) Violin plots showing the expressions of (B) Il6 and (D) Stat3, with p-values calculated buy comparing each sample to uninjured control. Wilcoxon rank sum test.
Figure 2—figure supplement 3
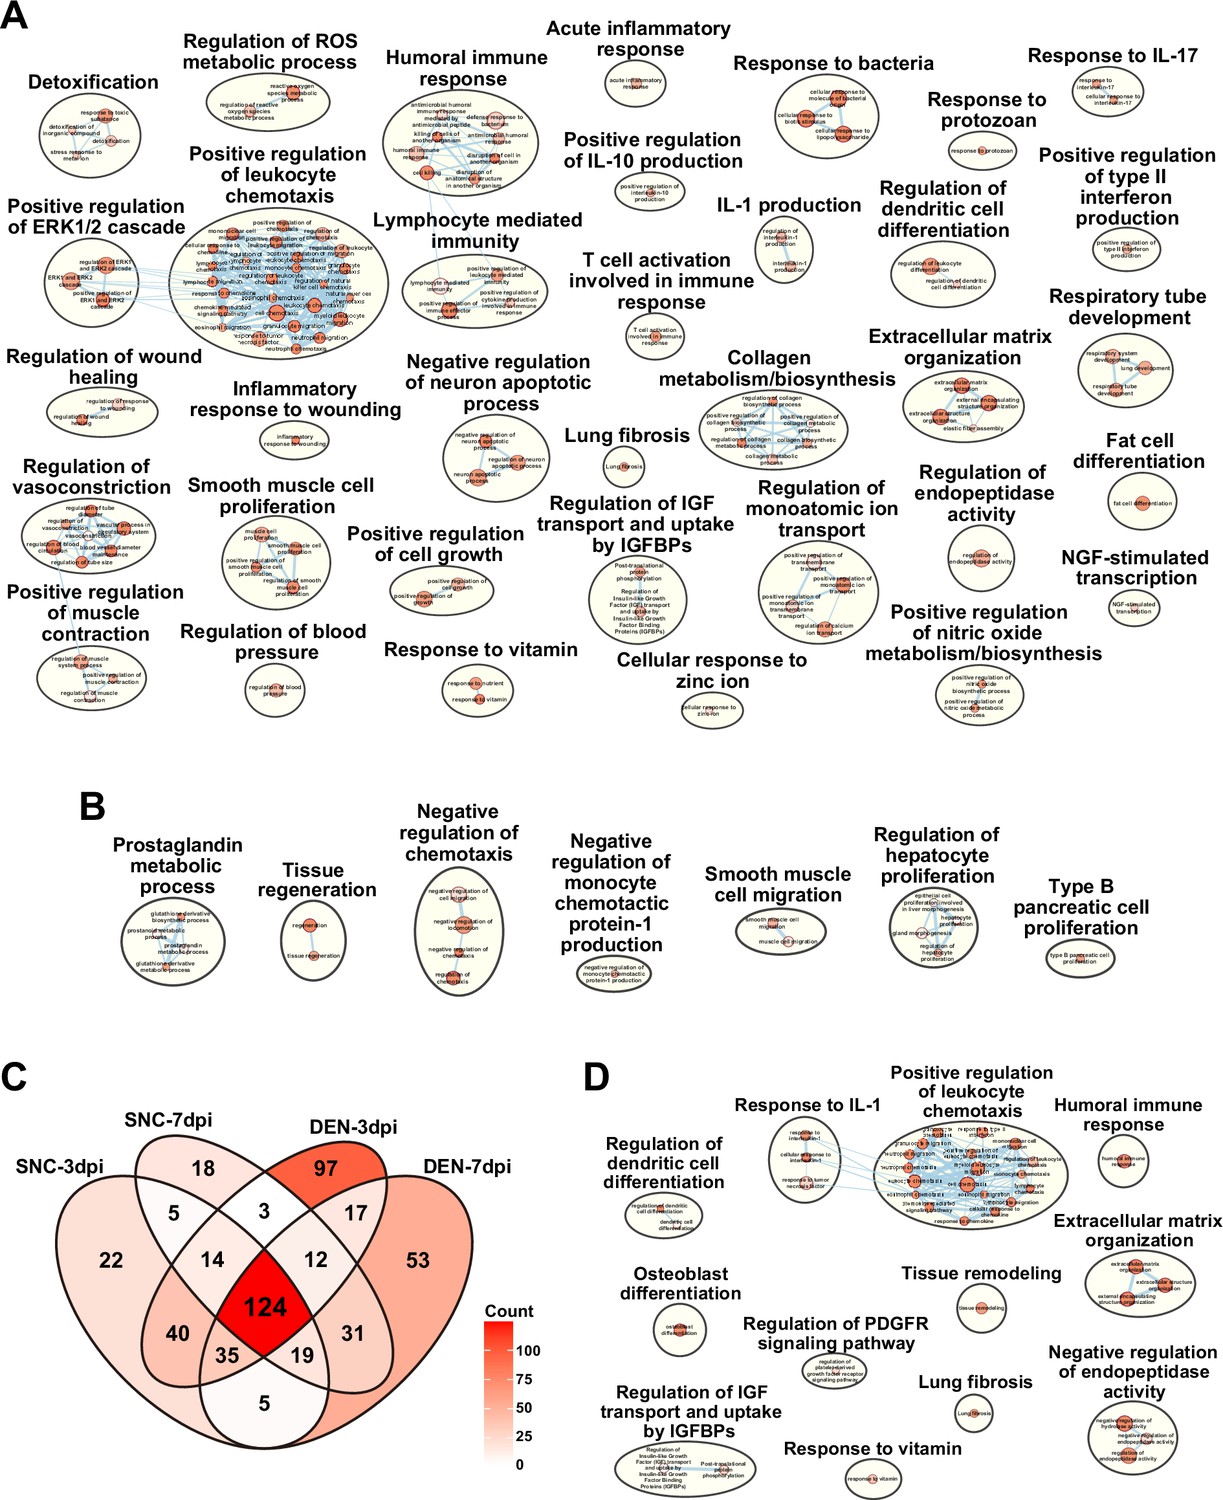
Gene set overrepresentation analyses using differentially expressed genes (DEGs) from pairwise comparisons of the nine single-cell RNA-sequencing (scRNA-seq) samples.
(A, B) Results from g:Profiler showing pathways enriched using DEGs upregulated in (A) denervation (DEN)-28 dpi versus sciatic nerve crush (SNC)-28 dpi and (B) vice versa. (C) Venn diagram showing the number of overlapping genes identified as DEGs by comparing each indicated sample to uninjured control. (D) Results from g:Profiler showing pathways enriched using DEGs shared in all four samples compared to uninjured control, as shown in (C).
Figure 3 with 4 supplements
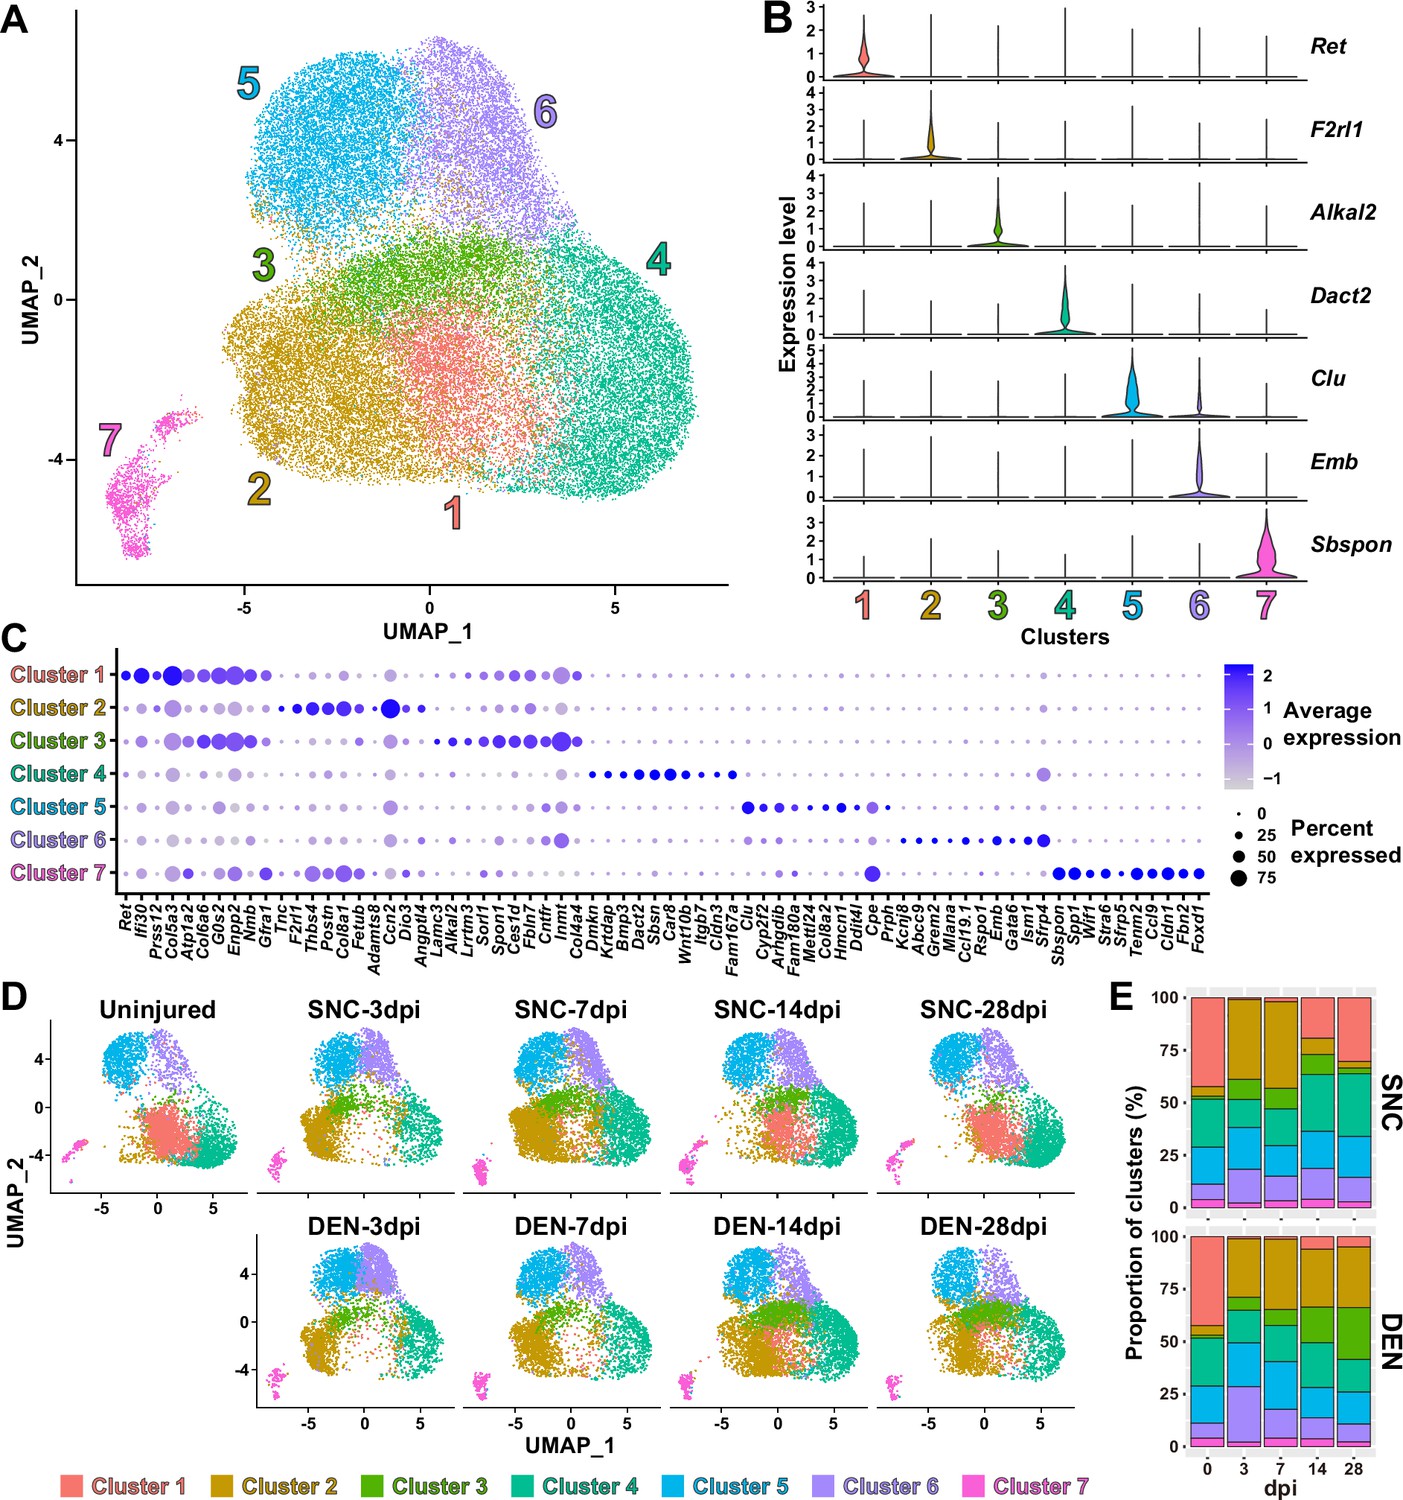
Nerve injury-responsive subsets within fibro-adipogenic progenitors (FAPs).
(A) Seven clusters were identified by unsupervised clustering using all nine single-cell RNA-sequencing (scRNA-seq) samples obtained in this study displayed on the uniform manifold approximation and projection (UMAP) plot. (B) Violin plots showing expressions of unique marker genes identified in each cluster. (C) Dotplot showing the expression levels and percentages of the top 10 differentially expressed genes (DEGs) enriched in each cluster. (D) UMAP plots of clustered scRNA-seq data displayed separately by samples. (E) Barplots showing the proportions of the seven clusters that comprise each scRNA-seq sample of nerve injury-affected FAPs. For 0 dpi, data from the same uninjured control sample is displayed for both SNC and DEN.
Figure 3—figure supplement 1
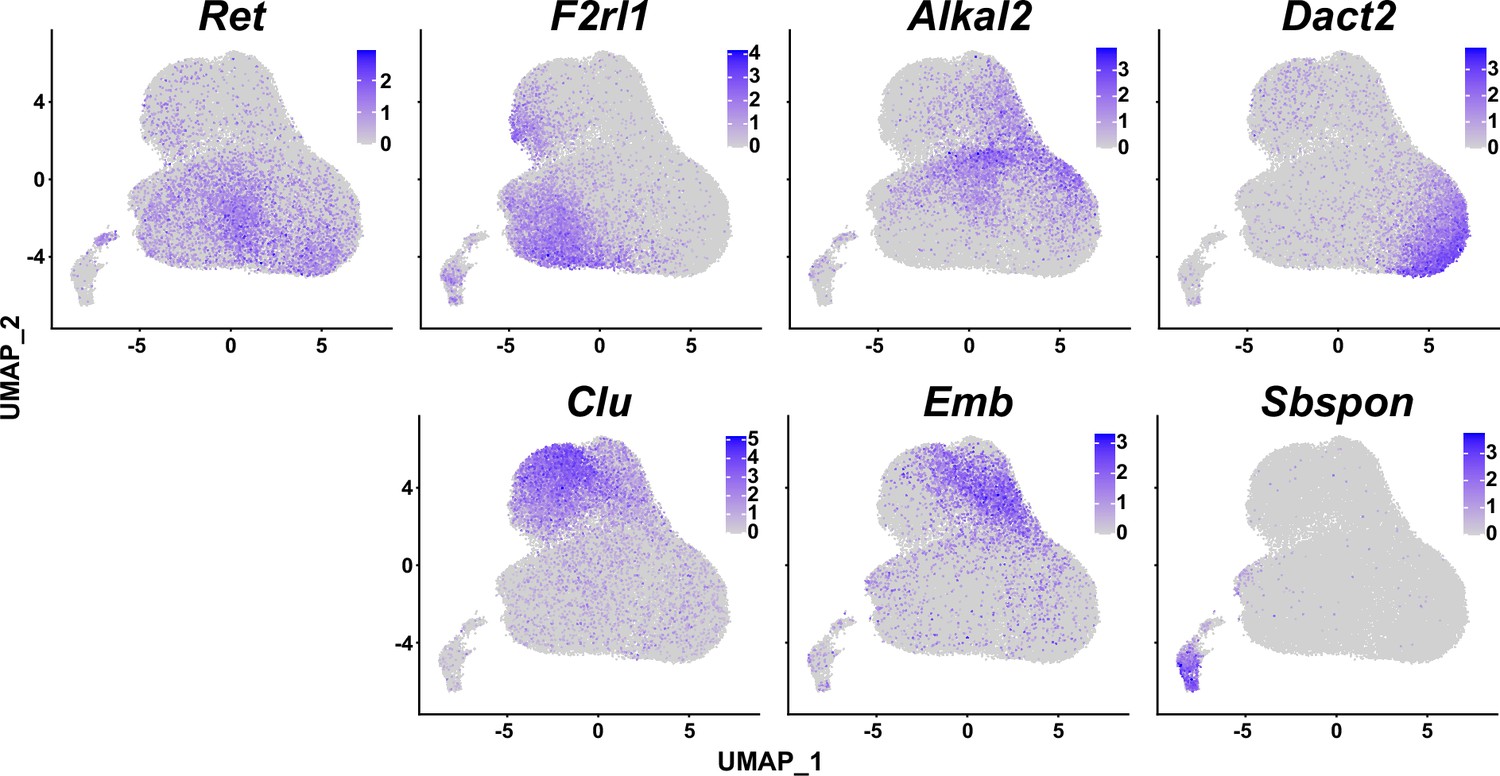
Marker gene expression in each fibro-adipogenic progenitor (FAP) cluster.
Uniform manifold approximation and projection (UMAP) plots showing expressions of cluster-specific marker genes identified in this study.
Figure 3—figure supplement 2
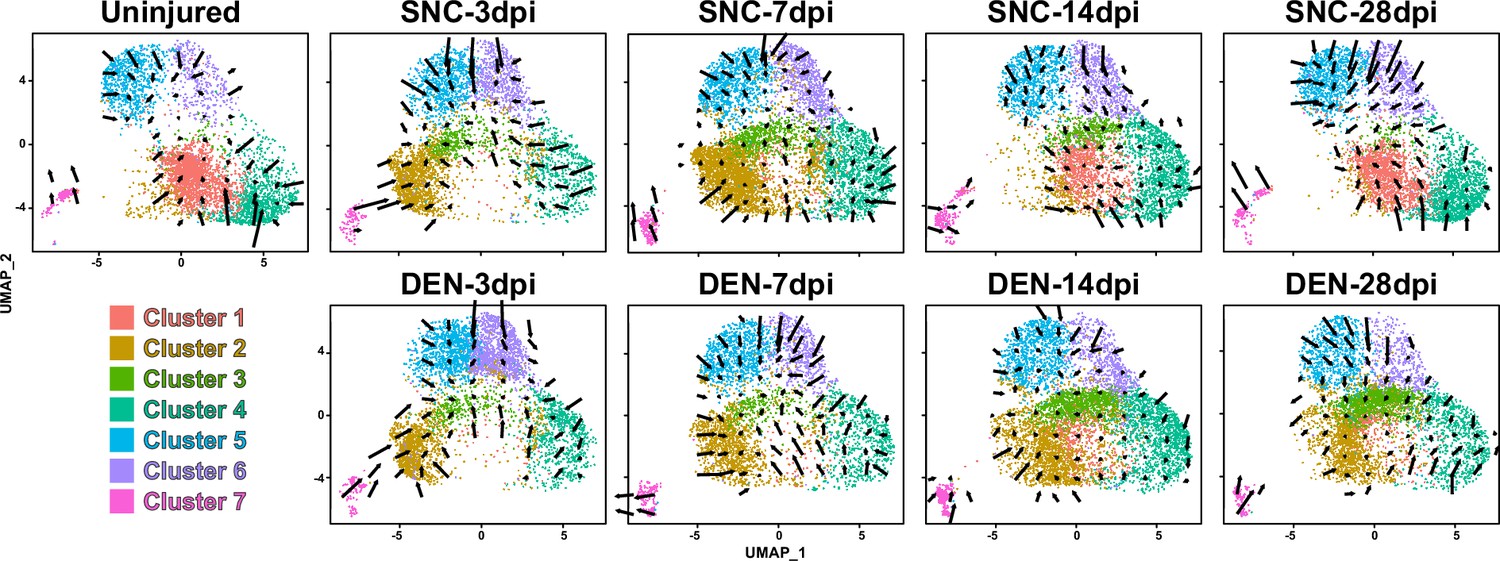
Transcriptomic flow between fibro-adipogenic progenitor (FAP) clusters.
Results from RNA velocity analysis visualized on uniform manifold approximation and projection (UMAP) plots. Arrows indicate the predicted direction of cellular movement in the near future on the UMAP plots.
Figure 3—figure supplement 3
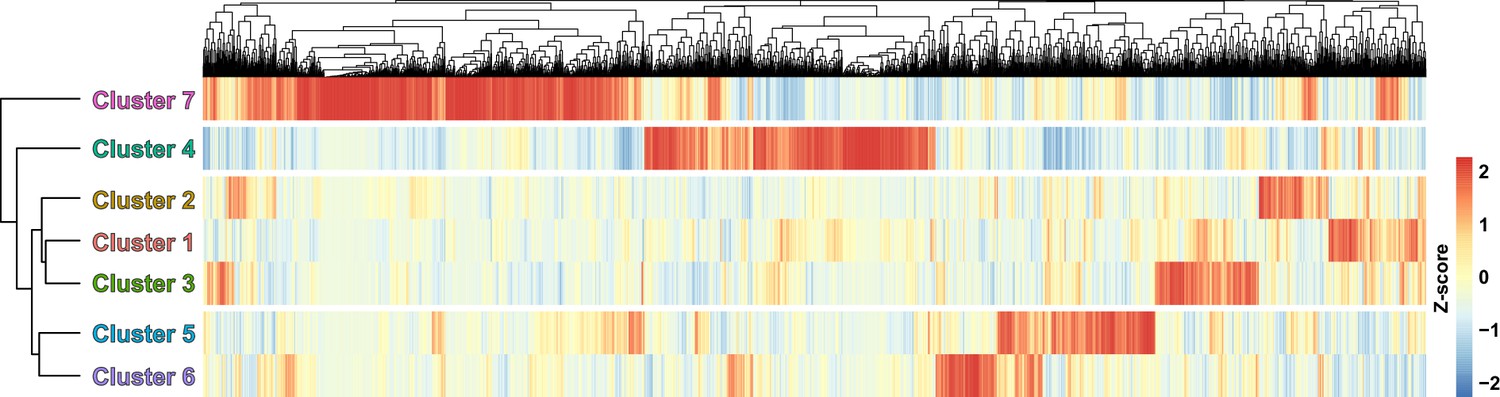
Relatedness between fibro-adipogenic progenitor (FAP) clusters.
Hierarchical clustering of the seven FAP clusters displayed with a heatmap.
Figure 3—figure supplement 4
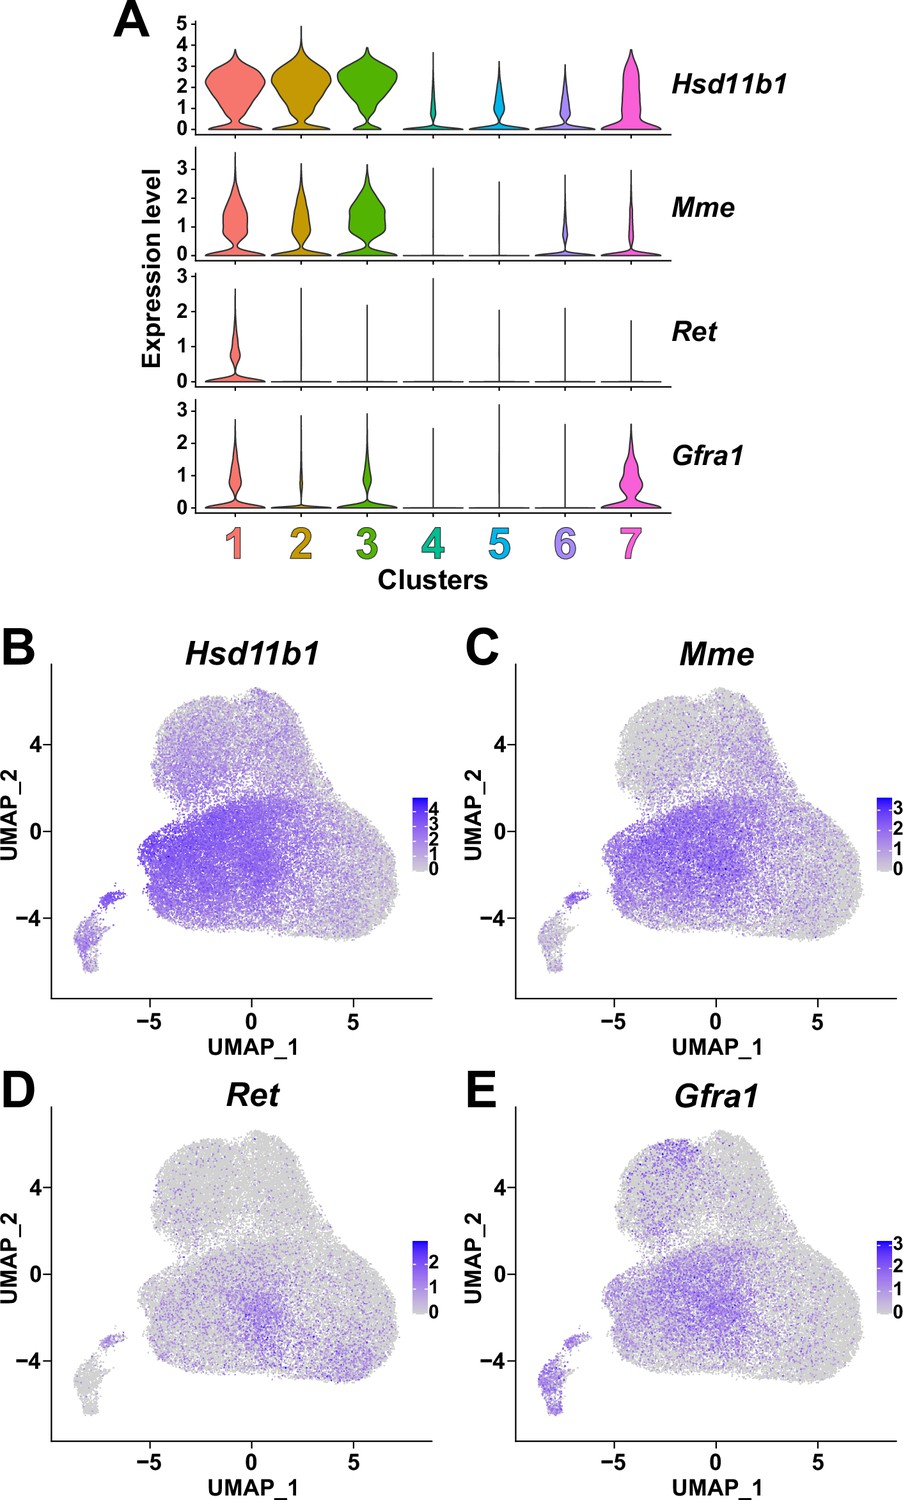
Expression of nerve transection-responsive fibro-adipogenic progenitor (FAP) subset-specific genes reported by Leinroth et al., 2022 in the seven FAP clusters identified in this study.
(A) Violin plots showing the expressions of marker genes previously reported by Leinroth et al., 2022 in the seven clusters identified in this study. (B–E) Expressions of (B) Hsd11b1, (C) Mme, (D) Ret, and (E) Gfra1 in the merged single-cell RNA-sequencing (scRNA-seq) data shown on UMAP plots.
Figure 4 with 4 supplements
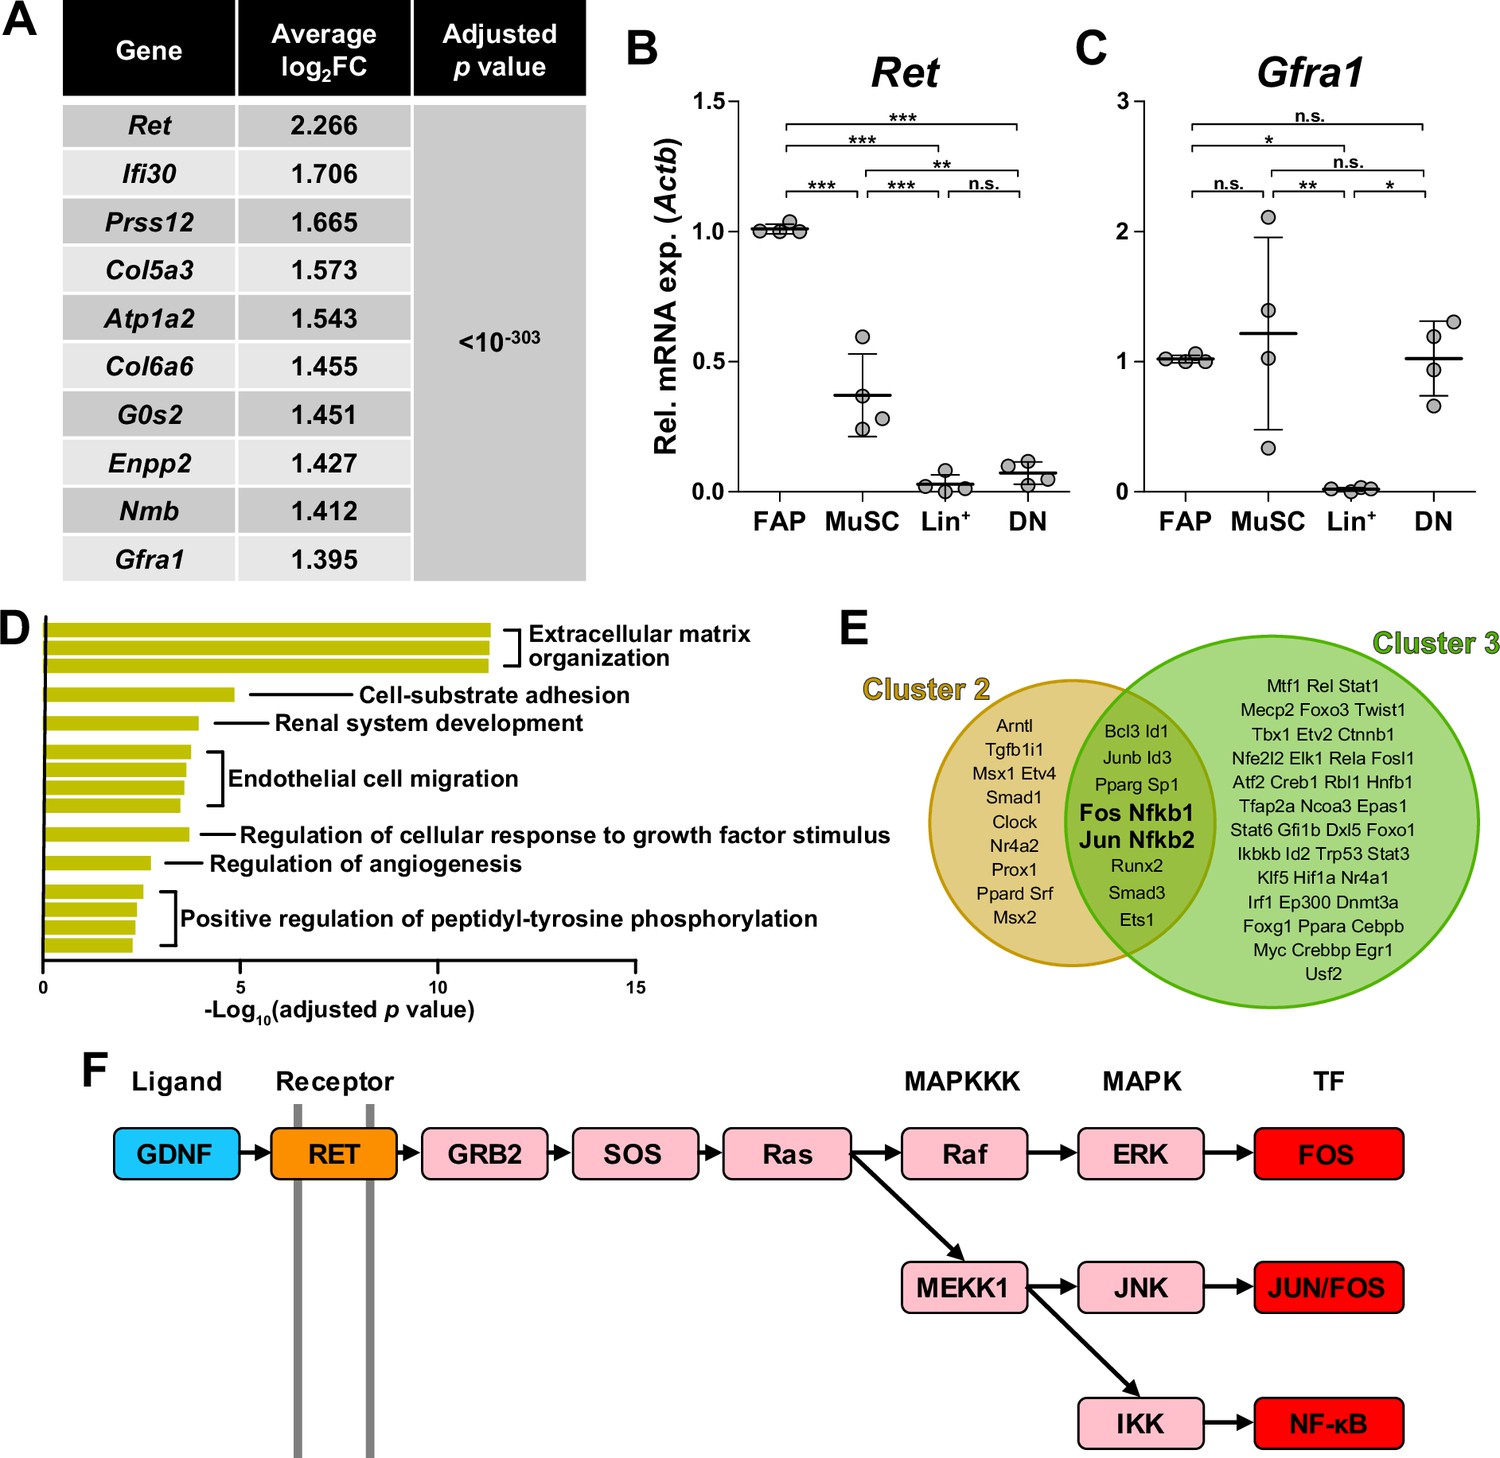
Glial cell line-derived neurotrophic factor (GDNF) signaling pathway in the nerve injury-sensing mechanism by fibro-adipogenic progenitors (FAPs).
(A) Top 10 genes specifically enriched in cluster 1 FAPs. p-values were drawn from the Wilcoxon rank sum test. (B, C) RT-qPCR results show the expressions of (B) Ret and (C) Gfra1 in mononuclear cells isolated from uninjured muscles by fluorescence-activated cell sorting (FACS). MuSC, muscle stem cells; Lin+, lineage-positive cells; DN, Vcam1/Sca1 double-negative cells. n=4; one-way ANOVA with Bonferroni’s post hoc test. *p<0.05, **p<0.01, ***p<0.001, n.s., not significant. (D) Shared pathway terms commonly identified from gene set overrepresentation analyses using differentially expressed genes (DEGs) specifically upregulated in clusters 1, 2, or 3. See Figure 4—figure supplements 1–3 for the full overrepresentation analysis (ORA) results. (E) Venn diagram showing the results from TRRUST analyses using DEGs enriched in clusters 2 and 3. Transcription factors predicted to regulate genes upregulated in each cluster are listed. (F) Simplified diagram of the GDNF/RET-MAPK signaling pathway. Blue: GDNF ligand; orange: GDNF receptor RET expressed in cluster 1; pink: downstream cascade genes expressed in clusters 1–3; red: transcription factors commonly predicted to regulate upregulated genes in clusters 2 and 3.
Figure 4—figure supplement 1
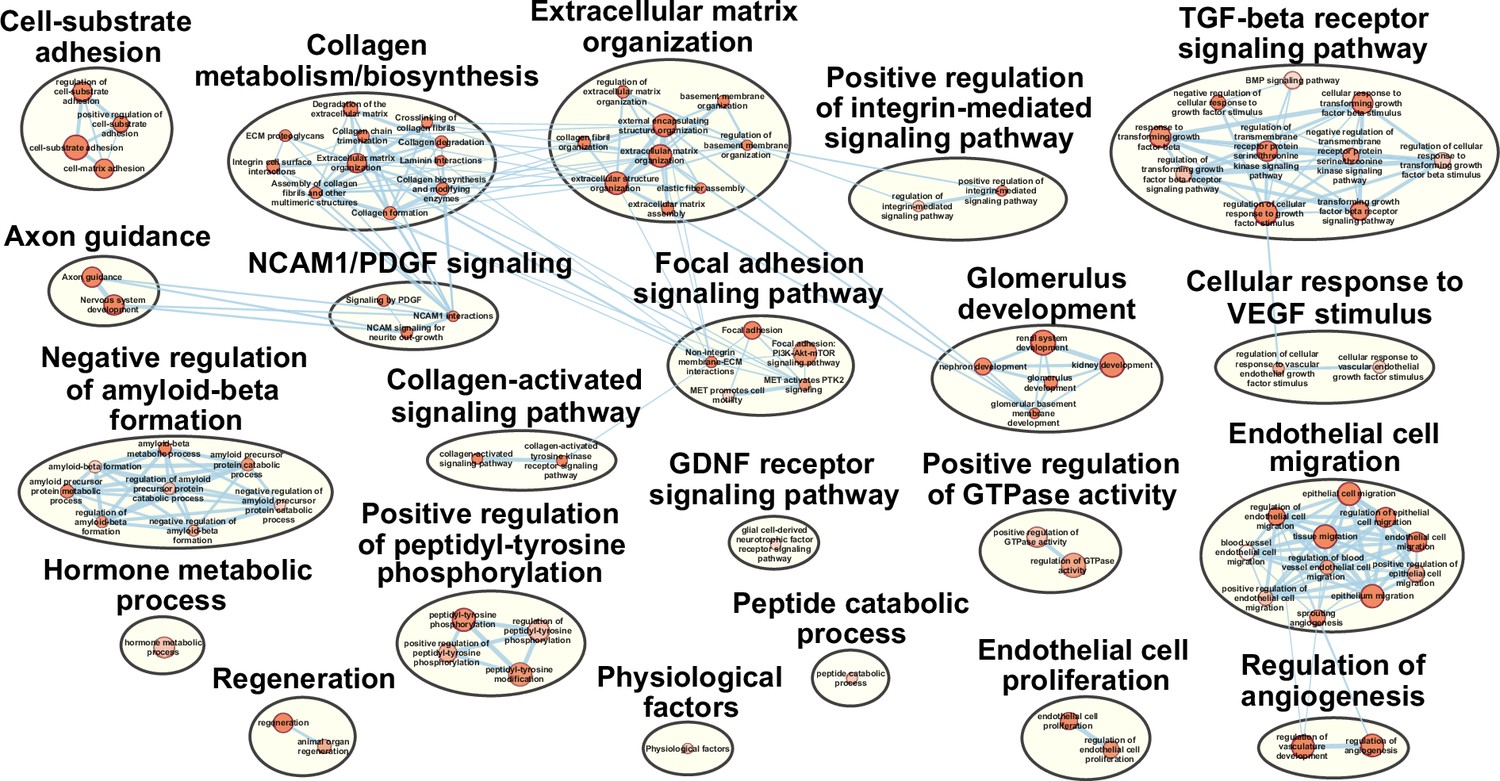
Pathway terms enriched in cluster 1 fibro-adipogenic progenitors (FAPs).
Results from g:Profiler showing pathways enriched in cluster 1 FAPs using genes specifically enriched in cluster 1.
Figure 4—figure supplement 2
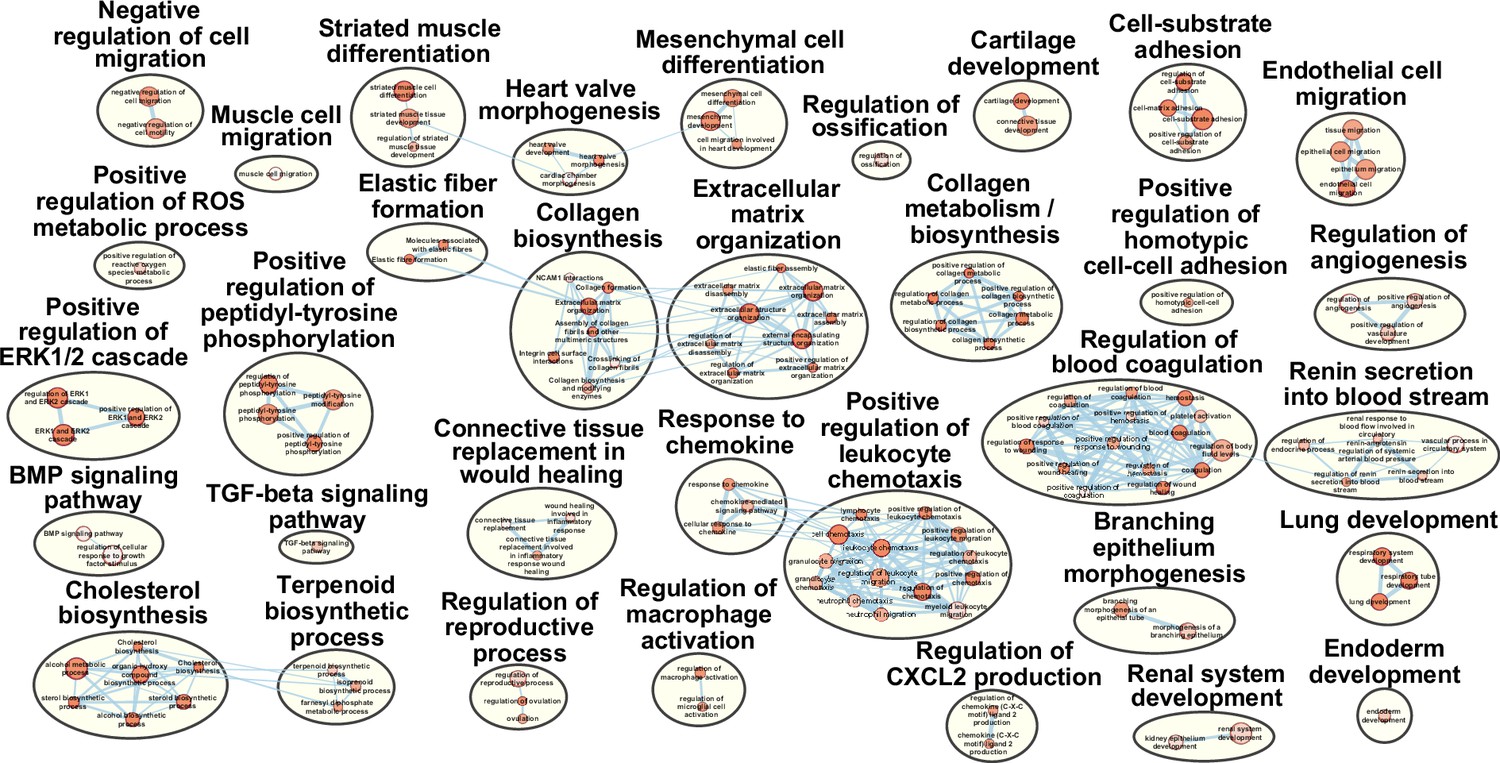
Pathway terms enriched in cluster 2 fibro-adipogenic progenitors (FAPs).
Results from g:Profiler showing pathways enriched in cluster 2 FAPs using genes specifically enriched in cluster 2.
Figure 4—figure supplement 3
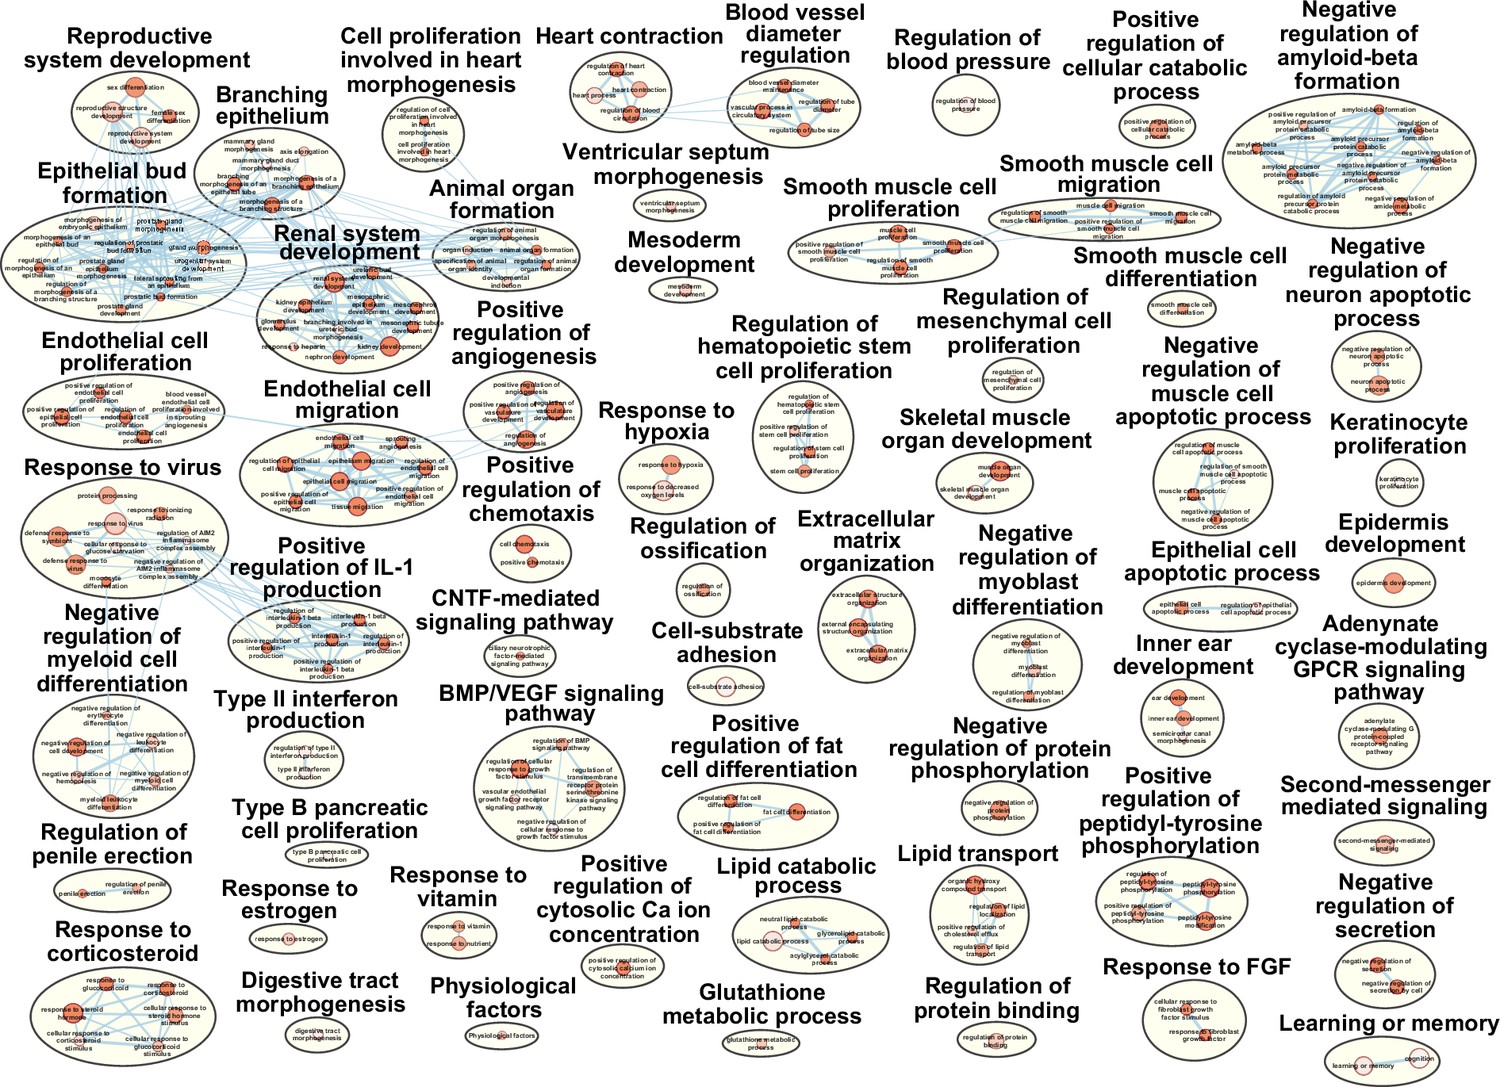
Pathway terms enriched in cluster 3 fibro-adipogenic progenitors(FAPs).
Results from g:Profiler showing pathways enriched in cluster 3 FAPs using genes specifically enriched in cluster 3.
Figure 4—figure supplement 4
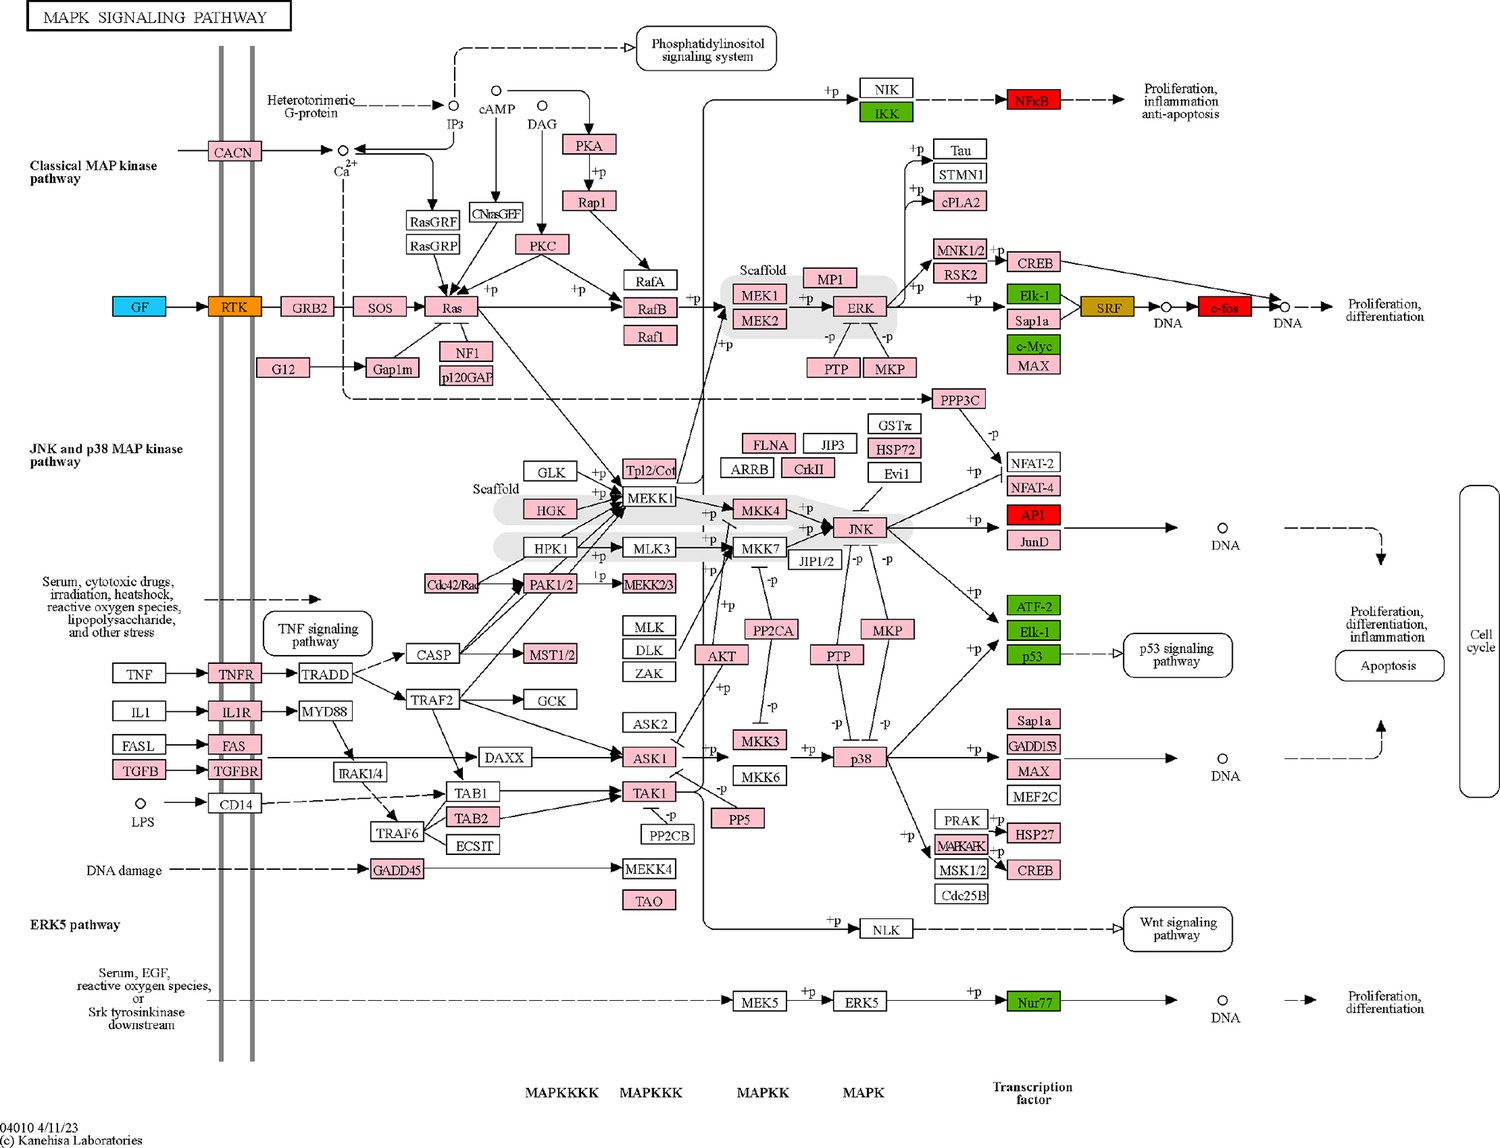
Glial cell line-derived neurotrophic factor (GDNF) signaling pathway within the MAPK signaling pathway.
MAPK signaling pathway retrieved from KEGG (Kanehisa et al., 2023), with color-coding to highlight relevant genes. Blue: GDNF ligand; orange: GDNF receptor RET expressed in cluster 1; pink: downstream cascade genes expressed in clusters 1–3; red: transcription factors (TFs) commonly predicted to regulate upregulated genes in clusters 2 and 3; green: TFs predicted to regulate genes upregulated in cluster 2; gold: TFs predicted to regulate genes upregulated in cluster 3.
© 2023, Kanehisa Laboratories. Figure 4—figure supplement 4 MAPK signaling pathway reprinted with permission from KEGG (Kanehisa et al., 2023), with color-coding to highlight relevant genes. Permission was obtained from the copyright holder Kanehisa Laboratories. It is not covered by the CC-BY 4.0 license and further reproduction of this panel would need permission from the copyright holder
Figure 5 with 2 supplements
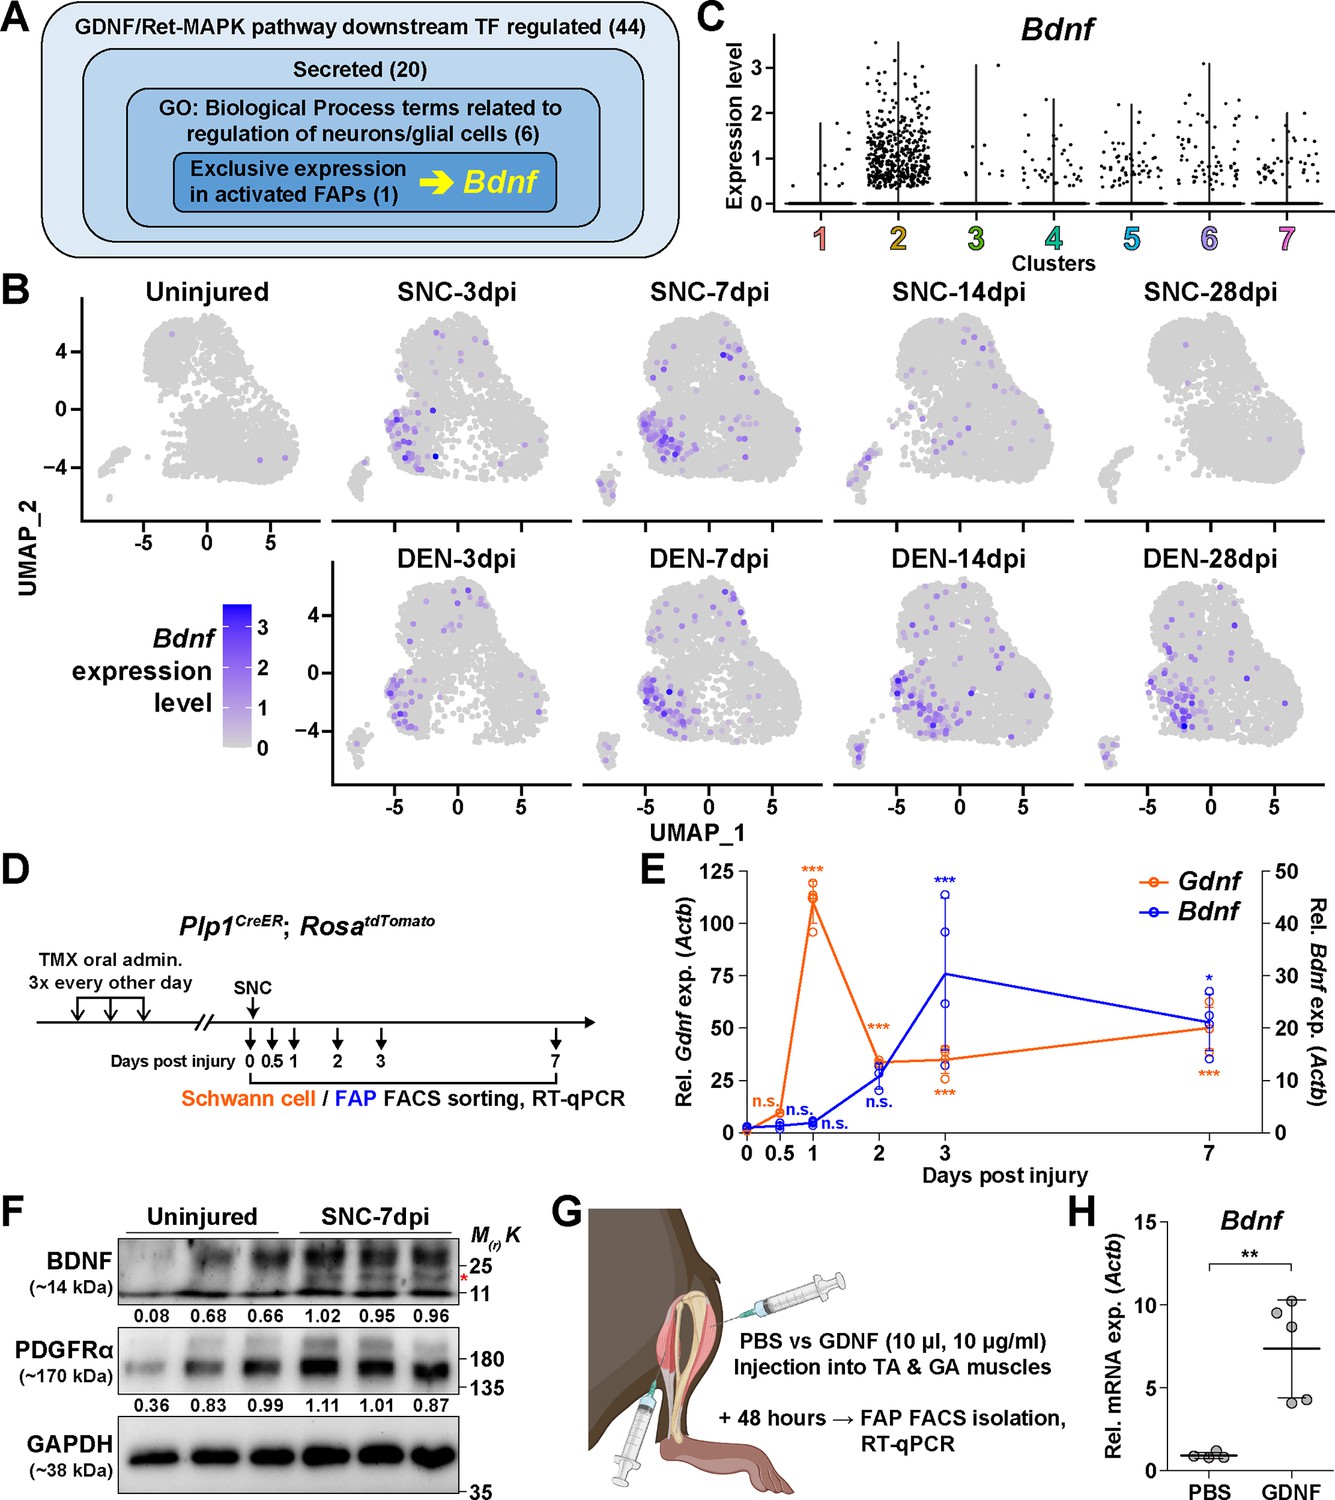
The GDNF-BDNF axis as fibro-adipogenic progenitors (FAPs) response mechanism to nerve injury.
(A) Identification of candidate genes expressed in FAPs in response to glial cell line-derived neurotrophic factor (GDNF) that may contribute to nerve regeneration. Number of genes that fit into each criterion is indicated. (B) Expression of Bdnf in each scRNA-seq sample shown on uniform manifold approximation and projection (UMAP) plots. (C) Violin plot displaying the expression levels of Bdnf in the seven FAP clusters. (D) Scheme for sampling Schwann cells and FAPs at different time points post sciatic nerve crush (SNC) for gene expression analyses. (E) RT-qPCR results showing expression levels of Gdnf in Schwann cells (orange dot and line, left y-axis) and Bdnf in FAPs (blue dot and line, right y-axis) at different time points post-SNC. n=4, except for 0 and 2 dpi, where n=3. One-way ANOVA with Bonferroni’s post hoc test. *p<0.05, ***p<0.001, n.s., not significant. (F) Western blot results showing BDNF protein expression in PDGFRα+ FAPs isolated from SNC-affected or uninjured contralateral muscles at 7 dpi. n=3. Mature form of BDNF is indicated with a red asterisk. Quantified values normalized to GAPDH is indicated below each protein. See Figure 5—figure supplement 1 for the experimental scheme. (G) Scheme for intramuscular injection of either PBS or recombinant mouse GDNF protein, with the time point for FAP isolation post-injection indicated. (H) RT-qPCR results show the expression level of Bdnf in FAPs 48 hr post intramuscular injection of either PBS (n=4) or GDNF (n=5). Unpaired t-test with Welch’s correction. **p<0.01.
© 2024, BioRender Inc. Figure 5G was created using BioRender, and is published under a CC BY-NC-ND license. Further reproductions must adhere to the terms of this license.
-
Figure 5—source data 1
The zip file contains raw western blot images, a marker image, and a marker-merged, labeled image obtained for Figure 5F.
- https://cdn.elifesciences.org/articles/97662/elife-97662-fig5-data1-v1.zip
Figure 5—figure supplement 1

Scheme for western blot analysis.
Experimental scheme depicting sample collection for fibro-adipogenic progenitor (FAP) isolation and the timeline for sciatic nerve crush (SNC) and FAP isolation for the western blot analysis done in Figure 5F.
© 2024, BioRender Inc. Figure 5—figure supplement 1 was created using BioRender, and is published under a CC BY-NC-ND license. Further reproductions must adhere to the terms of this license.
Figure 5—figure supplement 2
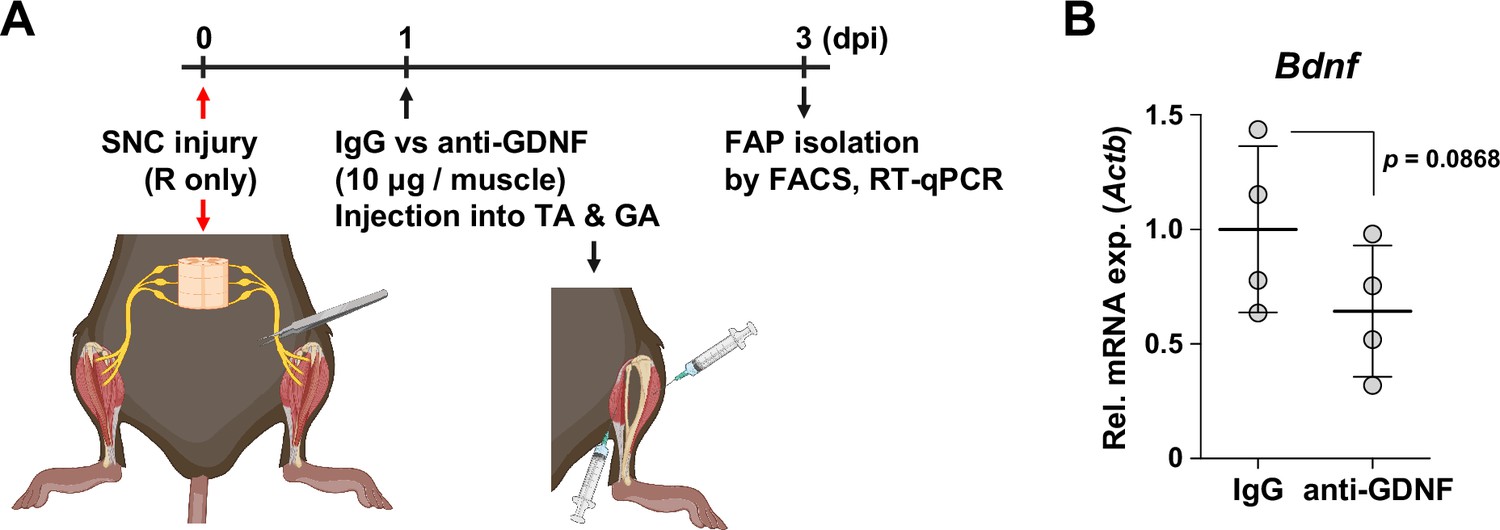
Decreased intramuscular glial cell line-derived neurotrophic factor (GDNF) activity can weaken Bdnf induction in fibro-adipogenic progenitors (FAPs) upon nerve injury.
(A) Experimental scheme depicting intramuscular injection of either anti-GDNF antibodies or IgG control after sciatic nerve crush (SNC), along with the experimental timeline. (B) RT-qPCR results show the expression levels of Bdnf in nerve injury-exposed FAPs affected by intramuscular injection of either IgG control or anti-GDNF antibodies. n=4. Unpaired t-test.
© 2024, BioRender Inc. Figure 5—figure supplement 2A was created using BioRender, and is published under a CC BY-NC-ND license. Further reproductions must adhere to the terms of this license.
Figure 6 with 1 supplement
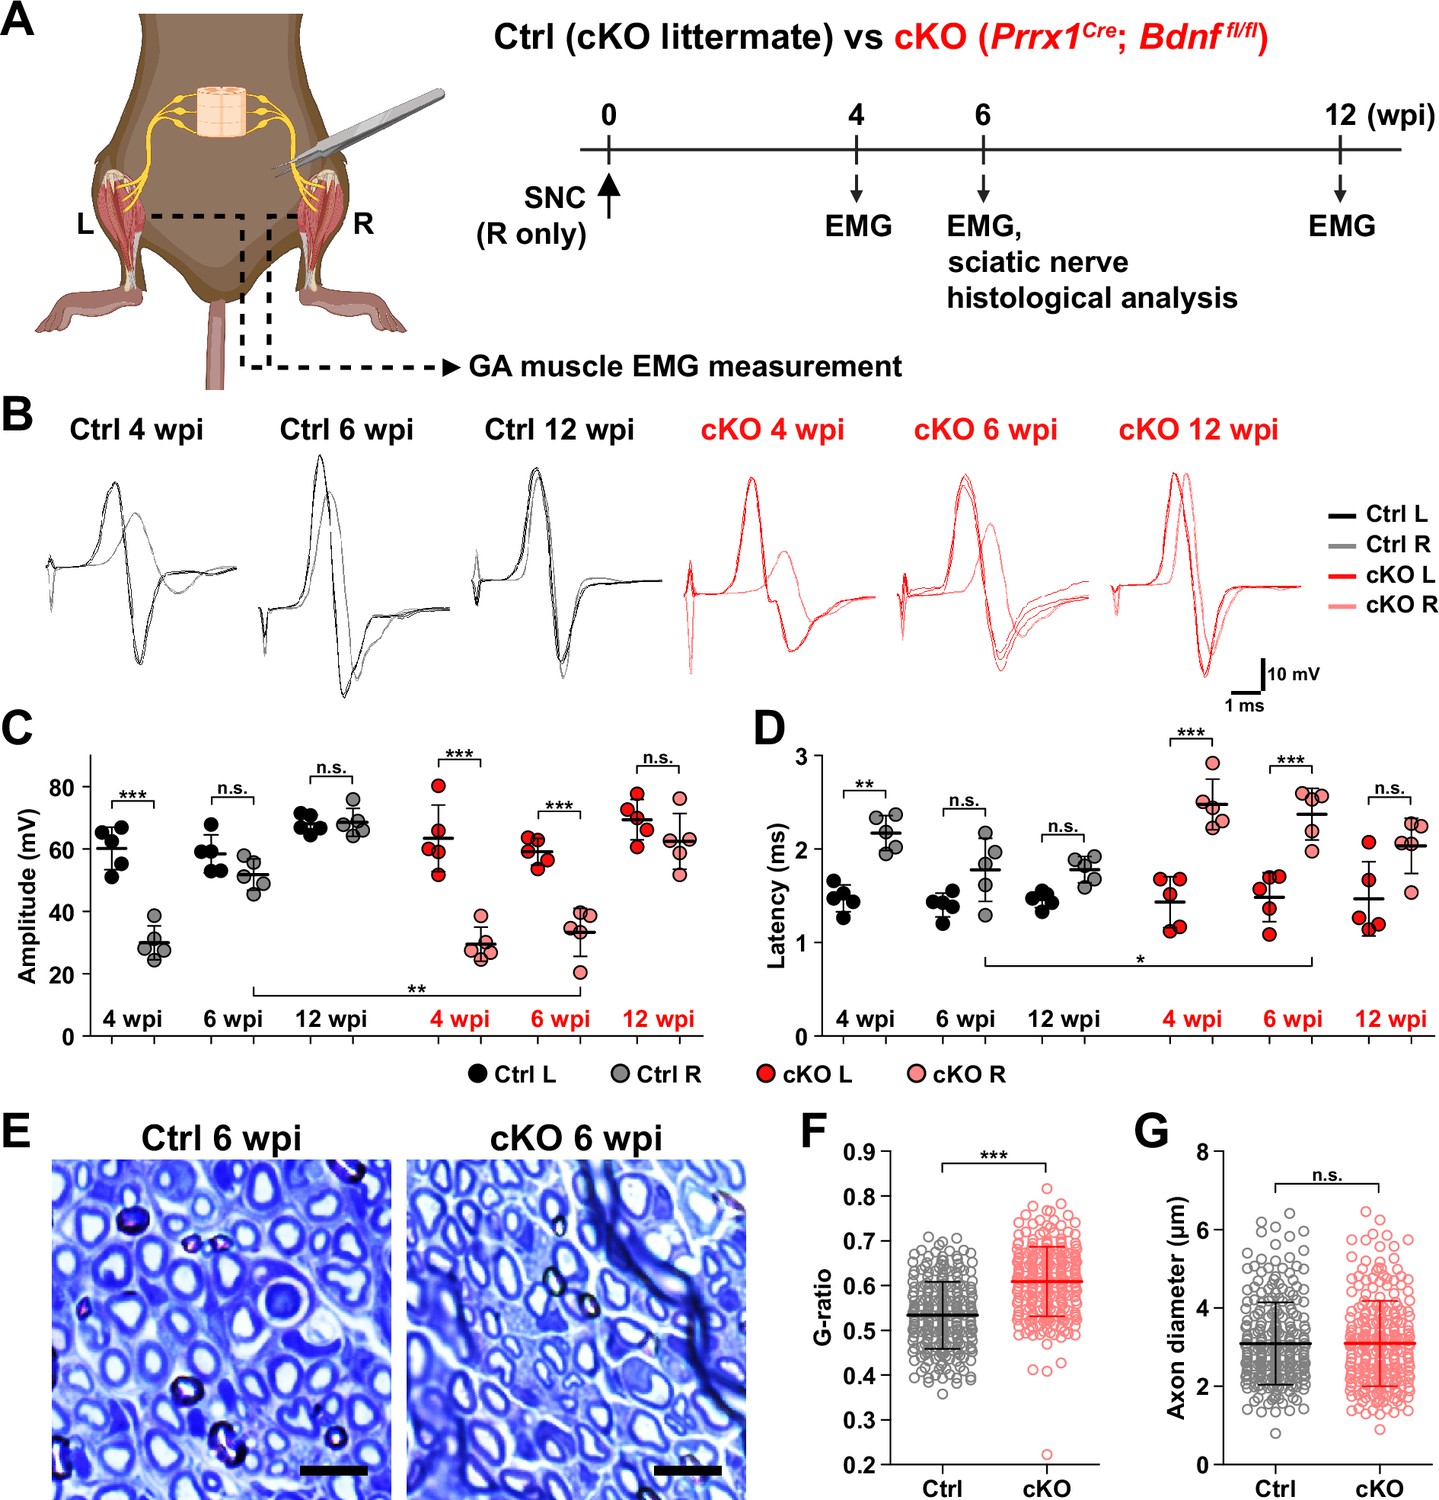
Remyelination by fibro-adipogenic progenitor (FAP)-derived BDNF during peripheral nerve regeneration.
(A) Experimental scheme displaying mice used and the time points selected for electromyography (EMG) measurements and sciatic nerve dissection. wpi, weeks post-injury. (B) Representative EMG measurement results of both injured and uninjured gastrocnemius (GA) muscles from Ctrl or conditional knockout (cKO) mice at the indicated time points post-sciatic nerve crush (SNC). (C, D) Quantified results of EMG measurement showing (C) compound muscle action potential (CMAP) amplitude and (D) CMAP latency. n=5. One-way ANOVA with Bonferroni’s post hoc test. *p<0.05, **p<0.01, ***p<0.001, n.s., not significant. (E) Representative images showing toluidine blue-stained, semi-thin cross-sections of sciatic nerves dissected from Ctrl or cKO mice at 6 wpi. Scale bars, 10 μm. (F–G) Quantification of (F) calculated G-ratio values and (G) axon diameters from analyzing toluidine blue-stained sciatic nerve sections dissected from Ctrl or cKO mice at 6 wpi. 50 axons were randomly selected from each sciatic nerve for quantification. n=5. Mann-Whitney U test. ***p<0.001, n.s., not significant.
© 2024, BioRender Inc. Figure 6A was created using BioRender, and is published under a CC BY-NC-ND license. Further reproductions must adhere to the terms of this license.
Figure 6—figure supplement 1
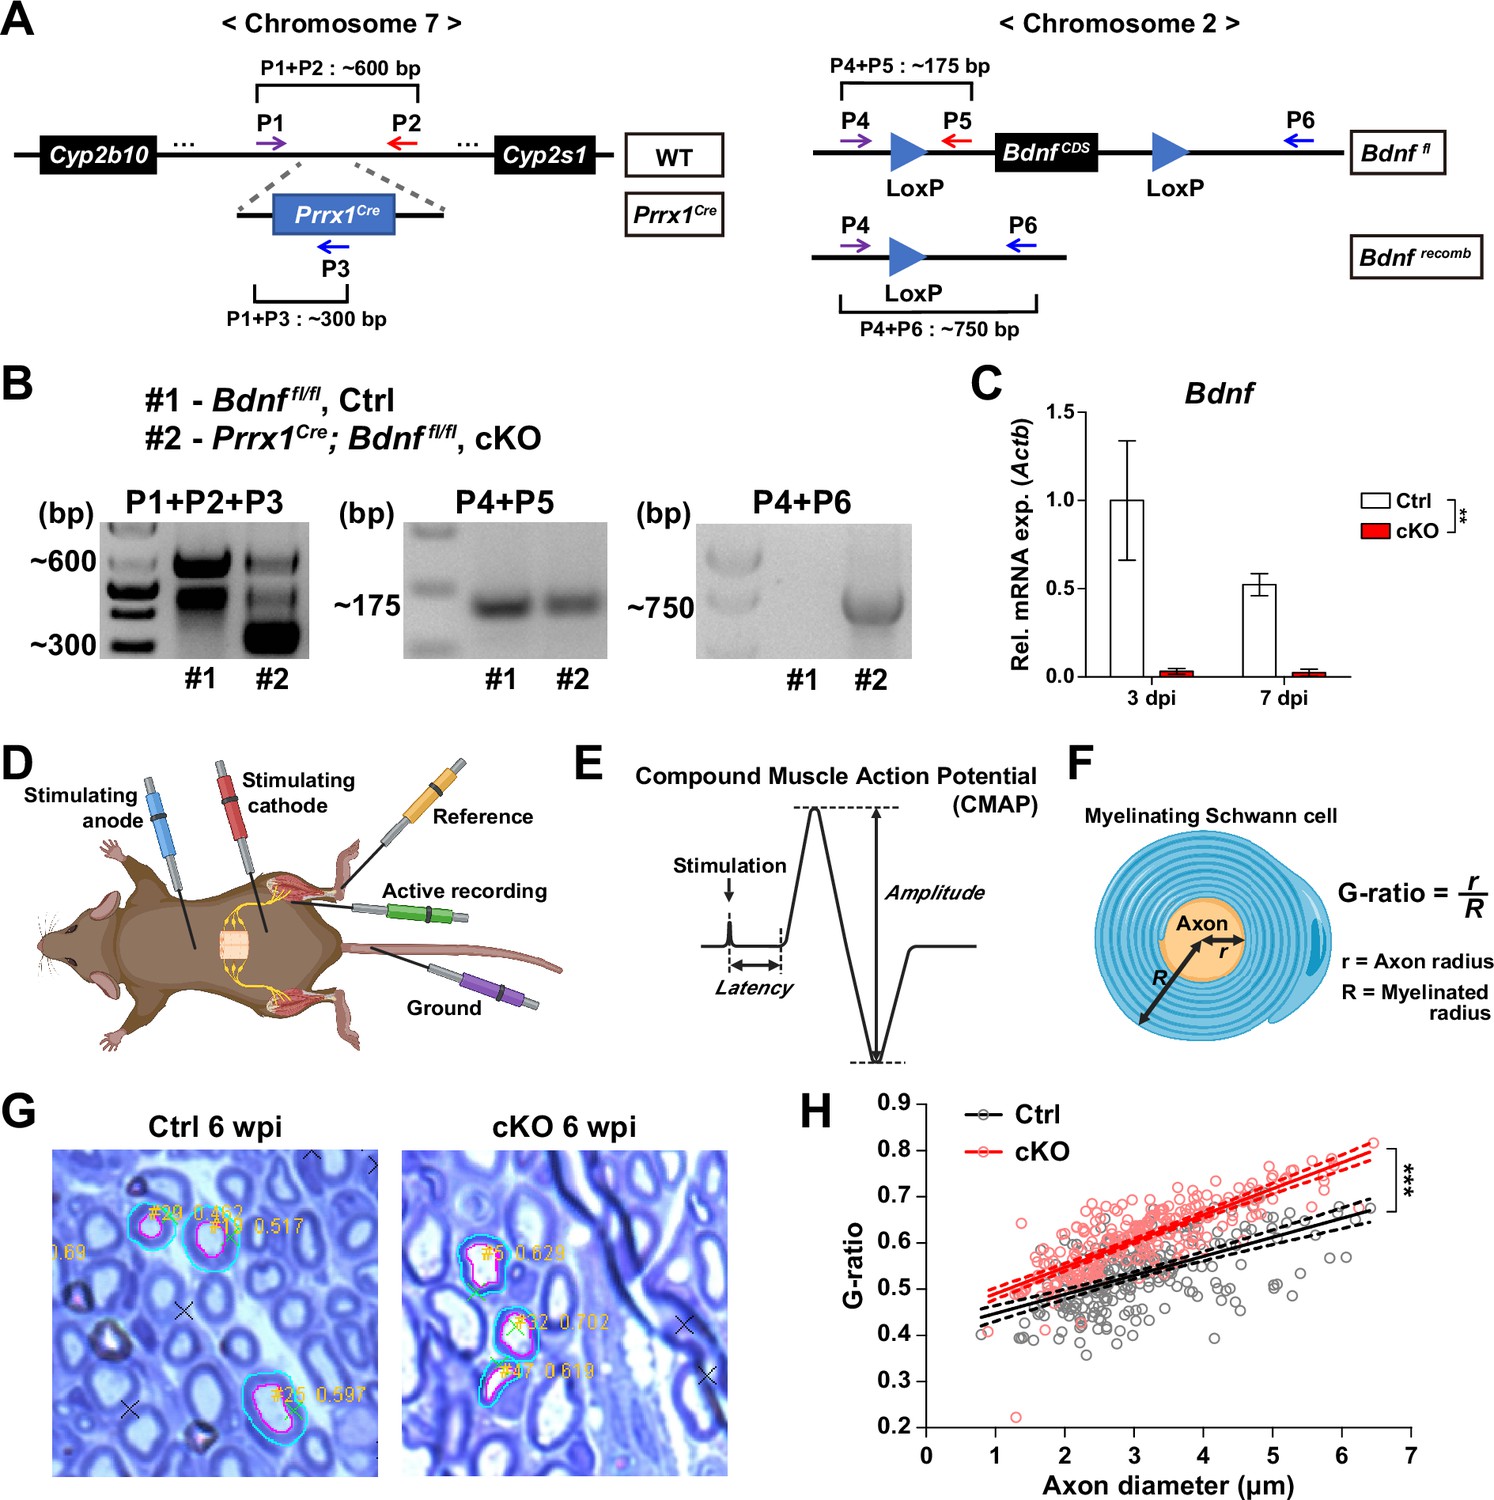
Validation of conditional knockout (cKO) mice used in this study and methods used for analysis.
(A) Genomic loci and structure of Prrx1Cre and Bdnffl alleles labeled with primers used for genotyping and genomic DNA recombination validation. (B) Results from genotyping (left and middle) and genomic DNA recombination PCR (right). Genomic DNA recombination of the LoxP flanking sites in the cKO mice were confirmed using primers P4 and P6 shown in (A). (C) RT-qPCR results of Bdnf expression using FAPs isolated from either Ctrl or cKO mice at 3 or 7 days post-sciatic nerve crush (SNC). n=2; Two-way ANOVA. **p<0.01. (D) Scheme for CMAP measurement showing the positions of electrodes used. (E) Diagram of a typical CMAP graph along with amplitude and latency used for analysis. (F) Diagram depicting calculation of G-ratio. (G) Examples of images from G-ratio quantification using ImageJ plugin GRatio for ImageJ. The outer (cyan) and inner (magenta) borders of myelin were manually drawn on randomly selected axons for quantification of axon diameter and G-ratio. (H) Scatter plots with linear regressions displaying G-ratios (y-axis) in relation to axon diameters (x-axis). Solid lines are linear regressions and dotted lines represent errors with a 95% confidence level. ANCOVA, ***p<0.001.
© 2024, BioRender Inc. Figure 6—figure supplement 1D–F was created using BioRender, and is published under a CC BY-NC-ND license. Further reproductions must adhere to the terms of this license.
-
Figure 6—figure supplement 1—source data 1
The zip file contains raw DNA electrophoresis gel images and labeled images obtained for Figure 6—figure supplement 1B.
- https://cdn.elifesciences.org/articles/97662/elife-97662-fig6-figsupp1-data1-v1.zip
Figure 7
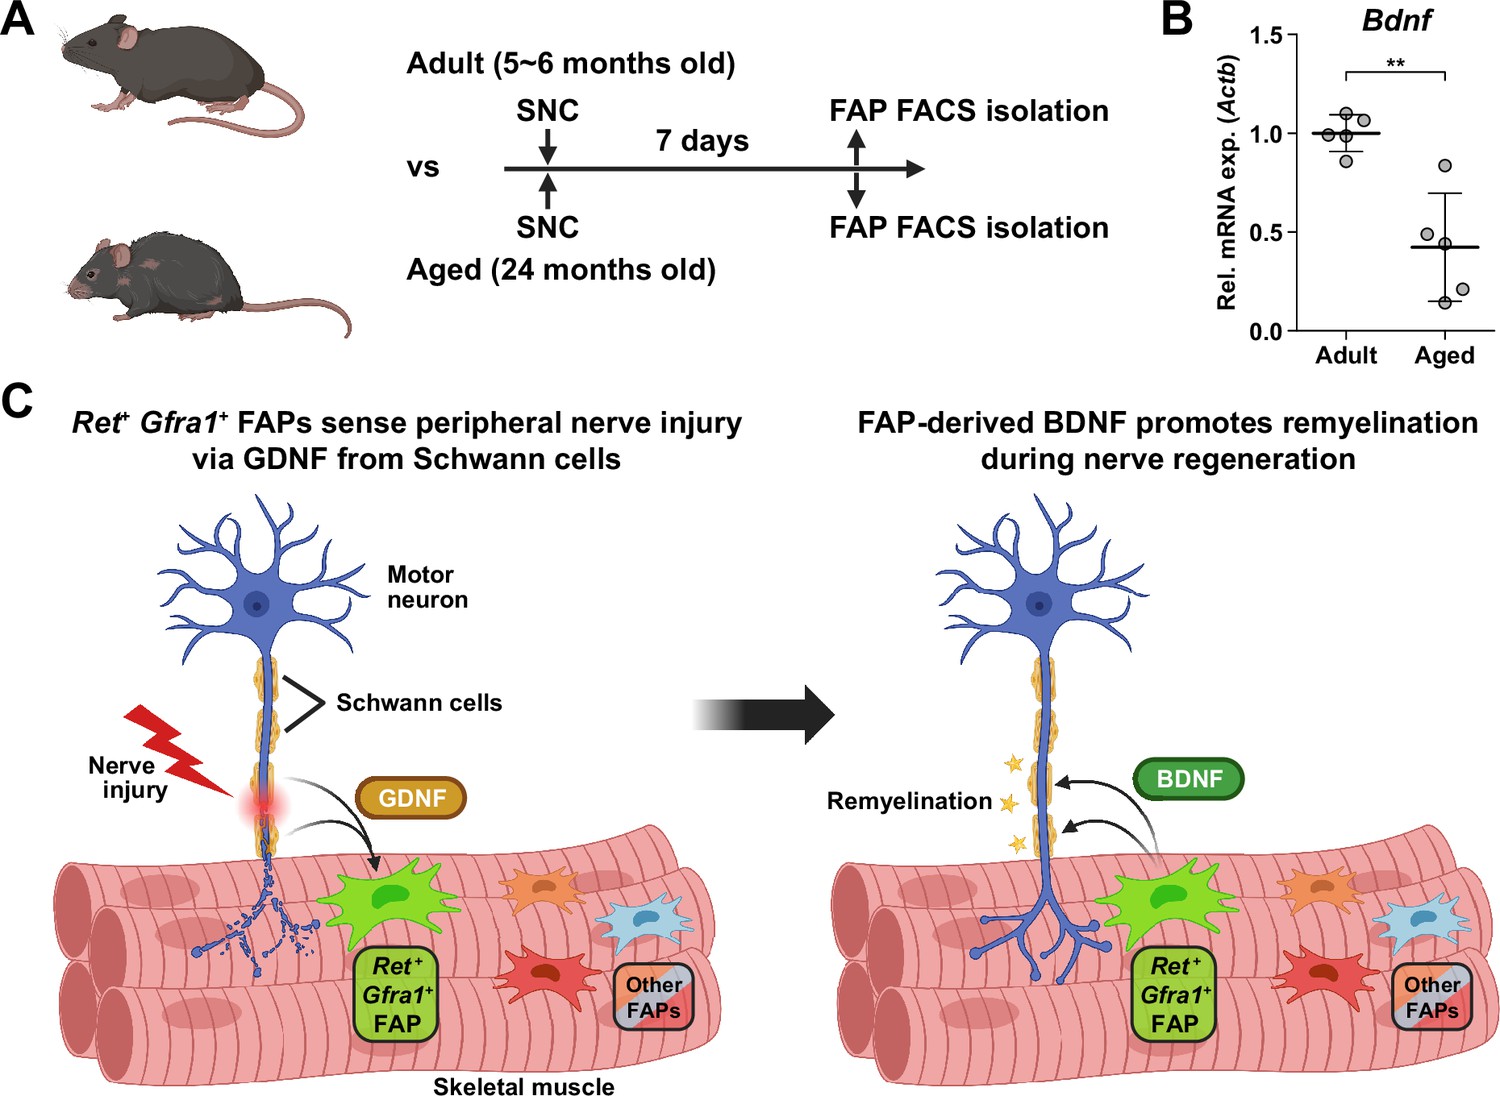
Implication of fibro-adipogenic progenitor (FAP)-derived BDNF in the age-related delay in nerve regeneration.
(A) Experimental scheme indicating the ages of mice used and the time point for FAP isolation to compare the expression level of Bdnf post-sciatic nerve crush (SNC). (B) RT-qPCR results show the expression level of Bdnf in FAPs isolated from either adult (5–6 months) or aged (24 months) mice at 7 dpi. n=5. Unpaired t-test. **p<0.01. (C) Graphical summary of this study.
© 2024, BioRender Inc. Figure 7A and C was created using BioRender, and is published under a CC BY-NC-ND license. Further reproductions must adhere to the terms of this license.
Figure 8
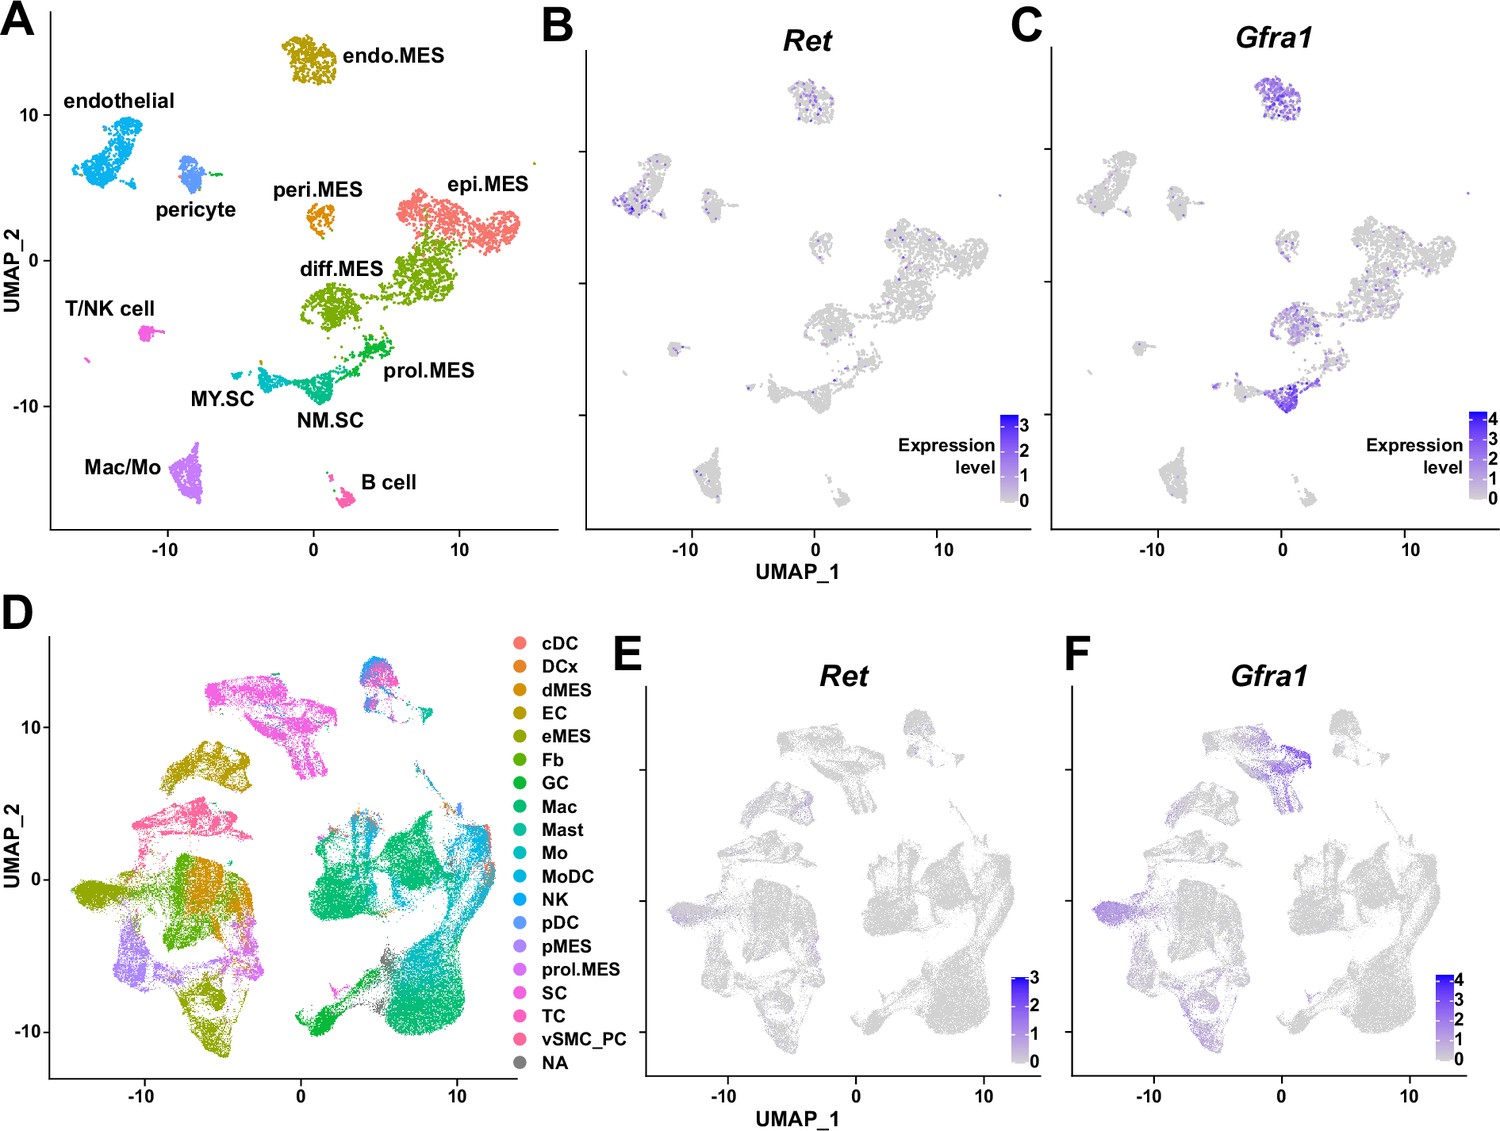
Expression of glial cell line-derived neurotrophic factor (GDNF) receptor genes Ret and Gfra1 in nerve-resident cells.
(A–C) Single-cell RNA-sequencing (scRNA-seq) data from Carr et al., 2019 and Toma et al., 2020 (accession numbers: GSM3408137, GSM3408139, GSM4423509, and GSM4423506) were merged into a single Seurat object and visualized on uniform manifold approximation and projection (UM)AP plots. Cell types identified using markers listed by Toma et al., 2020 are shown in (A), and expression levels of (B) Ret and (C) Gfra1 are displayed. epi.MES: epineurial mesenchymal cells; peri.MES: perineurial mesenchymal cells; endo.MES: endoneurial mesenchymal cells; diff.MES: differentiating mesenchymal cells; prol.MES: proliferating mesenchymal cells; NM.SC: non-myelinating Schwann cells; MY.SC: myelinating Schwann cells; Mac/Mo: macrophage/monocyte. (D–F) scRNA-seq data from Zhao et al., 2022 (accession number: GSE198582) were merged into a single Seurat object and visualized on UMAP plots. Cell types annotated by Zhao et al., 2022 are shown in (D), and expression levels of (E) Ret and (F) Gfra1 are displayed. cDC: conventional dendritic cells; DCx: dendritic cells destined for homing; dMES: differentiating mesenchymal cells; EC: endothelial cells; eMES: endoneurial mesenchymal cells; Fb: fibroblasts; GC: granulocytes; Mac: macrophages; Mast: mast cells; Mo: monocytes; MoDC: monocyte-derived dendritic cells; NK: natural killer cells; pDC: plasmocytoid dendritic cells; pMES: perineurial mesenchymal cells; prol.MES: proliferating mesenchymal cells; SC: Schwann cells; TC: T cells; vSMC_PC: vascular smooth muscle cells/pericytes; NA: not applicable.
Figure 9
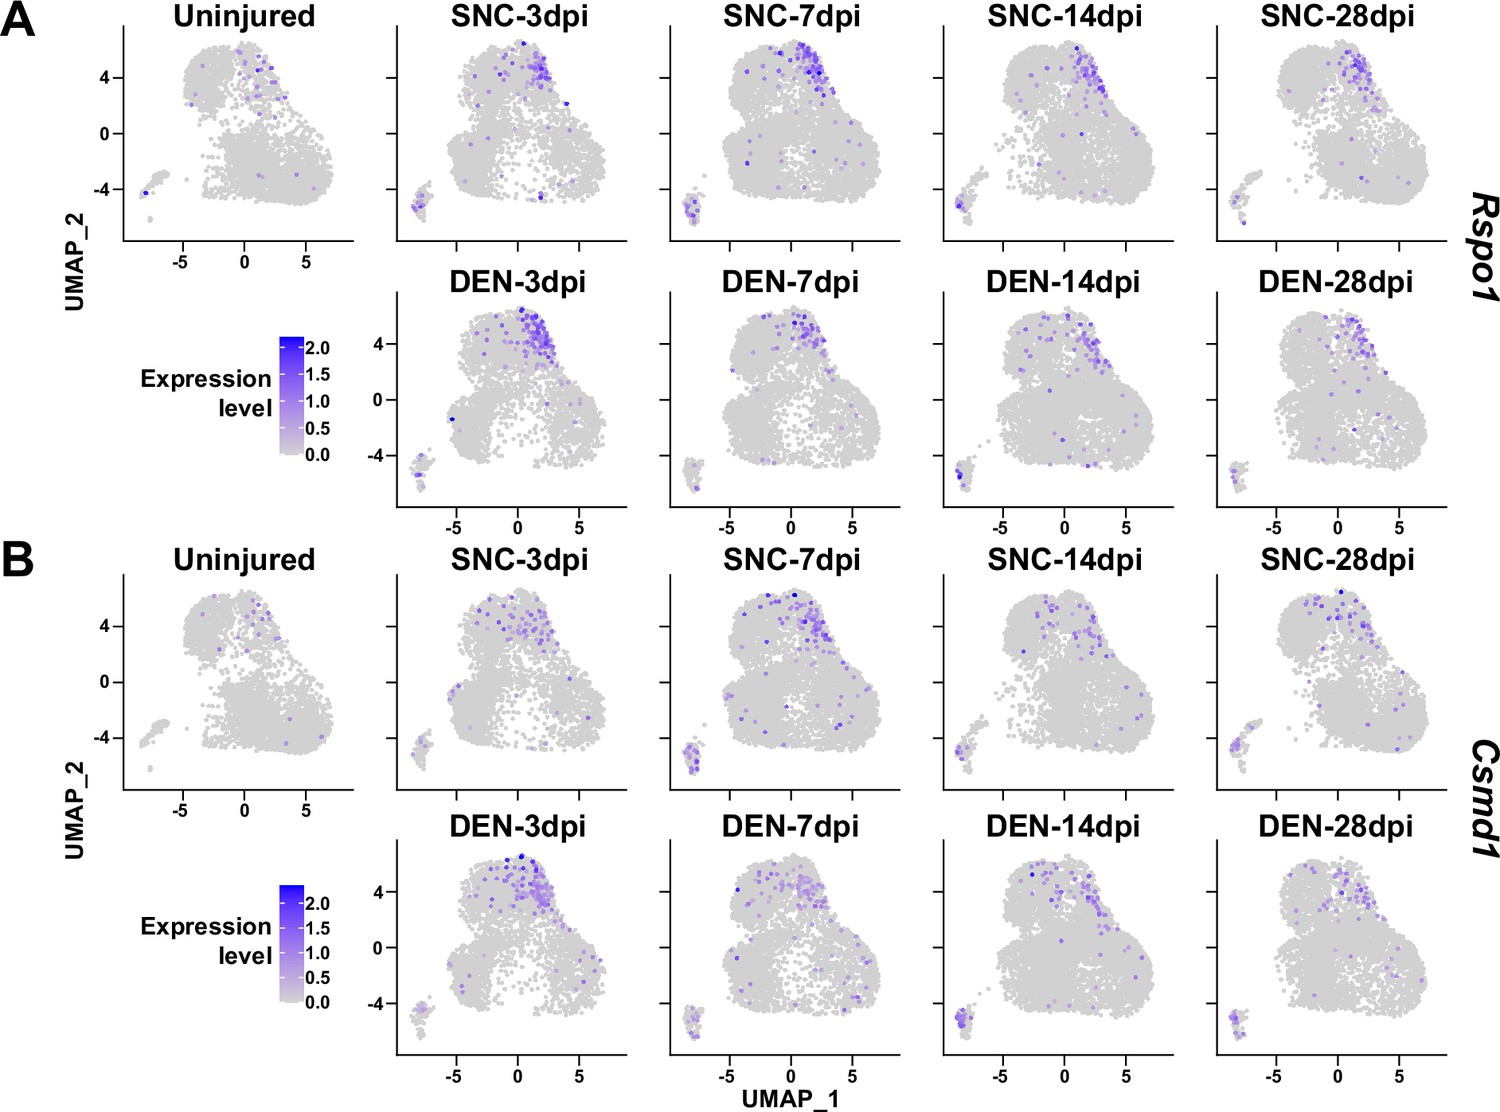
Expression of nerve injury-induced, cluster-specific genes in fibro-adipogenic progenitors (FAPs).
(A, B) Expressions of (A) Rspo1 and (B) Csmd1 are shown on uniform manifold approximation and projection (UMAP) plots, separated by samples. Single-cell RNA-sequencing (scRNA-seq) data obtained in this study were used.
Figure 10
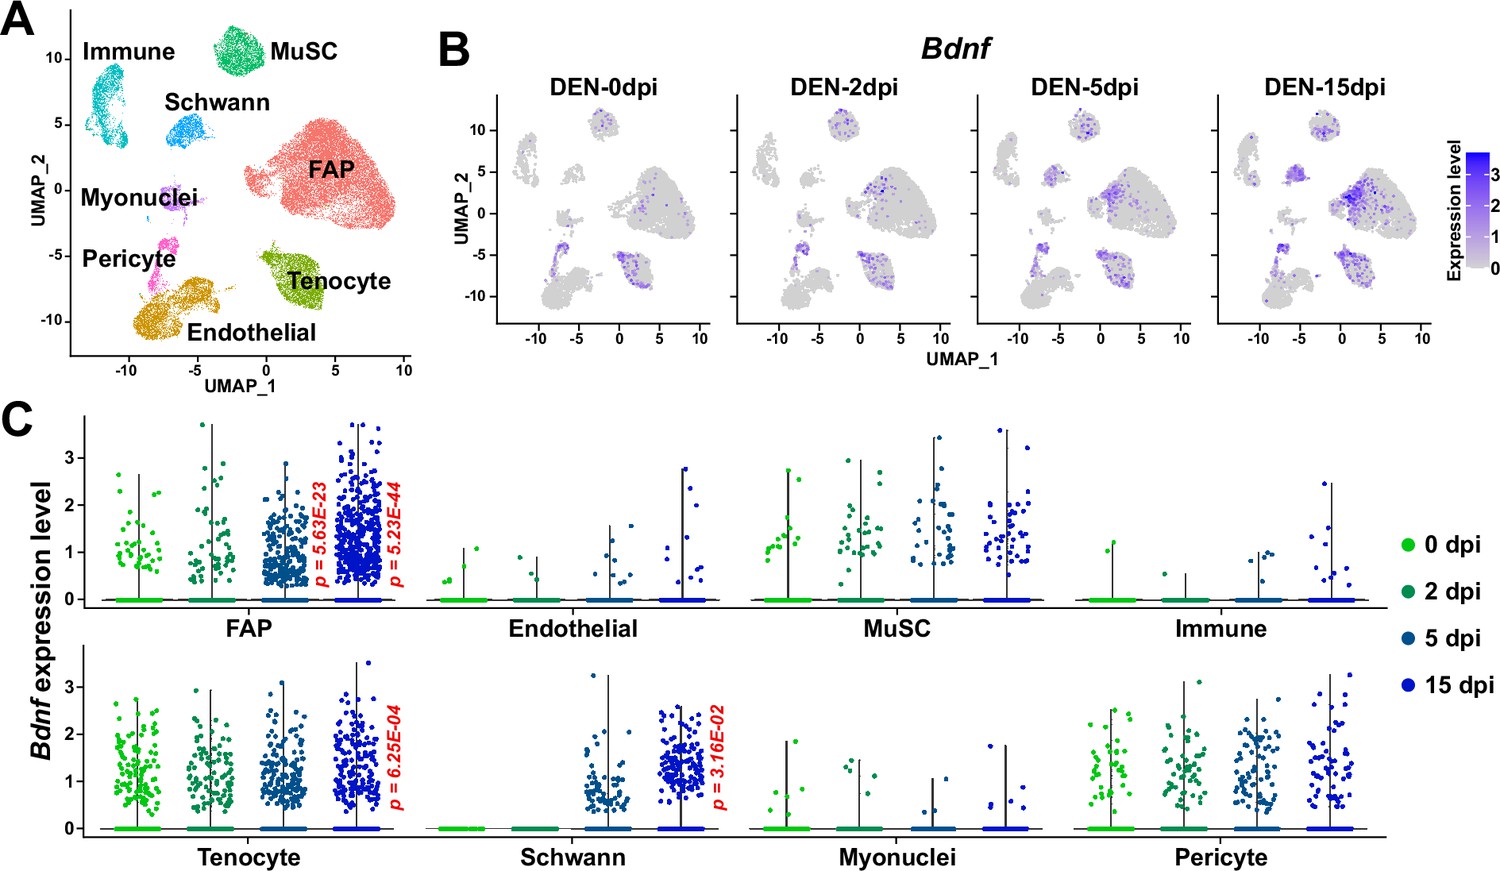
Expression of Bdnf in muscle-resident mononuclear cells affected by denervation.
(A) Uniform manifold approximation and projection (UMAP) plot showing data from Nicoletti et al., 2023 labeled by cell types identified. (B) Expression pattern of Bdnf in data from Nicoletti et al., 2023 shown on UMAP plots, separately by days post denervation. (C) Expression of Bdnf in each cell type on different days post-denervation displayed in violin plots. p-values were calculated by comparing each injury-affected cells’ expression levels versus its uninjured state (0 dpi). Only significant p-values are shown. Wilcoxon rank sum test.
Author response image 1

Expression of eYFP in muscle-resident, lineage-negative, live mononuclear cells isolated from Prrx1Cre;RosaeYFP mice.
Supplemental Figure 3A from Kim et al., 2022. Lin-: lineage-negative (CD31-CD45-); Neg.: Vcam1-Sca1-.
Author response image 2

Recombination of the floxed Bdnf gene in the mononuclear cells sorted from muscles of Prrx1Cre; Bdnffl/fl or Bdnffl/fl mice.
Genotypes and cell types sampled for each lane is specified. P4, P5, and P6 indicate primers used for each PCR. Lin+: lineage(CD31/CD45)-positive; DN: CD31-CD45-Vcam1-Sca1-.
Author response image 3

Structures of neuromuscular junctions from Ctrl vs cKO mice at 4 weeks post nerve crush injury.
Whole-mount immunostaining was done using the exterior digitorum longus muscles that were affected by sciatic nerve crush injury. Samples were stained with α-bungarotoxin (green), neurofilament (red), and synaptophysin (blue). Scale bar: 50 μm.
Tables
Key resources table
| Reagent type (species) or resource | Designation | Source or reference | Identifiers | Additional information |
|---|---|---|---|---|
| Antibody | APC anti-mouse CD31 (Rat monoclonal) | BioLegend | Cat# 102510, RRID:AB_312917 | FACS, 1:100 |
| Antibody | APC anti-mouse CD45 (Rat monoclonal) | BioLegend | Cat# 103112, RRID:AB_312977 | FACS, 1:100 |
| Antibody | PE anti-mouse TER-119 (Rat monoclonal) | Biolegend | Cat# 116208, RRID:AB_313709 | FACS, 1:100 |
| Antibody | Biotin anti-mouse CD106 (Vcam1) (Rat monoclonal) | Biolegend | Cat# 105704, RRID:AB_313205 | FACS, 1:100 |
| Antibody | FITC anti-mouse Ly-6A/E (Sca1) (Rat monoclonal) | BD Pharmingen | Cat# 553335, RRID:AB_394791 | FACS, 1:100 |
| Antibody | anti-GAPDH (rabbit polyclonal) | Bethyl Laboratories | Cat# A300-641A, RRID:AB_513619 | WB, 1:1000 |
| Antibody | anti-PDGFRα (rabbit polyclonal) | Santa Cruz Biotechnology | Cat# sc-338, RRID:AB_631064 | WB, 1:200 |
| Antibody | anti-BDNF (rabbit polyclonal) | Alomone Labs | Cat# ANT-010, RRID:AB_2039756 | WB, 1:1000 |
| Antibody | anti-GDNF (rabbit polyclonal) | Alomone Labs | Cat# ANT-014, RRID:AB_2039876 | 10 μg per injection |
| Antibody | Normal rabbit IgG (polyclonal) | Sino Biological | Cat# CR1, RRID:AB_3073921 | 10 μg per injection |
| Antibody | horseradish peroxidase-conjugated anti-rabbit IgG (goat polyclonal) | Promega | Cat# W4011, RRID:AB_430833 | 1:10,000 |
| Chemical compound, drug | Tamoxifen | Sigma-Aldrich | Cat# T5648 | |
| Chemical compound, drug | 2,2,2-Tribromoethanol (Avertin) | Sigma-Aldrich | Cat# T48402 | |
| Chemical compound, drug | 7-aminoactinomycin D (7-AAD) | Sigma-Aldrich | Cat# SML1633 | 1:1000 |
| Chemical compound, drug | PE/Cyanine7 Streptavidin | Biolegend | Cat# 405206 | 1:100 |
| Chemical compound, drug | TRIzol Reagent | Invitrogen | Cat# 15596–018 | |
| Chemical compound, drug | Paraformaldehyde | Sigma-Aldrich | Cat# P6148 | |
| Chemical compound, drug | Sodium cacodylate buffer | Electron Microscopy Sciences | Cat# 11652 | |
| Chemical compound, drug | Osmium tetroxide | Electron Microscopy Sciences | Cat# 19190 | |
| Chemical compound, drug | Uranyl acetate solution | Electron Microscopy Sciences | Cat# 22400 | |
| Chemical compound, drug | Propylene oxide | Tokyo Chemical Industry | Cat# E0016 | |
| Chemical compound, drug | Spurr’s resin | Electron Microscopy Sciences | Cat# 14300 | |
| Chemical compound, drug | Toluidine blue | Sigma-Aldrich | Cat# 89640 | |
| Chemical compound, drug | Sodium borate | Sigma-Aldrich | Cat# B9876 | |
| Strain, strain background (Mus musculus) | wild type B6: C57BL/6 J | The Jackson Laboratory | RRID:IMSR_JAX:000664 | |
| Strain, strain background (Mus musculus) | Prrx1Cre: B6.Cg-Tg(Prrx1-cre)1Cjt/J | The Jackson Laboratory | RRID:IMSR_JAX:005584 | |
| Strain, strain background (Mus musculus) | Bdnffl: Bdnftm3Jae/J | The Jackson Laboratory | RRID:IMSR_JAX:004339 | |
| Strain, strain background (Mus musculus) | Plp1CreER: B6.Cg-Tg(Plp1-cre/ERT)3Pop/J | The Jackson Laboratory | RRID:IMSR_JAX:005975 | |
| Strain, strain background (Mus musculus) | Rosa26LSL-tdTomato: B6.Cg-Gt(ROSA)26Sortm14(CAG-tdTomato)Hze/J | The Jackson Laboratory | RRID:IMSR_JAX:007914 | |
| Peptide, recombinant protein | Recombinant mouse GDNF | Sigma-Aldrich | Cat# SRP3200 | 10 μg/ml, 10 μl per injection |
| Commercial assay or kit | Chromium Next GEM Single Cell 3ʹ Kit v3.1 | 10 X Genomics | Cat# PN-1000268 | |
| Commercial assay or kit | ReverTra Ace qPCR RT Master Mix | Toyobo | Cat# FSQ-201 | |
| Commercial assay or kit | ORA SEE qPCR Green ROX L Mix | HighQu | Cat# QPD0550 | |
| Software, algorithm | CellRanger v3.1.0 | 10 X Genomics | RRID:SCR_023221 | |
| Software, algorithm | Velocyto v0.17 | La Manno et al., 2018 | RRID:SCR_018167 | |
| Software, algorithm | R package Seurat v4.3.0 | Hao et al., 2021 | RRID:SCR_016341 | |
| Software, algorithm | R package SeuratWrappers v0.3.1 | Satija Lab | RRID:SCR_022555 | |
| Software, algorithm | R package pheatmap v1.0.12 | pheatmap | RRID:SCR_016418 | |
| Software, algorithm | R package velocyto.R v0.6 | La Manno et al., 2018 | RRID:SCR_018167 | |
| Software, algorithm | Cytoscape v3.10.1 | Shannon et al., 2003 | RRID:SCR_003032 | |
| Software, algorithm | EnrichmentMap v3.3.6 | Merico et al., 2010 | RRID:SCR_016052 | |
| Software, algorithm | AutoAnnotate v1.4.1 | Kucera et al., 2016 | https://apps.cytoscape.org/apps/autoannotate | |
| Software, algorithm | ImageJ v1.51 | NIH | RRID:SCR_003070 | |
| Software, algorithm | GRatio for ImageJ | Goebbels et al., 2010 | RRID:SCR_015580 | http://gratio.efil.de/ |
| Software, algorithm | Prism v5.01 | GraphPad | RRID:SCR_002798 | |
| Software, algorithm | R v4.2.1 | The R Project for Statistical Computing | RRID:SCR_001905 | |
| Other | DMEM/High glucose | HyClone | Cat# SH30243.01 | Medium used during FACS isolation of cells |
| Other | Horse serum, heat inactivated | Gibco | Cat# 26050–088 | Serum used during FACS isolation of cells |
| Other | Collagenase, type 2 | Worthington Biochemical | Cat# LS004177 | Dissociation enzyme used during FACS isolation of cells |
| Other | Dispase II | Gibco | Cat# 17105–041 | Dissociation enzyme used during FACS isolation of cells |
| Other | HiSeq X Ten | Illumina | Cat# SY-412–1001 | scRNA-seq device |
| Other | TRRUST v2 | Han et al., 2018 | RRID:SCR_022554 | https://www.grnpedia.org/trrust/ |
| Other | KEGG PATHWAY Database | Kanehisa Laboratories | RRID:SCR_018145 | https://www.genome.jp/kegg/pathway.html |
| Other | g:Profiler | Kolberg et al., 2023 | RRID:SCR_006809 | https://biit.cs.ut.ee/gprofiler/gost |
| Other | Isolated Pulse Stimulator | A-M Systems | Model 2100 | Electric pulse generator used during CMAP measurement |
| Other | Data Recorder | iWorx | IX-RA-834 | Data recorder used during CMAP measurement |
| Other | Ultramicrotome | Leica | EM UC7 | Used for sciatic nerve semi-thin section generation |
| Other | Light microscope | Thermo Fisher Scientific | EVOS FL Auto 2 | Used for imaging toluidine blue-stained sciatic nerve sections |
Additional files
-
Supplementary file 1
Supplemental tables showing results from TRRUST analyses, candidate effector gene categorization, and primer sequences used in this study.
(a) Results from TRRUST show transcription factors predicted to regulate genes specifically enriched in cluster 2. Genes known to be regulated by each transcription factor is listed. (b) Results from TRRUST showing transcription factors predicted to regulate genes specifically enriched in cluster 3. Genes known to be regulated by each transcription factor is listed. (c) Categorization of genes predicted to be regulated by transcription factors that act downstream of the glial cell line-derived neurotrophic factor (GDNF) signaling pathway. Note that only Bdnf fits into all three criteria. (d) Primers used in this study for genotyping PCR or RT-qPCR.
- https://cdn.elifesciences.org/articles/97662/elife-97662-supp1-v1.docx
-
MDAR checklist
- https://cdn.elifesciences.org/articles/97662/elife-97662-mdarchecklist1-v1.pdf
Download links
A two-part list of links to download the article, or parts of the article, in various formats.
Downloads (link to download the article as PDF)
Open citations (links to open the citations from this article in various online reference manager services)
Cite this article (links to download the citations from this article in formats compatible with various reference manager tools)
Muscle-resident mesenchymal progenitors sense and repair peripheral nerve injury via the GDNF-BDNF axis
eLife 13:RP97662.
https://doi.org/10.7554/eLife.97662.3


