Laminar specificity and coverage of viral-mediated gene expression restricted to GABAergic interneurons and their parvalbumin subclass in marmoset primary visual cortex
- Department of Ophthalmology and Visual Science, Moran Eye Institute, University of Utah, United States
- Regel Therapeutics, United States
Figures
Figure 1

Laminar expression of GABA and PV immunoreactivity in marmoset V1.
Epifluorescence images of the same V1 section triple-stained for GABA- (red channel) and PV- (green channel) immunohistochemistry (IHC) and DAPI (blue channel), showing individual and merged channels. (A) GABA+ expression through all cortical layers (top). Dashed contours mark layer boundaries; solid contour marks the bottom of the cortex. Cortical layers are indicated. Scale bar: 500 µm (valid for the top panels in A–C). Middle: V1 region inside the yellow box in (A) shown at higher magnification. The cells inside the yellow box are shown at higher magnification in the bottom panel. Scale bar: 100 µm (valid for the middle panels in A, B and the top panel in D). Bottom: scale bar: 25 µm (valid for the bottom panels in A–C). (B) Same as in (A) but for PV+ expression. (C) DAPI stain used to reveal cortical layers. (D) Merge of red (GABA) and green (PV) channels shown in the respective panels to the left. Arrows point to double-labeled cells.
Figure 2

Laminar distribution of GABA+ and PV+ cells in marmoset V1.
(A) Average percent of total number of GABA+ (red) or PV+ (blue) cells in each layer. Here and in (B, E) error bars represent standard error of the mean (s.e.m.) across regions of interest (ROIs) (n = 6 ROIs in A, B, E). In all panels asterisks indicate statistical significance (*<0.05, **<0.01, ***<0.001). (B) Mean density of GABA+ and PV+ cells in each layer. (C) Mean density of PV+ cells in marmoset (dark blue) and mouse (light blue) V1. Here and in (D), mouse data are from Xu et al., 2010, error bars represent the standard deviation, and n = 4–6 ROIs for mouse and 6 ROIs for marmoset. (D) Mean density of GABA+ cells in marmoset (red) and mouse (pink) V1. (E) Average percent of all counted PV+ cells that were double-labeled for GABA (gray), and average percent of all counted GABA+ cells that were double-labeled for PV+ (black) are shown at the top of the histogram. The percentages for each layer are shown underneath.
Figure 3

Laminar profile of pAAV-h56D-mediated tdT expression in marmoset V1.
(A–C) Left: tdT expression (red) across V1 layers (indicated) following injection of an identical volume of AAV-h56D-tdT serotype 9 (A), serotype 7 (B), and serotype 1 (C). The viral titers for the AAV9 and AAV7 injections were also the same, while titer was higher for AAV1 (see Supplementary file 1). The tdT expression region in panel (A) is a merge of two adjacent sections because the tdT expression region did not encompass all layers in individual sections. TdT expression in other panels, instead, is from a single section. Dashed contours mark layer boundaries; solid contours mark the top and bottom of the cortex. Layers were identified based on DAPI counterstain (blue). Note that the cortical thickness varies across cases because these sections are from different regions of V1. Yellow box in each panel is the region shown at higher magnification on the right. Scale bar: 500 µm (valid for A–C). Right: Higher magnification of the V1 region inside the yellow box in each respective left panel, showing individual channels (red: viral-mediated tdT expression; green: GABA + IHC) and the merge of these two channels (yellow). Scale bar: 50 µm (valid for A–C).
Figure 4

Laminar distribution, specificity, and coverage of tdT expression induced by three different serotypes of pAAV-h56D.
(A) Average percent of total number of GABA immunoreactive cells, and average percent of total number of tdT-expressing cells after injections of three different serotypes of the GABA-AAV vector, in each V1 layer. (B) Specificity of tdT expression induced by each serotype across all layers and in each layer. Specificity is defined as the percent of viral-mediated tdT expressing cells that colocalize with GABA immunoreactivity. (C) Coverage of each viral serotype across all layers and in each layer, defined as percent of GABA immunoreactive cells that co-express tdT. In all panels, error bars represent s.e.m. across regions of interest (ROIs) (n = 4 for AAV9, 4 for AAV7, 4 for AAV1, 6 for GABA-IHC), and asterisks indicate statistically significant differences at the p<0.05 level.
Figure 5

Laminar profile of AAV-PHP.eB-S5E2-mediated tdT expression in marmoset V1.
(A) Left: tdT expression (red) across V1 layers following an injection of 105 nl volume of AAV-PHP.eB-S5E2-tdT. Dashed contours mark layer boundaries; solid contours mark the top and bottom of the cortex. Layers were identified based on DAPI counterstain (blue). Yellow box is the region shown at higher magnification in the right panels. Scale bar here and in the left panel in (B): 500 µm. Right: higher magnification of the V1 region inside the yellow box in the left panel, showing individual channels (red: viral-mediated tdT expression; green: PV+ IHC) and the merge of these two channels (yellow). Scale bar here and in the right panels in (B): 50 µm. (B) Same as in (A) but for an injection volume of 315 nl.
Figure 6
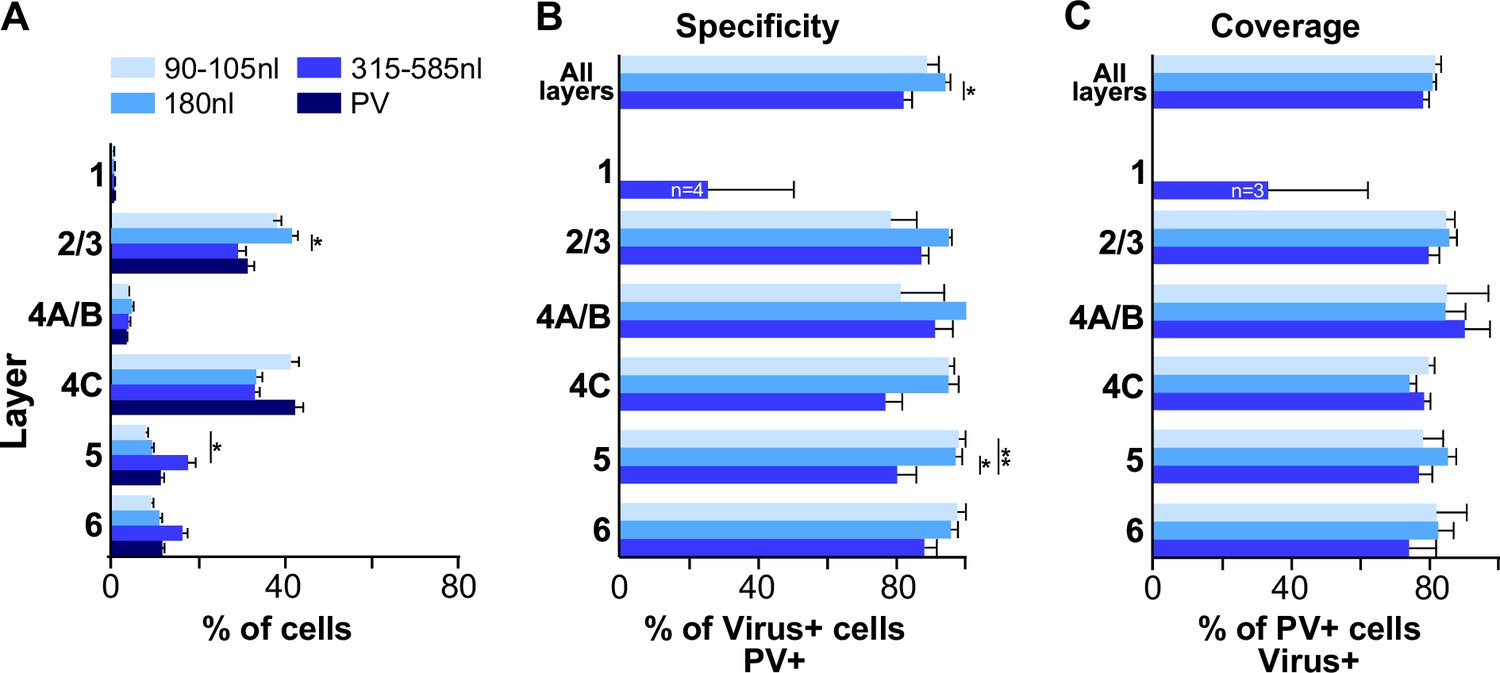
Laminar distribution, specificity, and coverage of tdT expression induced by three different injection volumes of AAV-PHP.eB-S5E2.
(A) Average percent of total number of PV immunoreactive cells, and average percent of total number of tdT-expressing cells after injections of 3 different volumes of the PV-AAV vector, in each V1 layer. (B) Specificity of tdT expression induced by each injection volume across all layers and in each layer. (C) Coverage of each viral injection volume across all layers and in each layer. In all panels, error bars represent s.e.m. across regions of interest (ROIs) (n = 8 for 90–105 nl, 8 for 180 nl, 12 for 315–585 nl PV-AAV injection volumes and 6 for PV-IHC), and asterisks indicate statistically significant differences.
Figure 7 with 1 supplement

Reduced GABA and PV immunoreactivity at the viral injection site.
(A, B) Number (A) and density (B) of GABA+ cells inside (pink; n = 12 regions of interest [ROIs] across six sections) and outside (red; n = 6 ROIs across three sections) the GABA-AAV injection sites. (C, D) Number (C) and density (D) of PV+ cells inside (light blue; n = 12 ROIs across six sections) and outside (dark blue; n = 6 ROIs across three sections) the GABA-AAV injection sites. (E, F) Number (E) and density (F) of GABA+ cells inside (pink; n = 28 ROIs across 14 sections) and outside (red; n = 6 ROIs across three sections) the PV-AAV injection sites. (G, H) Number (G) and density (H) of PV+ cells inside (light blue; n = 28 ROIs across 14 sections) and outside (dark blue; n = 6 ROIs across three sections) the PV-AAV injection sites. Error bars: s.e.m. Asterisks: statistically significant comparisons. In each panel, statistical comparisons across layers were performed using the Bonferroni-corrected Kruskal–Wallis or independent-samples median tests; comparisons between total IN and OUT populations in each panel were performed using the Mann–Whitney U test.
Figure 7—figure supplement 1
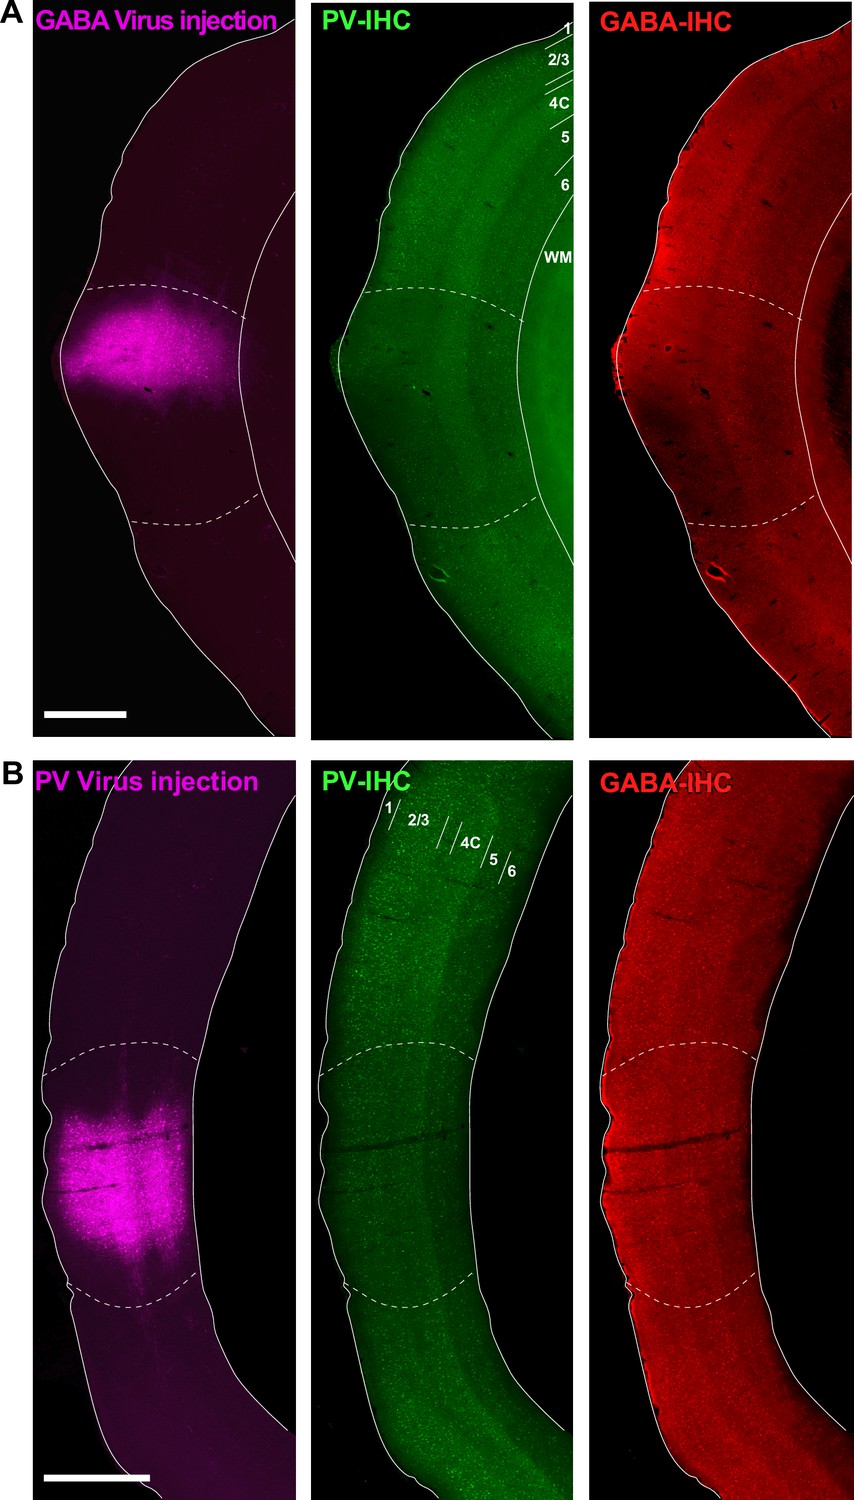
Reduced GABA and PV immunoreactivity at the viral injection site.
(A) Left: epifluorescent image of an example GABA-AAV injection site in V1. Middle: same section imaged under the green channel to reveal PV-IHC. Right: same section imaged under the red channel to reveal GABA-IHC. In all panels, solid white contours mark the top and bottom of the cortex, dashed contours outline the region of reduced immunoreactivity. Cortical layers are indicated in the middle panel. (B) Same as in (A) but for an example PV-AAV injected site. Scale bars in (A, B): 1 mm.
Additional files
-
Supplementary file 1
File 1 reports the injection parameters used for each AAV-h56D and AAV-PHP.eB-S5E2 injection case.
- https://cdn.elifesciences.org/articles/97673/elife-97673-supp1-v1.docx
-
Supplementary file 2
File 2 reports the specificity and coverage for each individual AAV-PHP.eB-S5E2-tdT injection case.
- https://cdn.elifesciences.org/articles/97673/elife-97673-supp2-v1.docx
-
MDAR checklist
- https://cdn.elifesciences.org/articles/97673/elife-97673-mdarchecklist1-v1.pdf
Download links
A two-part list of links to download the article, or parts of the article, in various formats.
Downloads (link to download the article as PDF)
Open citations (links to open the citations from this article in various online reference manager services)
Cite this article (links to download the citations from this article in formats compatible with various reference manager tools)
Laminar specificity and coverage of viral-mediated gene expression restricted to GABAergic interneurons and their parvalbumin subclass in marmoset primary visual cortex
eLife 13:RP97673.
https://doi.org/10.7554/eLife.97673.3


