Mapping patterns of thought onto brain activity during movie-watching
- Department of Psychology, Queen's University, Canada
- Mathematical and Electrical Engineering Department, IMT Atlantique, France
- School of Psychology, University of Sussex, United Kingdom
- Department of Psychology, Stanford University, United States
- Faculty of Medicine, University of British Columbia, Canada
- Department of Neurology, Max Planck Institute for Human Cognitive and Brain Sciences, Germany
- Max Planck School of Cognition, Germany
- School of Psychology and Sport Science, Bangor University, United Kingdom
- Montreal Neurological Institute-Hospital, McGill University, Canada
- Centre de Recherche de l'Institut Universitaire de Geriatrie de Montreal, Canada
- Child Mind Institute, United States
- Integrative Neuroscience and Cognition Center, University of Paris, France
- Division of Psychology & Language Sciences, University College London, United Kingdom
- Institute of Psychiatry, Psychology & Neuroscience, University College London, United Kingdom
- Department of Neuroimaging at the Institute of Psychiatry, Psychology and Neuroscience, King's College London, United Kingdom
Figures
Figure 1 with 1 supplement
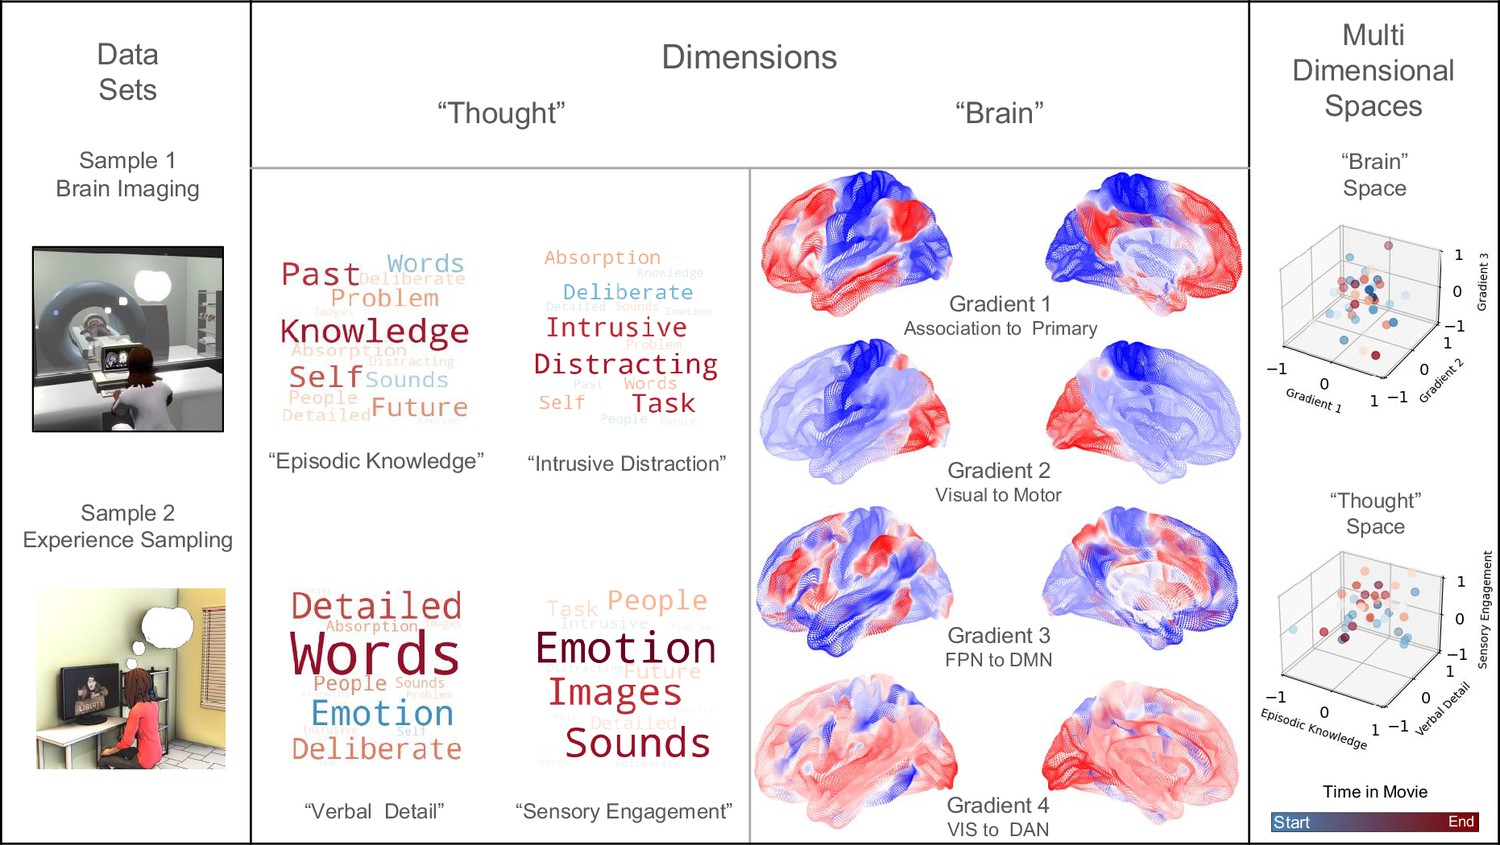
Using fMRI data and experience sampling data to map ongoing thought patterns onto brain activity during movie-watching.
Left to Right - One sample of participants was scanned while watching movies (Sample 1), and a different set of participants responded to experience sampling probes (Sample 2) while watching the same movies in the laboratory. Decomposition of mDES data into low-dimension experiential patterns using principal component analysis (PCA) produced a set of dimensions that describe experience during movie-watching (a ‘thought space’ within which the dynamics of the movie-watching experience unfold). Word clouds illustrate how the experience sampling questions map onto each dimension that describes this space. In these word clouds, the font size describes their importance (bigger = more important), and the colour describes their polarity (red = positive, blue = negative). Similarly, we created a brain space to describe the movie-watching experience by comparing each moment in the film to validated dimensions of brain variation. For this purpose, we used the dimensions defined from the resting states of the HCP conducted by Margulies (Margulies et al., 2016) (often referred to as gradients): Gradient 1 (Association to Primary cortex), Gradient 2 (Visual to Motor cortex), Gradient 3 (Frontoparietal to Default Mode Networks), and Gradient 4 (Dorsal Attention Network (DAN)/Visual to Default Mode Networks) of brain variation dimensions illustrated by colour to map activity in state space analysis (purple = low, yellow = high) (not shown: Gradient 5 Lateral Default Mode to Primary sensory cortex) (Margulies et al., 2016). Two 3D scatter plots illustrating two examples from our data of how the movie-watching can be seen as two complimentary trajectories through a ‘Brain Space’ (focusing on Gradients 1, 2, and 3, shown at the top) and a ‘Thought Space’ (focusing on ‘Episodic Knowledge’, ‘Verbal Detail’, and ‘Sensory Engagement’, shown at the bottom). The cooler (blue) points occur earlier in the movie clip and the warmer (red) points occur later.
Figure 1—figure supplement 1

Scree plot of mDES thought data.
The scree plot illustrates the eigenvalues of principal components obtained from a PCA analysis. Each point on the plot represents a principal component, and the y-axis displays the corresponding eigenvalues. The eigen value threshold of 1 and the ‘elbow’ of the plot, where eigenvalues start to level off, is indicative of the optimal number of components to retain. In this case, the analysis suggests a four-component solution. The scree plot aids in determining the most meaningful components for capturing variance in the data, facilitating a more parsimonious representation of the underlying structure.
Figure 2
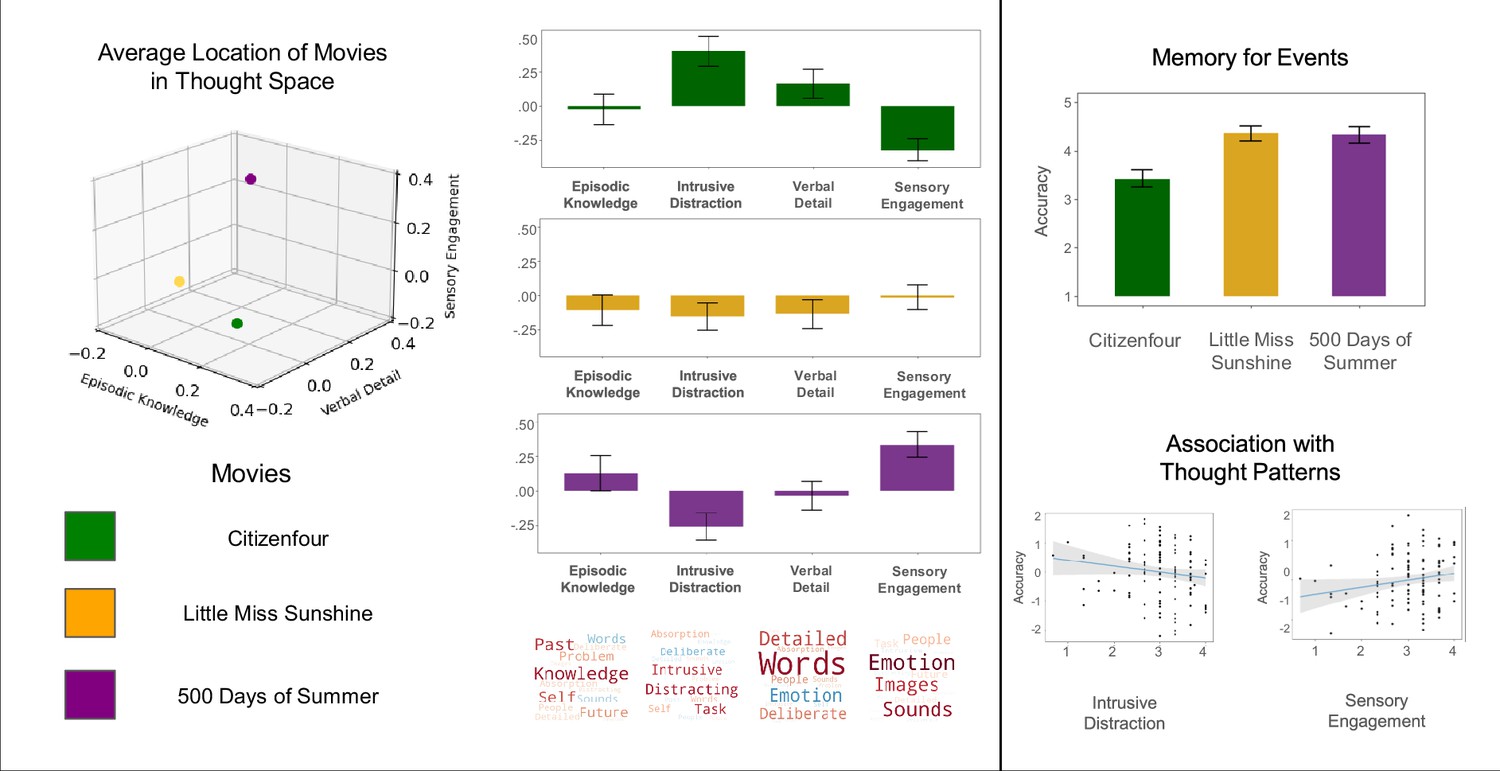
The relationship between how patterns differ across movie clips and relate to comprehension.
Left to Right – The 3D scatterplot shows the average location of each film on three of the four PCA dimensions, ‘Episodic Knowledge’, ‘Verbal Detail’, and ‘Sensory Engagement’. The bar graphs show the average loading on each dimension, with the error bars showing the 95% Confidence Interval. The plots on the right illustrate the relationship between the mDES dimensions and memory for information in the film. The top barplot shows the average comprehension score on each film with 95% Confidence Intervals error bars. The scatter plots below show the association between mDES components and comprehension. The scatter plot on the left shows the negative linear relationship between the ‘Intrusive Distraction’ thought and memory. The plot on the right shows a positive association with ‘Sensory Engagement’. The blue line represents the best-fit line, and the shaded area shows the 95% Confidence Intervals.
Figure 3 with 1 supplement
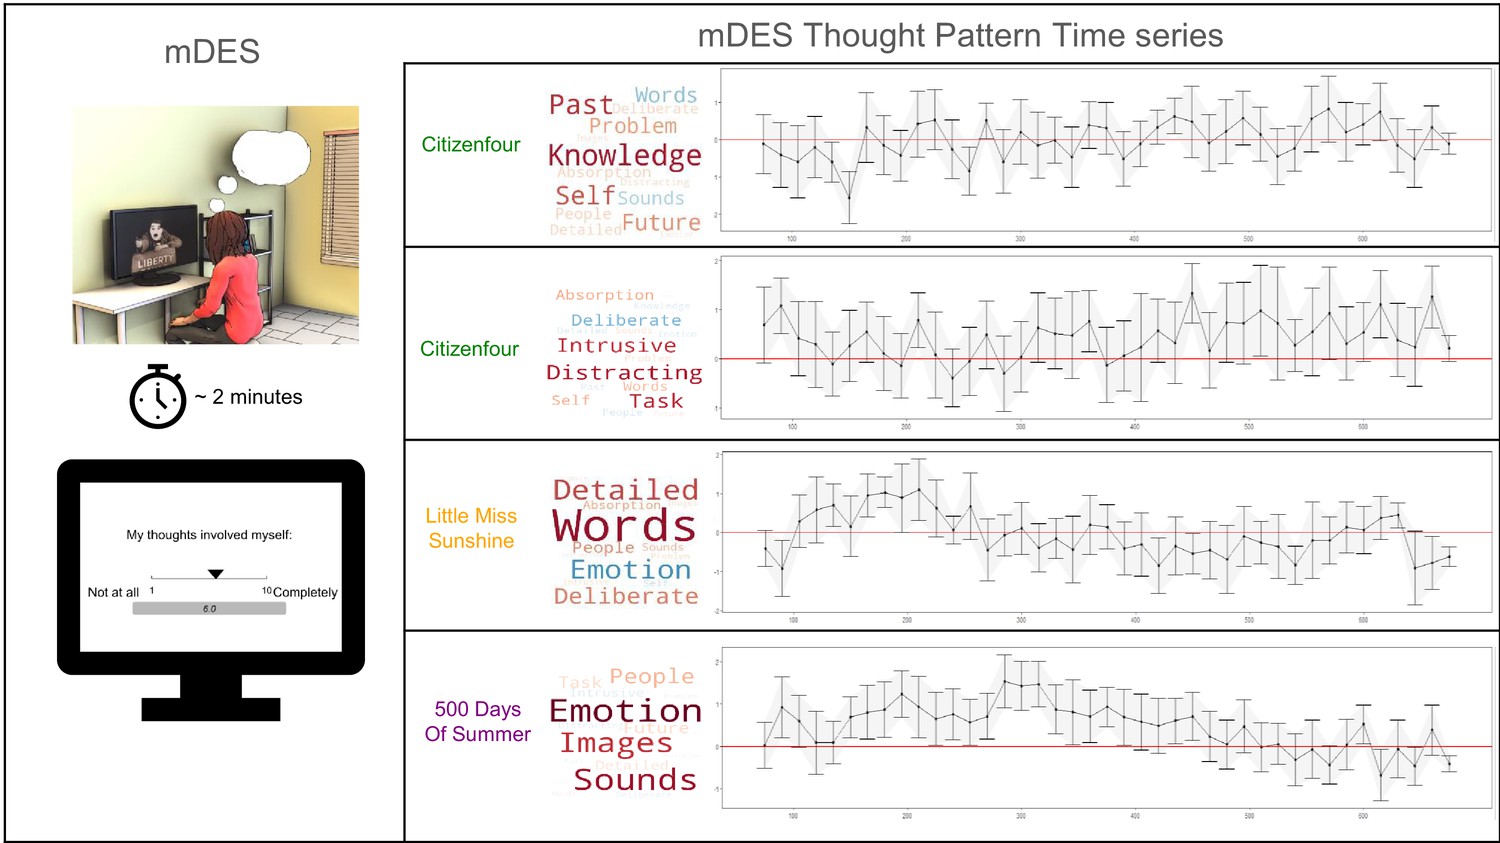
The application of multi-dimensional experience sampling (mDES) method and relevant time series produced from decomposed mDES thought patterns.
Left to Right – The first panel illustrates the mDES method in the laboratory to demonstrate how participants respond to the sixteen items about their thoughts while watching the film on the laboratory computers. The plots on the right summarize the average thought pattern score at each 15 s sampling window across the three movies. The first time series plot illustrates the trajectory of the ‘Episodic Knowledge’ across Little Miss Sunshine, followed by the time course of ‘Verbal Detail’ also across Little Miss Sunshine, with distinct peaks in scores within the 150–250 s range and particularly low scores between the 400 and 500 s interval. The third plot demonstrates the relatively low and negative scores on ‘Sensory Engagement’ across Citizenfour. Lastly, the final plot highlights the relatively high scores on ‘Sensory Engagement’ throughout 500 Days of Summer, especially across the 150–400 s interval.
Figure 3—figure supplement 1
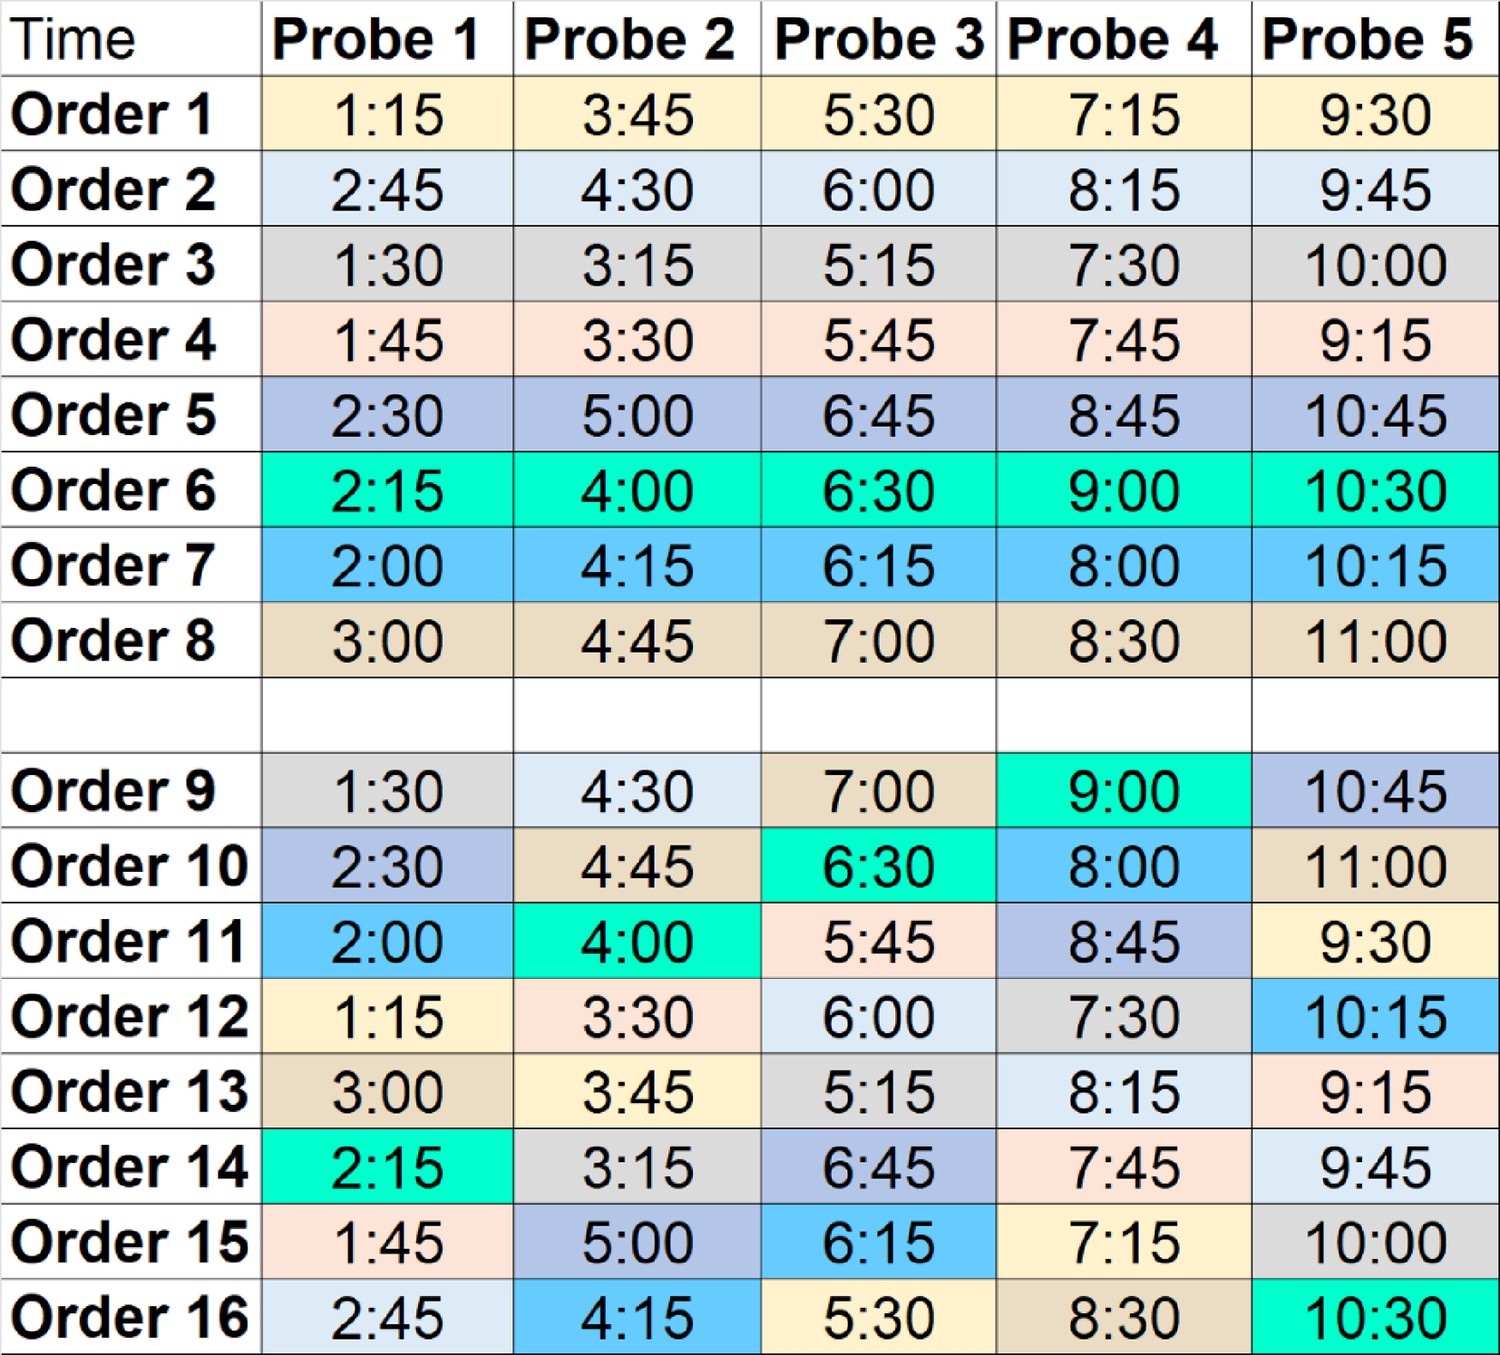
Probe order matrix for Sample 2.
Visual representation of probe order conditions assigned to participants with timestamps of each delivered probe. Participants were randomly assigned to a different probe order condition for each movie clip. Probe orders 1-8 share no overlapping probes. Probe orders 9-16 have overlapping probes from the former probe orders, corresponding to their cell colours, to control for ordering effects across participants. Probes began at 1 minute and 15 seconds until the 11-minute mark (end of the movie clip).
Figure 4 with 4 supplements
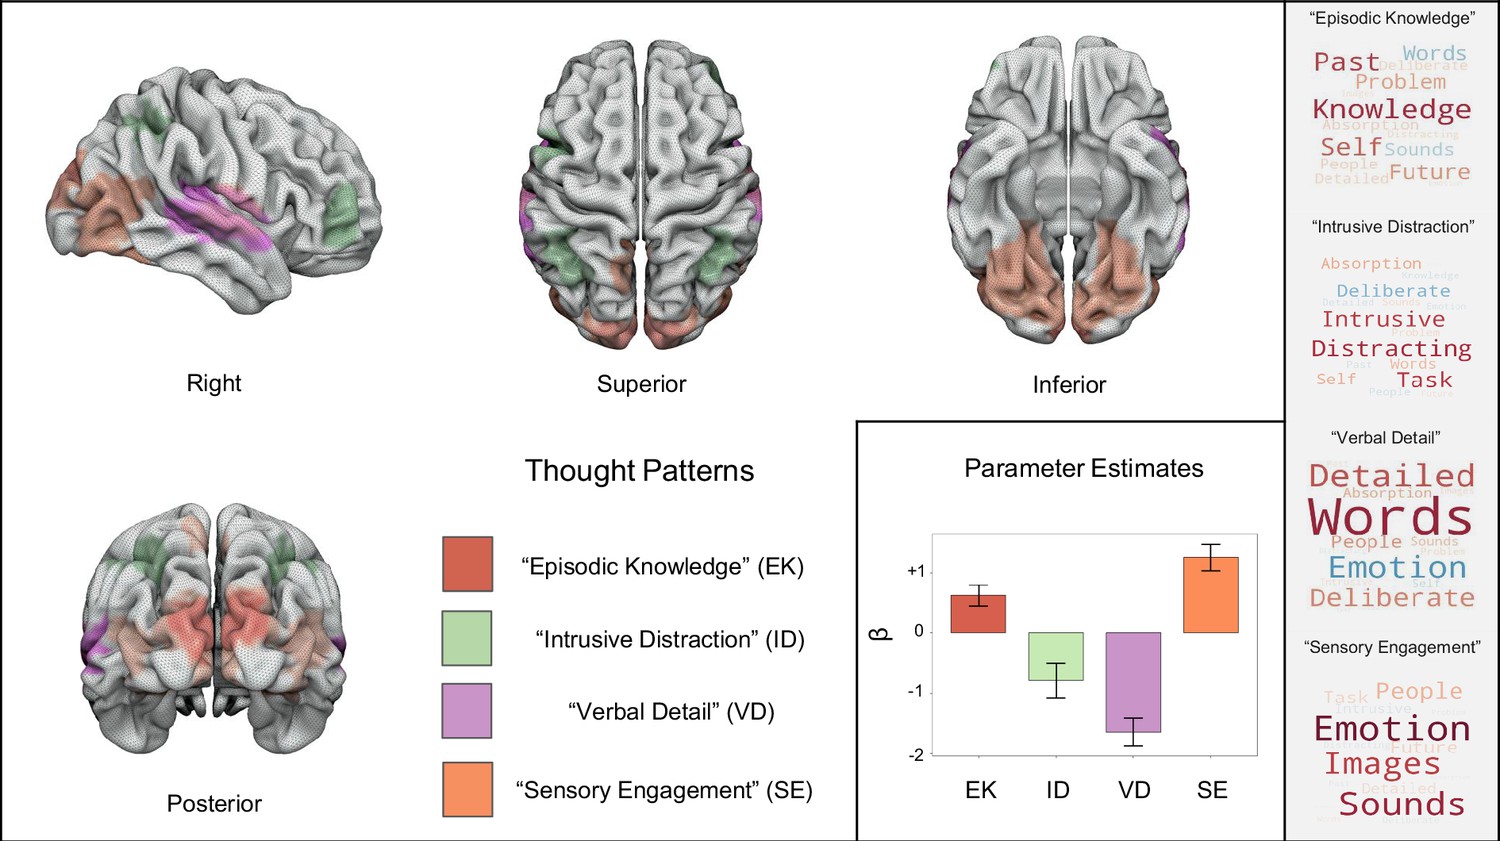
Group-level neural activation patterns associated with each of the dimensions of thought identified in a voxel space analysis.
Left to Right - Regions in red are associated with activity corresponding to reports of ‘Episodic Knowledge’, green regions are associated with ‘Intrusive Distraction’, areas in purple are associated with ‘Verbal Detail’, and the regions in orange represent activity associated with ‘Sensory Engagement’. The bar plot illustrates the directionality of each parameter estimate with error bars representing 95% Confidence Intervals. Corresponding word clouds for each thought pattern are presented on the right for reference (Top to Bottom: ‘Episodic Knowledge’, ‘Intrusive Distraction’, ‘Verbal Detail’, and ‘Sensory Engagement’).
Figure 4—figure supplement 1
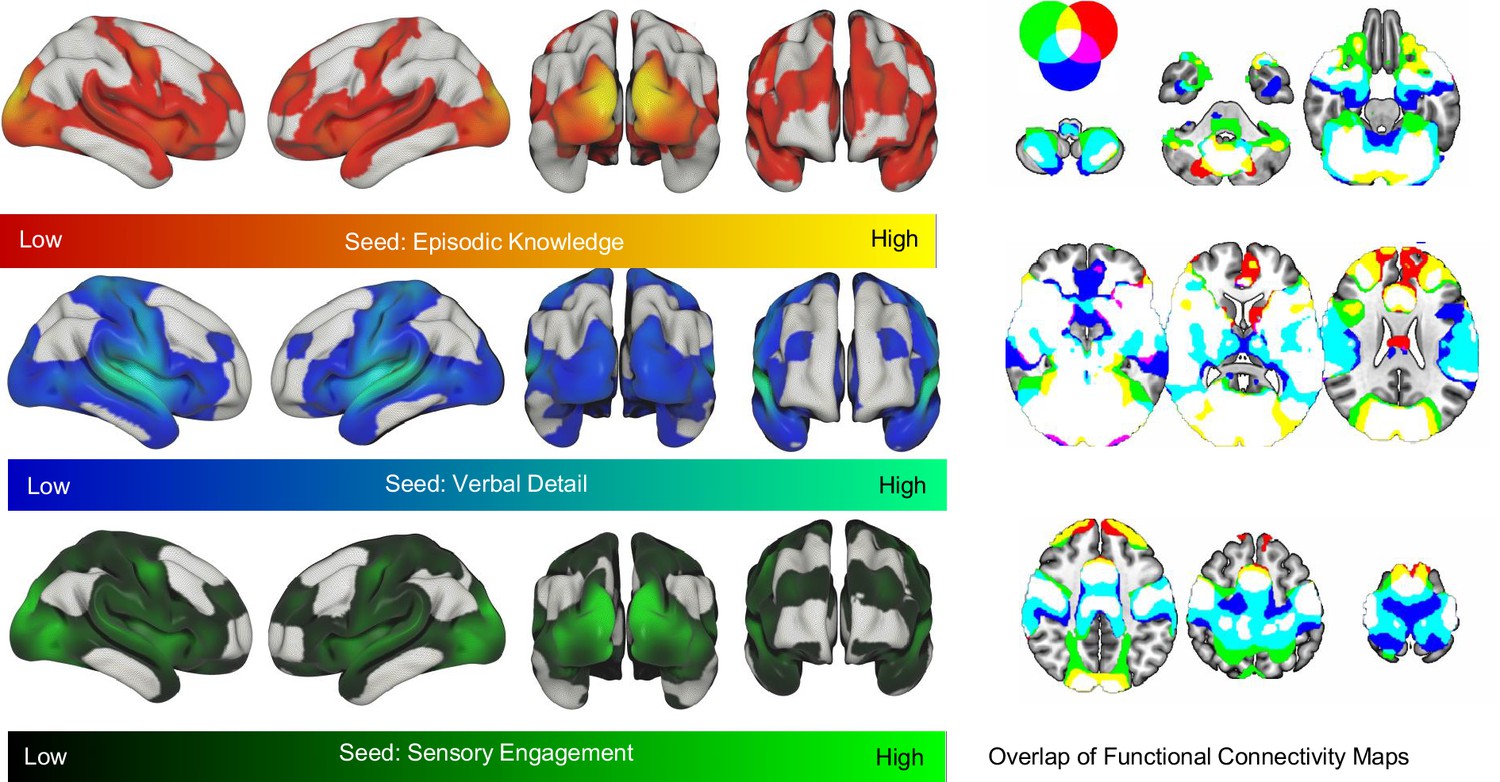
Functional connectivity summary.
Results of functional connectivity (FC) in which we used the regions identified in our voxel space analysis that related to “Episodic Knowledge” (Red - Yellow color map), “Verbal Detail” (Blue-Green color map) and “Sensory Engagement” (Black – Green color map). These are thresholded at p < .001 and corrected for FEW at p < .05.The panel on the right shows the same fully saturated maps to highlight their common regions (shown in white).
Figure 4—figure supplement 2
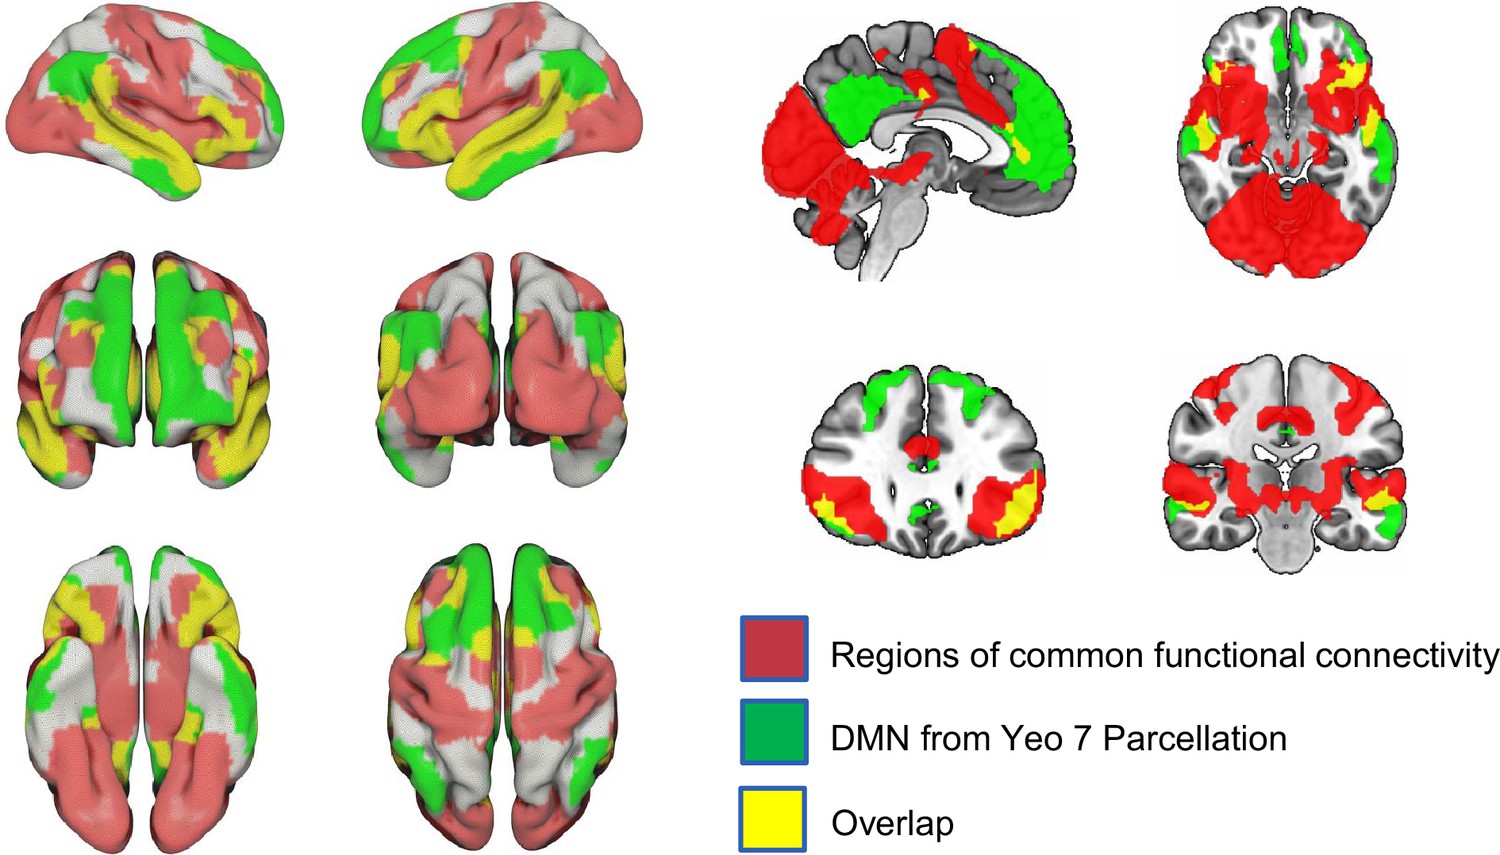
Relationship of functional connectivity & Yeo 7 parcellation (DMN).
Overlap between the regions showing common functional connectivity between regions associated with three mDES components (‘Episodic Knowledge’, ‘Verbal Detail’ and ‘Sensory Engagement’) in the voxel space analysis and the DMN as defined by Yeo et al., 2011. Regions in red show regions of common functional connectivity, regions in green are the DMN and regions in yellow are the overlap between these two maps.
Figure 4—figure supplement 3
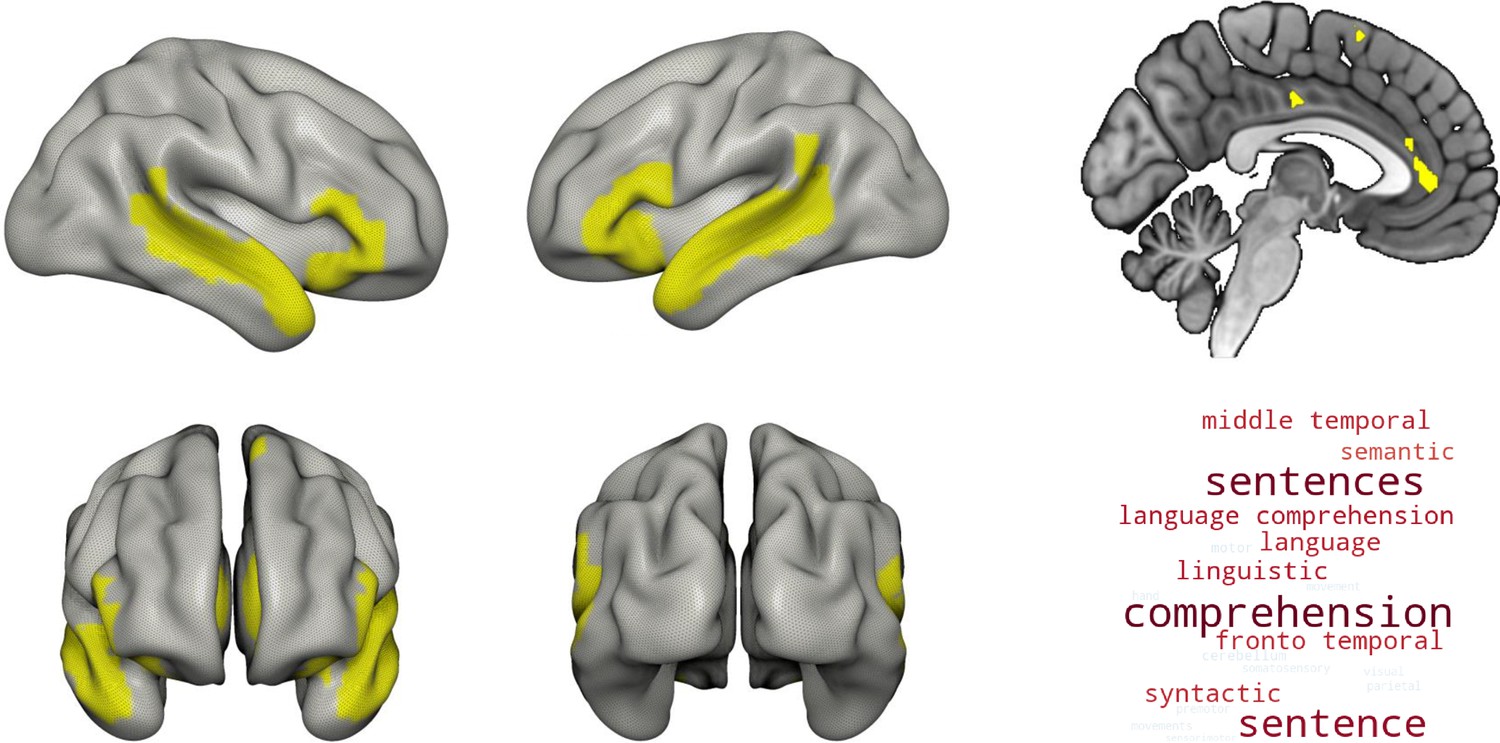
Neurosynth decoding and functional connectivity relationship.
Meta analytic decoding of the regions showing common functional connectivity between regions associated with three mDES components (“Episodic Knowledge”, “Verbal Detail” & “Sensory Engagement”) in the voxel space analysis and the DMN as defined by Yeo et al., 2011 (shown in yellow). The word cloud on the right shows the functional terms most likely to be associated with these regions following a Neurosynth analytic decoding. Regions in red are more likely and regions in blue are less likely. Words in a larger font size are more important.
Figure 4—figure supplement 4

Relationship of Intrusive Distraction map and FPN.
Overlap between regions associated with “Intrusive Distraction” in our voxel space analysis (green) and the FPN as defined by Yeo et al., 2011 (lavender). Regions of overlap are presented in cyan.
Figure 5 with 1 supplement
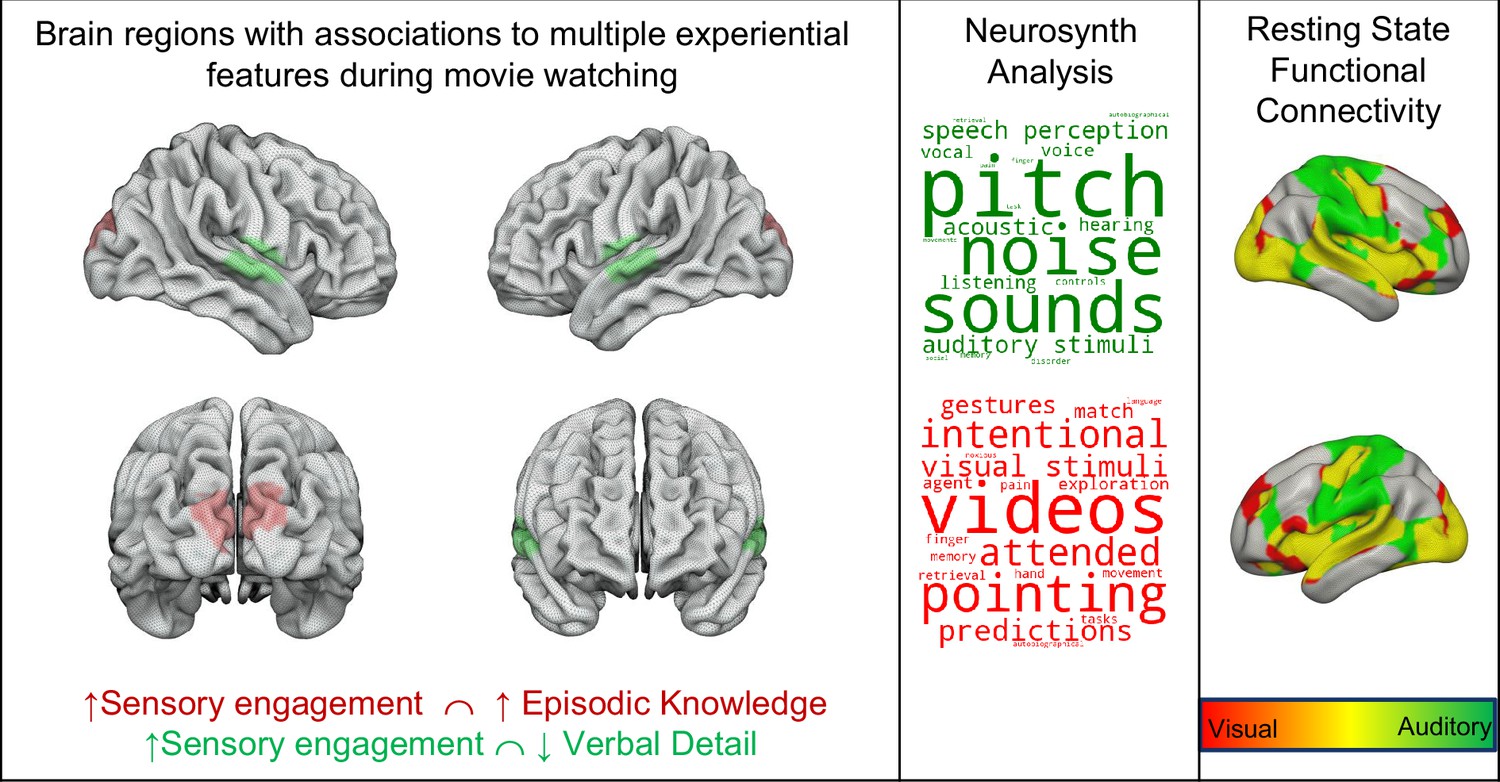
Brain regions associated with multiple experiential features during movie-watching.
A region of superior temporal cortex is associated with positive reports of thoughts like ‘Sensory Engagement’ and negative reports of thoughts like ‘Verbal Detail’ (coloured green). A region of dorsal visual cortex was associated with both thoughts reported like ‘Sensory Engagement’ and ‘Episodic Detail’ (coloured red). The word clouds in the middle panel show the results of a Neurosynth analysis of the regions, highlighting the most likely functions associated with these regions. The font size describes their importance (bigger = more important), and the colour describes their polarity (darker = positive). The panel on the right shows the results of seed-based functional connectivity analysis of these regions of overlap from a separate resting-state study. Regions in red indicate those connected to the region of visual cortex, regions in green show those linked to auditory cortex, and regions in yellow are common to both spatial maps.
Figure 5—figure supplement 1
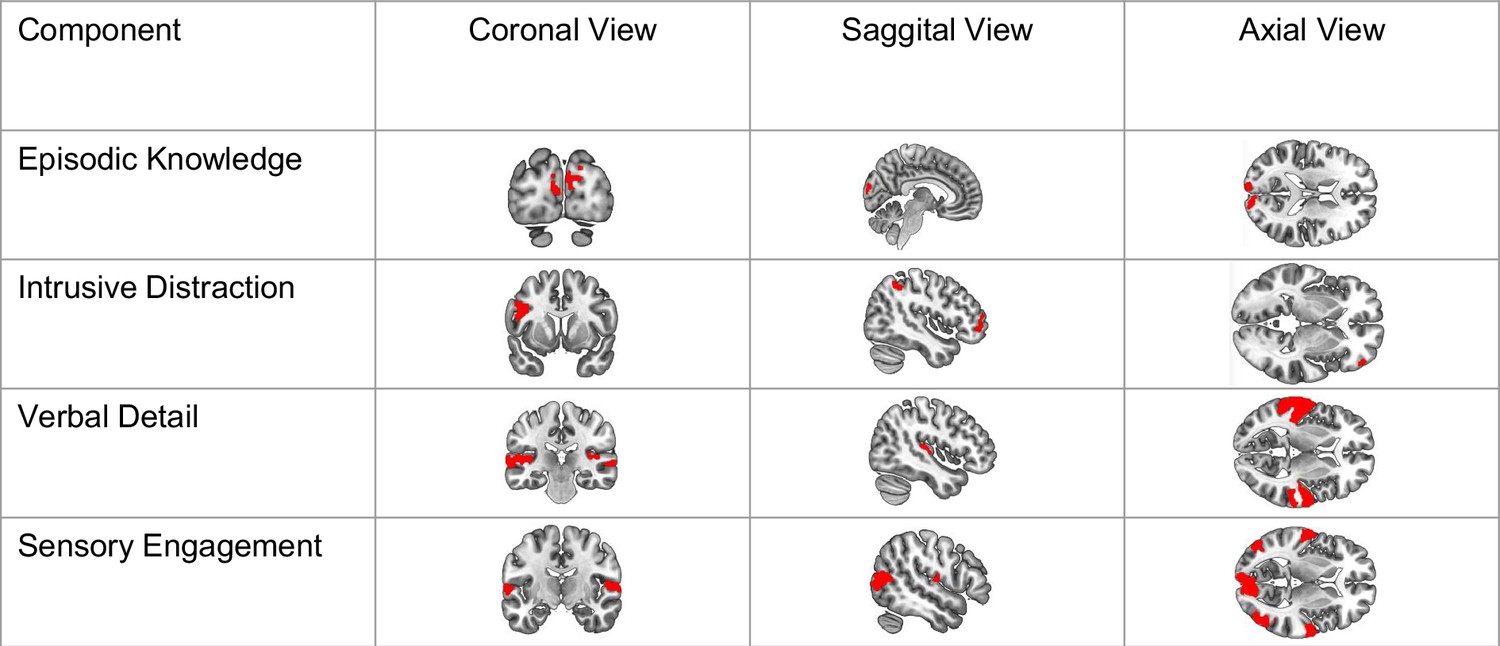
Summary of voxel-space brain maps by thought pattern.
Brain maps of each voxel-space analysis output for each of the corresponding thought components separately, “Episodic Knowledge,” “Intrusive Distraction,” “Verbal Detail,” and “Sensory Engagement.” Each brain map is displayed from the coronal view, sagittal view, and axial view to maximize the understanding of the spatial distribution and localization of related brain regions for each thought pattern.
Figure 6
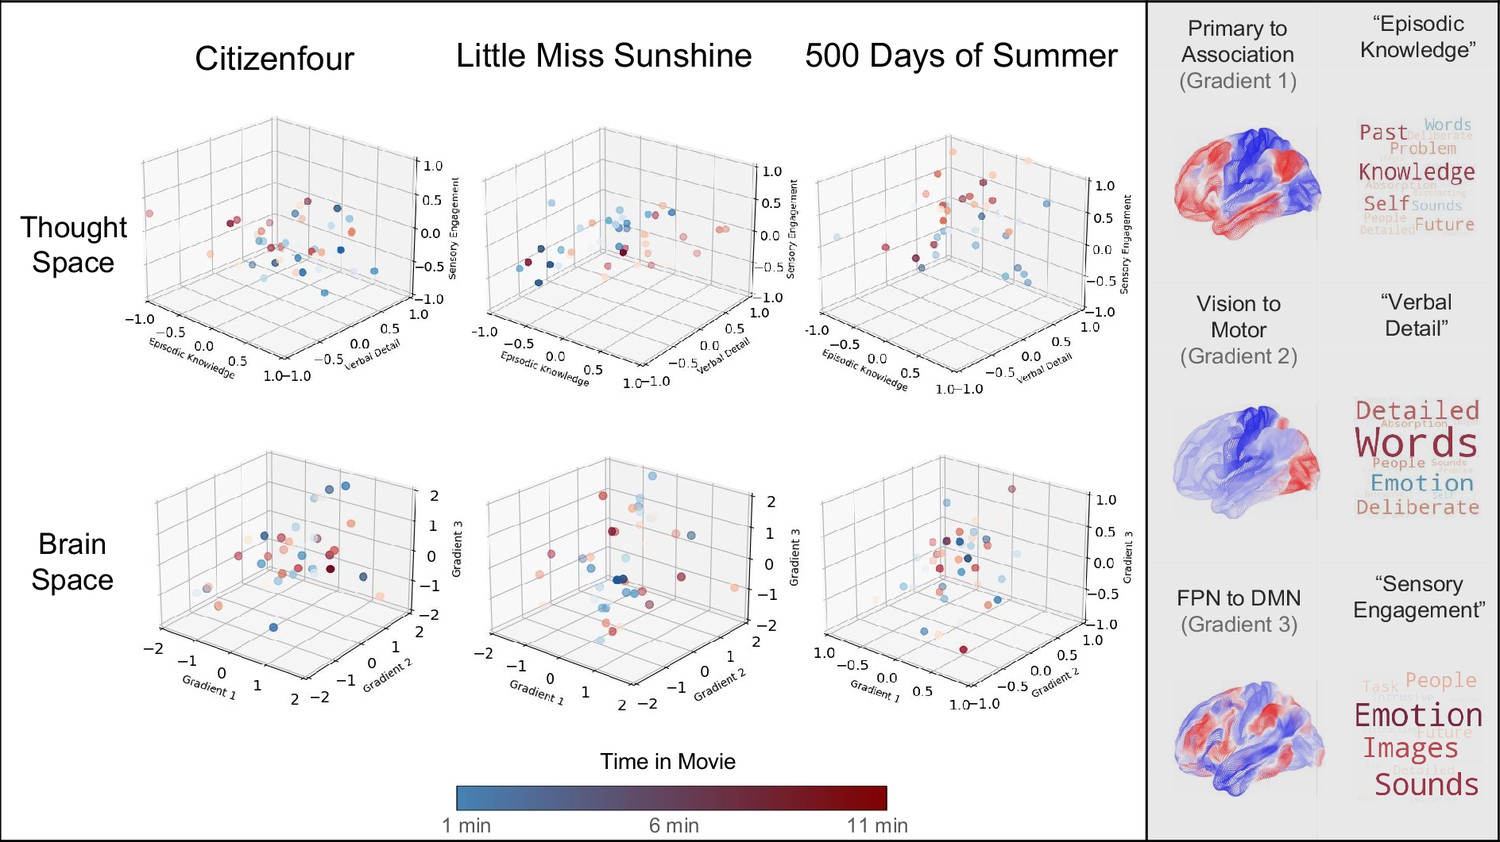
Comparison of the locations of each moment across the movie clip in the (top row) ‘Thought Space’ and the ‘Brain Space’.
Left to Right – 3D scatterplots of the coordinate locations of each thought pattern (‘Episodic Knowledge’, ‘Verbal Detail’, and ‘Sensory Engagement’) and gradients 1–3 (Gradient 1 Associated – Primary), Gradient 2 (Visual – Somato-motor), Gradient 3 (Frontoparietal – Default) during Citizenfour, Little Miss Sunshine, and 500 Days of Summer. Observations in blue occur earlier during the film, and observations in red occur later in the film. The gradient maps (1-3) and thought pattern word clouds are presented on the right for reference.
Figure 7
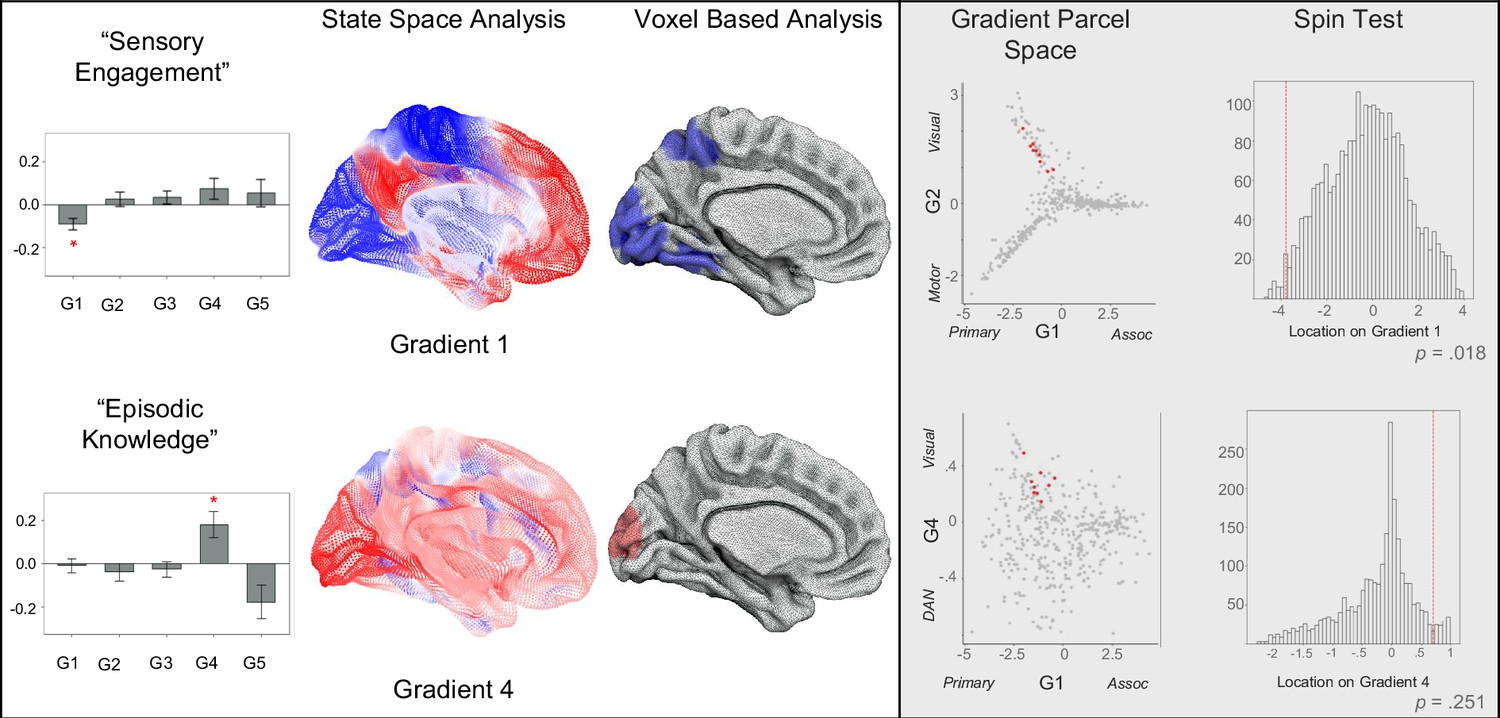
Comparison of ‘State-Space’ and Voxel based analyses of ‘Sensory Engagement’ and ‘Episodic Knowledge’ with Gradients.
Left to right – The barplots illustrate the associations for the significant models using Gradients 1–5 as explanatory variables and the thought patterns, ‘Sensory Engagement’ and ‘Episodic Knowledge’ as dependent variables. We performed two spin tests to formally compare these results to those using the voxel space analysis (permutation = 2500). The spin tests revealed the location of the cluster of voxels associated with ‘Sensory Engagement’ are located within the sensory regions of Gradient 1, unlike to have occurred by chance, p=0.018. In contrast, the location of the cluster of voxels associated with Episodic Knowledge on Gradient 4 was within the null distribution, p=0.251. The locations of the relevant clusters in gradient parcel space are presented in the scatter plots (red points indicate the location of parcels from the relevant comparison).
Tables
Table 1
ANOVA across sampling bins of each Movie of each Thought Component score.
| Little Miss Sunshine | ||||||
|---|---|---|---|---|---|---|
| Df | Sum Sq | Mean Sq | F-value | p-value | ||
| PCA_1 | Sampling bin | 1.00 | 24.30 | 24.29 | 10.80 | 0.001 ** |
| Residuals | 712.00 | 1601.80 | 2.25 | |||
| PCA_2 | Sampling bin | 1.00 | 3.60 | 3.64 | 1.97 | 0.161 |
| Residuals | 712.00 | 1219.50 | 1.85 | |||
| PCA_3 | Sampling bin | 1.00 | 63.50 | 63.54 | 31.79 | <0.001 *** |
| Residuals | 712.00 | 1423.00 | 2.00 | |||
| PCA_4 | Sampling bin | 1.00 | 5.10 | 5.06 | 3.43 | 0.064 |
| Residuals | 712.00 | 1048.20 | 1.47 | |||
| Citizenfour | ||||||
| Df | Sum Sq | Mean Sq | F-value | p-value | ||
| PCA_1 | Sampling bin | 1.00 | 12.00 | 12.01 | 5.23 | 0.023 * |
| Residuals | 712.00 | 1637.00 | 2.30 | |||
| PCA_2 | Sampling bin | 1.00 | 2.00 | 1.95 | 0.87 | 0.350 |
| Residuals | 712.00 | 1593.00 | 2.24 | |||
| PCA_3 | Sampling bin | 1.00 | 0.10 | 0.07 | 0.04 | 0.847 |
| Residuals | 712.00 | 1425.30 | 2.00 | |||
| PCA_4 | Sampling bin | 1.00 | 7.40 | 7.40 | 6.22 | 0.013 * |
| Residuals | 712.00 | 847.80 | 1.19 | |||
| 500 Days of Summer | ||||||
| Df | Sum Sq | Mean Sq | F-value | p-value | ||
| PCA_1 | Sampling bin | 1.00 | 7.30 | 7.34 | 2.51 | 0.114 |
| Residuals | 706.00 | 2068.50 | 2.93 | |||
| PCA_2 | Sampling bin | 1.00 | 0.20 | 0.22 | 0.13 | 0.719 |
| Residuals | 706.00 | 1219.10 | 1.73 | |||
| PCA_3 | Sampling bin | 1.00 | 7.80 | 7.85 | 3.86 | 0.049 * |
| Residuals | 712.00 | 1425.30 | 2.00 | |||
| PCA_4 | Sampling bin | 1.00 | 114.20 | 114.15 | 80.41 | <0.001 *** |
| Residuals | 706.00 | 1002.30 | 1.42 |
-
Note. Results of each ANOVA test assessing if each PCA thought component score differs across each of the 15 s sampling bins (Sampling bin) for the three movies Little Miss Sunshine, Citizenfour and 500 Days of Summer. The table consists of the degrees of freedom (Df), sum of squares (Sum Sq), mean squares (Mean Sq), F-value, and p-value for each component and movie. Significant p-value (p<0.05) indicates a significant difference in the respective PCA component score across the sampling bins.
Additional files
-
Supplementary file 1
Supplementary table data for corresponding manuscript results.
(a) Multi-dimensional Experience sampling (mDES). (b) Percent variance explained by principal components by movie (c) Linear Mixed Models of Variance in Thoughts across Movies. (d) Movie Comprehension Questions. (e) Linear Mixed Models of Comprehension model. (f) FSL FEAT Query Parameter Estimates. (g) Grand average of Gradient score by movie. (h) Functional Connectivity Cluster Analysis (FLAME). (i) Neurosynth Decoder Analysis. (j) Linear Mixed Models of Gradients 1–5 Fixed Effects for each Thought Pattern
- https://cdn.elifesciences.org/articles/97731/elife-97731-supp1-v2.docx
-
MDAR checklist
- https://cdn.elifesciences.org/articles/97731/elife-97731-mdarchecklist1-v2.docx
Download links
A two-part list of links to download the article, or parts of the article, in various formats.
Downloads (link to download the article as PDF)
Open citations (links to open the citations from this article in various online reference manager services)
Cite this article (links to download the citations from this article in formats compatible with various reference manager tools)
Mapping patterns of thought onto brain activity during movie-watching
eLife 13:RP97731.
https://doi.org/10.7554/eLife.97731.4


