Altered hepatic metabolism mediates sepsis preventive effects of reduced glucose supply in infected preterm newborns
- Section for Comparative Pediatrics and Nutrition, Department of Veterinary and Animal Sciences, University of Copenhagen, Denmark
- Department of Neonatology, Rigshospitalet, Denmark
- Department of Food Science, University of Copenhagen, Denmark
- Plasma-derived therapies, Baxalta Innovations GmbH, part of Takeda Pharmaceuticals Ltd, Austria
Figures
Figure 1 with 1 supplement
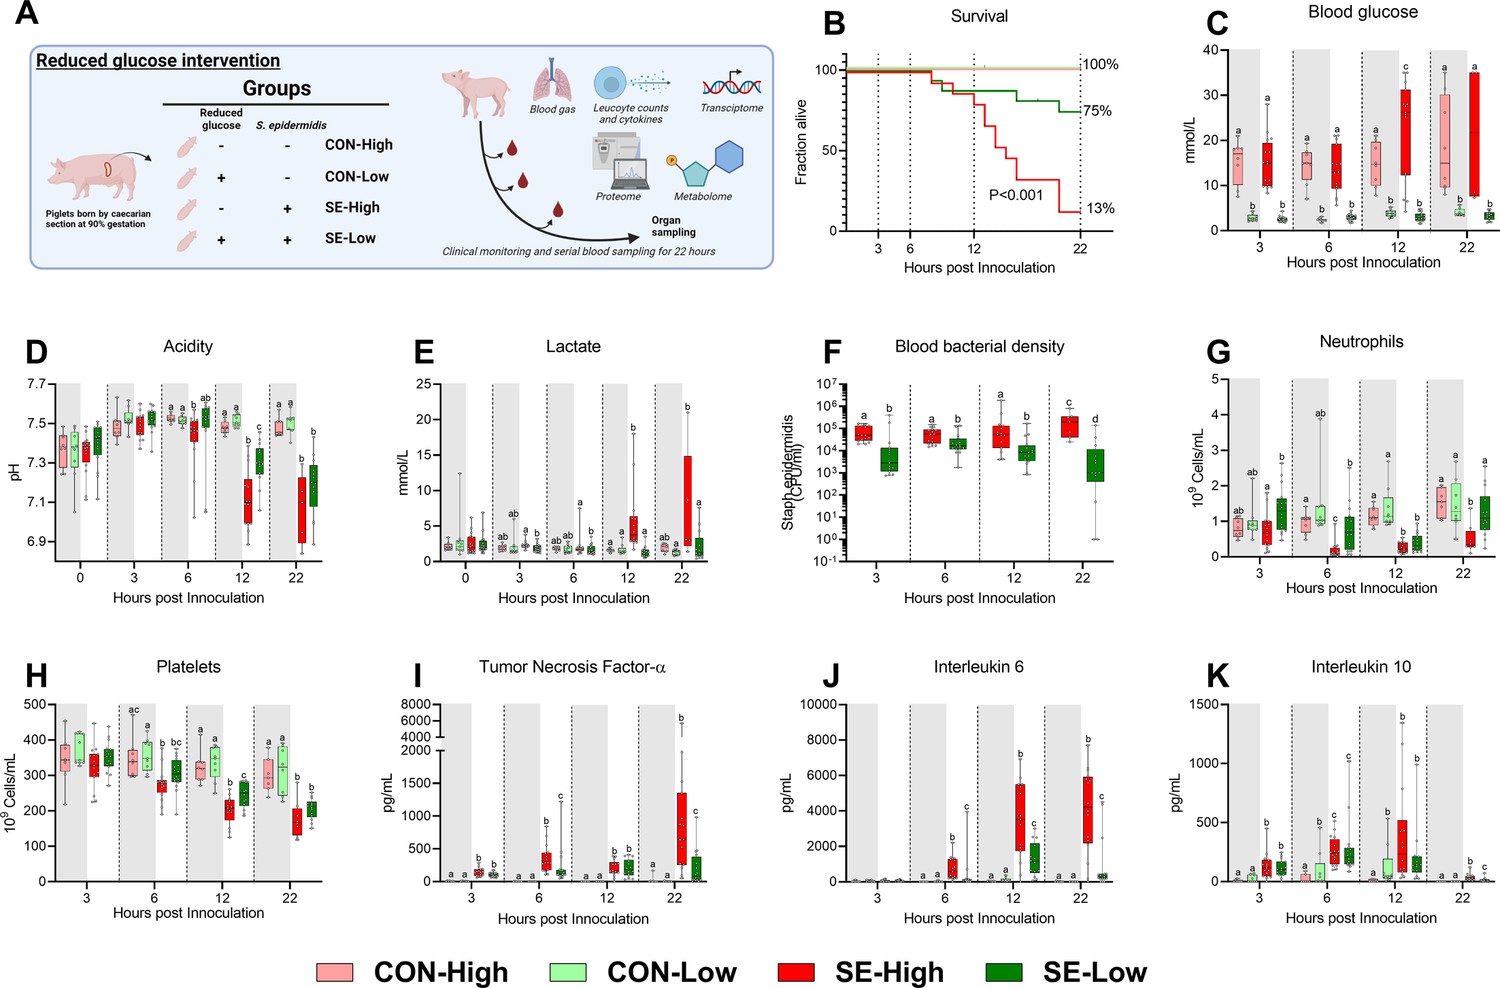
Animal study overview, clinical, and immunological results.
(A) Study overview, preterm pigs were nourished with parenteral nutrition (PN) with either high (21%, 30 g/kg/d) or low (5%, 7.2 g/kg/d) glucose supply and infused with either Staphylococcus epidermidis or control saline. Animals were followed for 22 hr and blood samples were collected for further analysis. This panel was created with BioRender.com. (B) Survival of animals during an experiment, presented as time to euthanasia according to predefined humane endpoints with corresponding log-rank test comparing S. epidermidis (SE)-High and SE-Low (C) Blood glucose, measured by glucose meter 3, 6, and 12 hr after SE inoculation as well as at euthanasia, presented as 95% box plots. (D, E) Blood gas parameters collected before inoculation with SE (0 hr) and 3, 6, and 12 hr after as well as at euthanasia, presented as 95% box plots. (F) Blood bacterial density in infected groups at 3, 6, 12, and 22 hr after bacterial inoculation, presented as 95% box plots on a logarithmic scale. (G–K) Blood hematology and plasma cytokines at 3, 6, 12 and 22 hr after bacterial inoculation, presented as 95% box plots. (C–K) Data at each time point analyzed separately, bars labeled with different letters are significantly different from each other (p<0.05), n=8–9 for control animals, and 10–16 for infected groups.
Figure 1—figure supplement 1
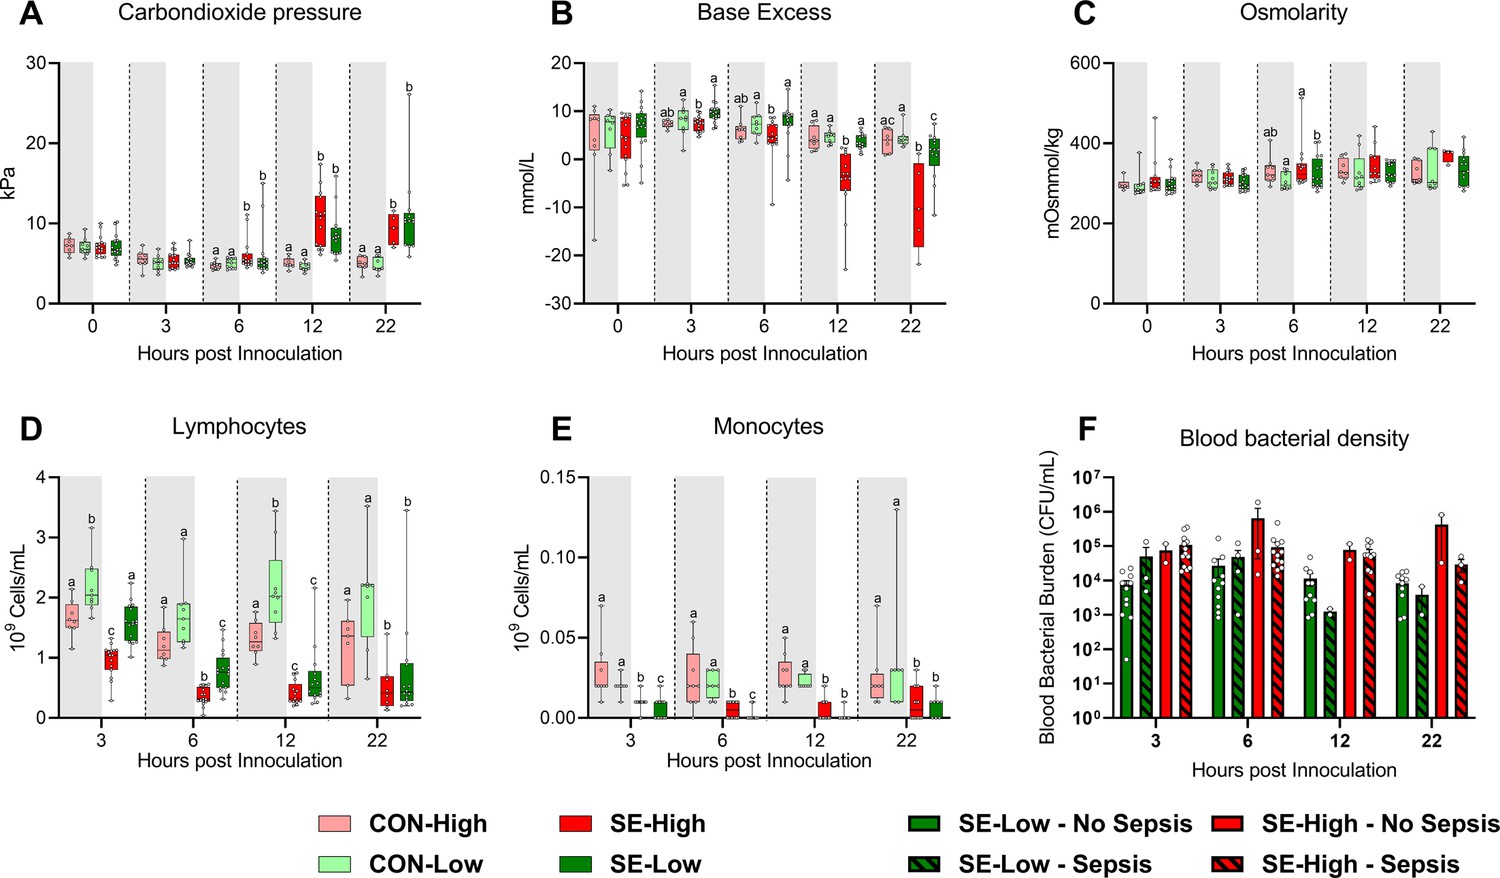
Supplemental blood gas, bacterial density and hematological parameters.
(A–C) Blood gas parameters at baseline. (D–E) Blood hematology 3, 6, 12, and 22 hr after bacterial inoculation. (F) Blood bacterial burdens in animals that develop sepsis (Lined bars) or not (solid bars) following bacterial inoculation. (A–F) Data at each time point analyzed separately, presented as 95% box plots or bar charts with standard error, with denoted different letters indicating statistical significances (p<0.05), n=8–9 for control animals, and 10–16 for infected groups.
Figure 2 with 1 supplement
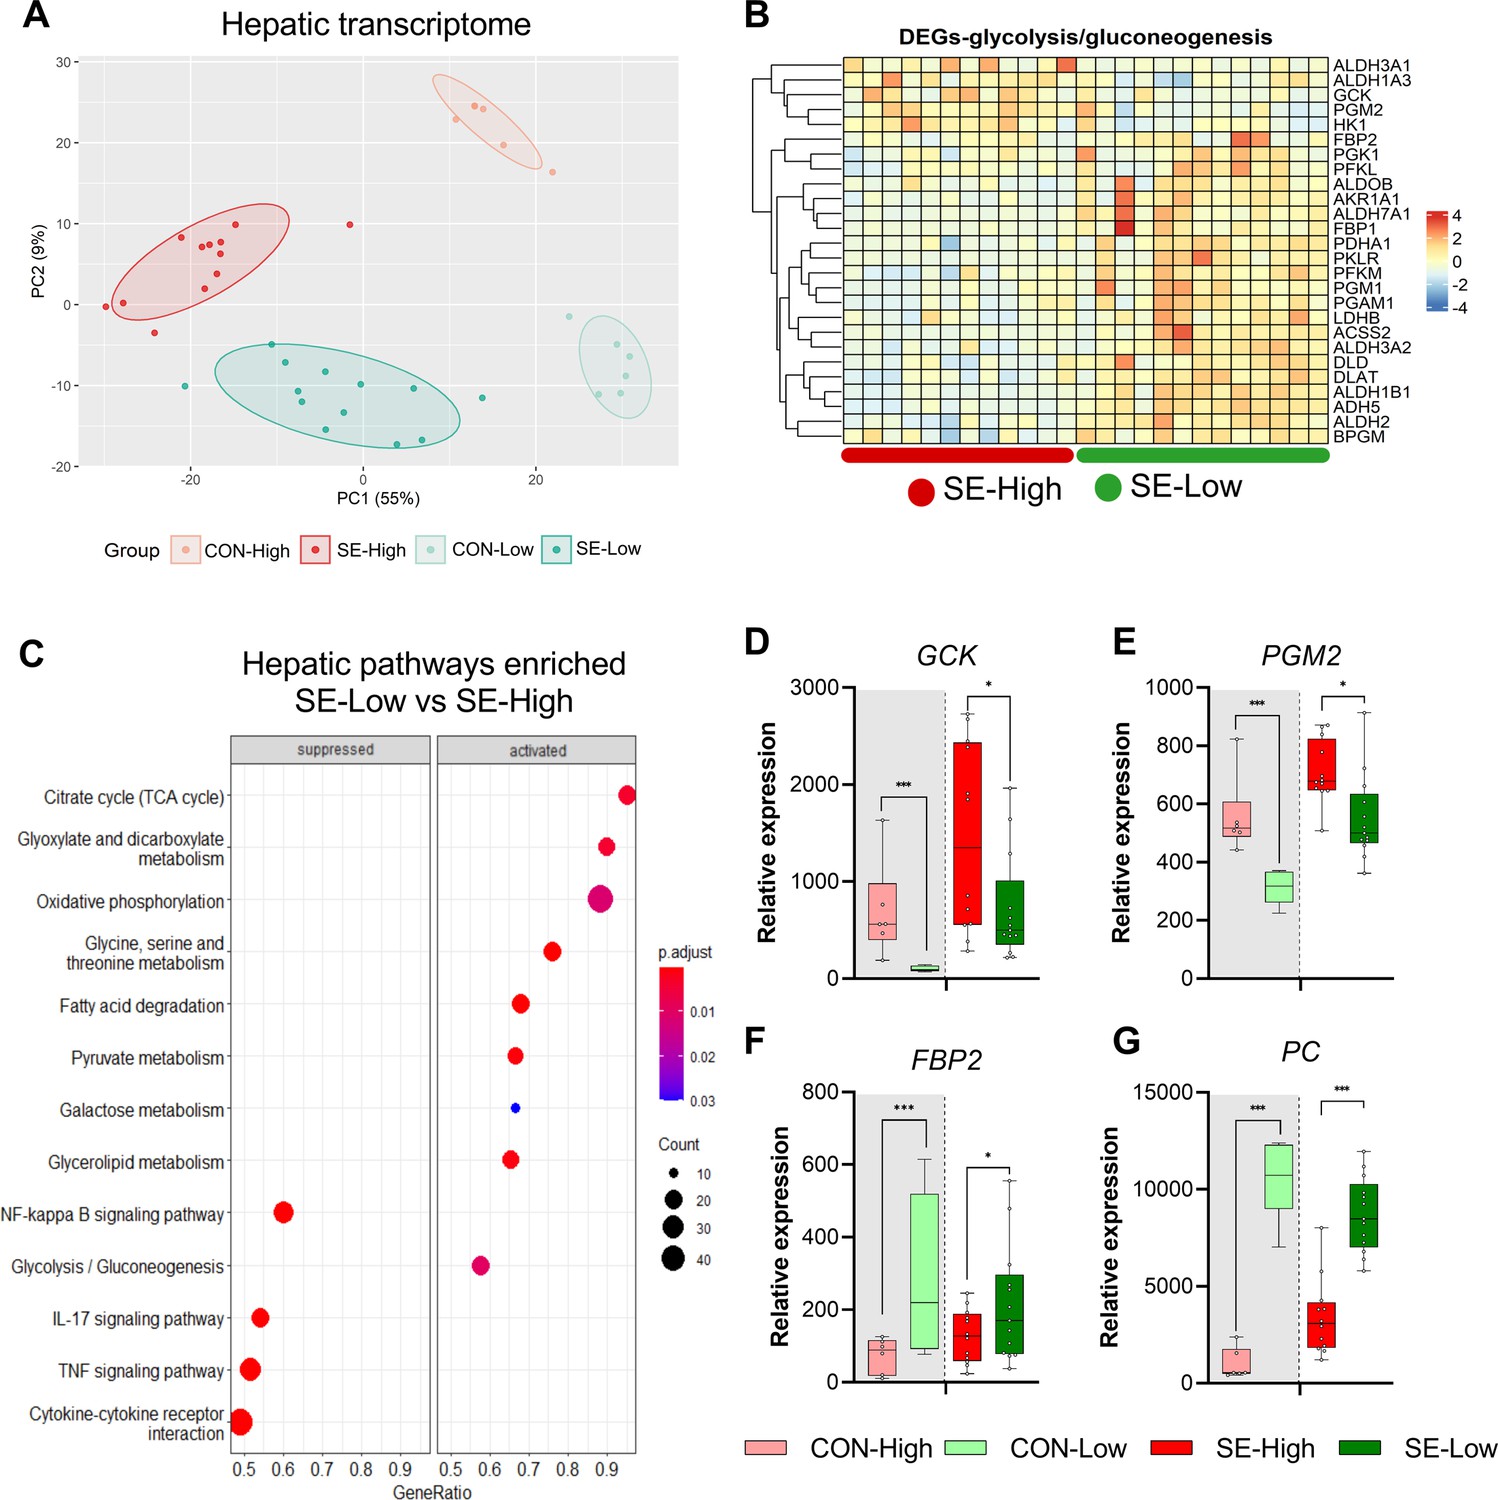
Impacts of glucose supply on liver transcriptomics at euthanasia.
(A) Principal component analysis plot of transcriptomic profiles among the four groups. (B) Heatmap of differentially expressed genes (DEGs) related to glycolysis/gluconeogenesis, in the enriched pathways between the two infected groups. Differences shown as Z-scores, where red color indicates a higher expression and blue a lower. (C) Gene set enrichment analysis (GSEA) with gene ontology database showing the top pathways activated and suppressed by reduced glucose supply in infected animals. Size of the dots indicates the number of DEGs while the red color indicates a lower adjusted p-value. (D–G) Expression of genes exclusively related to glycolysis or gluconeogenesis, shown as relative expressions using 95% box plots. *p<0.05, ***p<0.001, n=7–8 for each control group and 15–16 for infected groups.
-
Figure 2—source data 1
Hepatic transcriptome data.
- https://cdn.elifesciences.org/articles/97830/elife-97830-fig2-data1-v1.xlsx
Figure 2—figure supplement 1
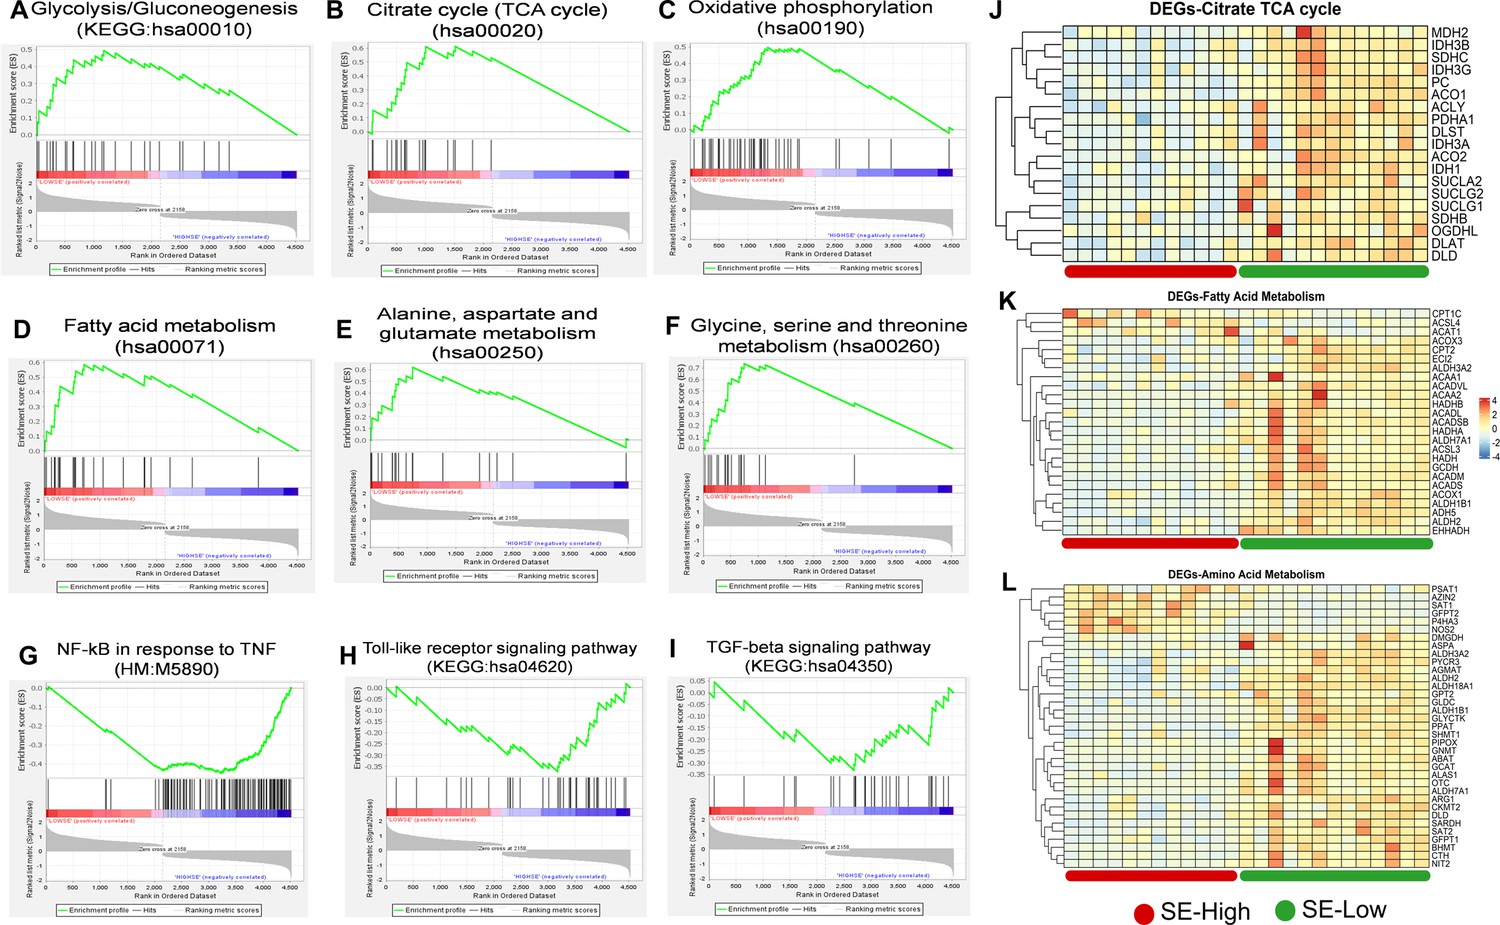
Metabolic pathways in liver transcriptome affected by reduced glucose supply.
(A–F) Gene set enrichment analysis (GSEA) of the energy metabolism-related pathways including Glycolysis/Gluconeogenesis (hsa00010), Citrate cycle (TCA cycle) (hsa00020), Oxidative phosphorylation (hsa00190), Fatty acid metabolism (hsa00071), Alanine, aspartate and glutamate metabolism (hsa00250), and Glycine, serine, and threonine metabolism (hsa00260) with positive enrichment score in the S. epidermidis (SE)-Low, relative to SE-High animals. (G–I) GSEA of the inflammation and immune response-related pathways using Hallmark and KEGG pathway database, including Genes regulated by NF-kB in response to TNF (M5890), Toll-like receptor signaling pathway (hsa04620), and TGF-beta signaling pathway (hsa04350) with negative enrichment score in the SE-Low, relative to SE-Low animals. (J–L) Heatmaps of DEGs involved in the TCA cycle, fatty acid, and amino acid metabolism, in the enriched pathways. Differences are shown as Z-scores, where red color indicates a higher expression in SE-Low vs SE-High and blue a lower. N=15–16 for each group.
Figure 3

Impacts of glucose supply on plasma metabolism response revealed by proton nuclear magnetic resonance (NMR)-based metabolomics at euthanasia, either at the humane endpoint or 22 hr after bacterial inoculation.
(A) Score plot of principal component analysis performed on metabolomics data among the four groups. (B) Volcano plot showing the differential expressed metabolites (DEMs) in S. epidermidis (SE)-Low vs SE-High. Yellow color indicates higher plasma levels, red lower. (C) Heatmaps of identified DEMs between the two infected groups. Differences shown as Z-scores, where red color indicates a higher expression and blue a lower. (D) Schematic representation of gluconeogenesis and TCA cycle metabolites altered between the two infected groups. Red represents a metabolite upregulated in SE-Low vs SE-High whereas dark blue indicates a metabolite downregulated; light blue indicates a metabolite not detected by 1H NMR. (E–G) Plasma alanine transaminase (ALT), aspartate transaminase (AST), and BUN levels, shown as 95% box plots. (H–L) DEMs involved in gluconeogenesis and TCA cycle, shown as 95% box plots. *p<0.05, **p<0.01, ***p<0.001, n=7–8 for each control group and 15–16 for infected groups.
-
Figure 3—source data 1
Plasma metabolome data.
- https://cdn.elifesciences.org/articles/97830/elife-97830-fig3-data1-v1.xlsx
Figure 4 with 1 supplement
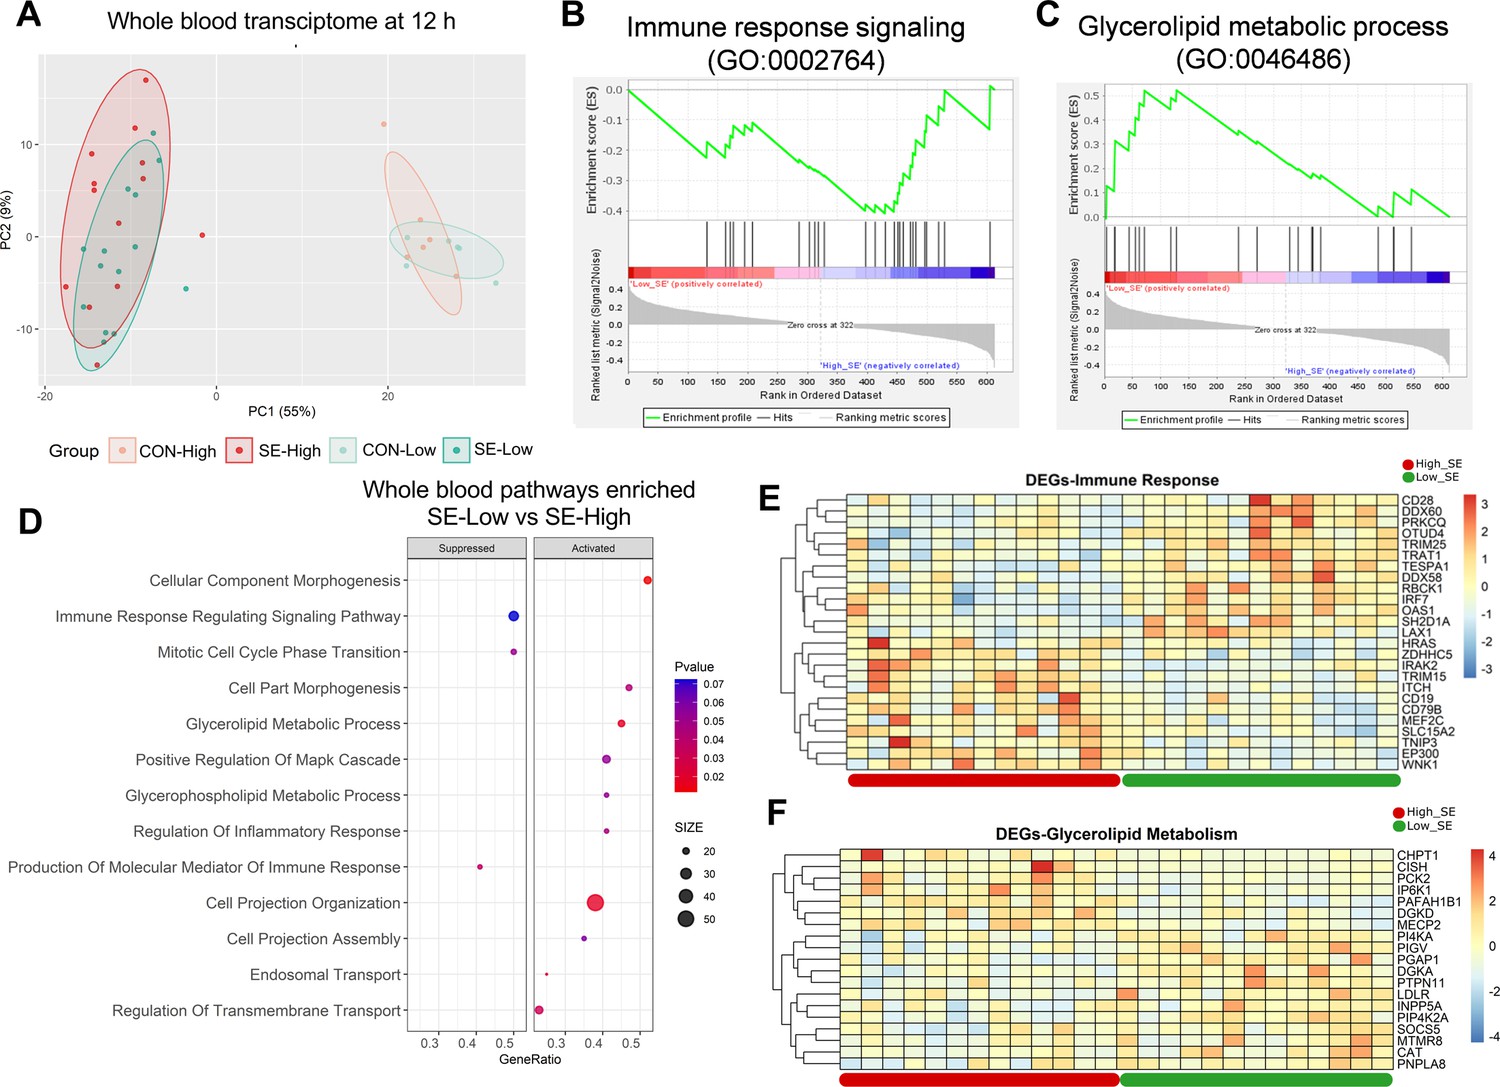
Impacts of glucose supply on whole blood transcriptomics at 12 hr after bacterial inoculation.
(A) Score plot of principal component analysis of transcriptomic profiles performed among the four groups. (B, C) Gene set enrichment analysis (GSEA) of the immune response signaling (GO:0002764) with negative enrichment score and glycerolipid metabolic process (GO:0046486) with positive enrichment score in the S. epidermidis (SE)-Low, relative to SE-High animals. (D) Enrichment analyses using GSEA with gene ontology database showing the top pathways activated and suppressed by reduced glucose supply in infected animals. Size of dots indicates number of DEGs while red color indicates lower adjusted p-value. (E, F) Heatmaps of differentially expressed genes (DEGs) involved in the enriched immune response and glycerolipid metabolism pathways between the two infected groups. Differences shown as Z-scores, where red color indicates a higher expression and blue a lower. n=6 in each control group and 13–14 for infected groups.
-
Figure 4—source data 1
Whole blood transriptome data.
- https://cdn.elifesciences.org/articles/97830/elife-97830-fig4-data1-v1.xlsx
Figure 4—figure supplement 1
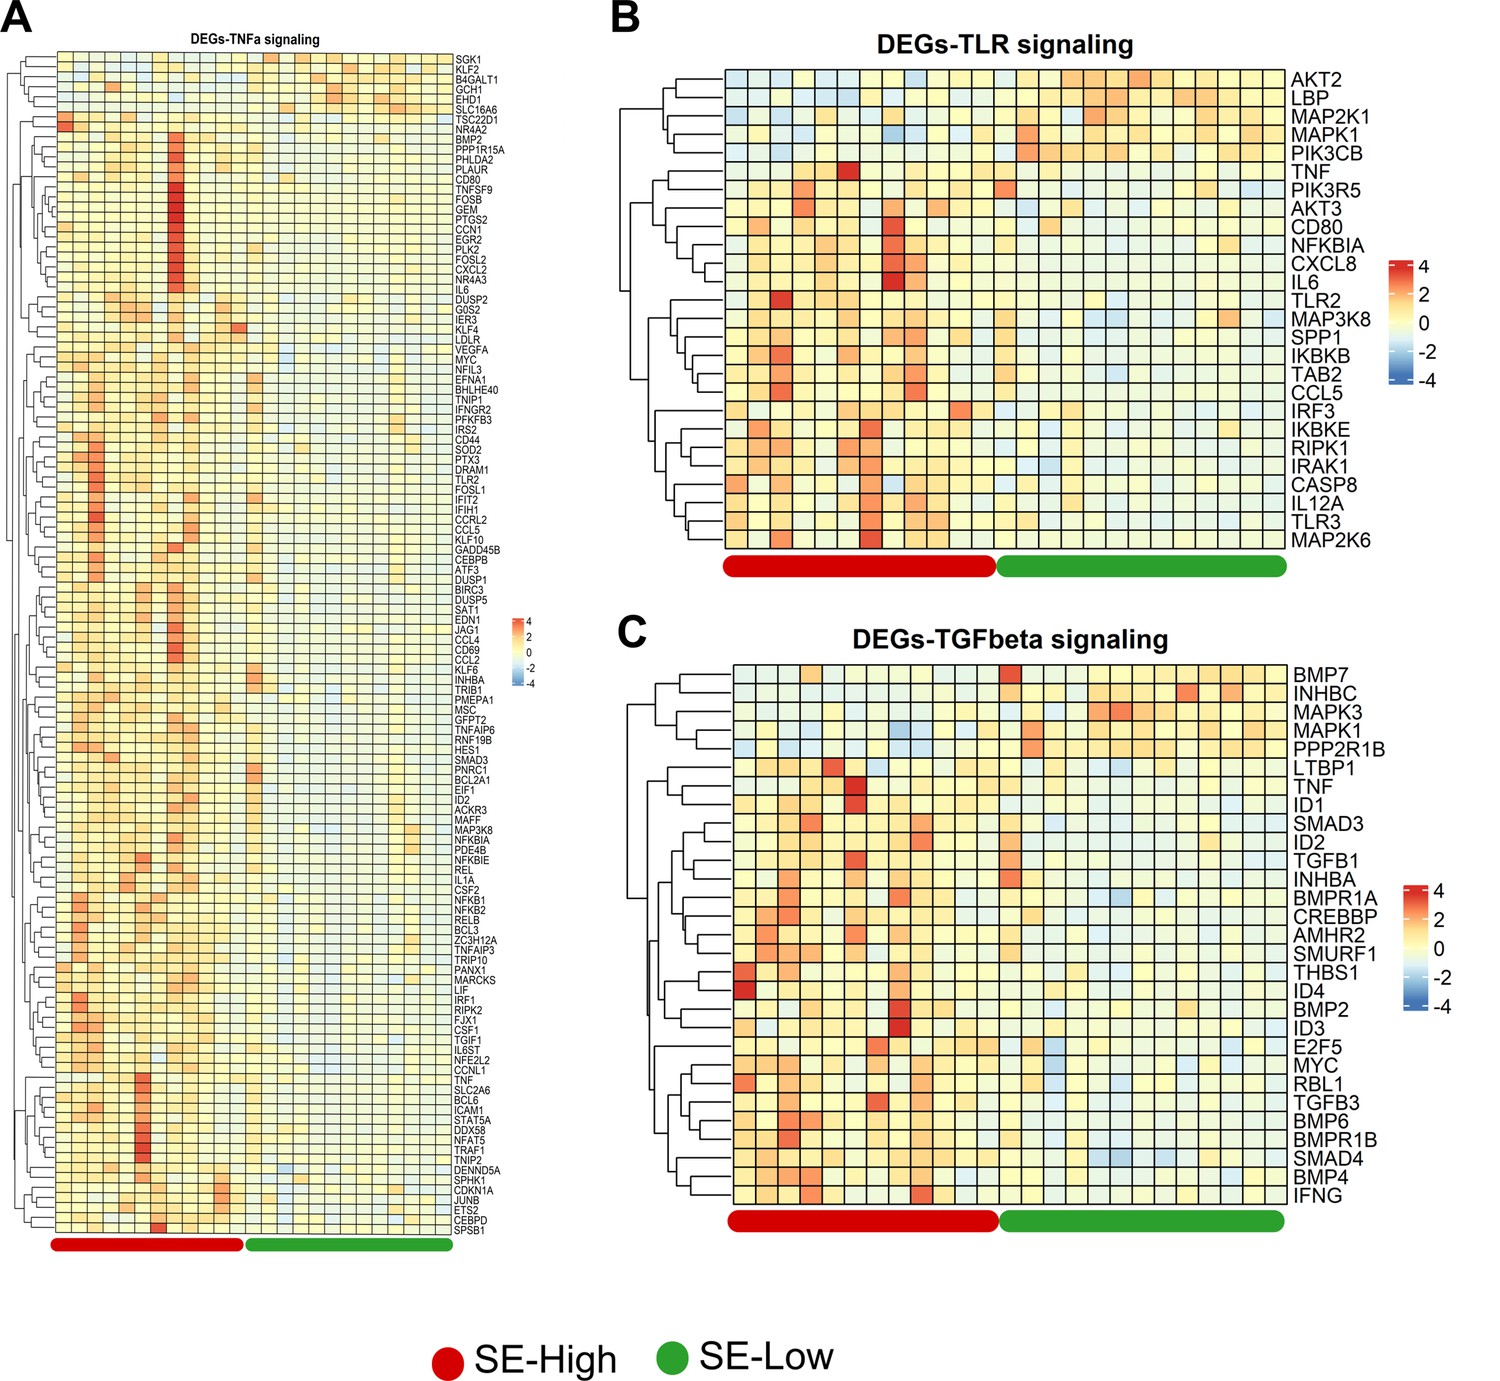
Inflammatory pathways in whole blood transcriptome affected by reduced glucose supply.
(A–C) Heatmaps of differentially expressed genes (DEGs) involved in tumor necrosis factor alpha (TNF-α), toll like receptor (TLR) and transforming growth factor beta (TGF-β) signaling in the enriched pathways.
Differences shown as Z-scores, where red color indicates a higher expression in S. epidermidis (SE)-Low vs SE-High and blue a lower. n=15–16 for each group.
Figure 5
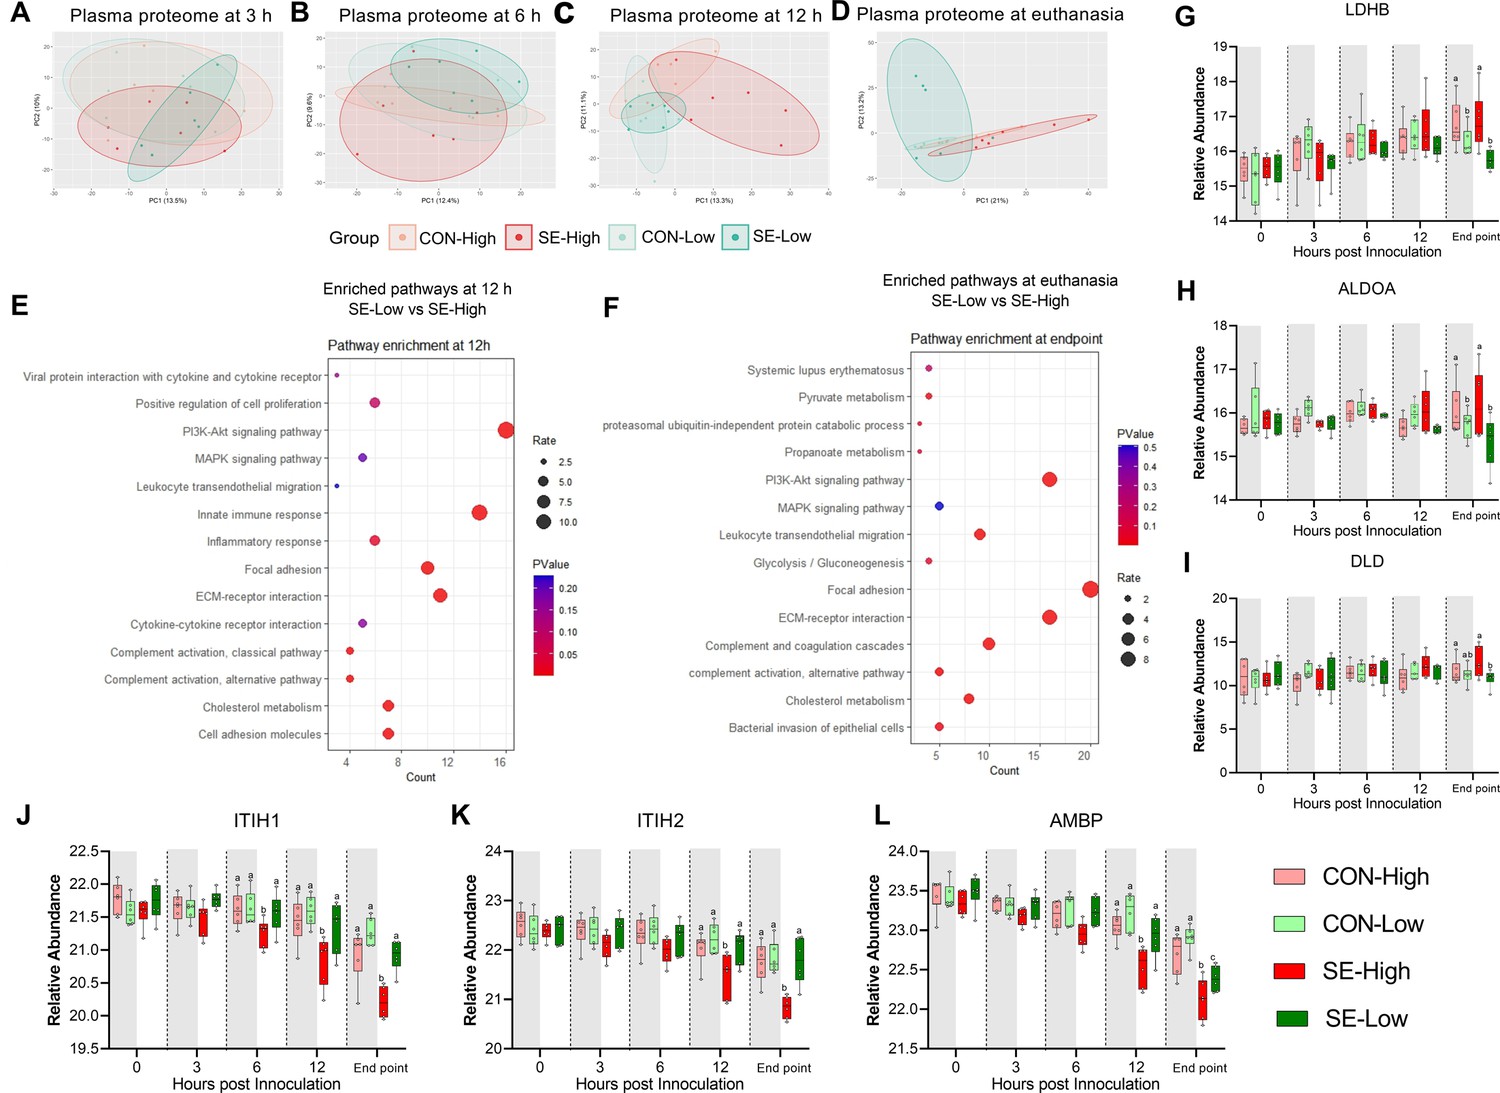
Impacts of glucose supply on plasma proteome at different time points post-bacterial infection.
(A–D) Score plot of principal component analysis of proteome profiling changes from 3 hr to euthanasia among the four groups. (E–F) Top pathways differing between S. epidermidis (SE)-Low and SE-High at 12 hr post bacterial inoculation or euthanasia, were enriched using DAVID. Involved differential expressed proteins (DEPs) counts displayed on Xaxis and size of dots indicates number of DEPs, while red color indicates lower p-value. (G–I) DEPs involved in glycolysis or gluconeogenesis, including Lactate Dehydrogenase B (LDHB), Aldolase, Fructose-Bisphosphate A (ALDOA), Dihydrolipoamide dehydrogenase (DLD). (J–L) DEPs of porcine IAIP related proteins, heavy chains 1 and 2 (ITIH1, ITIH2) and Alpha-1-Microglobulin bikunin precursor (AMBP). (G–L) Shown as relative abundances with 95% box plots, data analyzed separately for each timepoint, bars labeled with different letters are significantly different from each other (p<0.05), n=6 in each group.
-
Figure 5—source data 1
Plasma proteome data.
- https://cdn.elifesciences.org/articles/97830/elife-97830-fig5-data1-v1.xlsx
Figure 6 with 1 supplement
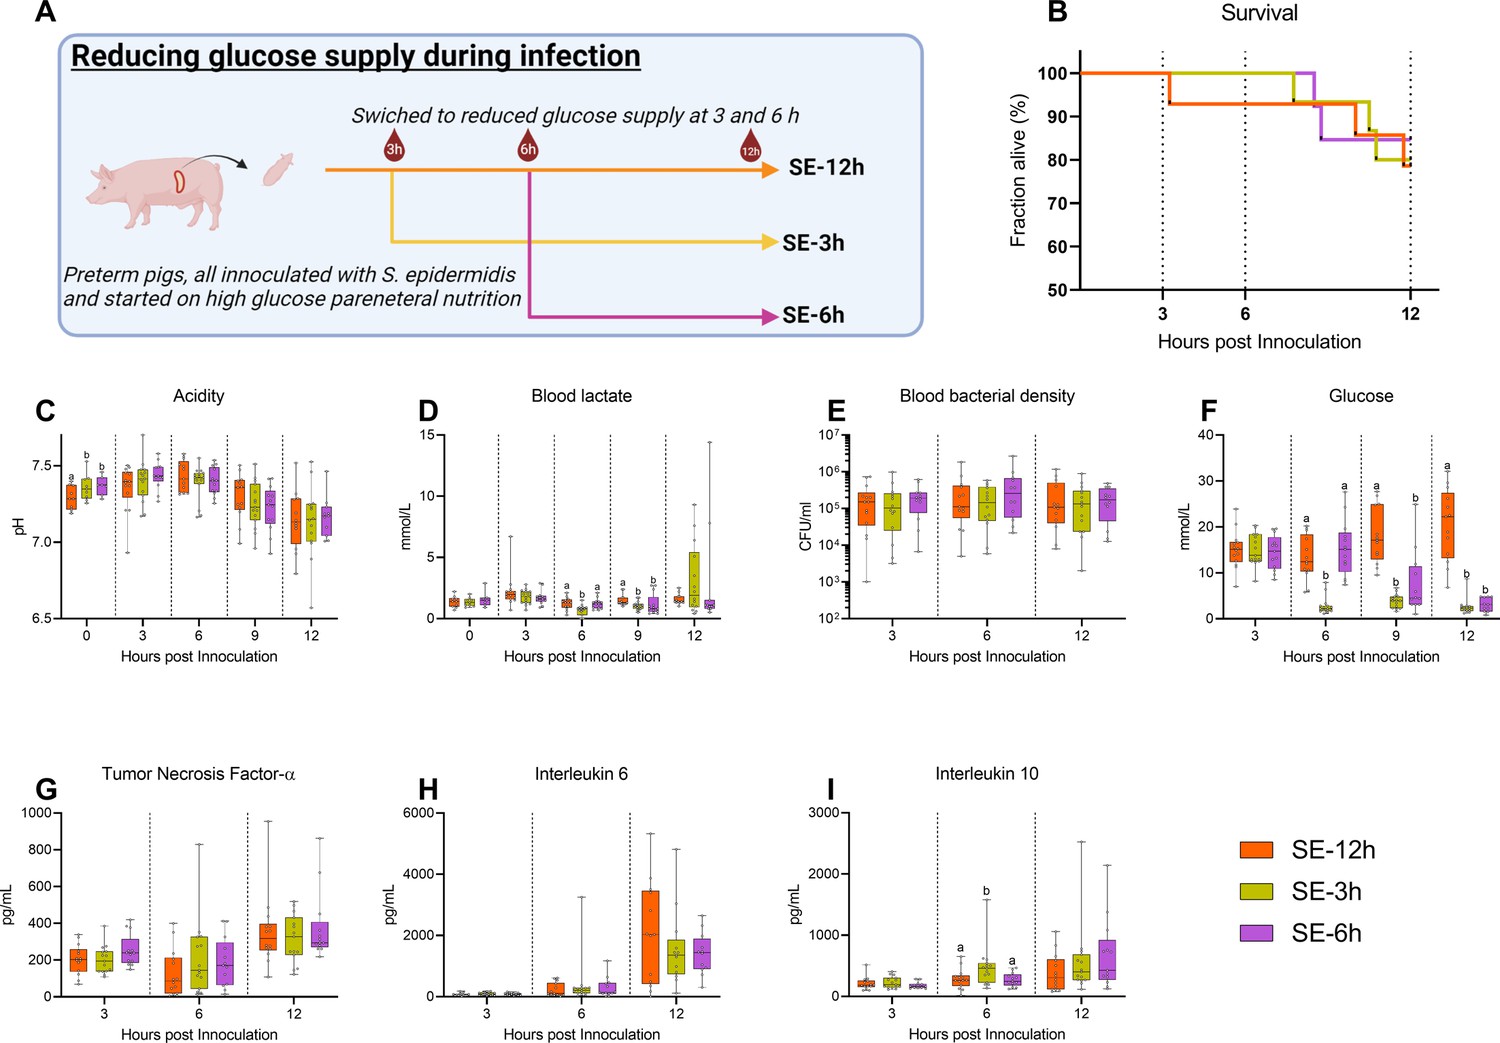
Follow-up experiment investigating effects of changing glucose regimen during infection.
(A) Study overview, preterm pigs were all started on high glucose regimen and inoculated with S. epidermidis. After 3 hr one group was shifted to low glucose parenteral nutrition (PN) (SE-3 hr), while after 6 hr another group was similarly shifted (SE-6 hr) and the remaining pigs continued on high glucose PN for the rest of the experiment (SE-12 hr). This panel was created with BioRender.com. (B) Survival during experiment, presented as Kaplan-Meier curves. (C, D) Blood gas data collected at baseline and 3–12 hr after inoculation. (E) Blood bacterial density 3–12 hr after inoculation, shown on a logarithmic scale. (F) Blood glucose levels 3–12 hr after inoculation. (G–I) Plasma cytokine levels 3–12 hr after inoculation. (C–I) Presented as 95% box plots, data at each time point analyzed separately, bars labeled with different letters are significantly different from each other (p<0.05), n=11–14 for SE-12 hr, n=12–15 for SE-3 hr and n=10–12 for SE-6 hr.
-
Figure 6—source data 1
Clinical and immunological data for follow-up experiment.
- https://cdn.elifesciences.org/articles/97830/elife-97830-fig6-data1-v1.xls
Figure 6—figure supplement 1
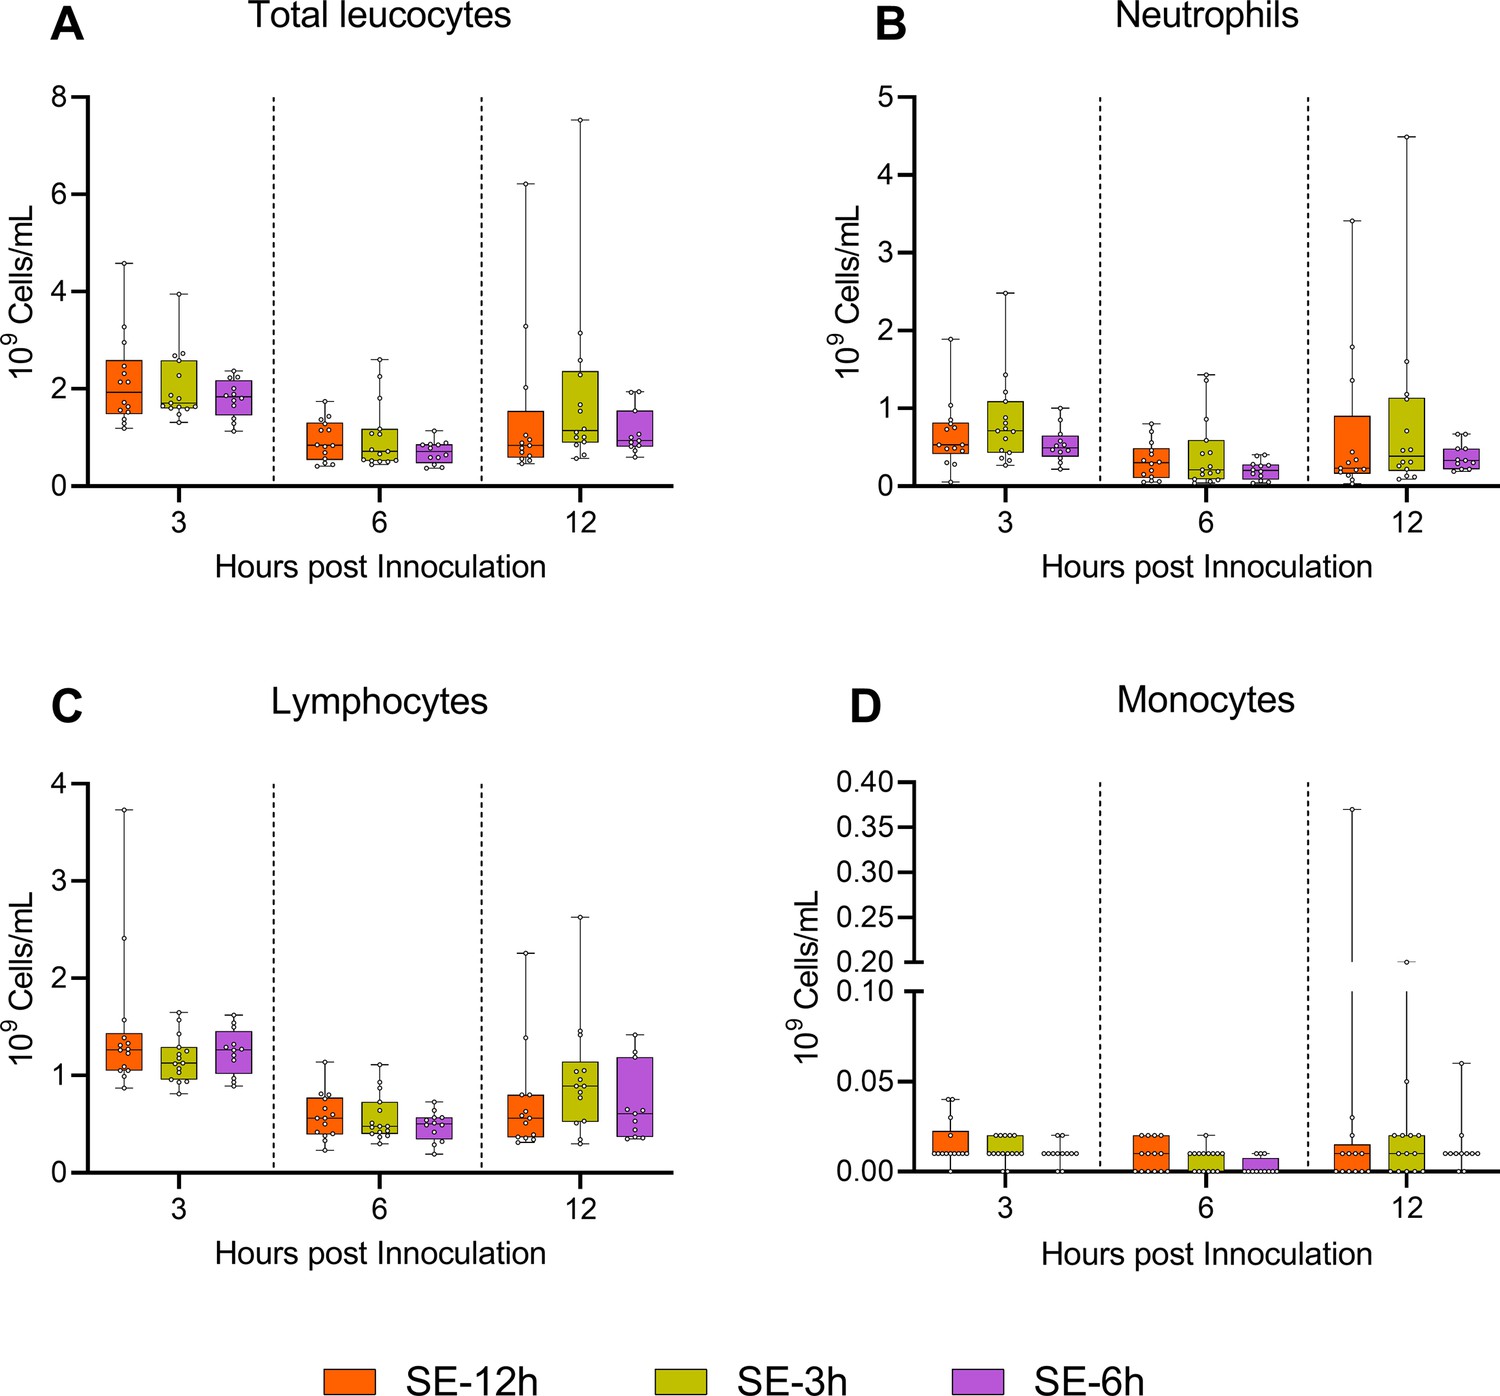
Hematological parameters follwing reduction in glucose supply after 3 and 6 hours.
(A–D) Leukocyte subsets at 3, 6, and 12 hr after bacterial inoculation, shown as 95% box plots.
n=11–14 for SE-12 hr, n=12–15 for SE-3 hr and n=10–12 for SE-6 hr.
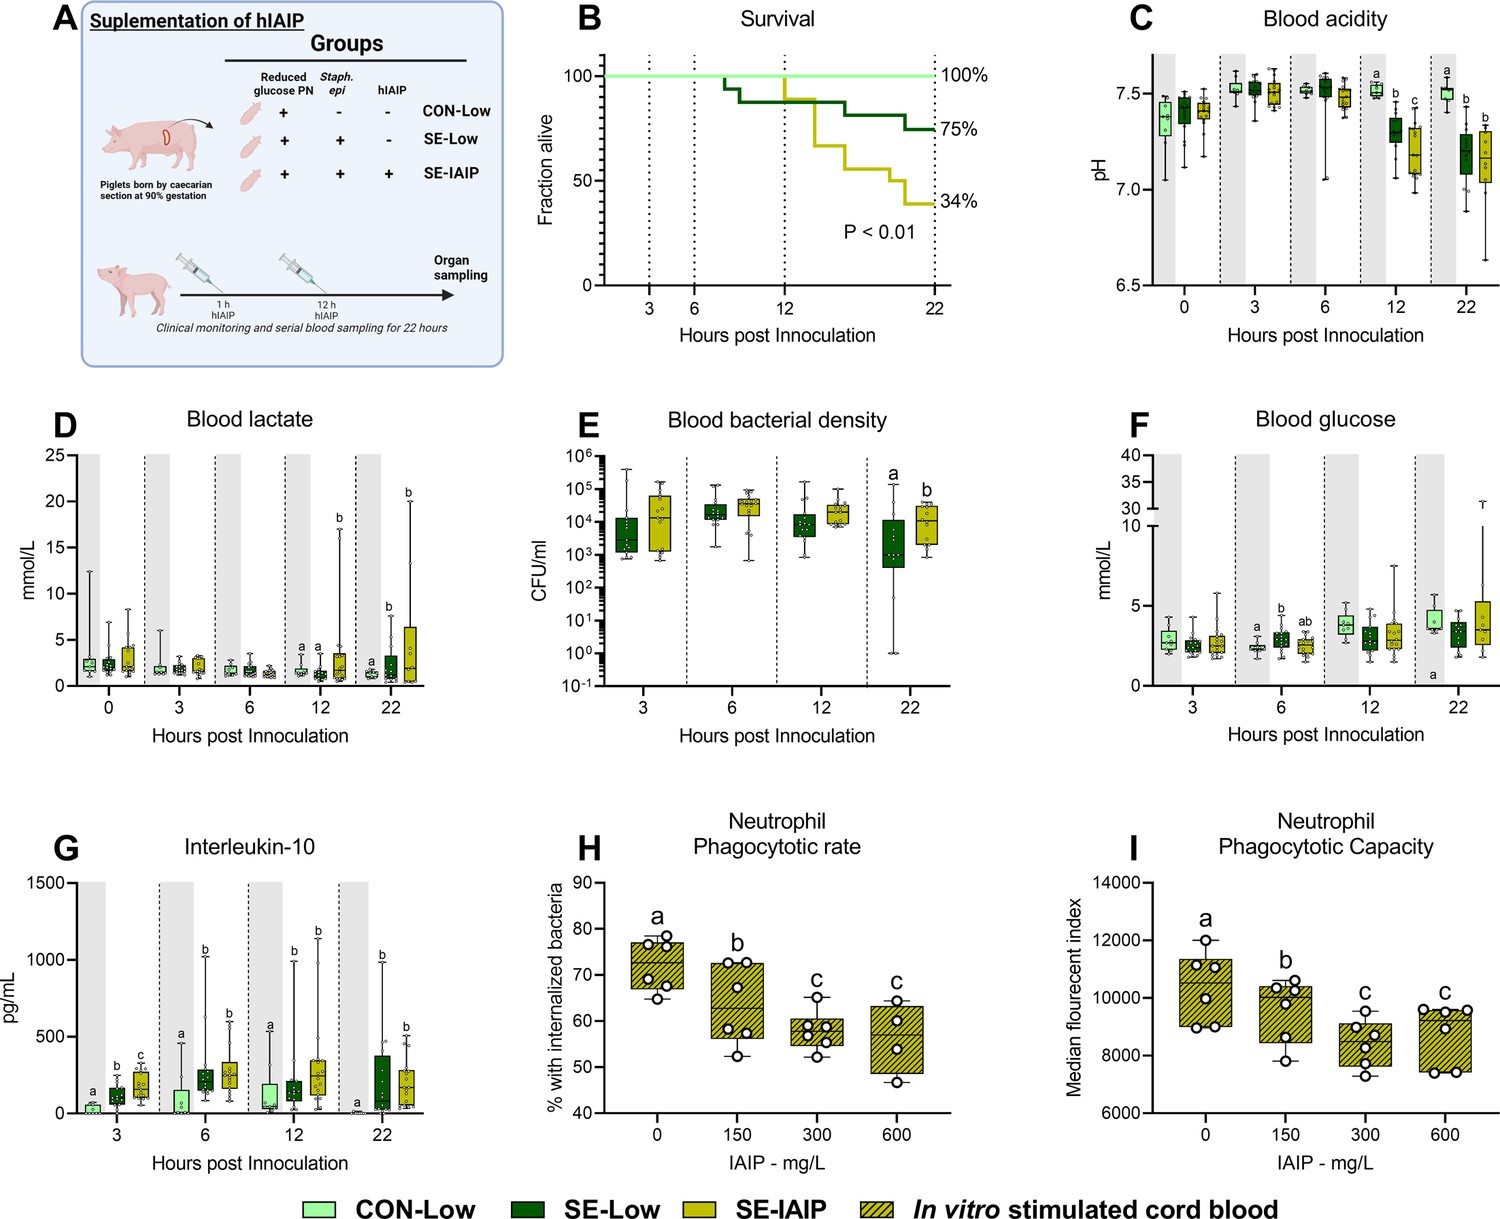
Figure 7 with 1 supplement
Human IAIP intervention, clinical, and immunological results.
(A) Study overview, preterm pigs were nourished low (5%, 7.2 g/kg/d) glucose parenteral nutrition and infused with either Staphylococcus epidermidis or control saline. At one and 12 hr post inoculation, infected animals were treated with either human inter-alpha inhibitor protein (IAIP) (50 mg/kg) or saline and followed for 22 hr while blood samples collected for further analysis. This panel was created with BioRender.com. (B) Survival of animals during experiment, presented as time to euthanasia according to predefined humane endpoints with corresponding log-rank test comparing S. epidermidis (SE)-Low and SE-IAIP (C) Blood glucose, measured by glucose meter 3, 6 and 12 hr after SE inoculation as well as at euthanasia, presented as 95% box plots. (D, E) Blood gas parameters collected before inoculation with SE (0 hr) and 3, 6, and 12 hr after as well as at euthanasia, presented as 95% box plots. (F) Blood bacterial density in infected groups at 3, 6, 12 and 22 hr after bacterial inoculation, presented as 95% box plots on a logarithmic scale. (G) Plasma IL-10 and blood neutrophil fraction at 3, 6, 12 and 22 hr after bacterial inoculation, presented as 95% box plots. (H, I) Cord blood neutrophil phagocytic rate and capacity following in vitro challenge with fluorescently labeled E. coli and treatment with increasing doses of IAIP, n=7. (C–H) Data at each time point analyzed separately, bars labeled with different letters are significantly different from each other (p<0.05), n=8 for control animals, and 10–18 for infected groups. .
Figure 7—figure supplement 1
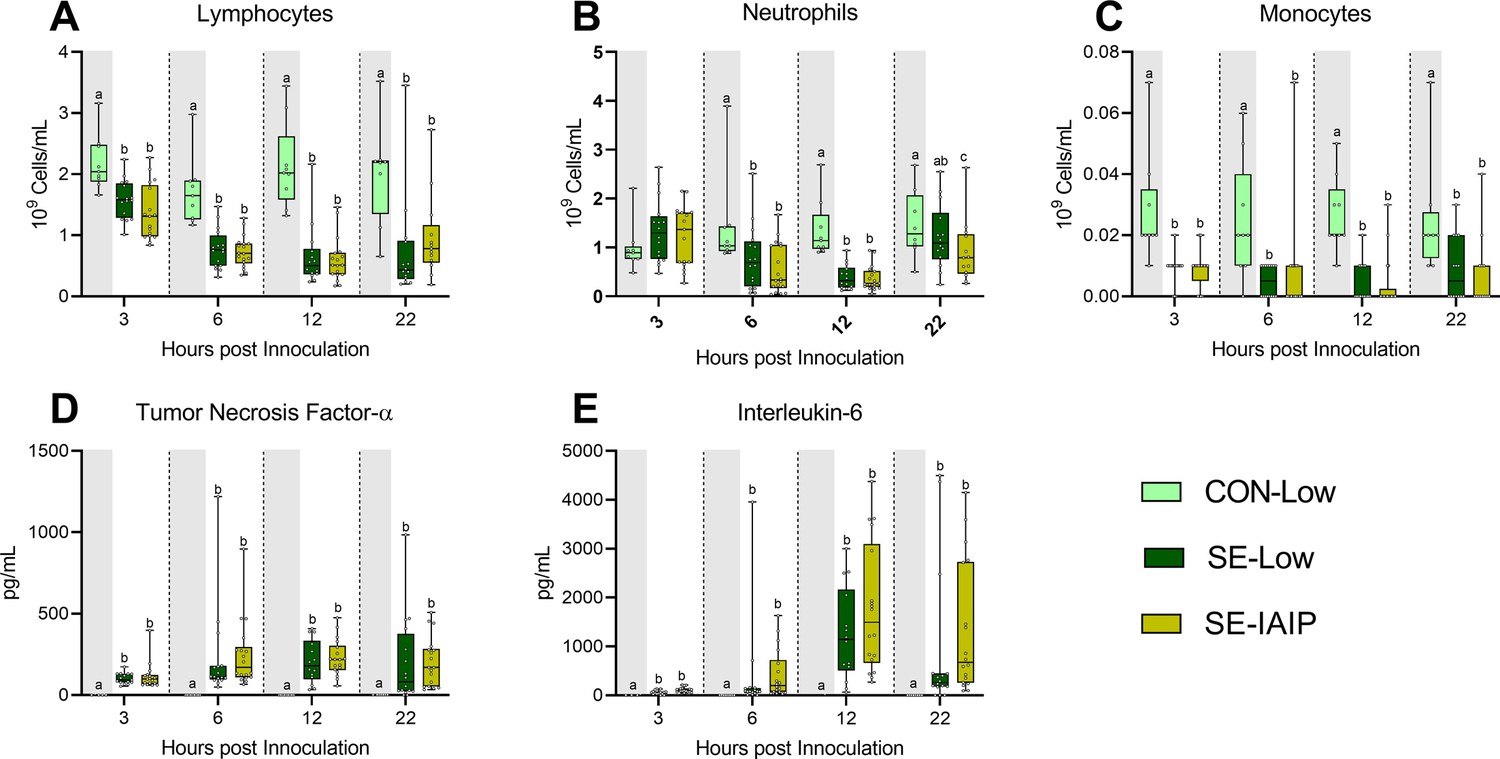
Immunological parameters in animals treated with IAIP.
(A–C) Blood leukocyte subsets at 3, 6, and 12 hr after bacterial inoculation. (D, E) Plasma levels of cytokines at 3, 6, and 12 h after bacterial inoculation. All shown as Data at each time point shown as 95% box plots and analyzed separately, bars labeled with different letters are significantly different from each other (p<0.05), n=8 for control animals, and 10–18 for infected groups.
Additional files
-
Supplementary file 1
Differentially expressed genes from hepatic transcriptome.
- https://cdn.elifesciences.org/articles/97830/elife-97830-supp1-v1.xlsx
-
Supplementary file 2
Differentially expressed genes in whole blood transcriptome.
- https://cdn.elifesciences.org/articles/97830/elife-97830-supp2-v1.xlsx
-
Supplementary file 3
Differentially expressed metabolites in plasma metabolome.
- https://cdn.elifesciences.org/articles/97830/elife-97830-supp3-v1.xlsx
-
Supplementary file 4
Differentially expressed proteins in plasma proteome.
- https://cdn.elifesciences.org/articles/97830/elife-97830-supp4-v1.xlsx
-
MDAR checklist
- https://cdn.elifesciences.org/articles/97830/elife-97830-mdarchecklist1-v1.docx
-
Source data 1
Clinical and immunological data for main experiment, related to Figure 1 and Figure 7.
- https://cdn.elifesciences.org/articles/97830/elife-97830-data1-v1.xlsx
Download links
A two-part list of links to download the article, or parts of the article, in various formats.
Downloads (link to download the article as PDF)
Open citations (links to open the citations from this article in various online reference manager services)
Cite this article (links to download the citations from this article in formats compatible with various reference manager tools)
Altered hepatic metabolism mediates sepsis preventive effects of reduced glucose supply in infected preterm newborns
eLife 13:RP97830.
https://doi.org/10.7554/eLife.97830.3


