Endosomal sorting protein SNX4 limits synaptic vesicle docking and release
- Department of Functional Genomics, Center for Neurogenomics and Cognitive Research (CNCR), VU University, Netherlands
- Department of Human Genetics, CNCR, Amsterdam UMC, Netherlands
Figures
Figure 1
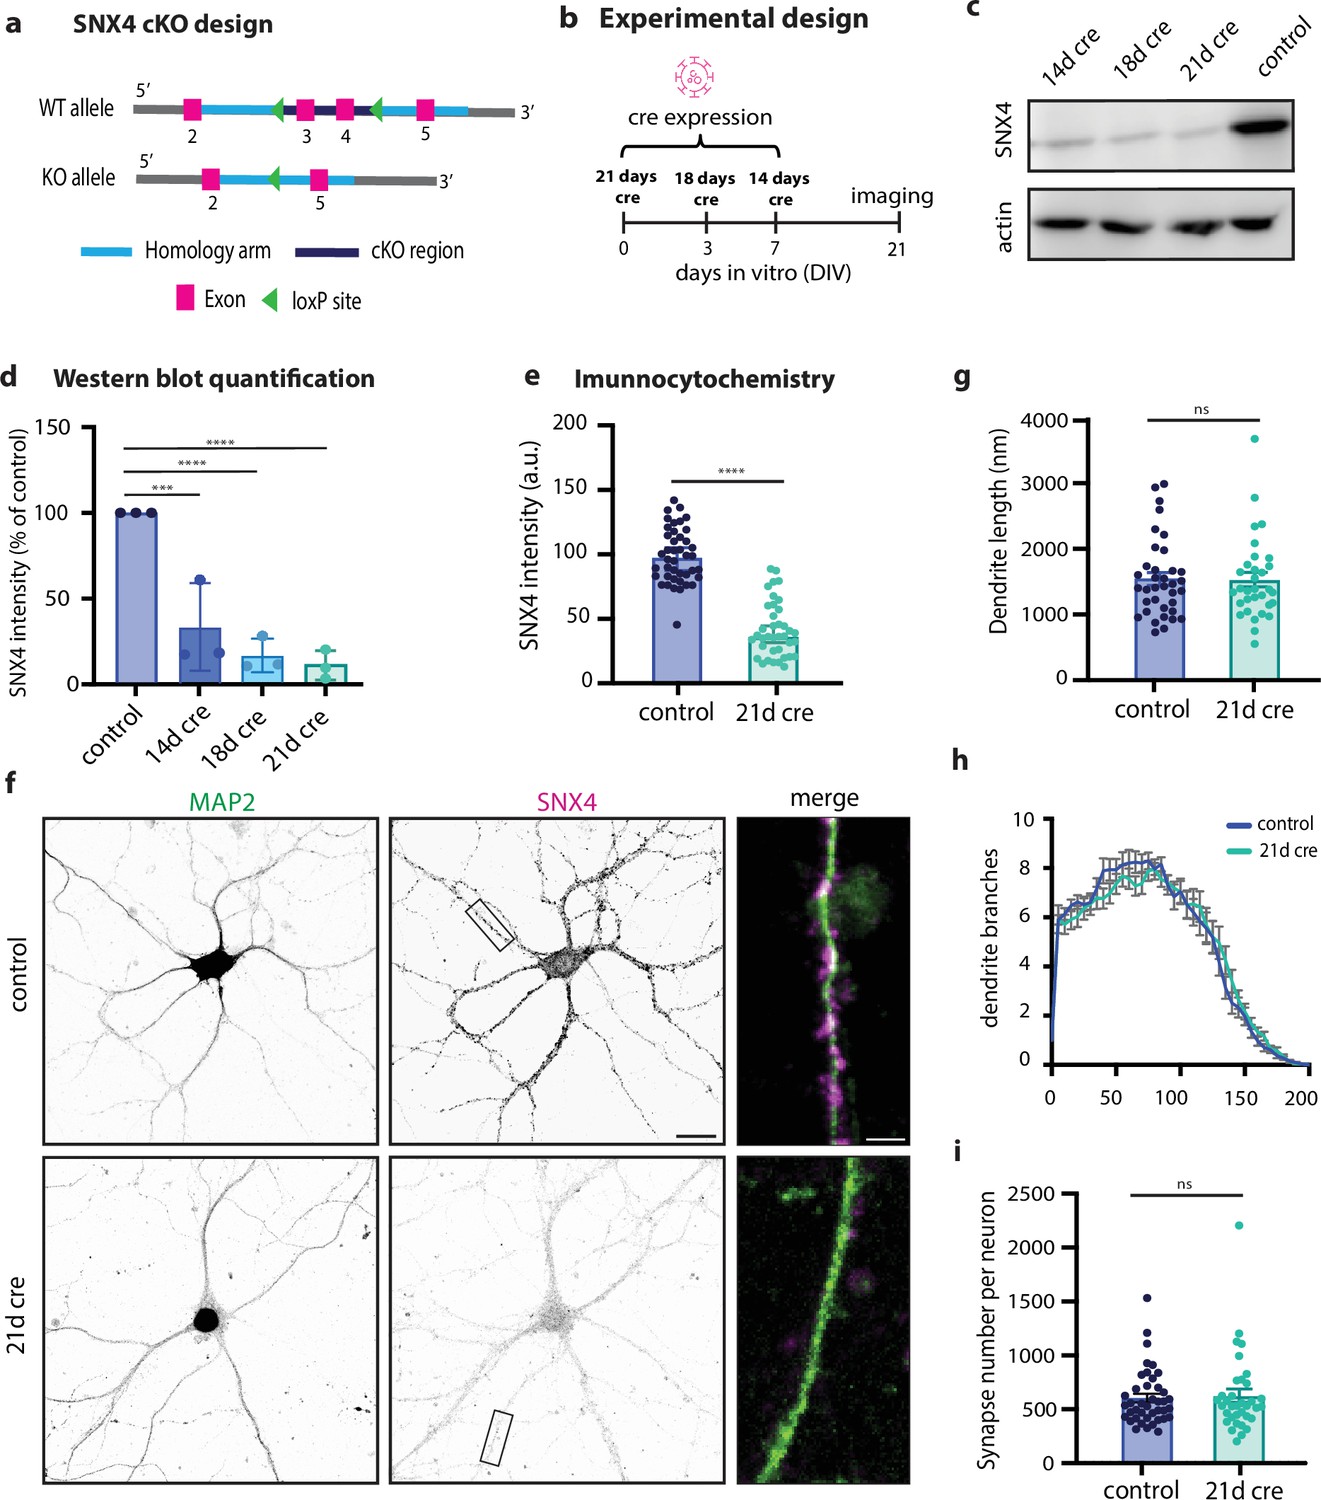
SNX4 is knocked out in primary hippocampal neurons using a novel conditional knock-out mouse line.
(a) Schematic overview of conditional knock-out design of SNX4. (b) Schematic overview of experimental design using Cre intervention at different DIVs. (c) Typical example of western blot of SNX4 and actin at 14 days, 18 days, and 21 days of Cre and control (delta-Cre) expression. (d) Quantification of western blot SNX4 protein levels for control (dcre), 14 days of Cre, 18 days of Cre, and 21 days of Cre, normalized to control. (e) Quantification of immunocytochemistry SNX4 intensity normalized to control. (f) Typical example of primary hippocampal neurons stained for SNX4 (magenta) and MAP2 (green) for control and 21 days of Cre. Scale bar = 20 µm. Zoom-in scale bar = 3 µm. (g) Dendrite length for control and KO hippocampal neurons. (h) Sholl analysis for number of dendrite branches. (i) Number of synapses per neuron (MAP2 mask) based on VAMP2 puncta (shown in Figure 4). ****p=<0.0001, ***p=0.0003, **p=0.0005, *p=0.0019. Ordinary one-way ANOVA with Tukey’s multiple comparisons test for (d) with N=3 animals. Mann-Whitney test for (e, g, and h) with n=32–42 neurons per group and N=6 animals. Data points represent individual western blots/neurons; bar graph represents mean with SEM.
-
Figure 1—source data 1
Original files for western blot analysis displayed in Figure 1c.
- https://cdn.elifesciences.org/articles/97910/elife-97910-fig1-data1-v1.zip
-
Figure 1—source data 2
EPS file of the full western blots displayed in Figure 1c.
- https://cdn.elifesciences.org/articles/97910/elife-97910-fig1-data2-v1.zip
Figure 2 with 2 supplements
SNX4 depletion increases sustained synaptic vesicle release.
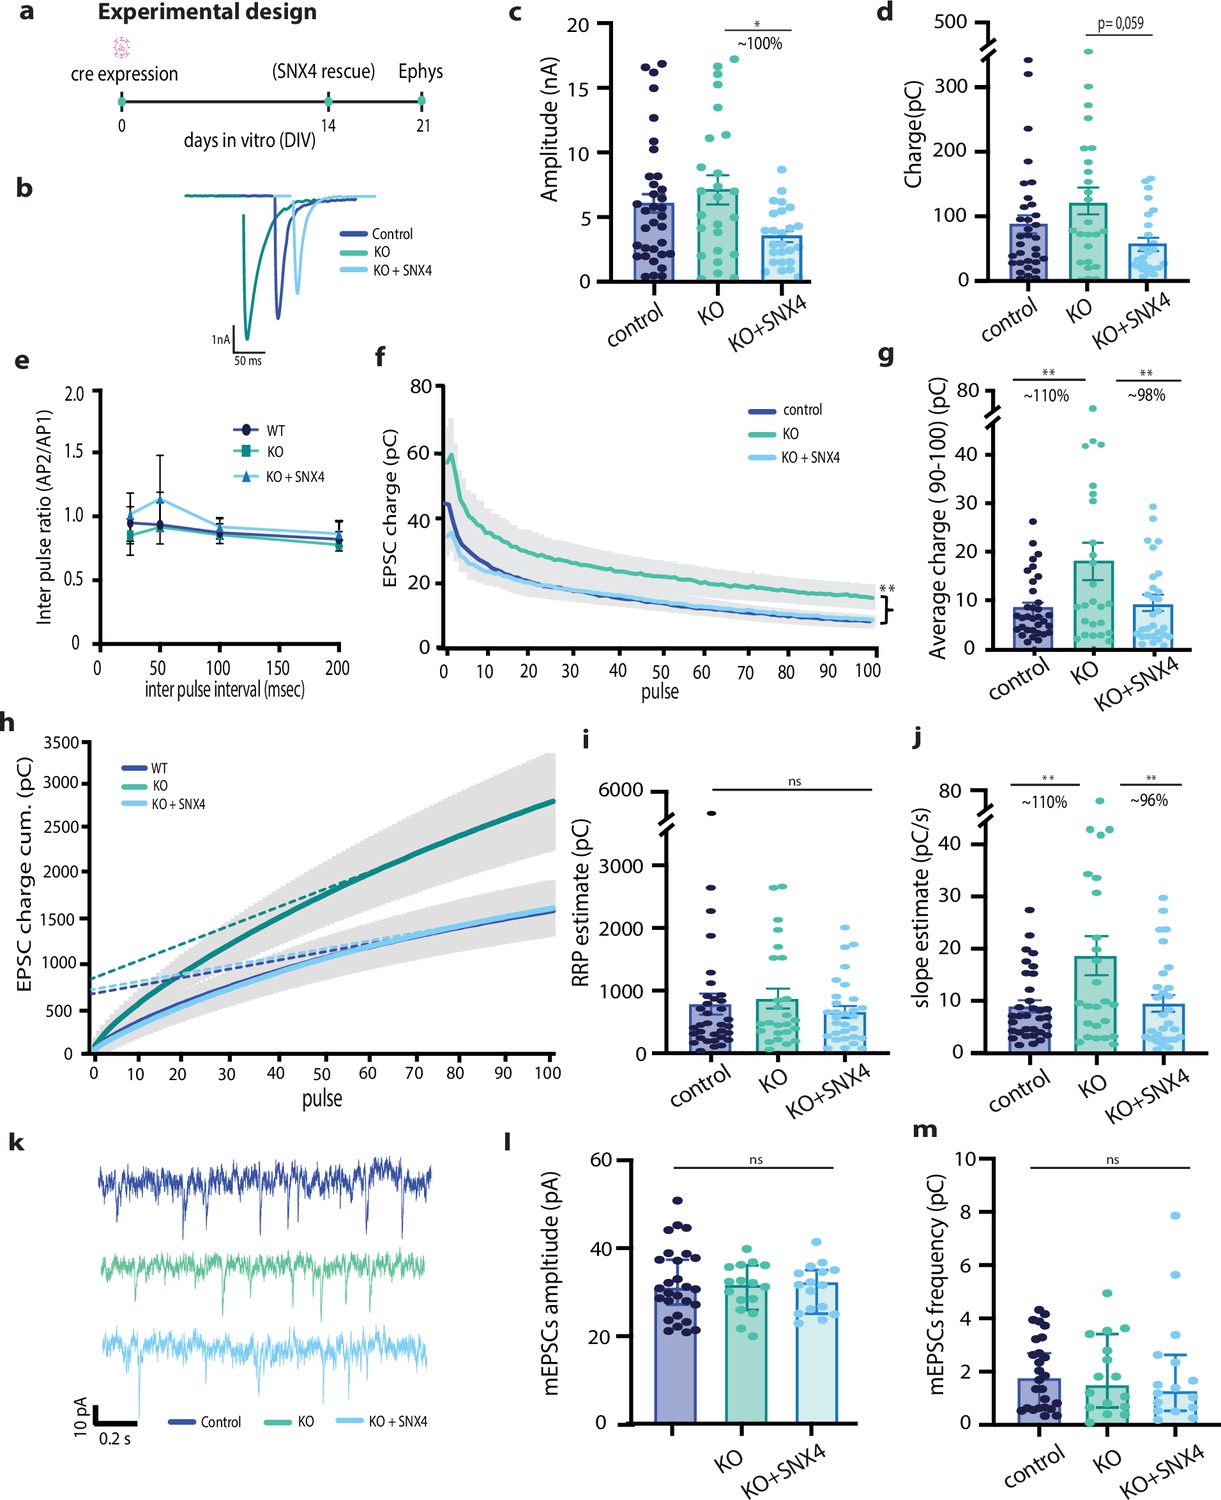
(a) Schematic overview of experimental design using Cre intervention at days in vitro (DIV)0, SNX4 rescue at DIV14, and recording at DIV21. (b) Representative traces of the first evoked response for control, KO, and KO+SNX4 upon stimulation. (c) Amplitude of first evoked response. (d) Charge of first evoked response. (e) Paired pulse ratios of amplitude at inter pulse intervals of 25, 50, 100, and 200 ms. (f) Mean EPSC charge trace for 100 action potentials (APs) at 40 Hz train. (g) Average charge at pulse 90–100. (h) Cumulative EPSC charge for 100 APs at 40 Hz train with back extrapolation linear fit to APs 80–100. (i) Estimate of RRP based on back extrapolation (h). (j) Estimate of slope based on back extrapolation. (k) Representative traces of miniature EPSC (mEPSC) response for control, KO, and KO+SNX4. (l) mEPSC amplitude, (m) mEPSC frequency. Multilevel ANOVA with n=25–38 neurons per group of N=3–4 animals. ***p<0.0001, **p<0.001. Data points represent individual neurons; bar graph represents mean with SEM.
Figure 2—figure supplement 1

EPSC charge for 5 and 10 Hz train stimulation.
(a) Mean EPSC charge trace for 100 action potentials (APs) at 5 Hz train. (b) Mean EPSC charge trace for 100 APs at 10 Hz train.
Figure 2—figure supplement 2

SNX4 overexpression does not affect first evoked EPSC or neurotransmission during sustained release.
(a) Representative traces of the first evoked response for control and control+SNX4 upon stimulation. (b) Amplitude of first evoked response. (c) Charge of first evoked response. (d) Mean EPSC charge trace for 100 action potentials (APs) at 40 Hz train. (e) Average charge at pulse 90–100. Multilevel ANOVA with n=22–26 neurons per group of N=4–6 animals. Data points represent individual neurons; bar graph represents median+95% confidence interval.
Figure 3
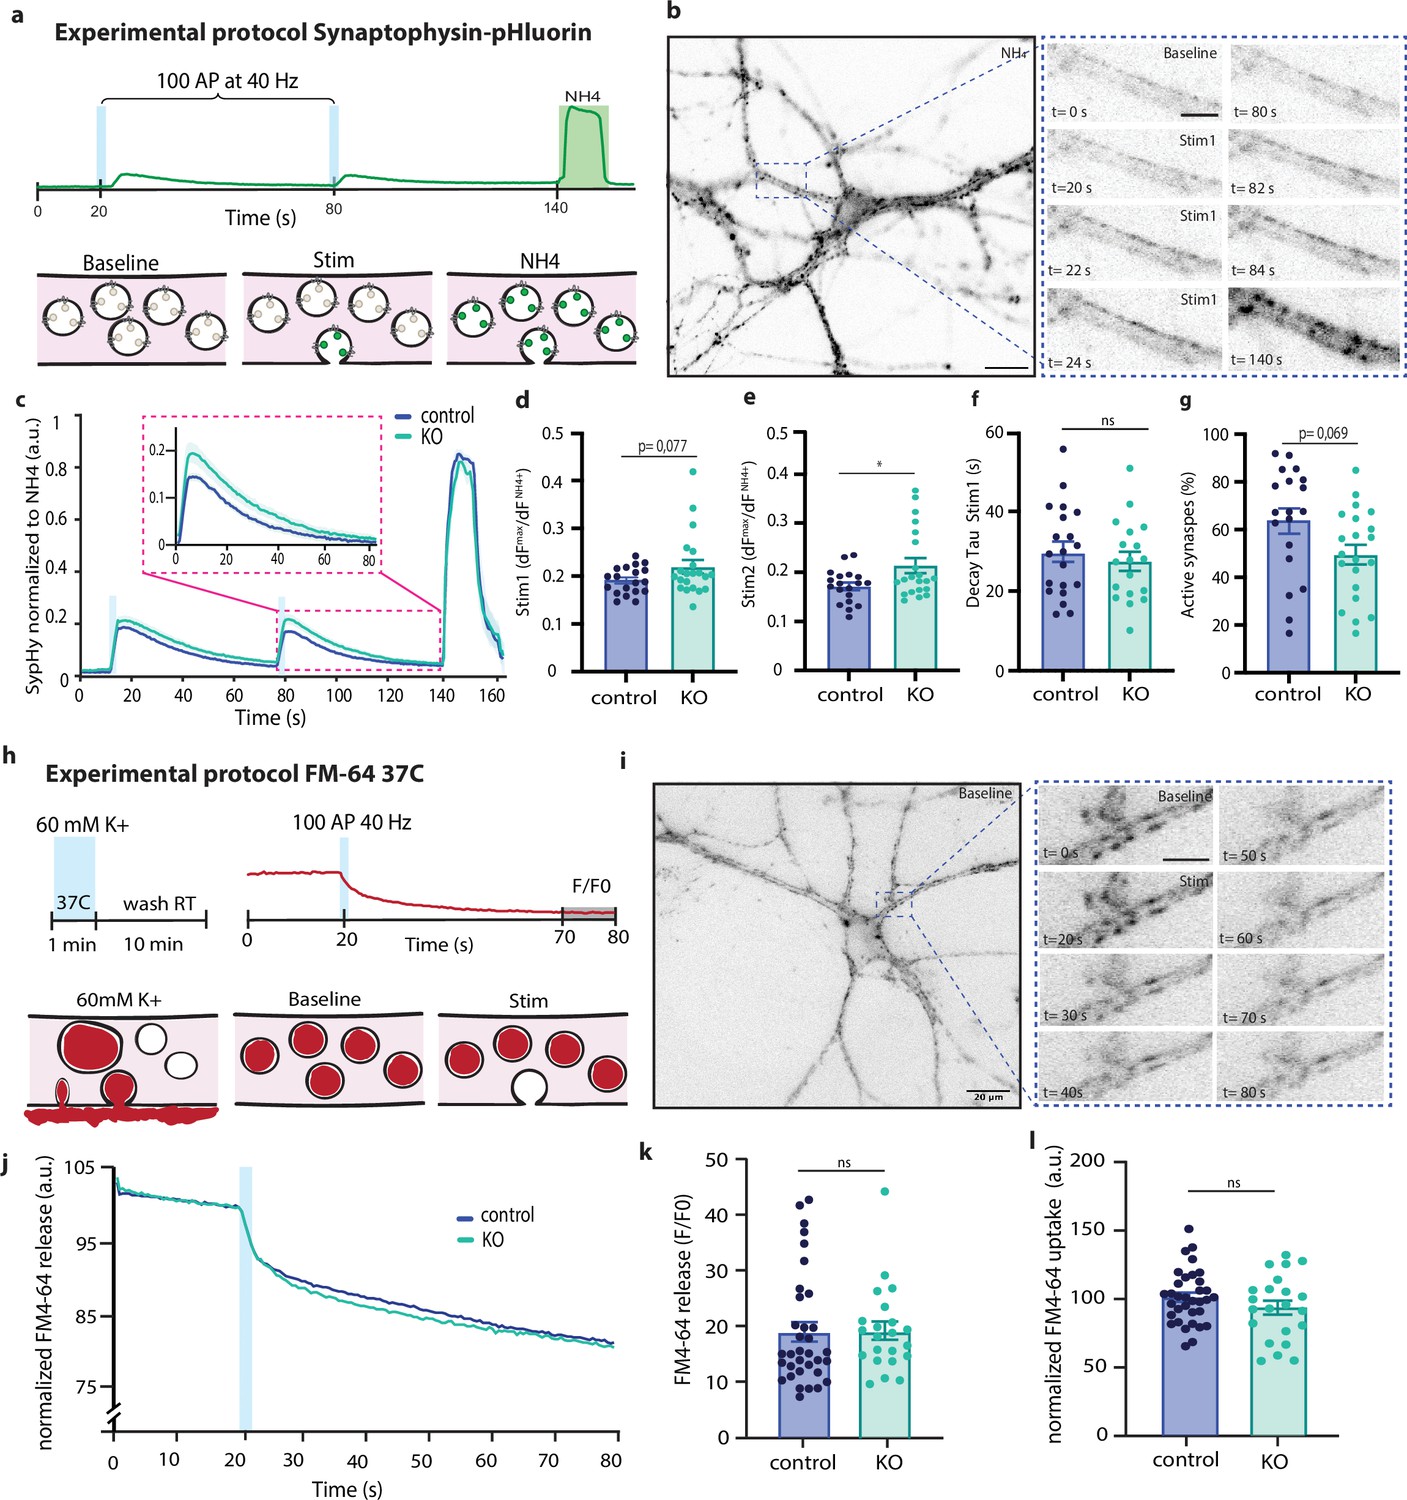
SNX4 depletion does not affect synaptic vesicle (SV) recycling at room temperature and physiological temperatures.
(a) Stimulation paradigm with a single vesicle fluorescence intensity trace. (b, Left) Representative image of a synaptophysin-super-ecliptic-pHluorin (SypHy)-infected neuron during Tyrode’s NH4 application (scale bar: 20 µm). (Right) Neurite before (baseline) and during (100 action potentials [APs] at 40 Hz) stimulation and during NH4 application (NH4) (scale bar: 10 µm). (c) The average fluorescence normalized from baseline to maximum SypHy intensity during Tyrode’s NH4 application. (d) Maximum response amplitude during the first electrical stimulation normalized to maximum NH4 response plotted as ΔFmax/FNH4. (e) Maximum response amplitude during the second electrical stimulation normalized to maximum NH4 response plotted as ΔFmax/FNH4. (f) Fluorescence decay time constant tau in the 60 s after electrical stimulation representing SV endocytosis and acidification. (g) Percentage active synapses. (h) Stimulation paradigm with a single vesicle fluorescence intensity trace. Recycling SVs are labeled by 60 s incubation with FM4-64 in 60 mM K+ at 37°C, followed by a 10 min washout. Electrical field stimulation (100 APs, 40 Hz) triggers SV exocytosis recorded as decreased FM4-64 fluorescence intensity. (i, Left) Representative image of FM64-dye endocytosed by a neuron during baseline (scale bar: 20 µm). (Right) Neurite before (baseline) and during (100 APs at 40 Hz) stimulation (scale bar: 10 µm). (j) The average FM4-64 fluorescence traces, normalized to control baseline, over time showing initial SV loading, followed by release after electrical field stimulation. (k) FM4-64 release upon electrical field stimulation. (l) FM4-64 uptake (upon 60 mm K+ incubation). Multilevel ANOVA with N=3 animals and n=21–24 neurons per group for SypHy experiment and N=4 animals with n=28–36 neurons per group for FM64-dye experiment. Bar graph represents mean with SEM. Data points represent individual fields of view.
Figure 4 with 1 supplement
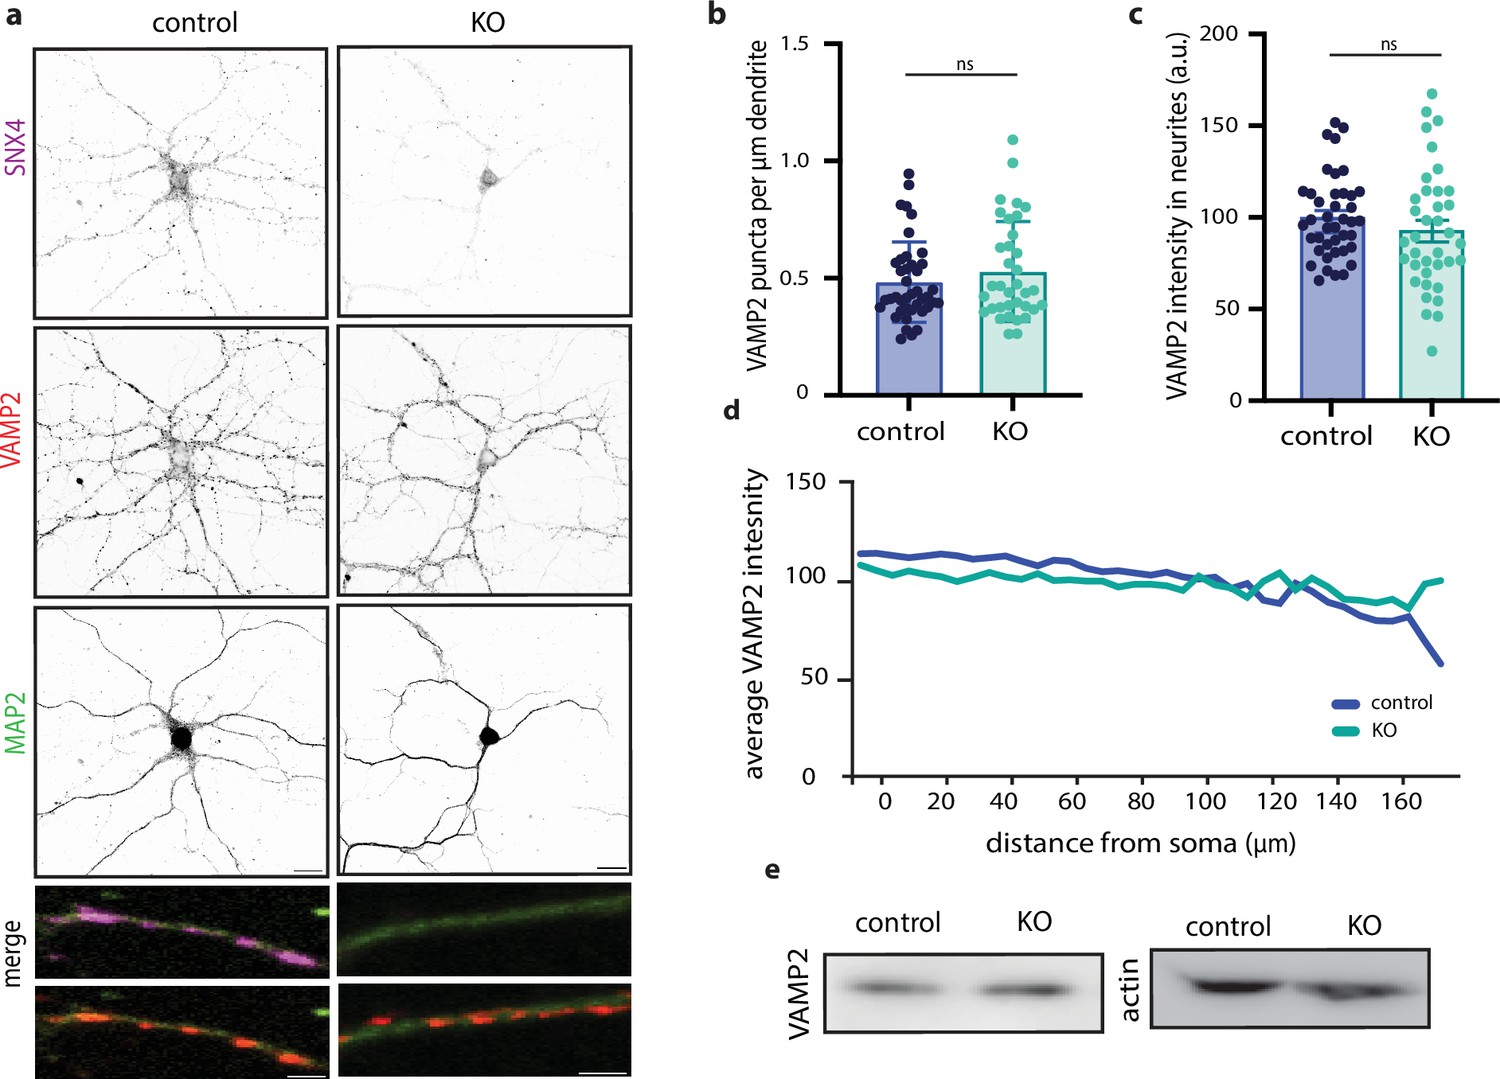
SNX4 depletion does not decrease VAMP2 levels and localization.
(a) Typical example immunocytochemistry images of primary hippocampal neurons stained for SNX4 (magenta), VAMP2 (red), and MAP2 (green) from control and SNX4 cKO mice. Scale bar = 20 µm. Merge zoom-in scale bar = 2 µm. (b) VAMP2 puncta per µm dendrite for control and KO. (c) VAMP2 intensity measured in dendrites. (d) Sholl analysis of average VAMP2 intensity over distance from the soma for control and KO. (I) Western blot of SNX4, VAMP2, and actin for control and KO. Data points represent individual neurons, N=6 animals and n=35–41 neurons for VAMP2 data, bar graphs represent mean with SEM.
-
Figure 4—source data 1
Original files for western blot analysis displayed in Figure 4e.
- https://cdn.elifesciences.org/articles/97910/elife-97910-fig4-data1-v1.zip
-
Figure 4—source data 2
EPS file of the full western blots displayed in Figure 4e.
- https://cdn.elifesciences.org/articles/97910/elife-97910-fig4-data2-v1.zip
Figure 4—figure supplement 1

Autophagy markers remain unaffected upon SNX4 depletion.
(a) Typical example immunocytochemistry images of primary hippocampal neurons stained for P62 (magenta) and MAP2 (green) from control and SNX4 cKO mice with and without bafilomycin treatment. Scale bar = 20 µm. (b) P62 puncta control and KO. (c) P62 intensity measured in soma. (d) Western blot of ATG5 and actin for control and KO. (e) Quantification for total ATG5 expression levels normalized to GAPDH and control. (f) Typical example of autophagosomes characterized by double membrane in electron micrographs of control and KO. (g) Overview of number of micrographs of synaptic regions containing autophagosomes for control and KO. Bar graphs represent median with 95% CI. For (a–c) n=25–27 per group, N=3, for (f–g) n=165–170 photo’s per group from N=3.
-
Figure 4—figure supplement 1—source data 1
Original files for western blot analysis displayed in Figure 4—figure supplement 1d.
- https://cdn.elifesciences.org/articles/97910/elife-97910-fig4-figsupp1-data1-v1.zip
-
Figure 4—figure supplement 1—source data 2
EPS file of the full western blots displayed in Figure 4—figure supplement 1d.
- https://cdn.elifesciences.org/articles/97910/elife-97910-fig4-figsupp1-data2-v1.zip
Figure 5 with 1 supplement
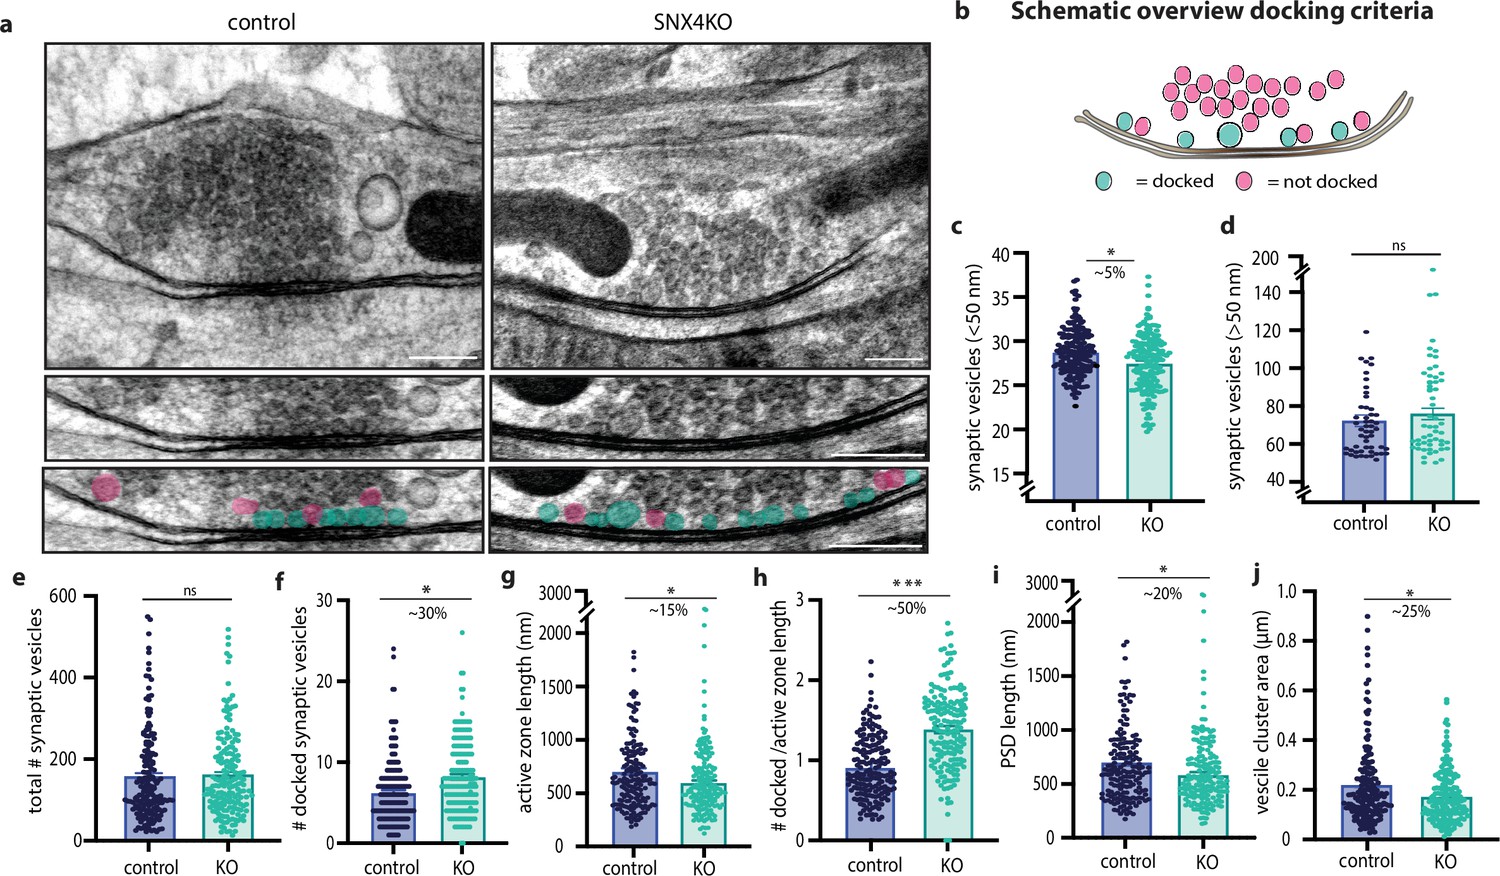
SNX4 depletion increases the number of docked vesicles at the active zone.
(a) Example micrographs of control and SNX4 cKO synapses (scale bar: 200 nm) with zoom-in on the active zone region indicating docked (blue) and non-docked vesicles (pink) (scale bar: 100 nm). (b) Schematic overview of docked and undocked vesicles. (c and d) The average vesicle size, distinguished between synaptic vesicles (<50 nm) and larger clear core vesicles (>50 nm). (e) The total amount of synaptic vesicles in the synaptic cloud. (f) The number of docked synaptic vesicles in control and SNX4 cKO synapses. (g) The active zone length. (h) The number of docked vesicles normalized to active zone length. (i) The postsynaptic density (PSD) length. (j) The area of the vesicle cloud in control and SNX4 cKO synapses. Bar graphs represent mean with SEM with n=174–175 synapses per group of N=3 animals. Data points are individual synapses. ***p<0.0001, **p<0.001 using Mann-Whitney test.
Figure 5—figure supplement 1

Histogram of vesicle size for control and SNX4KO synapses.
(a) Histogram of number of vesicles in bins per 10 nm.
Additional files
-
Supplementary file 1
Statistics overview per figure.
Overview of experiments per figure with N number, mean, median, SEM, SD, performed statistical test, and p-value.
- https://cdn.elifesciences.org/articles/97910/elife-97910-supp1-v1.xlsx
-
MDAR checklist
- https://cdn.elifesciences.org/articles/97910/elife-97910-mdarchecklist1-v1.docx
Download links
A two-part list of links to download the article, or parts of the article, in various formats.
Downloads (link to download the article as PDF)
Open citations (links to open the citations from this article in various online reference manager services)
Cite this article (links to download the citations from this article in formats compatible with various reference manager tools)
Endosomal sorting protein SNX4 limits synaptic vesicle docking and release
eLife 13:RP97910.
https://doi.org/10.7554/eLife.97910.3


