Tumor-infiltrating nerves functionally alter brain circuits and modulate behavior in a mouse model of head-and-neck cancer
- Sanford Research, Cancer Biology and Immunotherapies Group, Sioux Falls, United States
- University of South Dakota, Sanford School of Medicine, United States
- University of Texas, MD Anderson Cancer Center, United States
- Baylor University, Department of Psychology and Neuroscience, United States
- Queen’s University, Department of Biomedical and Molecular Sciences, Canada
Figures
Figure 1 with 2 supplements

Tumor-infiltrating nerves form a circuit connecting to the brain.
(A) Western blot of MOC2-7 whole tumor lysates for Tau (A) and Doublecortin, DCX (B). Tumors were harvested at different time points (as indicated) post-tumor implantation (n=3 mice/time point). Mouse brain, positive control; MOC2-7, whole cell lysate control; β-actin, loading control. Immunohistochemical staining for β-III tubulin (β3T, brown, arrows) of tumors harvested on days 4 (C), 10 (D) and 20 (E) post tumor implantation. Scale bar, 100 µm. Dotted boxes are shown at higher magnification below each panel; scale bar, 50 μm. Arrows highlight positive nerves staining. Representative en face confocal image of WGA positive (red) neurites within tumor (F) and the ipsilateral trigeminal ganglion (G) from a mouse orthotopically implanted with a MOC2-7 tumor and intra-tumorally injected with the tracer. Scale bars, 200 µm. (H) Low-magnification section of ipsilateral and contralateral TGM ganglia from a MOC2-7 tumor-bearing mouse that was intra-tumorally injected with WGA. The V3 branch of the TGM is marked with an arrow. WGA (red) positive neurons found only in the ipsilateral TGM. Scale bar, 500 μm. (I) Compressed Z-stack of confocal images demonstrating restricted WGA (red) within the tumor bed (cytokeratin, green). Vertical and horizontal cross-sections highlight that WGA (red) localizes strictly within the tumor (green) and does not leak out. Yellow shows the merged file. Scale bar, 500 µm. (J) Diagram showing the location of the trigeminal (TGM) ganglion, extension of its neurites into the tumor bed and the existing circuit which includes the spinal nucleus of the TGM (SpVc), the parabrachial nucleus (PBN) and the central amygdala (CeA) which get labeled following WGA injection into tumor. (K) Representative confocal images of the SpVc, PBN and CeA following injection of 2 μl of WGA into an oral MOC2-7 tumor (n=10 mice). Representative confocal images of SpVc, PBN and CeA following injection of (L) 10 μl (n=3 mice) of WGA into the oral cavity of a non-tumor bearing control animal. Scale bar, 50 μm. WGA (red looks pink due to DAPI), DAPI nuclear counterstain (blue).
-
Figure 1—source data 1
Uncropped and labeled gels for Figure 1a.
- https://cdn.elifesciences.org/articles/97916/elife-97916-fig1-data1-v1.zip
-
Figure 1—source data 2
Uncropped and labeled gel for Figure 1a.
- https://cdn.elifesciences.org/articles/97916/elife-97916-fig1-data2-v1.zip
-
Figure 1—source data 3
Raw unedited gel for Figure 1a.
- https://cdn.elifesciences.org/articles/97916/elife-97916-fig1-data3-v1.zip
-
Figure 1—source data 4
Uncropped and labeled gel for Figure 1a.
- https://cdn.elifesciences.org/articles/97916/elife-97916-fig1-data4-v1.zip
-
Figure 1—source data 5
Uncropped and labeled gels for Figure 1b.
- https://cdn.elifesciences.org/articles/97916/elife-97916-fig1-data5-v1.zip
-
Figure 1—source data 6
Uncropped and labeled gel for Figure 1b.
- https://cdn.elifesciences.org/articles/97916/elife-97916-fig1-data6-v1.zip
-
Figure 1—source data 7
Raw unedited gel for Figure 1b.
- https://cdn.elifesciences.org/articles/97916/elife-97916-fig1-data7-v1.zip
-
Figure 1—source data 8
Uncropped and labeled gel for Figure 1b.
- https://cdn.elifesciences.org/articles/97916/elife-97916-fig1-data8-v1.zip
Figure 1—figure supplement 1

Quantification of tumor innervation time course.
Densitometric quantification of western blots in Figure 1A. Statistical analysis by one-way ANOVA with post-hoc Tukey test; n=3 mice/time point, n=4 technical replicates. *, p<0.05; ****, p<0.001.
Figure 1—figure supplement 2

Quantification of tumor innervation time course.
Densitometric quantification of western blots in Figure 1B. Statistical analysis by one-way ANOVA with post-hoc Tukey test; n=3 mice/time point, n=4 technical replicates. *, p<0.05; ****, p<0.001.
Figure 2
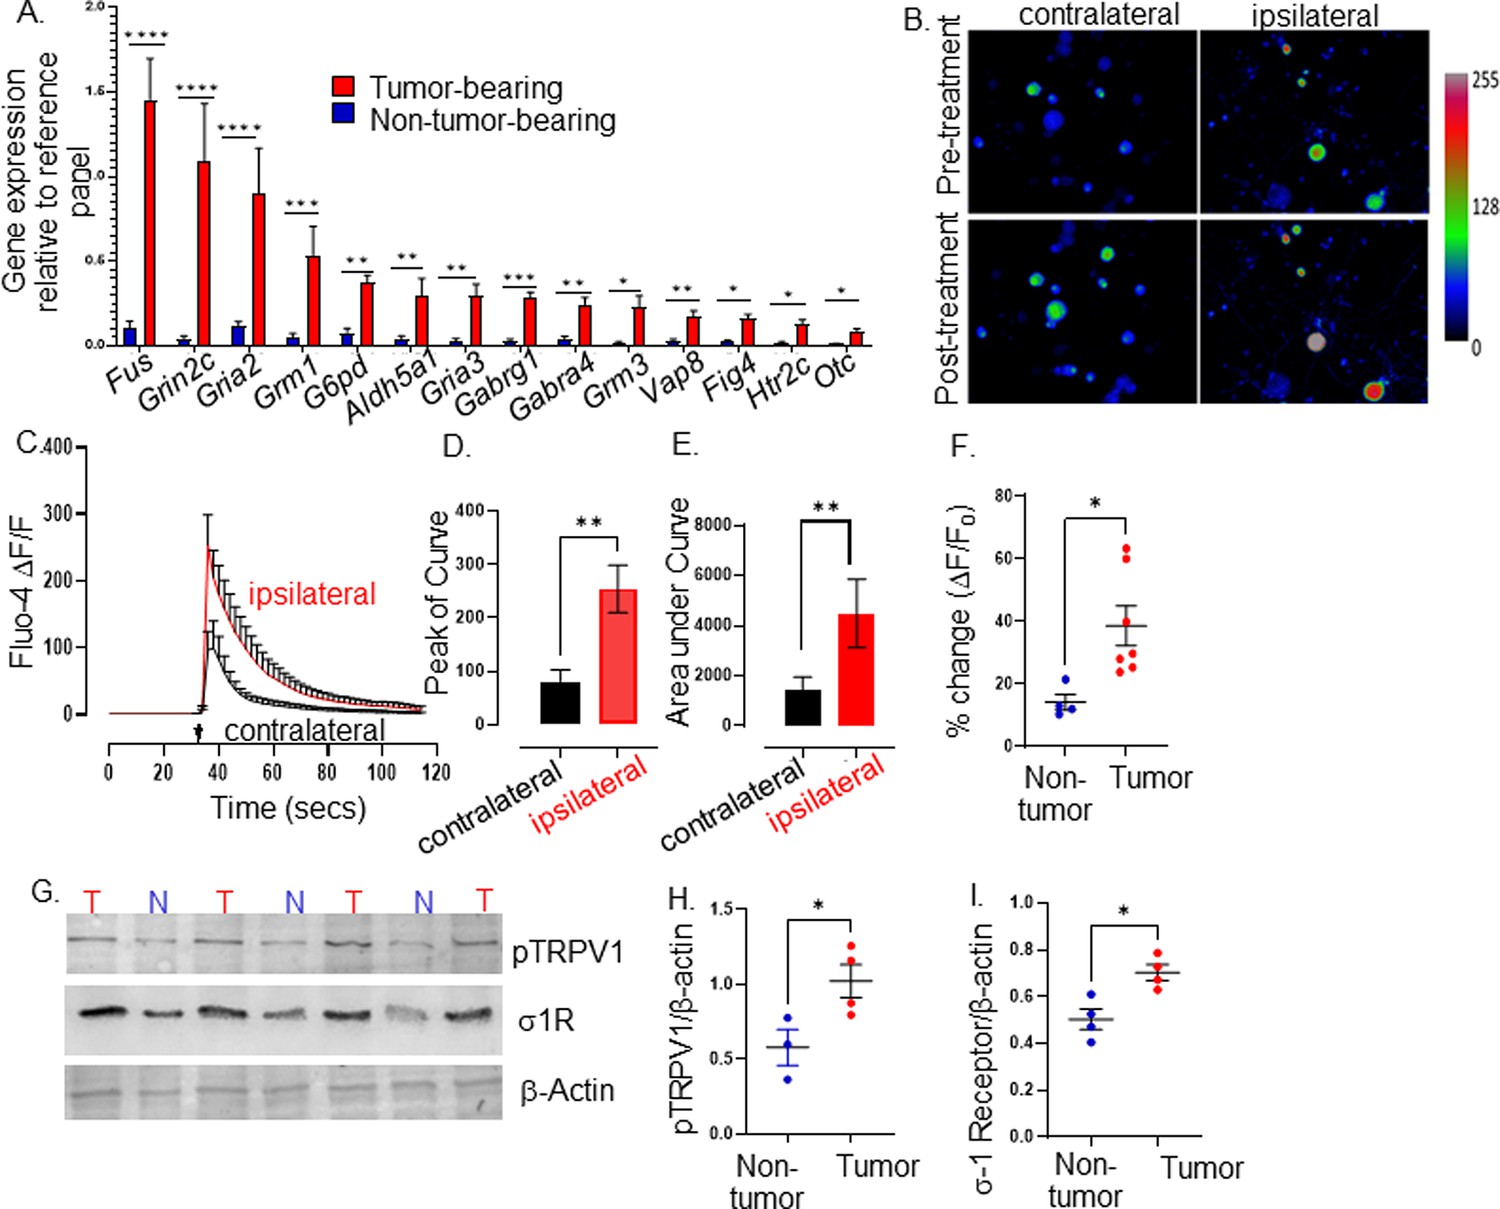
Tumor-infiltrating neurons become transcriptionally and functionally altered.
Trigeminal (TGM) ganglia from tumor bearing (red) or non-tumor bearing (blue) mice were analyzed by (A) quantitative PCR array. N=4 TGM/group from n=4 mice/group; n=4 arrays/group. Ct values for each gene normalized to that of a housekeeping gene. Statistical analysis by multiple students t-test. *, p<0.05; **, p<0.01; ***, p<0.001, ****, p<0.00001. Data are expressed as means ± standard deviation. (B) Representative fluorescent images of dissociated neurons from the ipsilateral or contralateral TGM ganglia from a MOC2-7 tumor-bearing mouse. N=6 of each ganglia harvested from 6 tumor-bearing animals with n=4–8 neurons analyzed/ganglia. The color palette reflects the strength of the calcium signal. Images are taken pre- and post-treatment with capsaicin. (C) Graph of average change in fluorescence for all neurons analyzed in each group (ipsilateral and contralateral). Statistical analysis by student’s t-test. Arrow, time of capsaicin (300 nM) stimulation. Graph of average peak of the curve (D) and area under the curve (E) from panel C. Statistical analysis by student’s t-test. **, p<0.01. (F) Quantification of Ca+2 responses to capsaicin (300 nM) from non-tumoral and tumor-infiltrating, tracer+ (Tumor-infiltrating) neurons. N=4–8 neurons/group from n=4 control and n=7 tumor-bearing mice. Statistical analysis by paired students t-test, *, p<0.05. Data expressed as means ± SEM. (G) Representative western blot of trigeminal ganglia from non-tumor (N) or MOC2-7 tumor-bearing (T) animals for phosphorylated TRPV1 (pTRPV1, Ser502, Ser800), σ1 receptor (σ1R) and β-actin (loading control). Densitometric quantification of western blots for pTRPV1 (H) and σ1R (I). Statistical analysis by student’s t-test. *, p<0.05. Data are expressed as means ± SEM. (n=3–4 mice/group). Blots were not stripped in between probing for different proteins.
-
Figure 2—source data 1
Uncropped and labeled gels for Figure 2g.
- https://cdn.elifesciences.org/articles/97916/elife-97916-fig2-data1-v1.zip
-
Figure 2—source data 2
Uncropped and labeled gel for Figure 2g.
- https://cdn.elifesciences.org/articles/97916/elife-97916-fig2-data2-v1.zip
-
Figure 2—source data 3
Raw unedited gel for Figure 2g.
- https://cdn.elifesciences.org/articles/97916/elife-97916-fig2-data3-v1.zip
-
Figure 2—source data 4
Uncropped and labeled gel for Figure 2g.
- https://cdn.elifesciences.org/articles/97916/elife-97916-fig2-data4-v1.zip
-
Figure 2—source data 5
Raw unedited gel for Figure 2g.
- https://cdn.elifesciences.org/articles/97916/elife-97916-fig2-data5-v1.zip
-
Figure 2—source data 6
Uncropped and labeled gel for Figure 2g.
- https://cdn.elifesciences.org/articles/97916/elife-97916-fig2-data6-v1.zip
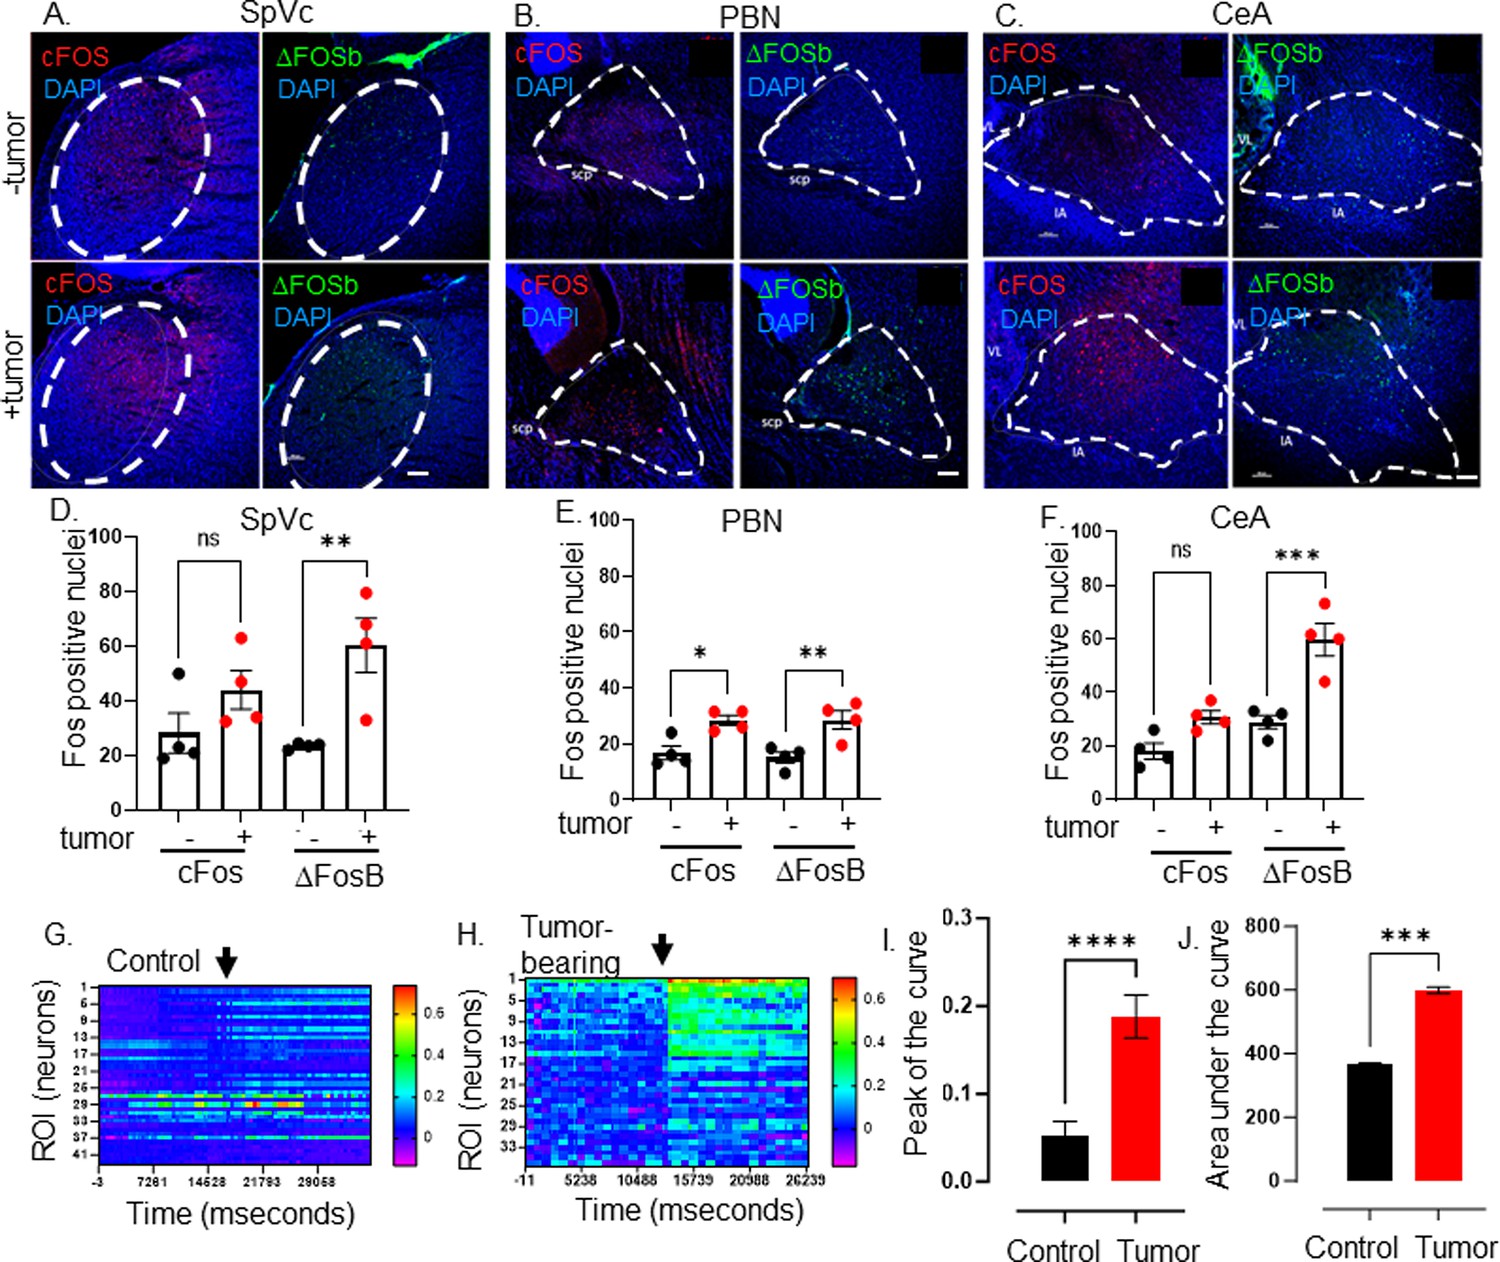
Figure 3 with 3 supplements
Elevated CNS neuronal activity in tumor bearing mice.
Representative fluorescent photomicrographs of the spinal nucleus of the TGM (SpVc) (A), parabrachial nucleus (PBN) (B) and central amygdala (CeA) (C) from a control (-tumor) and MOC2-7 tumor-bearing (+tumor) mouse brains immuonfluorescently stained for cFos (red) or ΔFosB (green). Nuclei counterstained with DAPI (blue). Dotted circle denotes each brain region. Scale bar, 100 μm. Brain landmarks: Spc, superior cerebellar peduncle; VL, lateral ventricle; IA, intercalated amygdalar nucleus. Quantification of cFos and ΔFosB staining in SpVc (D), PBN (E) and CeA (F) from control (-tumor) and tumor-bearing (+tumor) mice. N=4 mice/group with n=2–4 sections analyzed/brain region/mouse/group. Data are expressed as the mean ± SEM. Statistical analysis by one-way ANOVA*, p<0.05; **, p<0.01; ***, p<0.001; ns, not significant. Scale bar, 100 μm. Representative heat maps of regions of interest (ROI), each of which represent one neuron, within an ex vivo brain slice from non-tumor (control) (G) and tumor-bearing (H) mice. The color palette reflects the strength of the calcium signal. Arrow denotes the time of KCl (30 mM) application. Quantification of calcium imaging data (n=5 mice/group with n=2–4 sections analyzed/mouse) analyzing the peak of the curve (I) and the area under the curve (J). Statistical analysis by student’s t-test. ****, p<0.0001; ***, p<001.
Figure 3—figure supplement 1

Neuronal activity.
Representative calcium recordings for a single neuron from a brain slice from a control animal. Arrow denotes time of KCl stimulation.
Figure 3—figure supplement 2
Neuronal activity.
Representative calcium recordings for a single neuron from a brain slice from a tumor-bearing animal. Arrow denotes time of KCl stimulation.
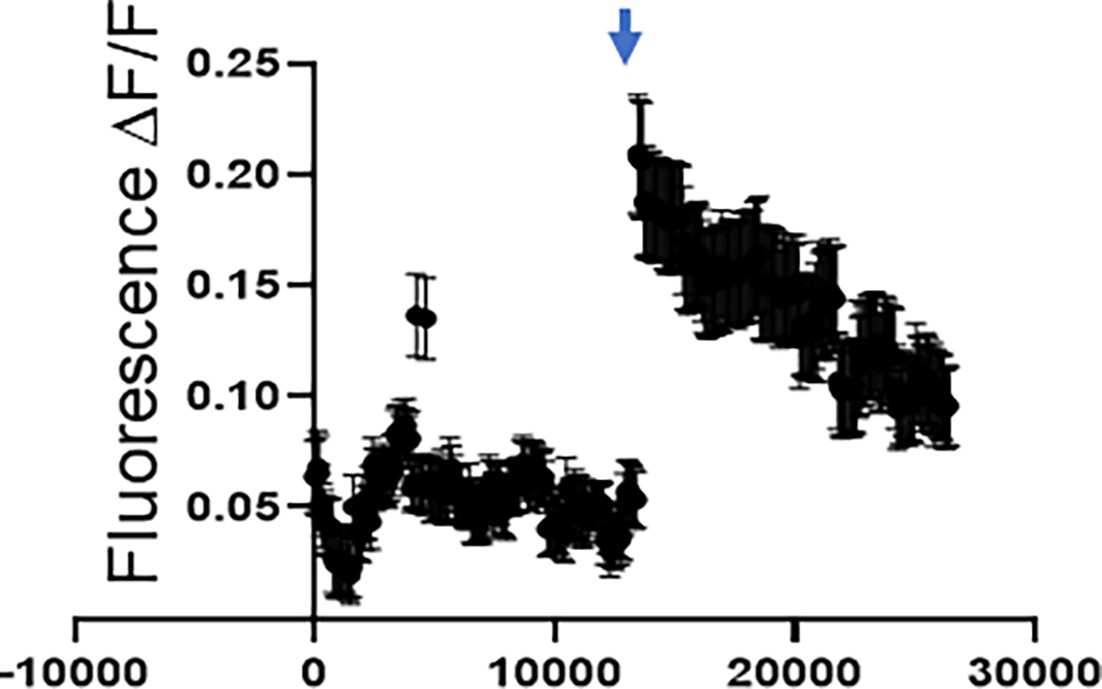
Figure 3—figure supplement 3

Neuronal activity.
Curve of change in Ca +2 fluorescence ex vivo brain slices harvested from mice with oral tumors and controls without tumor (n=3 brains/group and n=3 slices analyzed/brain).
Figure 4 with 5 supplements

Intra-tumoral neurons impact behavior.
(A) Bright field photomicrograph of TGM ganglion from C57BL/6 or TRPV1-Cre::Floxed-DTA mice IHC stained for TRPV1 (brown). Scale bar, 100 µm. Quantification of cFos and ΔFosB from the brains of C57BL/6 (C57) or TRPV1-Cre::Floxed-DTA (DTA) animals with MOC2-7 oral tumors in the Spinal nucleus of the trigeminal (SpVc) (B), the parabrachial nucleus (PBN) (C) and the central amygdala (CeA) (D). N=4 mice/group with n=2–4 sections analyzed/brain region/mouse. Statistical analysis by one-way ANOVA. **, p<0.01; ***, p<0.001. Data displayed as mean ± SEM. C57BL/6 (black, n=15) and TRPV1-Cre::Floxed-DTA (blue, n=14) mice were orthotopically implanted with MOC2-7 tumor and behavior assessed weekly and statistically analyzed by repeated measures ANOVA. (E) Graph of nesting scores over time. There is a main effect of time such that there is a decline in nesting performance over time. We also see a time by strain interaction in that C57BL/6 mice show a greater decline than the nociceptor neuron ablated TRPV1-Cre::Floxed-DTA mice. Post hoc testing shows a significant difference in nesting on day 27 (p=0.0315). (F) Graph of time to interact with the cookie in the cookie test. There is a main effect of time such that the time to interact with the cookie declines over time. There is a main effect of strain such that nociceptor neuron ablated TRPV1-Cre::Floxed-DTA mice were faster to interact with the cookie. Finally, there is a time by strain interaction such that nociceptor neuron ablated TRPV1-Cre::Floxed-DTA mice showed progressively faster task performance, while in C57BL/6 mice interaction time plateaued. Post hoc testing demonstrates a significant difference between the groups on days 3, 22, and 27 (p<0.05). (G) Tumor growth curves for mice that underwent behavioral testing. Statistical analysis by repeated measures ANOVA. There is a main effect of time such that there is an increase in tumor volume over time. We also see a time by strain interaction in that C57BL/6 mice have larger tumors than nociceptor ablated TRPV1-Cre::Floxed-DTA mice. (H) Kaplan-Meier survival curve for mice in panel I. Statistical analysis by Log-rank (Mantel-Cox) test. ****, p<0.0001. (I) Graph of % change in weight from baseline. Dotted line represents baseline. Statistical analysis by repeated measures ANOVA. There was a main effect of time such that both groups showed an initial increase in weight followed by a decrease. Post hoc testing shows a significant difference between the groups on days 5, 10, and 20. (J) Graph of % change from baseline in food consumption. Dotted line represents baseline. Statistical analysis by repeated measures ANOVA. There is a main effect of time such that there is a decline in % food disappearance over time. There is a time by strain interaction such that C57BL/6 mice show a greater decline in % food disappearance compared to nociceptor neuron ablated TRPV1-Cre::Floxed-DTA mice. In all panels, error bars are SEM.
Figure 4—figure supplement 1
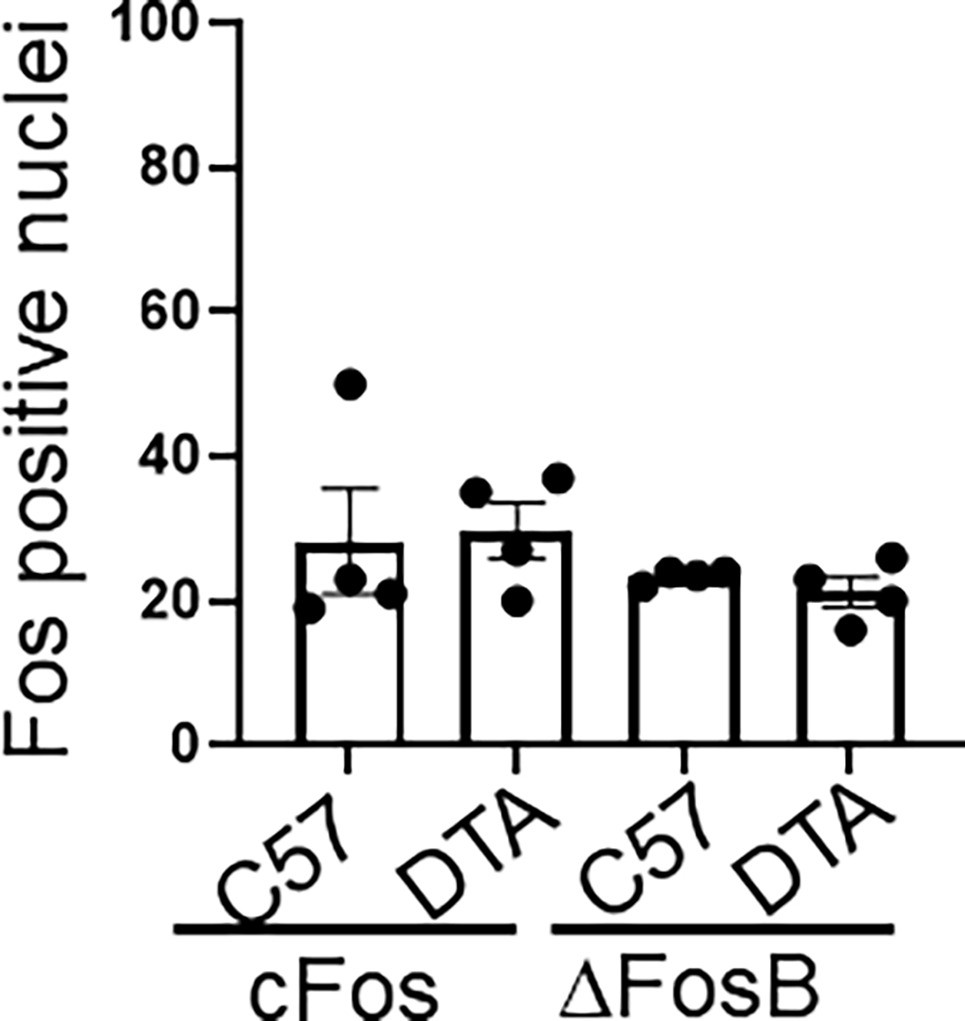
Brain neuronal activity in controls.
Quantification of cFos and ΔFosB positively stained neurons in the spinal nucleus of the trigeminal (SpVc) from control C57BL/6 (C57) or TRPV1cre::DTAfl/wt (DTA) animals. No significant differences found.
Figure 4—figure supplement 2

Brain neuronal activity in controls.
Quantification of cFos and ΔFosB positively stained neurons in the parabrachial nucleus (PBN) from control C57BL/6 (C57) or TRPV1cre::DTAfl/wt (DTA) animals. No significant differences found.
Figure 4—figure supplement 3

Brain neuronal activity in controls.
Quantification of cFos and ΔFosB positively stained neurons in the central amygdala (CeA) from control C57BL/6 (C57) or TRPV1cre::DTAfl/wt (DTA) animals. No significant differences found.
Figure 4—figure supplement 4

Tumor volume does not account for nesting differences.
Nesting data from MOC2-7 oral tumor-bearing C57BL/6 (black, n=15 mice) and TRPV1cre::DTAfl/wt (blue, n=14 mice) were graphed as a function of tumor volume. A simple linear regression analysis was completed to determine best fit values. The slopes of the lines are not significantly different. ns, p=0.1986; F=1.666; DFn = 1; Dfd = 164.
Figure 4—figure supplement 5

Tumor volume and cookie test.
Time to interact data (cookie test) from MOC2-7 oral tumor-bearing C57BL/6 (black, n=15 mice) and TRPV1cre::DTAfl/wt (blue, n=14 mice) were graphed as a function of tumor volume. A simple linear regression analysis was completed to determine best fit values. *, p=0.0359, F=4.4459, DFn = 1, DFd = 224.
Figure 5

Denervation of tumors improves behavior, attenuates body weight loss, and reduces tumor growth.
(A) Graph of nesting scores over time. Statistical analysis by repeated measures ANOVA (group x time): The time factor and its interaction with the group factor are significant with a significant difference between RTX- and vehicle-treated mice on the last time point (p<0.001). (B) Graph of % change in weight from baseline. Statistical analysis by repeated measures ANOVA (group x time): The time factor and its interaction with the group factor are significant with a significant difference between groups on the last time point (p<0.01). (C) Tumor volume according to treatment and time: Statistical analysis by repeated measures ANOVA (treatment x time): The time factor and its interaction with the group factor are significant with a significant difference between treatments on the last two time points (p<0.001). N=20 mice/group.
Figure 6

Treating for pain does not restore all behaviors.
C57BL/6 male mice were orthotopically implanted with MOC2-7 tumors and separated into three groups: carprofen treated (10 mg/kg, blue, n=10), buprenorphine treated (3.25 mg/kg, red, n=10) or vehicle treated (black, n=9). Mice underwent behavioral testing. All analyses are by repeated measures ANOVA. (A) Data are graphed as % of baseline for overnight wheel running. The dotted line represents the baseline. There is a main effect of time such that there is a decline in voluntary wheel running over time. We also see a time by drug (carprofen) interaction in that vehicle-treated mice show a greater decline in wheel running than carprofen-treated mice. Post hoc testing shows a significant difference in wheel running (p<0.0001). (B) There is a main effect of time such that there is a decline in voluntary wheel running over time. We also see a time by drug (buprenorphine) interaction in that vehicle-treated mice show a greater decline in wheel running than the buprenorphine-treated mice. Post hoc testing shows a significant difference in wheel running (p<0.0001). (C) Graph of nesting scores over time. When comparing vehicle vs carprofen groups, there is a main effect of time such that there is a decline in nesting performance over time. We also see a time by drug (carprofen) interaction in that vehicle-treated mice show a greater decline than carprofen-treated mice. Similarly, we see a main effect of time when comparing the vehicle and buprenorphine groups. There is a time by drug (buprenorphine) interaction in that vehicle-treated mice show a greater decline than buprenorphine-treated mice. (D) Graph of % change in weight from baseline. The dotted line represents the baseline. There was a main effect of time. There is also a drug (carprofen) by time interaction in that vehicle-treated mice show a greater decline in weight than the carprofen-treated mice. In fact, carprofen-treated mice gain weight. Similarly, when comparing the vehicle and buprenorphine groups, there is a main effect of time. There is also an interaction of drug (buprenorphine) by time in that vehicle-treated mice show a greater decline in weight than the buprenorphine-treated mice. In fact, the buprenorphine-treated mice gain weight. When carprofen and buprenorphine-treated animals are compared, there is an interaction of time with treatment such that buprenorphine-treated animals gain more weight than carprofen-treated animals. (E) Graph of % change in food disappearance from baseline. When comparing the vehicle vs carprofen group, there is a main effect of time such that there is a decline in food disappearance over time. We also see a time by treatment interaction such that carprofen-treated animals do not decline in food disappearance as much as vehicle treated animals. When comparing the vehicle vs buprenorphine group, there is a main effect of time. In the buprenorphine treated group, there is a time by treatment interaction such that the buprenorphine-treated animals demonstrate the smallest decline in food disappearance. Finally, comparison of the carprofen and buprenorphine groups shows that there is an interaction between time and treatment such that buprenorphine-treated animals show the least reduction in food disappearance. (F) Tumor volume was monitored weekly for mice in all groups. There is a main effect of treatment such that mice treated with carprofen show a greater decline in tumor volume than buprenorphine-treated mice.
Additional files
-
Supplementary file 1
List of mouse genes assayed on the ScienCell Gene Query Neuronal Transmission and Membrane Genes plate.
- https://cdn.elifesciences.org/articles/97916/elife-97916-supp1-v1.docx
-
Supplementary file 2
Significant effects for the statistics presented in Figure 4.
- https://cdn.elifesciences.org/articles/97916/elife-97916-supp2-v1.xlsx
-
Supplementary file 3
Significant effects for the statistics presented in Figure 6.
- https://cdn.elifesciences.org/articles/97916/elife-97916-supp3-v1.xlsx
-
MDAR checklist
- https://cdn.elifesciences.org/articles/97916/elife-97916-mdarchecklist1-v1.docx
Download links
A two-part list of links to download the article, or parts of the article, in various formats.
Downloads (link to download the article as PDF)
Open citations (links to open the citations from this article in various online reference manager services)
Cite this article (links to download the citations from this article in formats compatible with various reference manager tools)
Tumor-infiltrating nerves functionally alter brain circuits and modulate behavior in a mouse model of head-and-neck cancer
eLife 13:RP97916.
https://doi.org/10.7554/eLife.97916.3


