SERBP1 interacts with PARP1 and is present in PARylation-dependent protein complexes regulating splicing, cell division, and ribosome biogenesis
- Children’s Cancer Research Institute, UT Health San Antonio, United States
- Mitchell Center for Neurodegenerative Diseases, University of Texas Medical Branch, United States
- Department of Neurology, University of Texas Medical Branch, United States
- Centro de Oncologia Molecular, Hospital Sírio-Libanês, Brazil
- Department of Cell Systems and Anatomy, UT Health San Antonio, United States
- Department of Biochemistry and Structural Biology, UT Health San Antonio, United States
- Department of Nutritional Sciences, College of Natural Sciences, University of Texas at Austin, United States
- Laboratory of Signaling and Gene Regulation, Cecil H. and Ida Green Center for Reproductive Biology Sciences,The University of Texas Southwestern Medical Center, United States
- Department of Pediatrics, Dell Medical School, University of Texas at Austin, United States
- Department of Oncology, Dell Medical School, University of Texas at Austin, United States
Figures
Figure 1 with 3 supplements
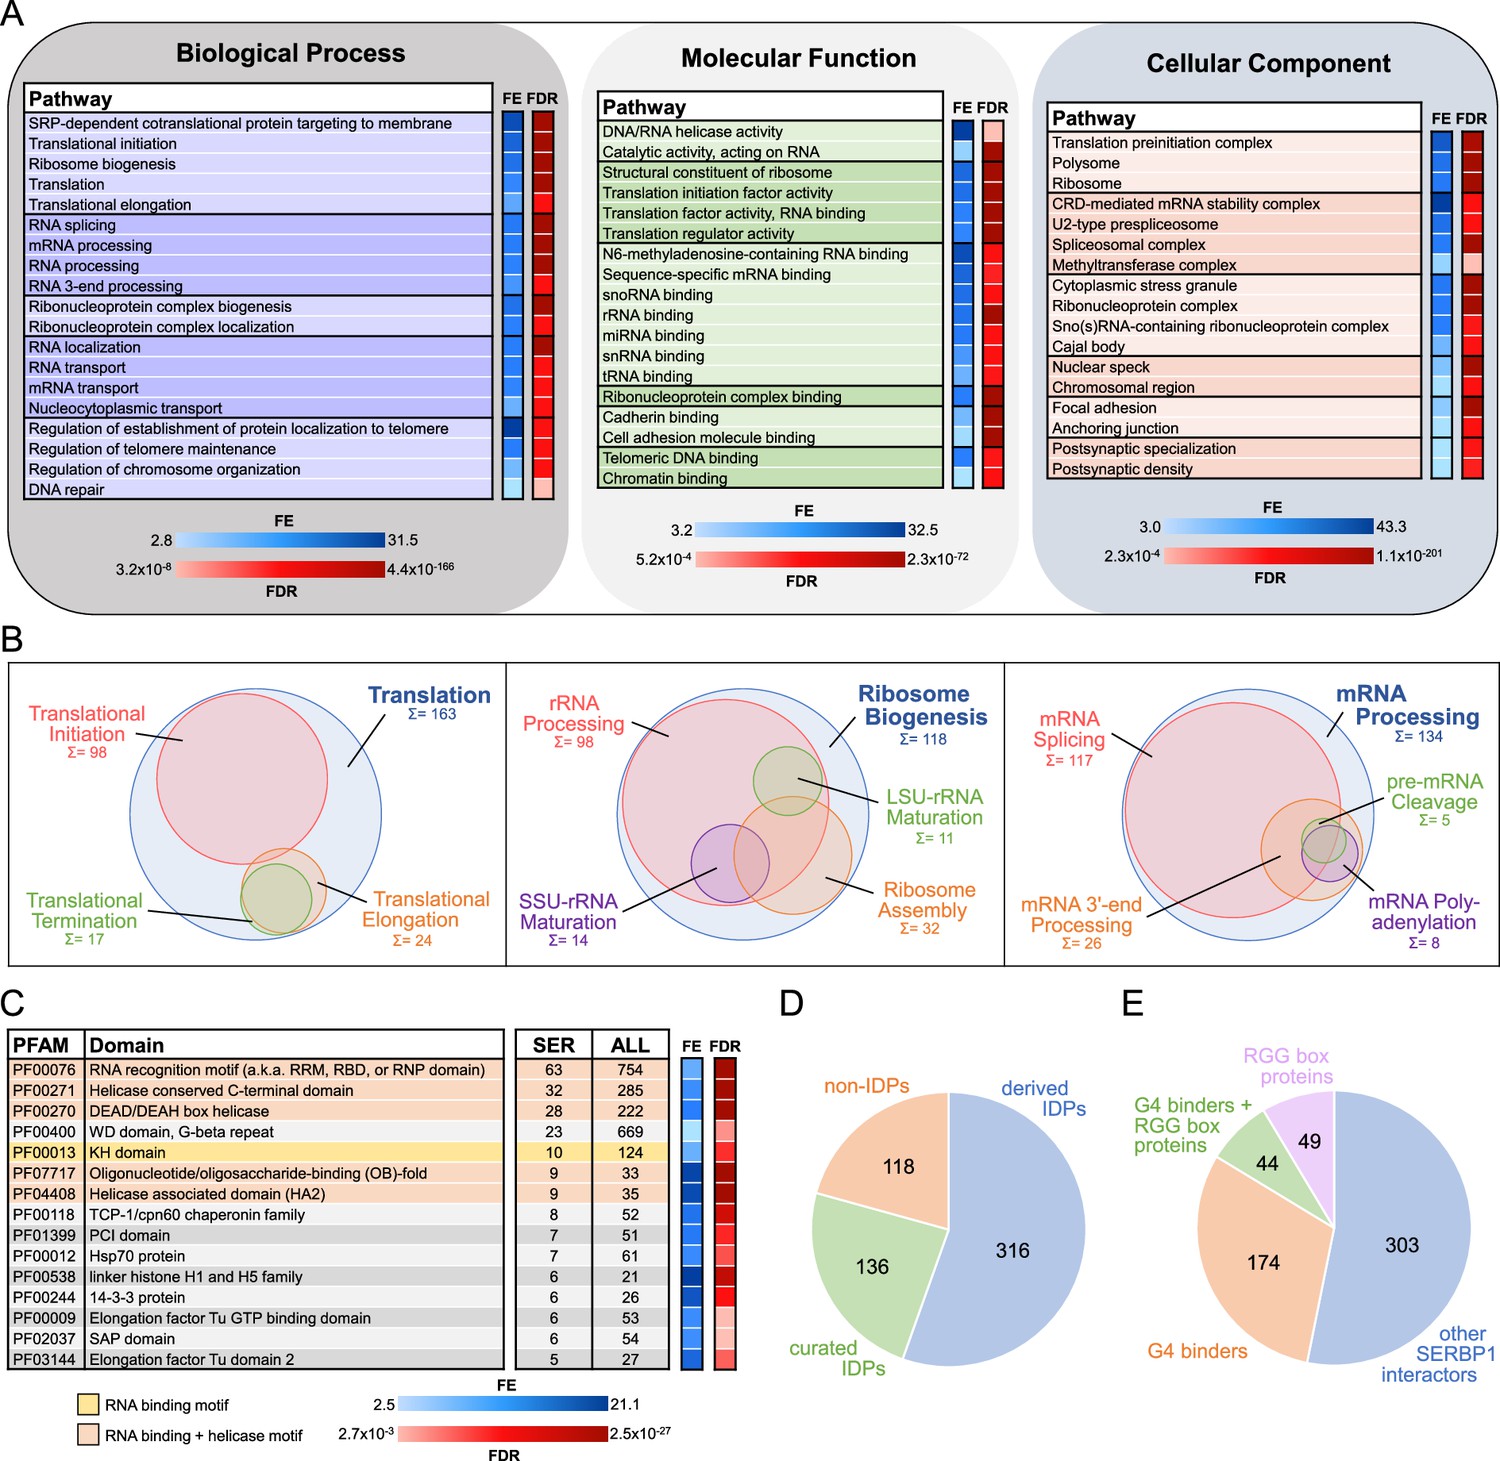
Gene ontology (GO) analysis and characterization of SERBP1-interacting proteins.
(A) SERBP1-interacting factors were identified via pull-down analysis in 293T cells. GO enrichment analysis (Biological Processes, Molecular Function, and Cellular Component) was performed with ShinyGO (Ge et al., 2020). A selection of the most relevant GO terms is represented. FE = fold enrichment; FDR = false discovery rate. (B) Visualization of associated GO-enriched terms in three main regulatory branches: translation, ribosome biogenesis, and RNA processing. Sum and circle size represent the count of SERBP1 interactors assigned to each GO term. (C) Representation of top enriched protein domains according to PFAM (Sonnhammer et al., 1997) among SERBP1 interactors. Only PFAM domains with counts of 5 or more and significant fold enrichment (FE) and false discovery rate (FDR) were included. The occurrence of each domain within the total human proteome (ALL) is listed as a reference. (D) Occurrence of intrinsically disordered proteins (IDPs; Piovesan et al., 2023) among SERBP1 interactors according to PFAM (‘derived’=automatic entries from databases; ‘curated’=manually checked). (E) Distribution of identified SERBP1-interacting proteins in reference to the presence of RGG boxes (Thandapani et al., 2013) and binding to G-quadruplexes (G4s) (Su et al., 2021b; Herviou et al., 2020). Data used to generate the figures are in Supplementary file 1, Supplementary file 4 and Supplementary file 6.
Figure 1—figure supplement 1
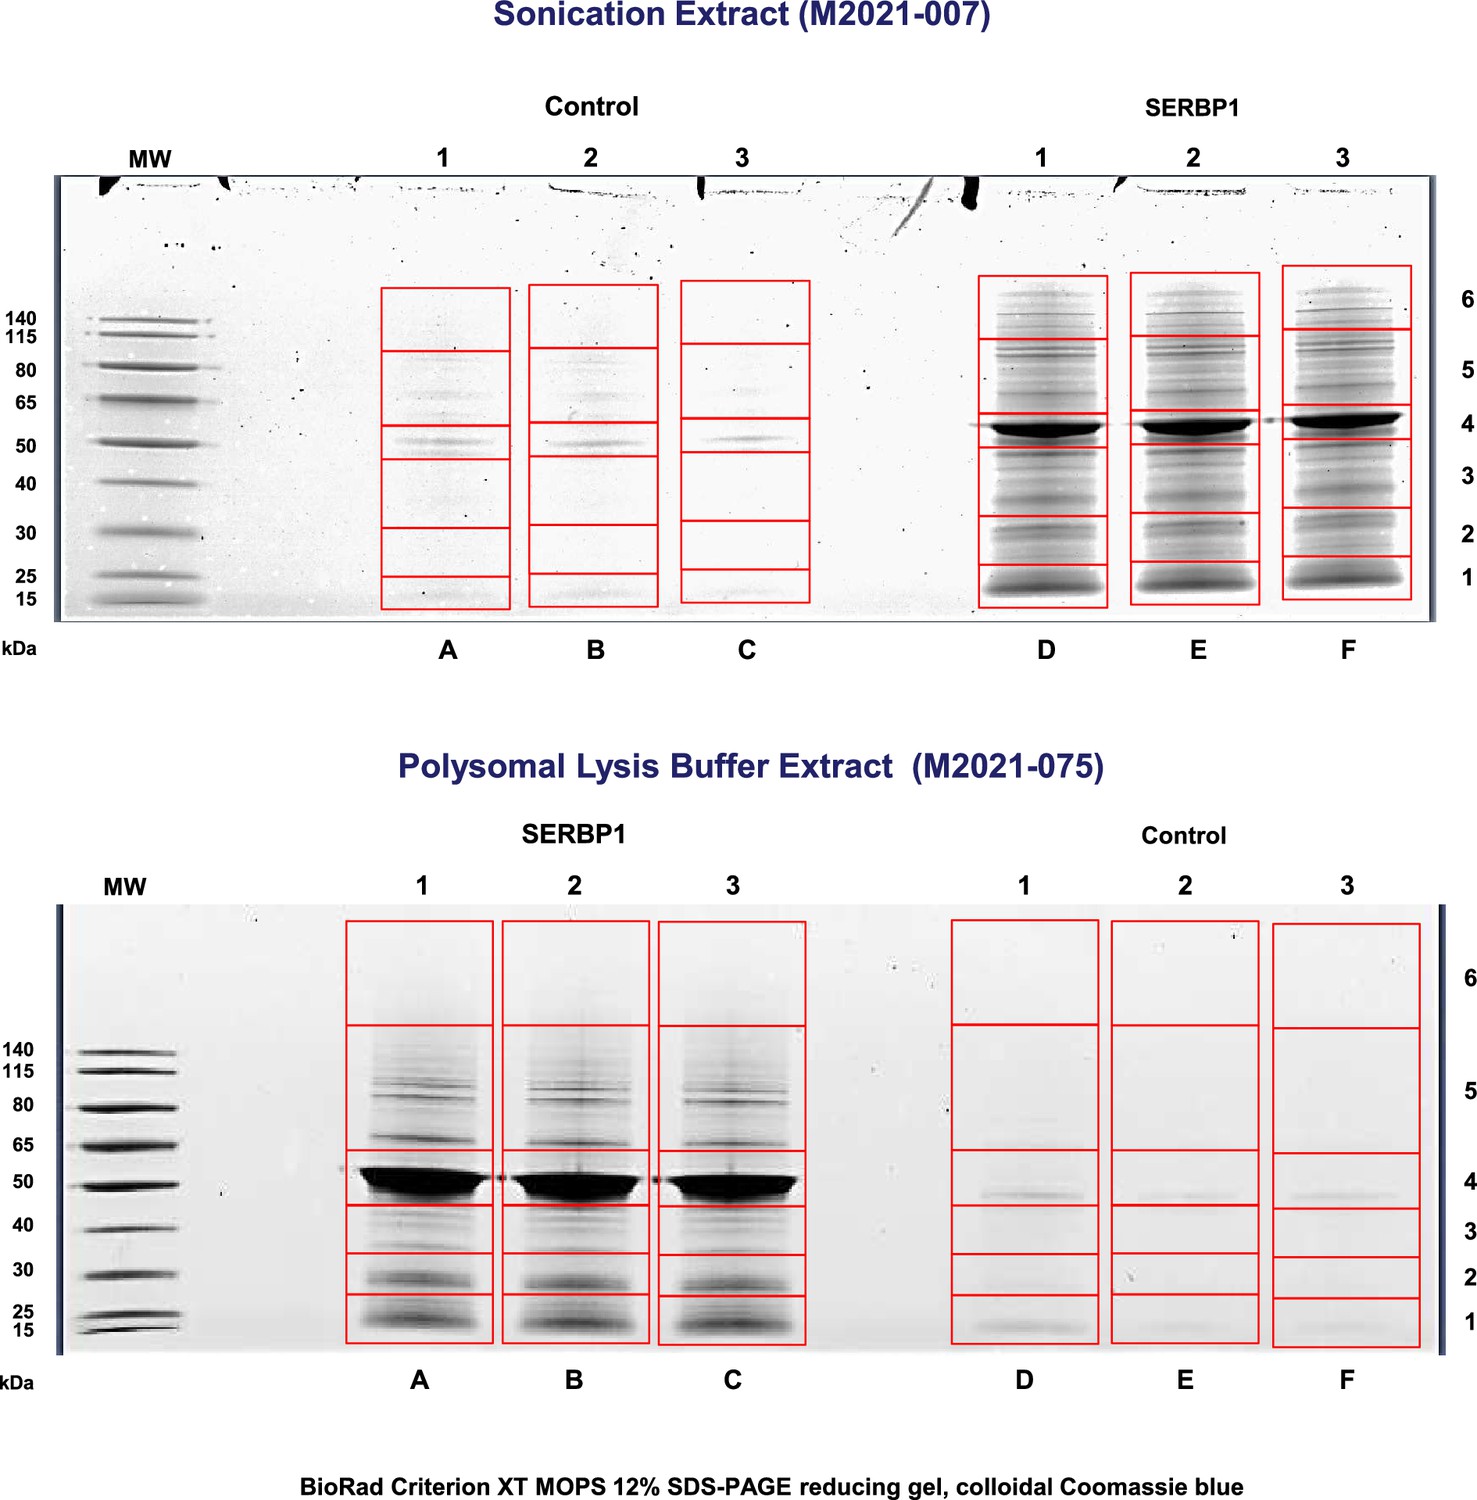
SERBP1-associated proteins isolated via pulldown experiments in 293T cells.
293T cells were transfected with plasmids expressing SBP-SERBP1 or pUltra-SERBP1(control). SERBP1-associated proteins were isolated via pull-down with streptavidin beads. Images show the aspect of protein gels used in the mass spectrometry analysis. Three control and three experimental samples were obtained using two different cell lysis procedures. Figure shows uncropped gel.
-
Figure 1—figure supplement 1—source data 1
PDF file containing original protein gels for Figure 1—figure supplement 1.
- https://cdn.elifesciences.org/articles/98152/elife-98152-fig1-figsupp1-data1-v1.pdf
-
Figure 1—figure supplement 1—source data 2
Original protein gels for Figure 1—figure supplement 1.
- https://cdn.elifesciences.org/articles/98152/elife-98152-fig1-figsupp1-data2-v1.zip
Figure 1—figure supplement 2
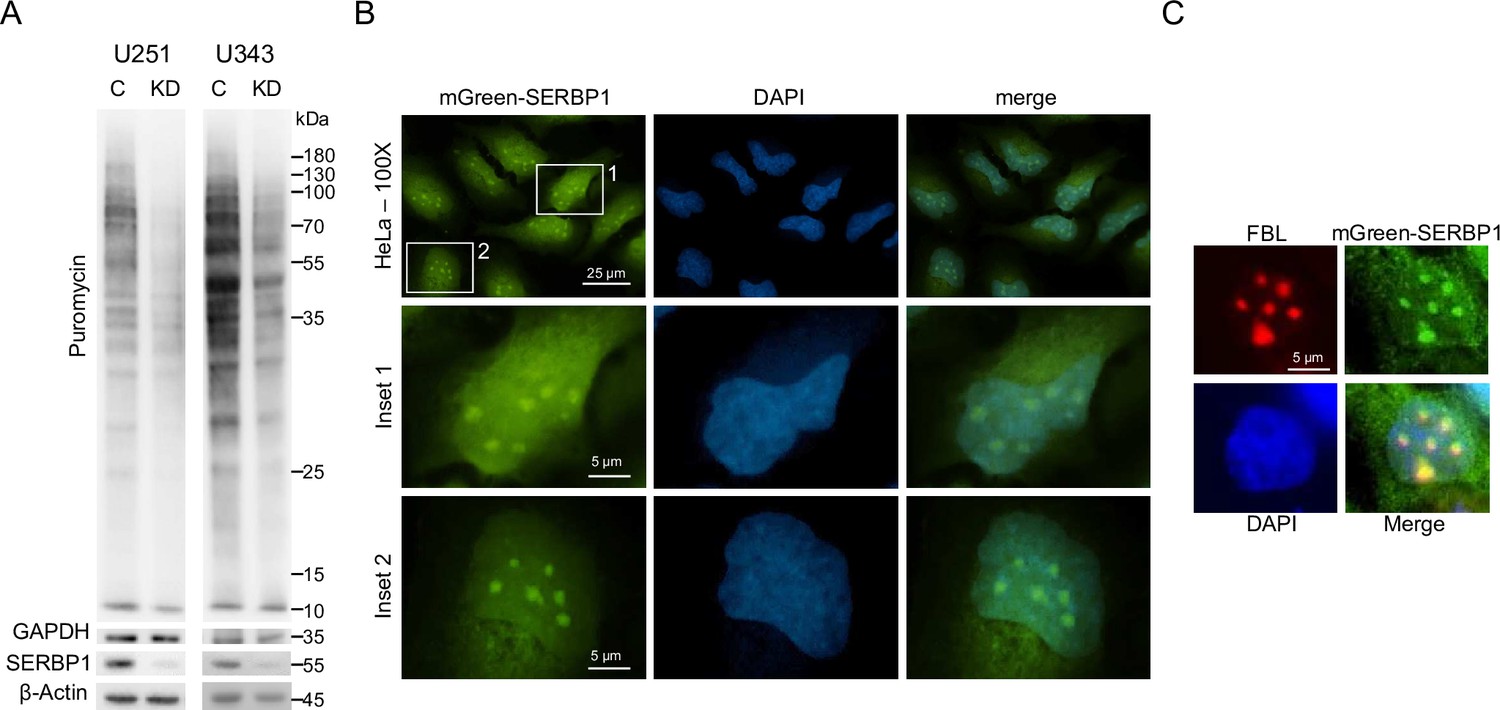
SERBP1 in translation and ribosome biogenesis.
(A) SERBP1 knockdown in U251 and U343 cells decreased translation as determined by puromycin incorporation assay. Control (C) and siSERBP1 knockdown (KD). (B) Localization of SERBP1 in nucleoli of HeLa cells as indicated by transfected mGreen-SERBP1 corroborates its participation in ribosome biogenesis. (C) mGreen-SERBP1 co-localizes with endogenous FBL (red) in the nucleoli of HeLa cells.
-
Figure 1—figure supplement 2—source data 1
PDF file containing original western blots for Figure 1—figure supplement 2A.
- https://cdn.elifesciences.org/articles/98152/elife-98152-fig1-figsupp2-data1-v1.pdf
-
Figure 1—figure supplement 2—source data 2
Original western blots for Figure 1—figure supplement 2A.
- https://cdn.elifesciences.org/articles/98152/elife-98152-fig1-figsupp2-data2-v1.zip
Figure 1—figure supplement 3
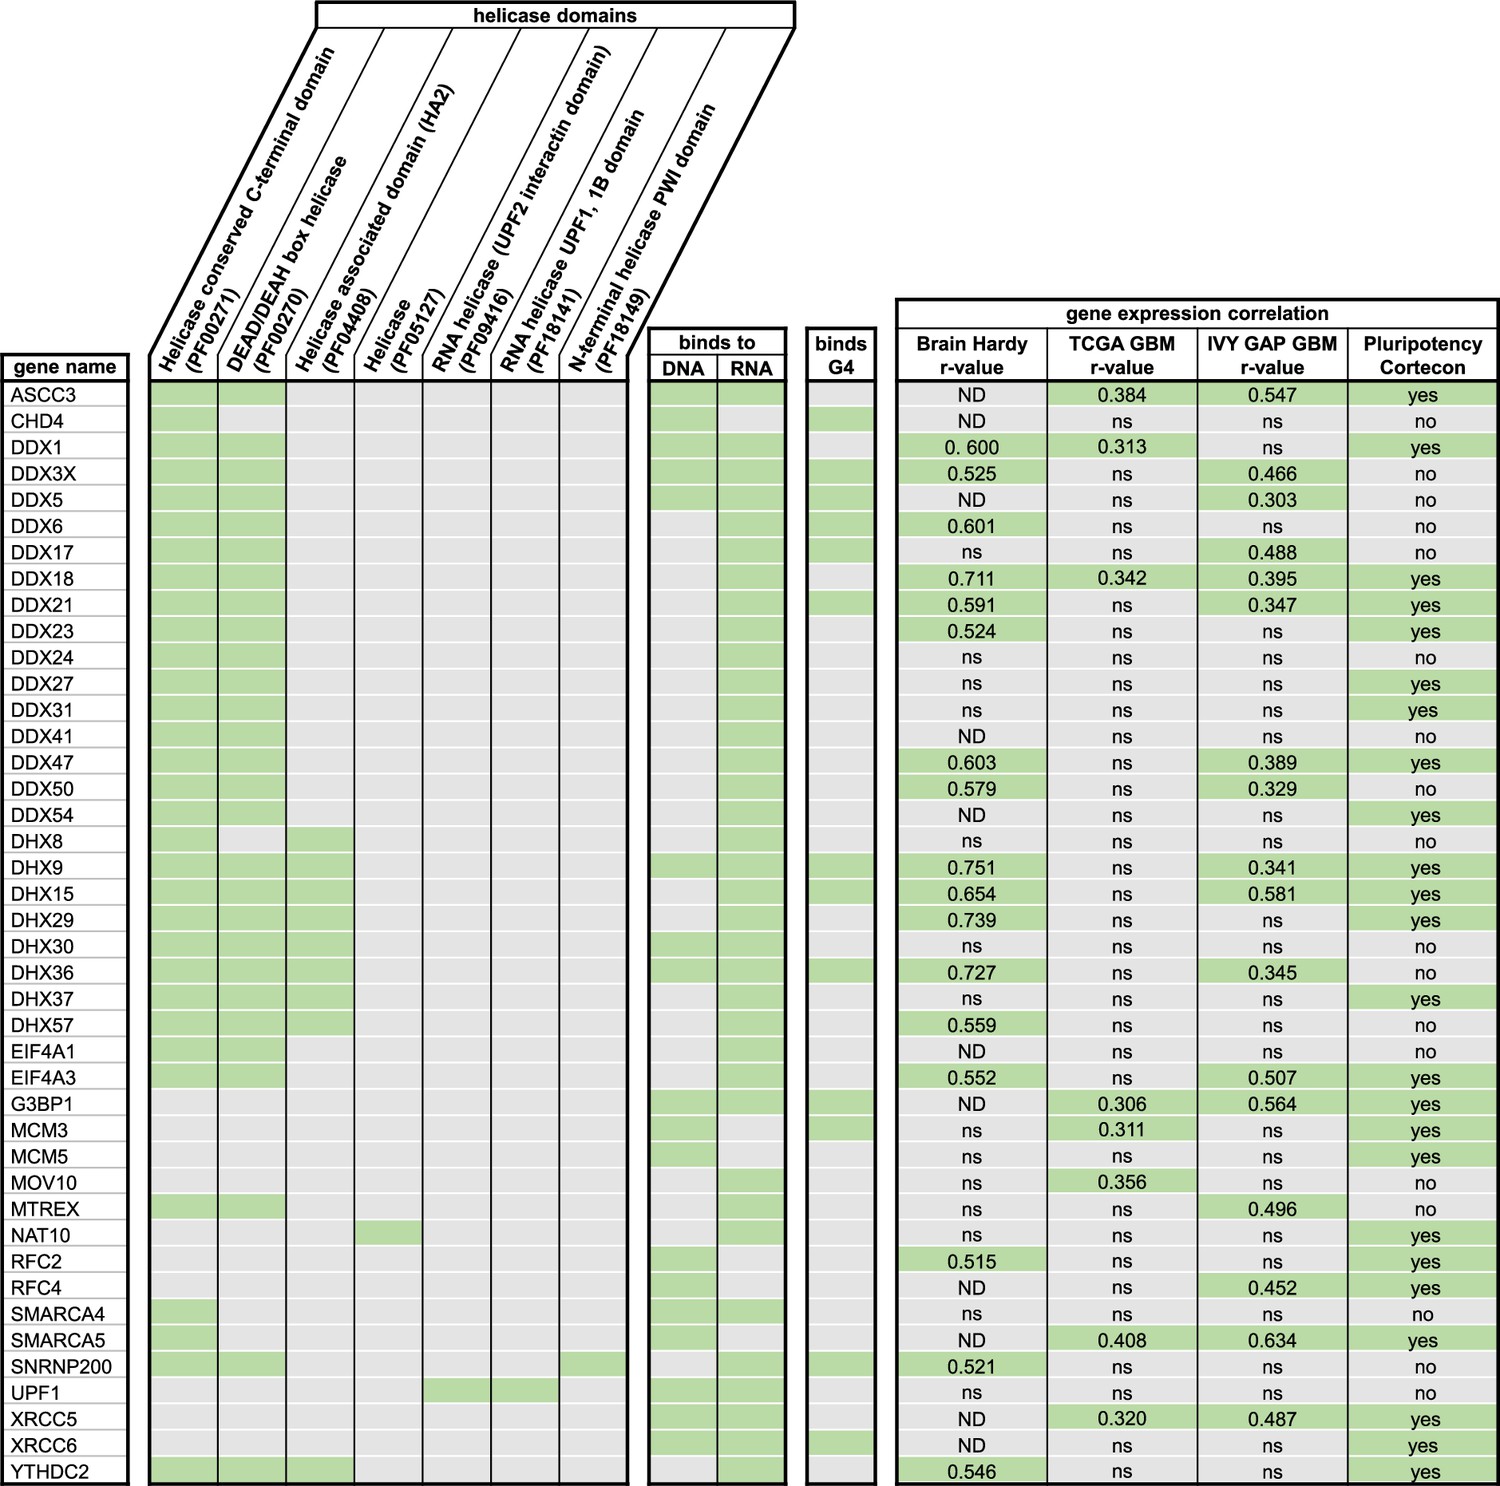
SERBP1-associated helicases and their respective domains.
Listed are all helicases found among identified SERBP1 interactors and their respective helicase domains (27, 42, 71), information on binding to DNA, RNA (71) or G4s (46, 47) and expression correlation with SERBP1 in different datasets (141–143). Green label indicates the presence of respective characteristics; ND = no data; ns = not significant. Datasets used to prepare the figure, and detailed analyses are in Supplementary file 1, Supplementary file 4, Supplementary file 5 and Supplementary file 6.
Figure 2
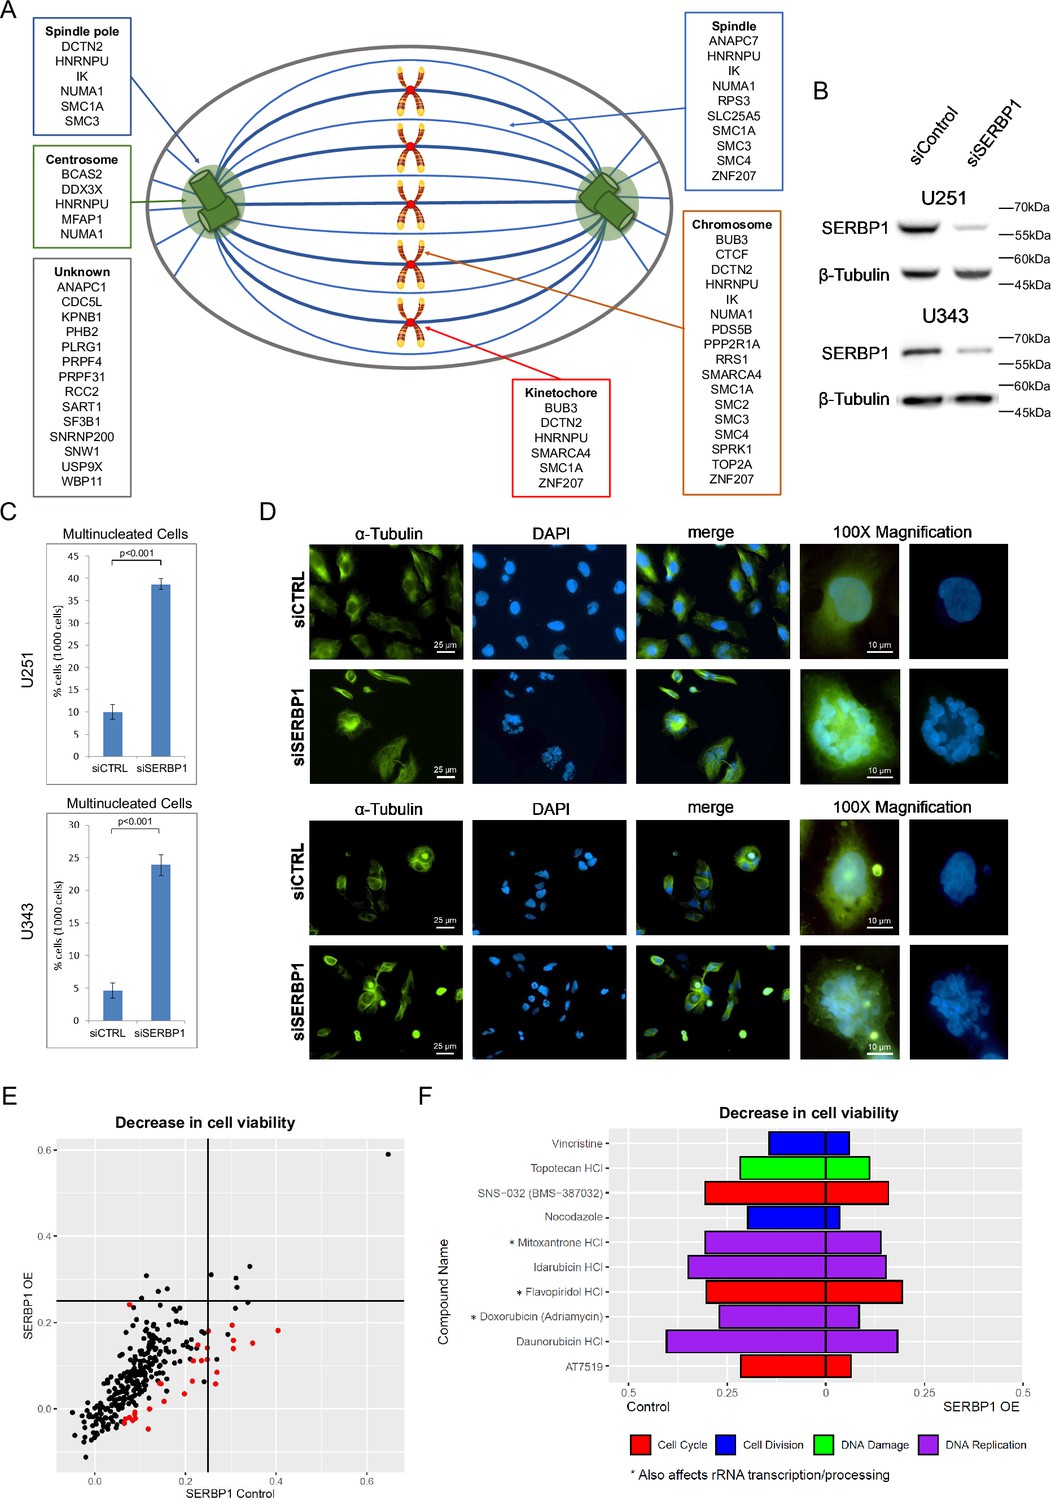
SERBP1 is implicated in cell division.
(A) SERBP1-associated proteins and their presence in specific cellular structures relevant to mitosis. (B) Western blot showing SERBP1 knockdown in U251 and U343 cells. (C) Multinucleated cells in U251 and U343 control and SERBP1 knockdown (KD) cells after treatment with paclitaxel, an agent that causes cell cycle arrest. SERBP1 KD increased the number of multinucleated nuclei. Data are shown as means of counts of 1000 cells ± standard deviation (in triplicate) and statistical significance was determined by Student’s t-test. P<0.001. (D) Aspect of cells exposed to paclitaxel. On the left staining with anti-α-Tubulin; in the middle staining with DAPI showing an increased number of multinucleated cells after siSERBP1 KD. ×100 magnification for detailed visualization of a single multinucleated cell. (E) Plot shows the results of a cell viability screening (291 drugs) performed in U343 control vs. U343 SERBP1 over-expressing (OE) cells. Red dots correspond to drugs whose impact on cell viability was significantly different between U343 control and U343 SERBP1 OE. (F) Highlights of the screening showing cell cycle/division and DNA damage/replication inhibitors whose impact on cell viability was smaller in U343 SERBP1 OE in comparison to control. Datasets used to prepare the figure and detailed analysis are in Supplementary file 1 and Supplementary file 7.
-
Figure 2—source data 1
PDF file containing original western blots for Figure 2B.
- https://cdn.elifesciences.org/articles/98152/elife-98152-fig2-data1-v1.pdf
-
Figure 2—source data 2
Original western blots for Figure 2B.
- https://cdn.elifesciences.org/articles/98152/elife-98152-fig2-data2-v1.zip
Figure 3
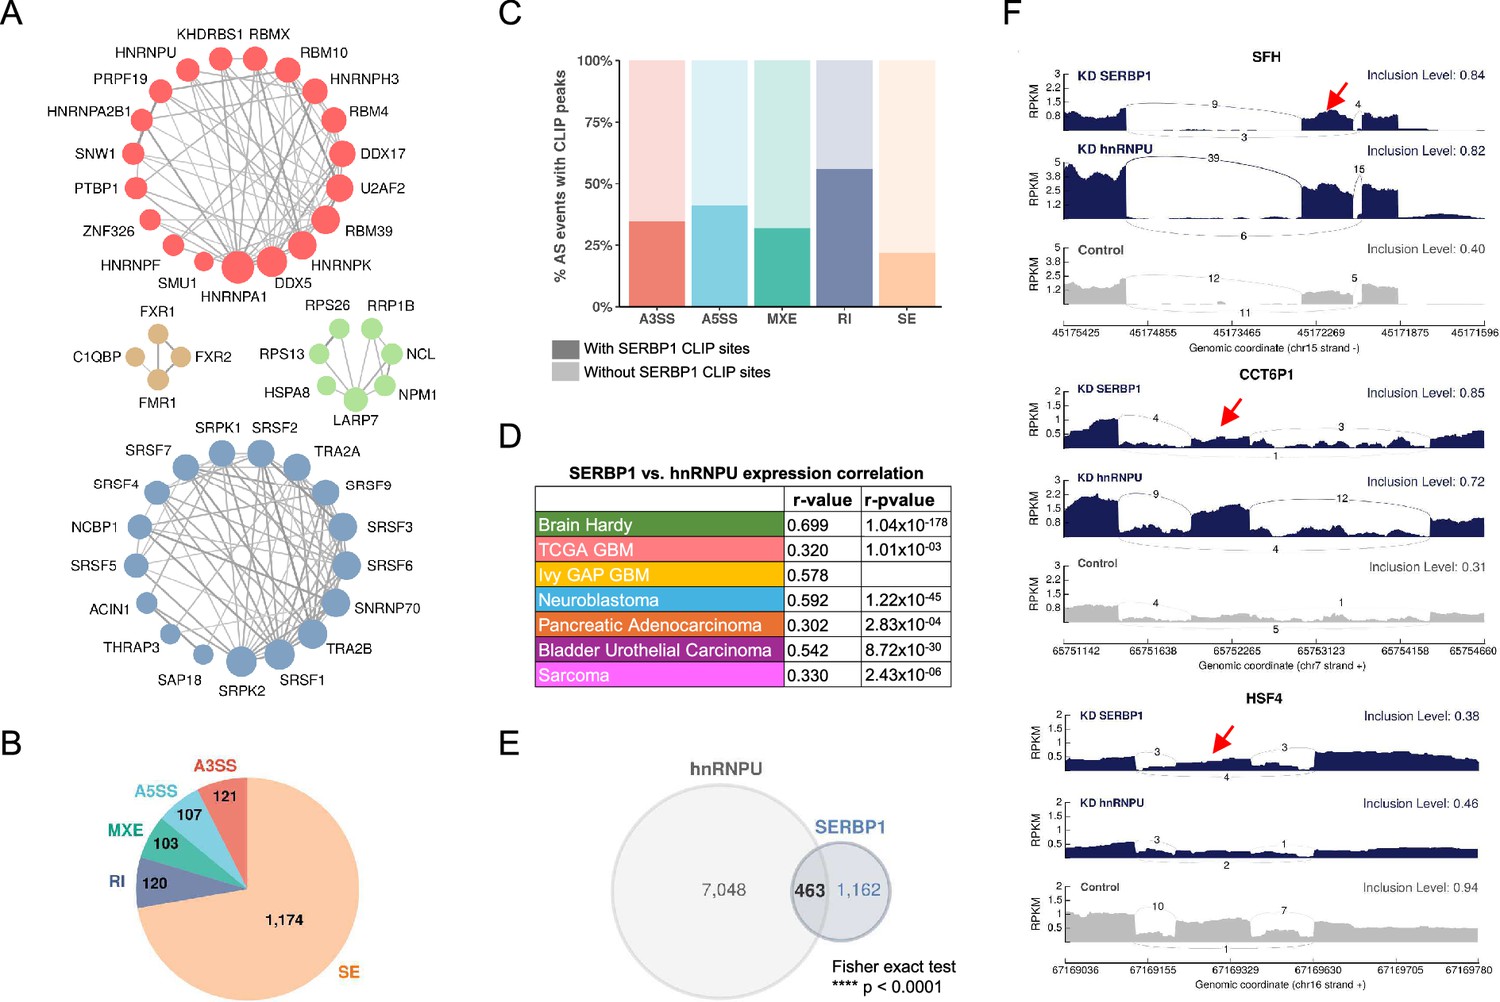
SERBP1 influences splicing.
(A) SERBP1-interacting factors are preferentially associated with splicing. Networks show connections between splicing factors identified as SERBP1 interactors. (B) SERBP1 knockdown in U251 cells produced major changes in splicing. Pie chart displays the distribution of splicing events affected by SERBP1 knockdown according to their type: SE, exon skipping; RI, intron retention; MXE, multiple exclusive exons; A5SS, alternative 5’ splice sites; A3SS, alternative 3’ splice site. (C) Bar graphs showing the percentage of splicing events affected by SERBP1 knockdown with evidence of SERBP1 binding sites close (<100 nt) to regulated splice sites. (D) hnRNPU was identified as a potential partner of SERBP1 in splicing regulation. SERBP1 and hnRNPU display high expression correlation in normal and tumor tissues. (E) Venn diagram shows a strong overlap between the splicing events affected by SERBP1 and hnRNPU knockdowns in U251 cells. (F) Sashimi plots showing examples of splicing events affected by both SERBP1 and hnRNPU knockdowns in U251 cells. The red arrows indicate affected exons. Datasets used to prepare the figure, and detailed analyses are in Supplementary file 8.
Figure 4 with 1 supplement
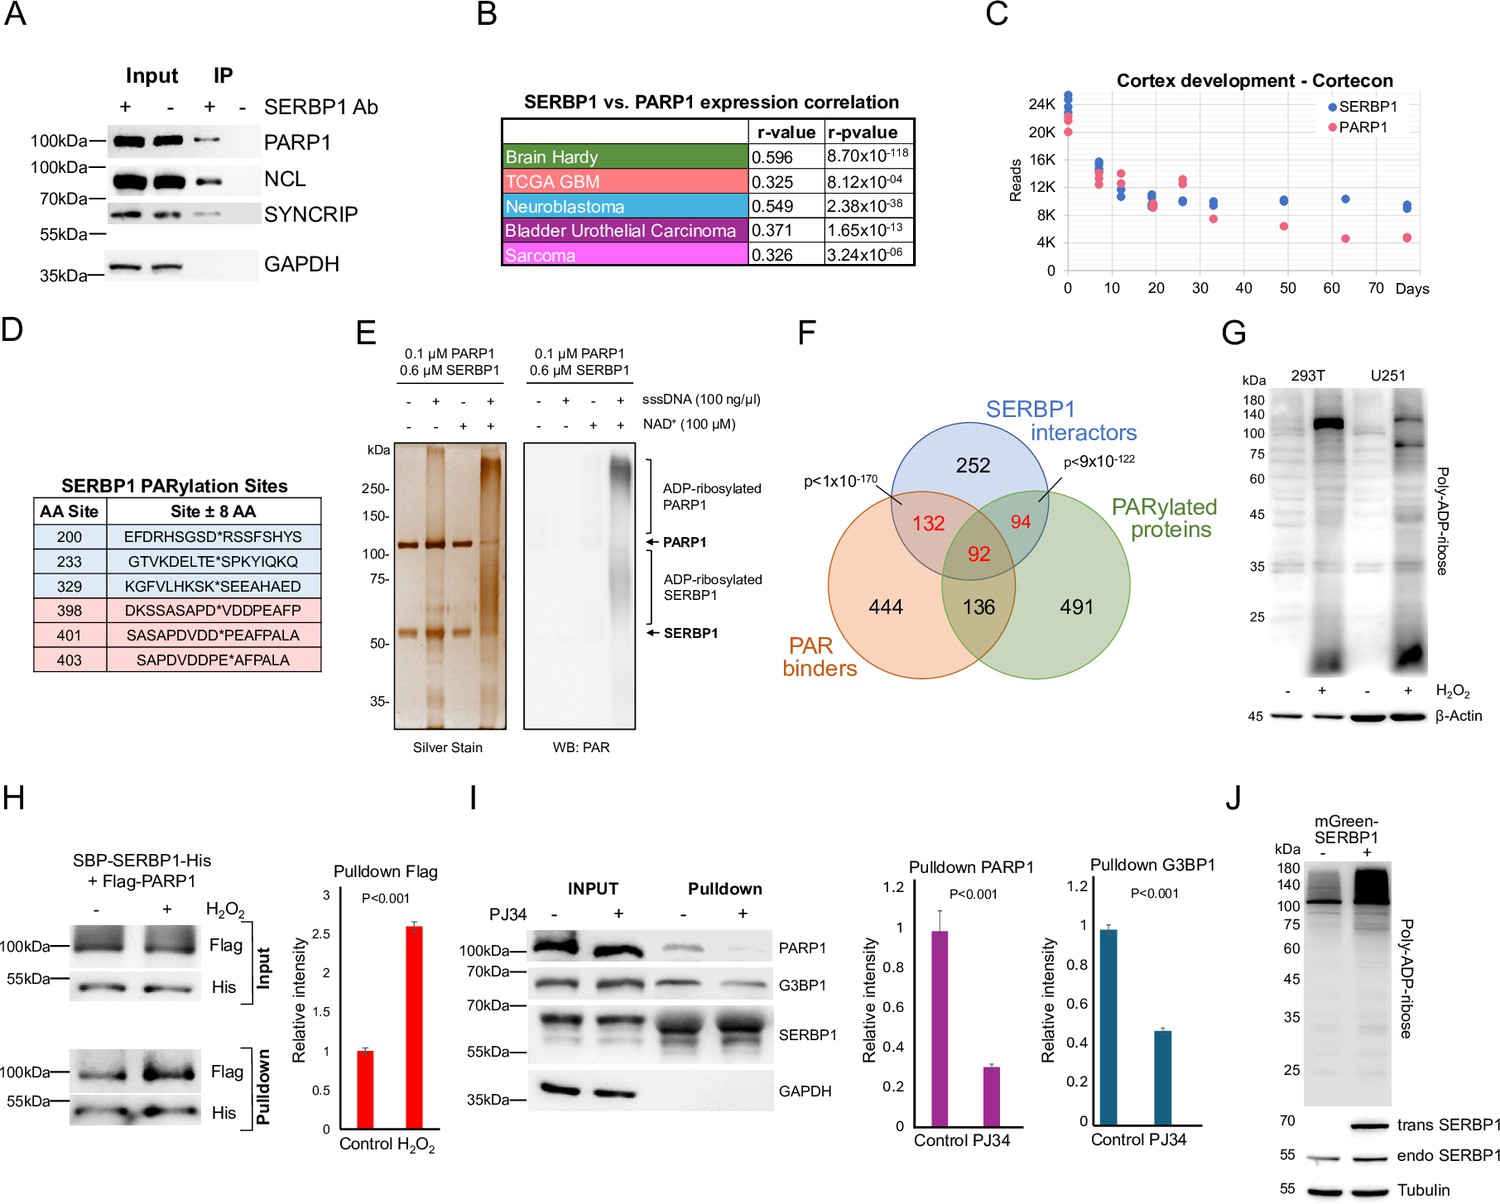
SERBP1 interacts with PARP1 and influences PARylation.
(A) Results of IP-western in U251 cells with control and anti-SERBP1 antibodies confirm SERBP1 interaction with PARP1, NCL, and SYNCRIP. SERBP1 and PARP1 strong association is corroborated by their high expression correlation in different studies (B) and similar expression profiles during cortex development according to Cortecon (van de Leemput et al., 2014). (C). (D) PARylation sites observed in SERBP1 protein according to Gibson et al., 2016; Martello et al., 2016. (E) PARP1 ADP-ribosylates SERBP1 in vitro. Purified recombinant PARP1 (0.1 µM) and SERBP1 (0.6 µM) were combined in a reaction with or without sheared salmon sperm DNA (sssDNA) (100 ng/µL) and NAD+ (100 µM) as indicated. The reaction products were analyzed by SDS-PAGE with silver staining (left) and Western blotting for PAR (right). Uncropped gels are shown. (F) Venn diagram shows that majority of SERBP1-associated factors get PARylated and/or bind PAR (Gibson et al., 2016; Martello et al., 2016; Dasovich et al., 2021). (G) Increase of PARylation levels in 293T and U251 GBM cells after H2O2 treatment. (H) SBP-SERBP1 and Flag-PARP1 were co-transfected into 293T cells. Cells were treated with H2O2 to induce PARylation and a pull-down experiment with streptavidin beads was performed. Western analysis showed increased SERBP1 association with PARP1 in cells treated with H2O2. SBP-SERBP1-His detected by His antibody; Flag-PARP1 detected by Flag antibody. (I) SBP-SERBP1 was transfected into 293T cells. Cells were treated with DMSO or 10 μM PJ34 (PARP inhibitor) for two hours and a pull-down experiment with streptavidin beads was performed. Western analysis showed a decrease in SERBP1 association with PARP1 and GPBP1. (J) SERBP1 transgenic expression (mGreen-SERBP1) in 293T cells increased the levels of PARylated proteins as indicated by PAR-detecting agent. Datasets used to prepare the figure, and detailed analyses are in Supplementary file 1, Supplementary file 5 and Supplementary file 6.
-
Figure 4—source data 1
PDF file containing original western blots for Figure 4A.
- https://cdn.elifesciences.org/articles/98152/elife-98152-fig4-data1-v1.pdf
-
Figure 4—source data 2
PDF file containing original western blots for Figure 4E.
- https://cdn.elifesciences.org/articles/98152/elife-98152-fig4-data2-v1.pdf
-
Figure 4—source data 3
PDF file containing original western blots for Figure 4G.
- https://cdn.elifesciences.org/articles/98152/elife-98152-fig4-data3-v1.pdf
-
Figure 4—source data 4
PDF file containing original western blots for Figure 4H.
- https://cdn.elifesciences.org/articles/98152/elife-98152-fig4-data4-v1.pdf
-
Figure 4—source data 5
PDF file containing original western blots for Figure 4I.
- https://cdn.elifesciences.org/articles/98152/elife-98152-fig4-data5-v1.pdf
-
Figure 4—source data 6
PDF file containing original western blots for Figure 4J.
- https://cdn.elifesciences.org/articles/98152/elife-98152-fig4-data6-v1.pdf
-
Figure 4—source data 7
Original western blots for Figure 4.
- https://cdn.elifesciences.org/articles/98152/elife-98152-fig4-data7-v1.zip
Figure 4—figure supplement 1
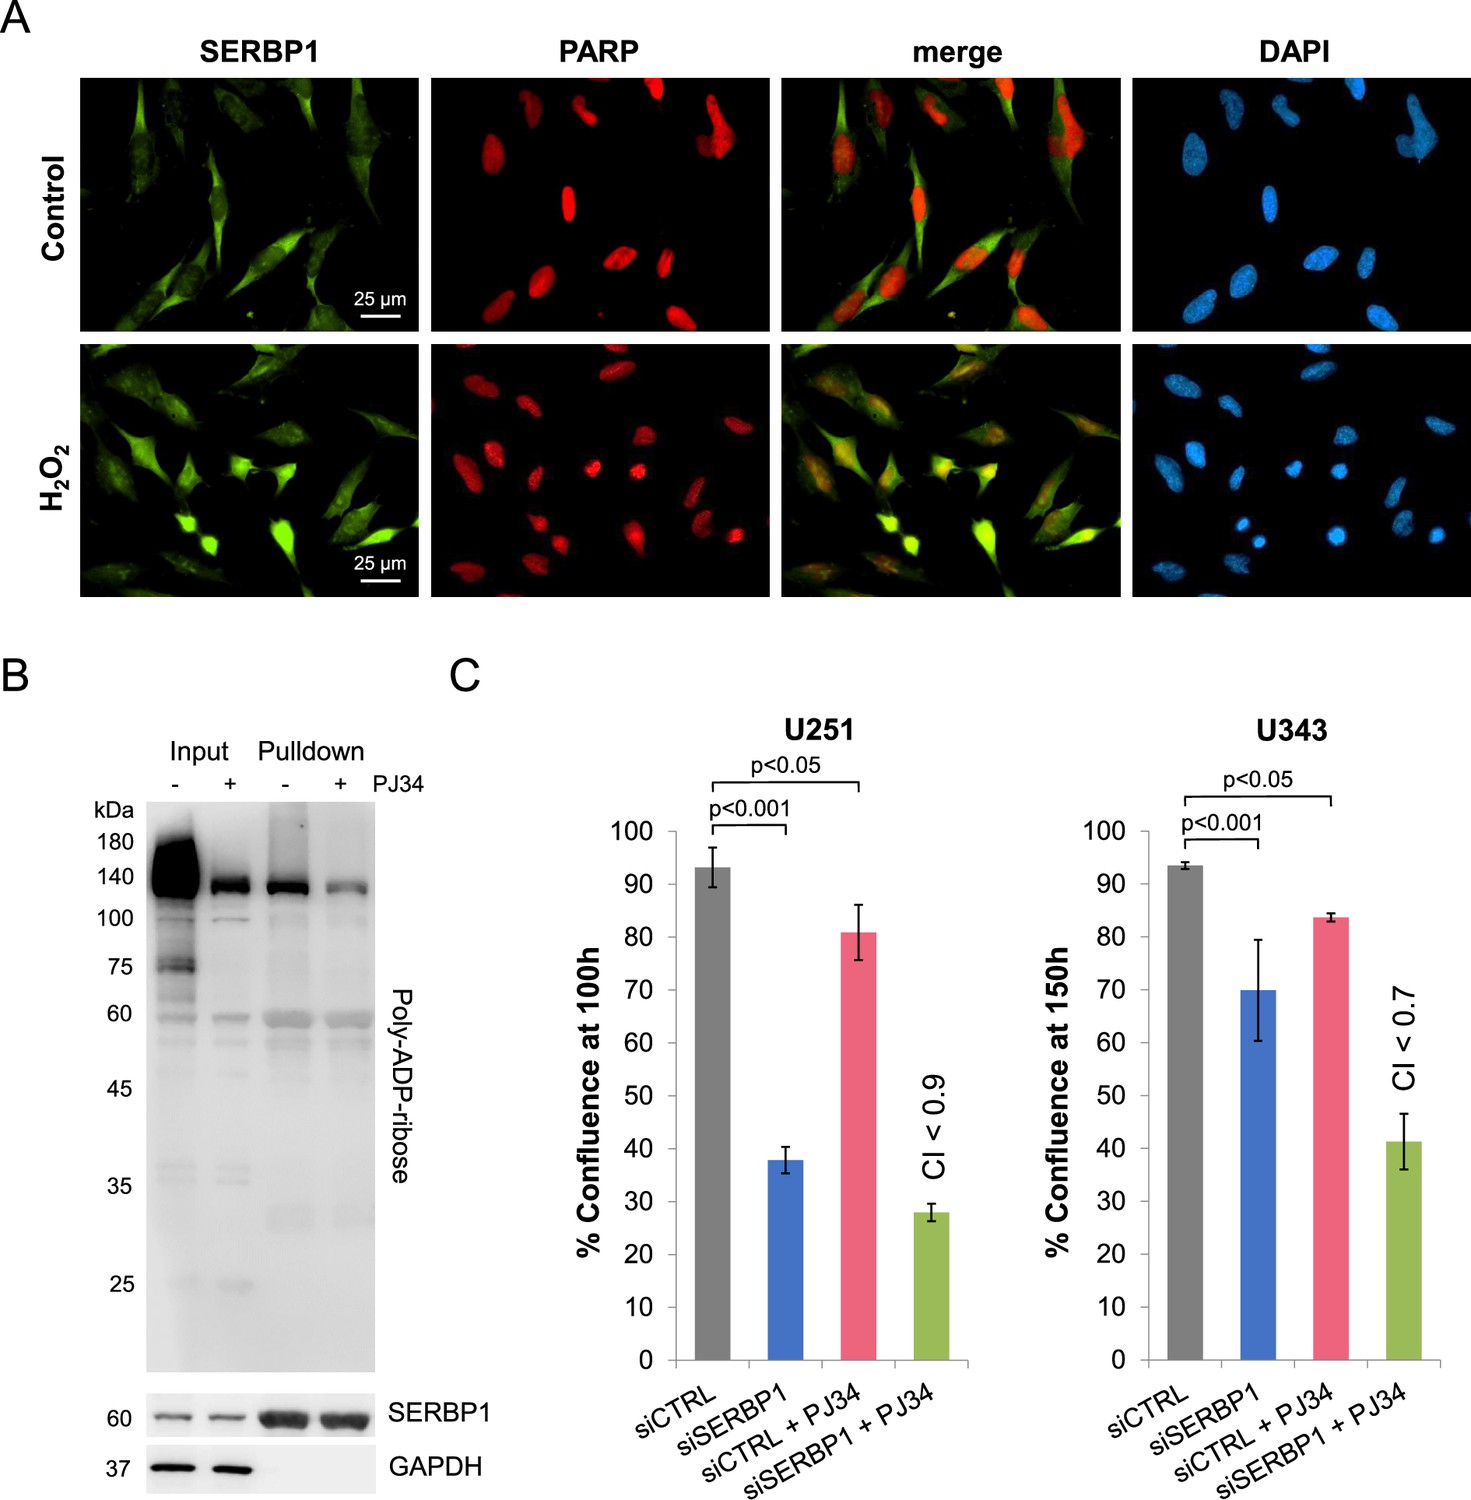
PARP, PARylation and SERBP1 function.
(A) SERBP1 shows increased nuclear localization and co-localization with PARP1 in U251 cells after treatment with H2O2. (B) Effect of PARylation/PAR binding on SERBP1 protein interactions. 293T cells were transfected with SBP-SERBP1. The experimental group was treated with PJ34 10 mM for 2 hr. SERBP1-associated proteins were recovered via pulldown with streptavidin beads. Western blot shows PARylated proteins detected in input and pulldown using a poly-ADP-ribose binding reagent. (C) Effects of combined siSERBP1 knockdown and PARP inhibitor treatment on GBM cell viability. Reduction in proliferation displayed by U251 and U343 cells treated with only PJ34 (PARP inhibitor) or SERBP1 siRNA (partial SERBP1 KD) and combination. The combination treatment showed a synergistic effect as judged by the Combination Index (CI; Chou, 2010). Data are shown as means ± standard deviation. Each group has 6 replicates. Statistical significance was evaluated by Student’s t-test.
-
Figure 4—figure supplement 1—source data 1
PDF file containing western blots for Figure 4—figure supplement 1B.
- https://cdn.elifesciences.org/articles/98152/elife-98152-fig4-figsupp1-data1-v1.pdf
-
Figure 4—figure supplement 1—source data 2
Original western blots for Figure 4—figure supplement 1B.
- https://cdn.elifesciences.org/articles/98152/elife-98152-fig4-figsupp1-data2-v1.zip
Figure 5 with 1 supplement
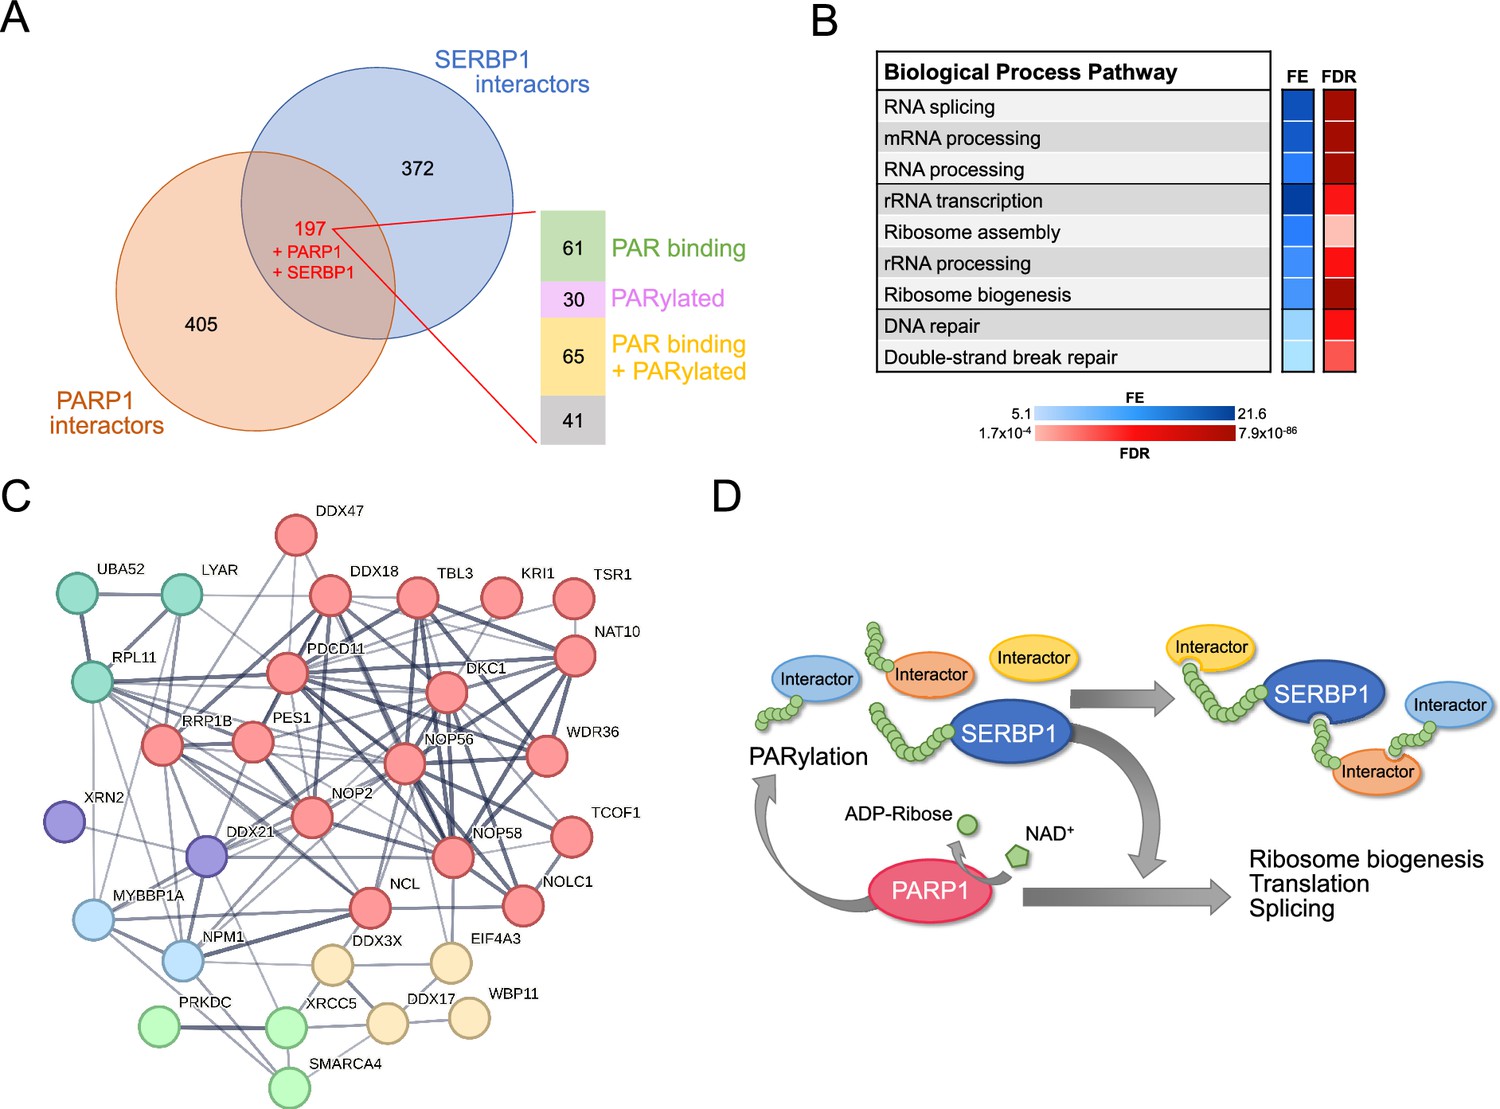
Shared SERBP1 and PARP1 interactors.
(A) Venn diagram shows the overlap between PARP1 (Mosler et al., 2022) and SERBP1 interactomes. Analysis of shared interactors indicated that the majority of them are PAR binding (Dasovich et al., 2021) and/or get PARylated (Gibson et al., 2016; Martello et al., 2016). (B) Selection of enriched GO terms (biological processes) related to SERBP1-PARP1 shared interactors according to ShinyGO (Ge et al., 2020). FE = fold enrichment; FDR = false discovery rate. (C) Network showing shared SERBP1 and PARP1 interactors implicated in ribosome biogenesis. (D) Proposed SERBP1-PARP1 feedback model; SERBP1 function and association with partner proteins is modulated by PARylation while SERBP1 influences PARP activity. Datasets used to prepare the figure, and detailed analyses are in Supplementary file 1 and Supplementary file 6.
Figure 5—figure supplement 1
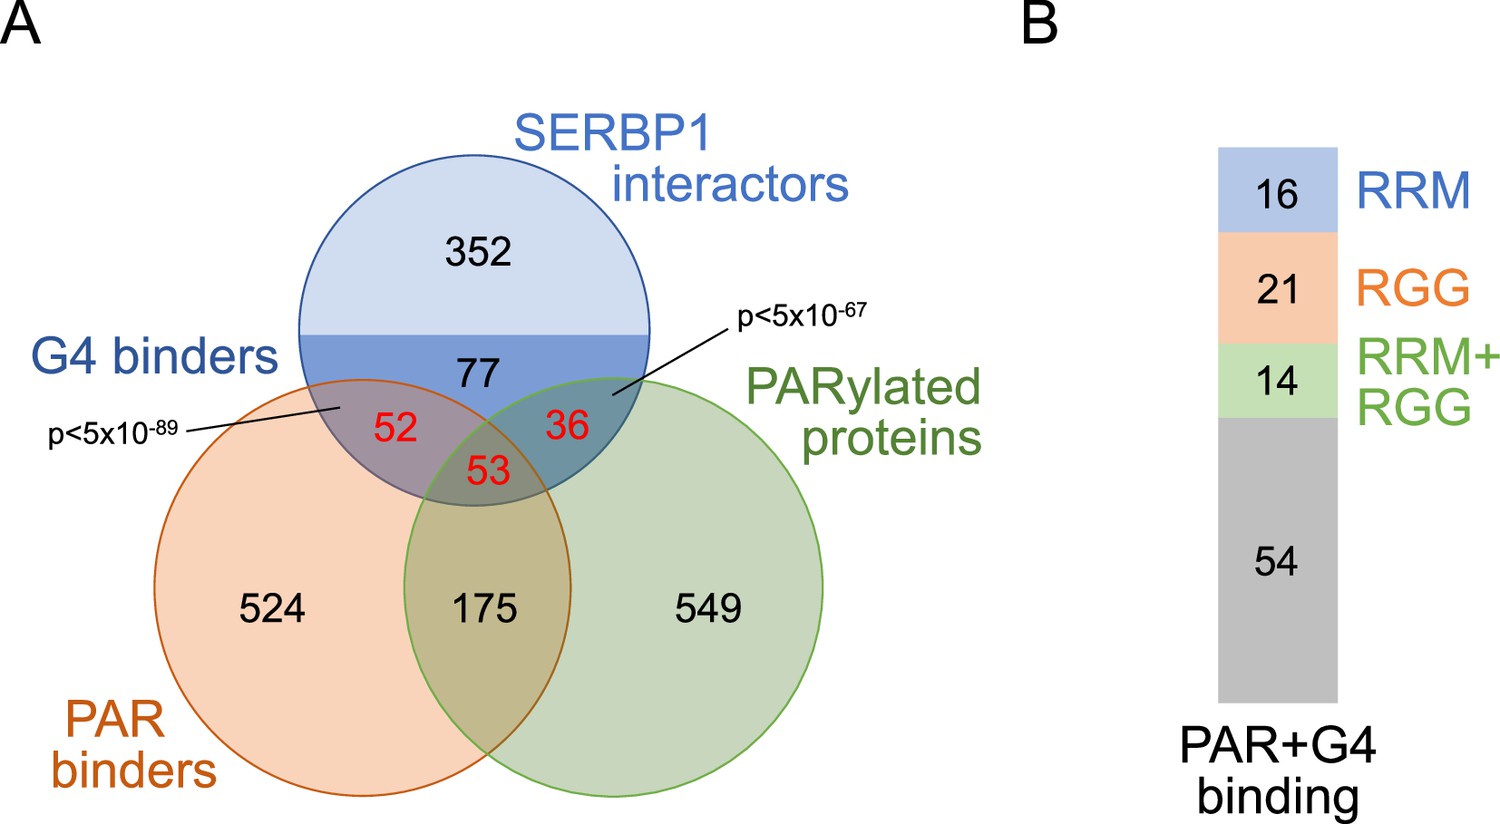
SERBP1 interactors, PARylation, PAR- and G4-binding.
(A) Venn diagram showing that many SERBP1-associated proteins that get PARylated and/or bind PAR (Gibson et al., 2016; Martello et al., 2016; Dasovich et al., 2021) also bind to G4s (Su et al., 2021b; Herviou et al., 2020). (B) Prevalence of RRM (Bateman et al., 2023) and RGG (Thandapani et al., 2013) domains in those SERBP1 interactors that bind both PAR and G4s. Datasets used to prepare the figure, and detailed analyses are in Supplementary file 1, Supplementary file 5 and Supplementary file 6.
Figure 6
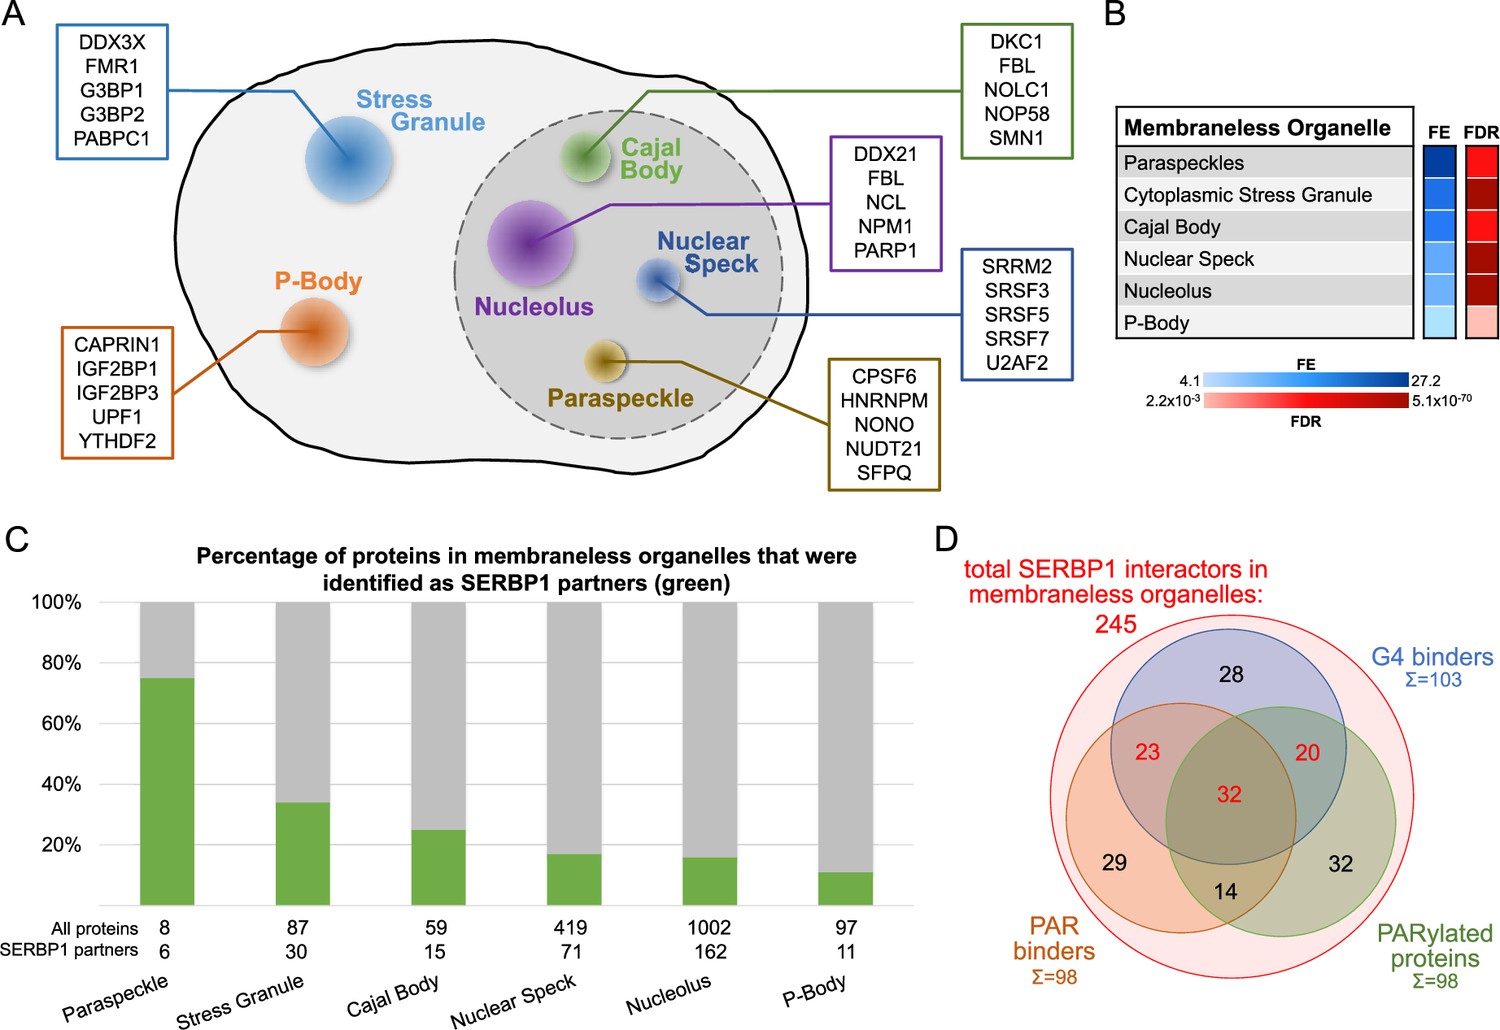
SERBP1-associated proteins are present in membraneless organelles.
(A) Different types of membraneless organelles in a cell and examples of SERBP1-associated proteins present in each structure. (B) Membraneless organelles identified in the GO enrichment analysis (cellular component) of SERBP1 interactors (Thomas et al., 2022). FE = fold enrichment; FDR = false discovery rate. (C) Bar graph showing the distribution of SERBP1-associated proteins in different membraneless organelles. (D) Venn diagram representing the distribution of SERBP1-associated proteins present in membraneless organelles in respect to G4 binding (Su et al., 2021b; Herviou et al., 2020), PAR binding (Dasovich et al., 2021), and PARylation (Gibson et al., 2016; Martello et al., 2016). Datasets used to prepare the figure, and detailed analyses are in Supplementary files 1, 6 and 9.
Figure 7
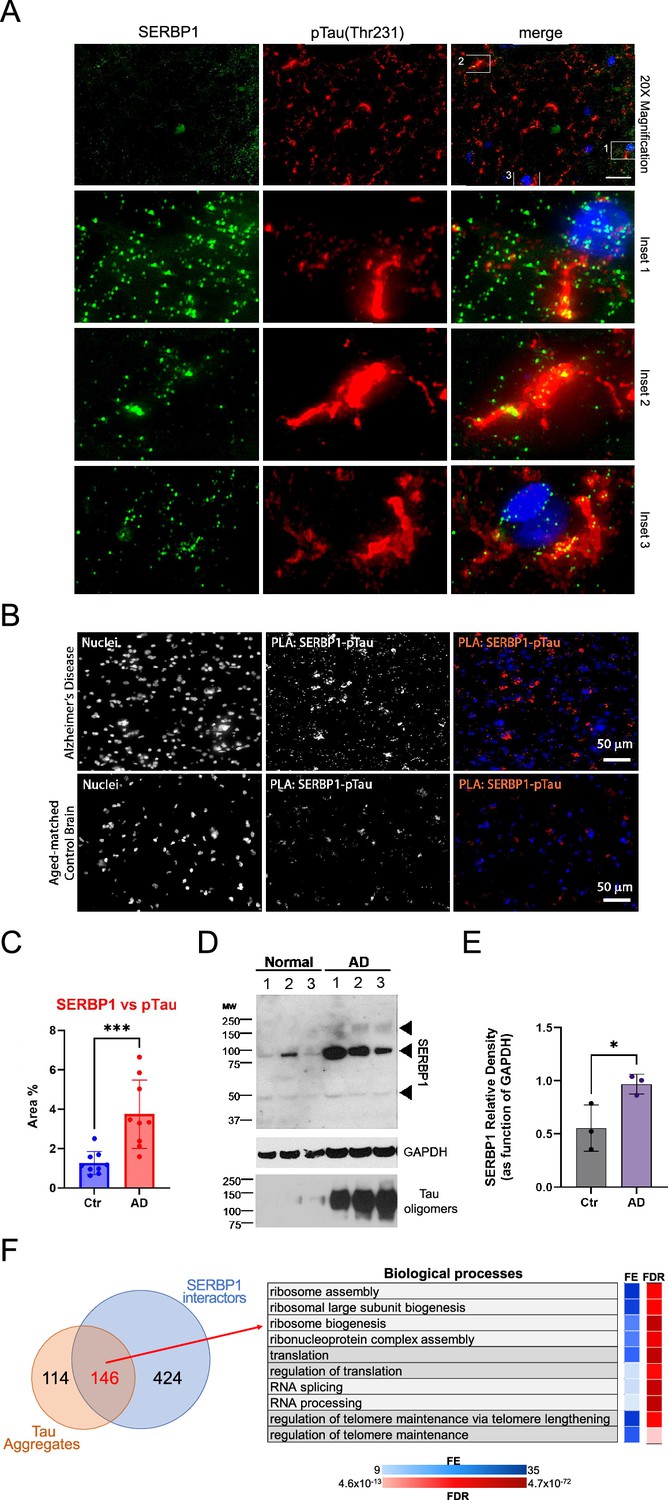
SERBP1 is present in Tau aggregates.
(A) Representative co-immunofluorescence of SERBP1 and Phospho-Tau (Thr231) in AD brain tissues. Merged channel is represented. DAPI was used to stain nuclei. Magnification 20 x and white scale bar: 50 µm. Three different Insets selected from merged channels are represented in zoomed images as merged, SERBP1 (green) and Phospho-Tau (red). (B) Representative PLA of SERBP1 vs. pTau in AD and aged-matched control brains (magnification 40 x and white scale bar: 50 µm). (C) Percentage of positive area to PLA fluorescence in region of interests in AD and control brains (Ctr vs AD, *** p<0.001, paired t-test). (D) Western blot showing SERBP1 expression in normal and AD brains and presence of oligomers. GAPDH and Tau oligomers immunoblot are shown. (E) SERBP1 relative density in Ctr and AD brains, quantified as function of GAPDH (from immunoblot in D). (Ctr vs. AD, * p<0.05, paired t-test). (F) Venn diagram shows overlap between proteins often identified in Tau aggregates and SERBP1 associated proteins identified in this study (top). Gene Ontology (GO) enrichment analysis (Biological Processes) using ShinyGO (Ge et al., 2020) indicated that SERBP1-associated factors that are also present in Tau aggregates are implicated in ribosome biogenesis, translation, splicing and telome maintenance. FE = fold enrichment; FDR = false discovery rate. Datasets used to prepare the figure, and detailed analyses are in Supplementary file 1 and Supplementary file 9.
-
Figure 7—source data 1
PDF file containing original western blots for Figure 7D.
- https://cdn.elifesciences.org/articles/98152/elife-98152-fig7-data1-v1.pdf
-
Figure 7—source data 2
Original western blots for Figure 7D.
- https://cdn.elifesciences.org/articles/98152/elife-98152-fig7-data2-v1.zip
Figure 8 with 1 supplement
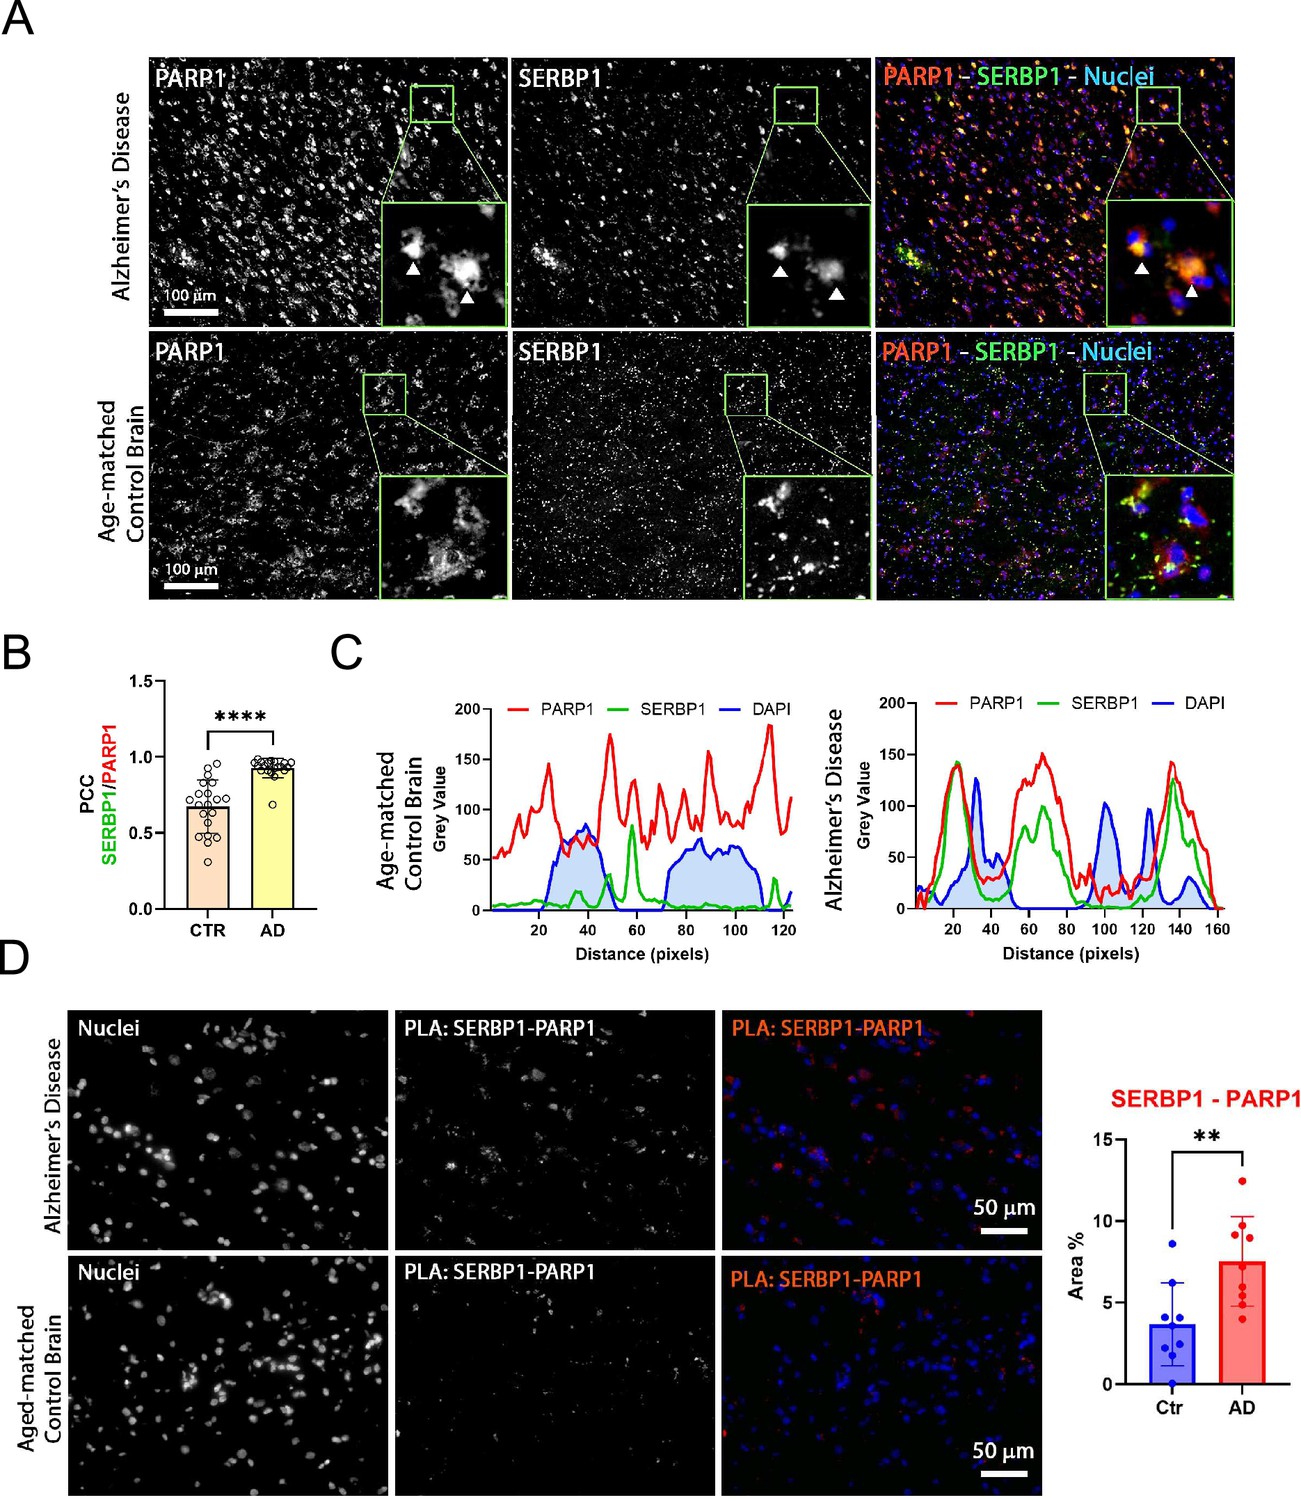
SERBP1 association with PARP1 in Alzheimer’s brains.
(A) Representative co-immunofluorescence of SERBP1 and PARP1 in AD and age-matched control brain tissues. PARP1 and SERBP1 are represented in gray while merged images represent PARP1 (red), SERBP1 (green). DAPI was used to stain nuclei (blue). Magnification ×20 and white scale bar: 100 µm. Each frame has a zoomed inset representing the detailed distribution of each target. (B) Pearson Coefficient (PCC) of co-localizing SERBP1 and PARP1 between cells of age-matched control and AD brains (CTR vs. AD, **** p<0.001 paired t-test). (C) Fluorescence intensity profiles of PARP1 (red), SERBP1 (green), and DAPI (blue) in representative cells from age-matched control and AD brains. Distance is represented in pixels and fluorescence intensity as Grey value obtained using ImageJ FIJI software. (D) Representative PLA of SERBP1 vs. PARP1 in AD and aged-matched control brains (magnification 40 x and white scale bar: 50 µm). Percentage of positive area to PLA fluorescence in region of interests in AD and control brains (Ctr vs AD, ** p<0.01, paired t-test).
Figure 8—figure supplement 1
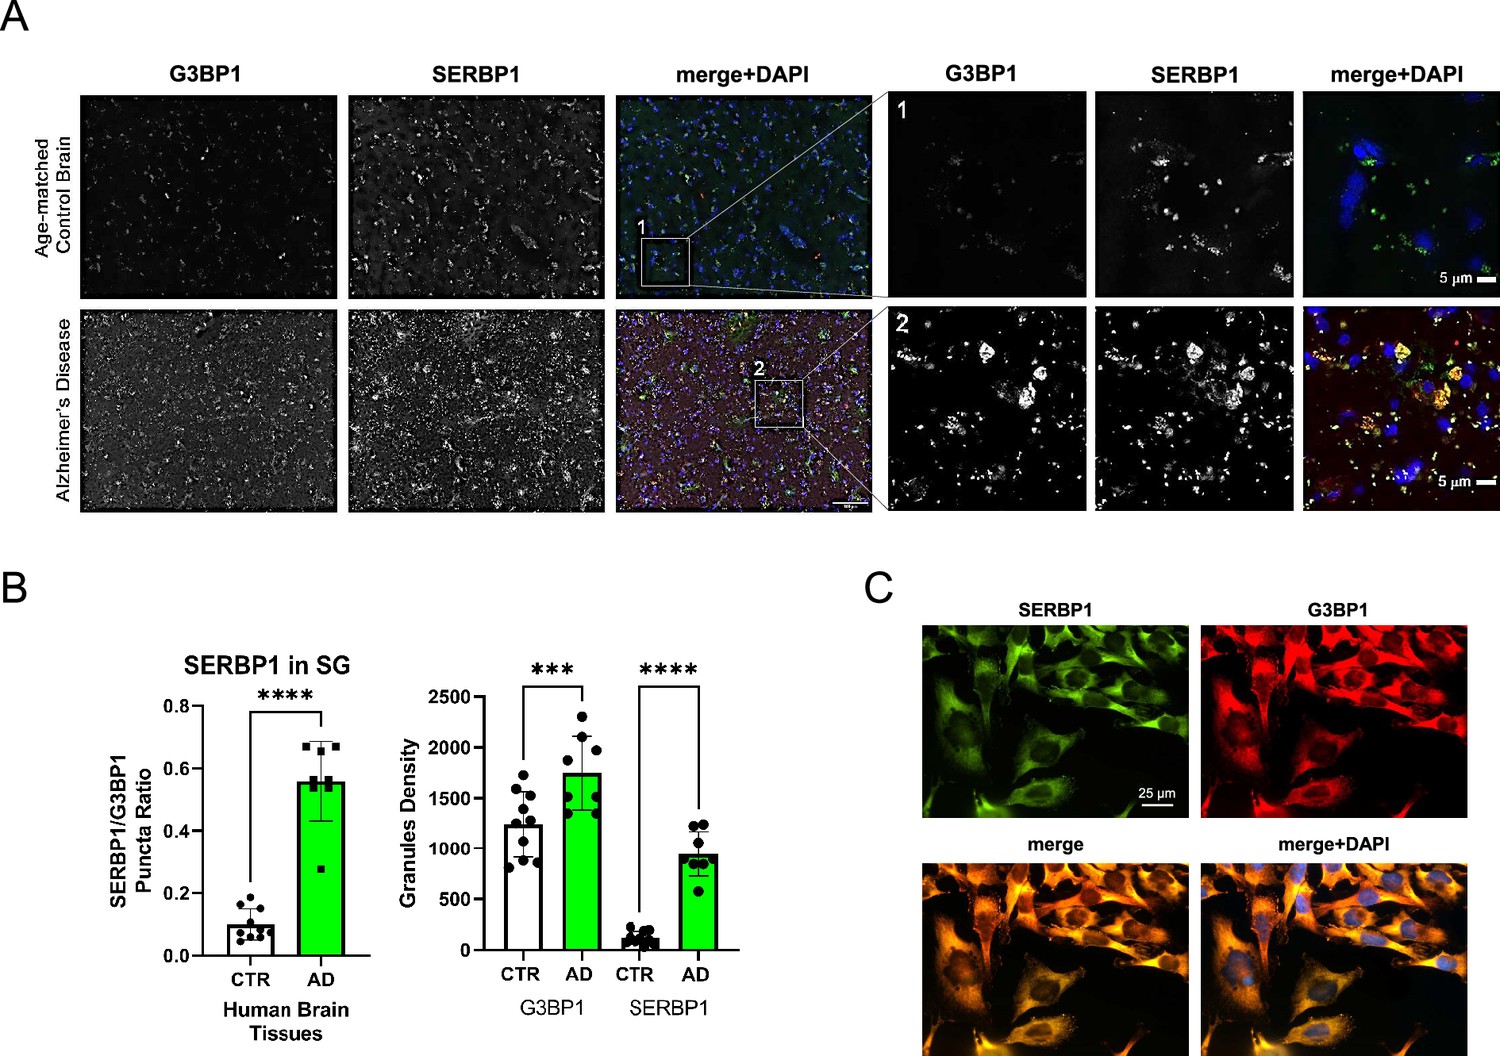
SERBP1 association with G3BP1 in pathological stress granules and glioblastoma cells.
(A) Representative co-immunofluorescence of G3BP1 and SERBP1 in control and AD brain tissues. Merged channel is represented. DAPI was used to stain nuclei. Magnification 20 x and white scale bar: 100 µm. Inset 1 (Ctr) and Inset 2 (AD) selected from merged channels are represented in zoomed images (white scale bar: 5 µm). (B) Quantification of SERBP1 puncta localized in stress granules (G3BP1 granules) in Ctr versus AD (unpaired t-test p<0.001,****). Quantification of stress granule density (G3BP1-positive foci) Ctr versus AD (ordinary one-way ANOVA p=0.006,***) and total SERBP1 puncta comparing Ctr versus AD (ordinary one-way ANOVA p<0.001,****). Quantification has been performed using BZ-X Analyzer software (Keyence) analyzing 3 frontal cortex sections (selected randomly) from 3 control and 3 AD cases. (C) SERBP1 co-localization with G3BP1 in U251 cells.
Tables
Key resources table
| Reagent type (species) or resource | Designation | Source or reference | Identifiers | Additional information |
|---|---|---|---|---|
| Gene (Homo sapiens) | SERBP1 | GenBank | HGNC:HGNC:17860 | |
| Cell line (H. sapiens) | U251 (glioblastoma) | Uppsala University | ||
| Cell line (H. sapiens) | U343 (glioblastoma) | Uppsala University | ||
| Cell line (H. sapiens) | 293T (normal) | ATCC | CRL-3216 | |
| Transfected construct (human) | SERBP1 SMARTpool siRNA | Dharmacon | Cat#:L-020528-01-0005 | |
| Biological sample (human) | Control and Alzheimer’s Disease (AD) human brains | Institute for Brain Aging and Dementia at UC Irvine | Braak Stage V-VI for AD brains | |
| Antibody | anti-SERBP1 (mouse monoclonal) | Santa Cruz Biotechnology | Cat#:sc100800 | WB (1:100 for human, 1:1000 for cell line samples), IF (1:50 for human, 1:200 for cell line samples), PLA (1:100) |
| Antibody | anti-GAPDH (rabbit polyclonal) | Abcam | Cat#:ab9485 | WB (1:1000) |
| Antibody | anti-G3BP1 (rabbit polyclonal) | Cell Signaling | Cat#:17798 S | IF (1:200) |
| Antibody | anti-PARP1 (rabbit monoclonal) | Cell Signaling | Cat#:9532 S | WB (1:1000), PLA (1:200) |
| Antibody | anti-SYNCRIP (rabbit polyclonal) | Invitrogen | Cat#:PA5-59501 | WB (1:1000) |
| Antibody | anti-hnRNPU (rabbit monoclonal) | Cell Signaling | Cat#:34095 | WB (1:1000) |
| Antibody | anti-Puromycin (mouse monoclonal) | Kerafast | Cat#:EQ0001 | WB (1:1000) |
| Antibody | anti-His (mouse monoclonal) | Santa Cruz Biotechnology | Cat#:sc-53073 | WB (1:1000) |
| Antibody | anti-Flag (mouse monoclonal) | Invitrogen | Cat#:MA1-91878 | WB (1:1000) |
| Antibody | anti-GAPDH (mouse monoclonal) | Santa Cruz Biotechnology | Cat#:SC32233 | WB (1:2000) |
| Antibody | anti-β-Actin (rabbit polyclonal) | Abcam | Cat#:ab8227 | WB (1:1000) |
| Antibody | anti-β-Tubulin (mouse monoclonal) | Sigma-Aldrich | Cat#:T8328 | WB (1:2000) |
| Antibody | anti-α-Tubulin (mouse monoclonal) | Invitrogen | Cat#:236–10501 | IF (1:200) |
| Antibody | anti-FBL (rabbit monoclonal) | Cell Signaling | Cat#:C13C3 | WB (1:1000) |
| Antibody | anti-NCL (rabbit monoclonal) | Cell Signaling | Cat#:D4C70 | WB (1:1000) |
| Antibody | anti-G3BP1 (mouse monoclonal) | Abcam | Cat#:ab56574 | IF (1:200) |
| Antibody | Anti-phospho-Tau (Thr231) (mouse monoclonal) | Thermo Fisher | Cat#:MN1040 | IF(1:250), PLA(1:500) |
| Antibody | HRP-conjugated anti-rabbit (goat polyconal) | Santa Cruz Biotechnology | Cat#:sc-2030 | WB (1:5000) |
| Antibody | HRP-conjugated anti-mouse (goat, polyclonal) | Santa Cruz Biotechnology | Cat#:sc-2005 | WB (1:5000) |
| Antibody | Alexa Fluor 488-conjugated anti-rabbit (goat polyclonal) | Invitrogen | Cat#:A11008 | IF (1:500) |
| Antibody | Alexa Fluor 568-conjugated anti-mouse (goat polyclonal) | Invitrogen | Cat#:A11004 | IF (1:500) |
| Antibody | Anti-poly-ADP-ribose binding reagent (with rabbit Fc-tag) | Millipore | Cat#:MABE1031; RRID:AB_2665467 | WB (1:1000) |
| Recombinant DNA reagent | pEF1 (plasmid) | Thermo Fisher | Cat#:V92120 | |
| Recombinant DNA reagent | pSBP-SERBP1 (plasmid) | This paper | SERBP1 ORF and SBP-tag cloned in frame in pEF1 backbone | |
| Recombinant DNA reagent | pUltra-SERBP1 lentiviral vector | Kosti et al., 2020 | control for pulldown experiments (no SBP-tag) | |
| Recombinant DNA reagent | pcDNA3.1-mGreenLantern (plasmid) | Addgene | RRID:Addgene_161912 | |
| Recombinant DNA reagent | mGreen-SERBP1 (plasmid) | This paper | SERBP1 ORF cloned in frame in pcDNA3.1-mGreenLantern backbone | |
| Recombinant DNA reagent | Flag-PARP1 | Addgene | RRID:Addgene_111575 | |
| Peptide, recombinant protein | 6xHis-tagged SERBP1 | Baudin et al., 2021 | ||
| Commercial assay or kit | Lipofectamine RNAiMAX | Invitrogen | Cat#:13778150 | |
| Commercial assay or kit | Streptavidin beads | GE Healthcare Life Sciences | Cat#:17-5113-01 | |
| Commercial assay or kit | Cell Titer Glo 2.0 | Promega | Cat#:G9243 | |
| Commercial assay or kit | Duolink PLA in Situ Red starter kit mouse/rabbit | Sigma-Aldrich | Cat#:DUO92101 | |
| Chemical compound, drug | Cambridge Cancer Compound Library | Selleck Chem | Cat#:L2300 | 100 nM in 0.1% DMSO treatment concentration |
| Chemical compound, drug | Puromycin | Sigma-Aldrich | Cat#:P7255 | |
| Chemical compound, drug | Paclitaxel | Cayman Chem | Cat#:10461 | |
| Chemical compound, drug | PARP inhibitor PJ34 | Enzo | Cat#:ALX-270–289 | |
| Software, algorithm | Mascot v2.7.0 | Matrix Science | RRID:SCR_014322 | |
| Software, algorithm | Scaffold v4.9.0 | Proteome Software | RRID:SCR_014321 | |
| Software, algorithm | ImageJ FIJI | NIH | RRID:SCR_002285 | |
| Software, algorithm | BioInfoRx | https://bioinforx.com/apps/venn.php | ||
| Software, algorithm | Nematode genome comparison browser | http://nemates.org/MA/progs/overlap_stats.html | ||
| Software, algorithm | ShinyGO v0.67 & v0.77 | Ge et al., 2020 | ||
| Software, algorithm | Metascape v3.5 | Zhou et al., 2019 | ||
| Software, algorithm | Panther v17.0 | Thomas et al., 2022 | ||
| Software, algorithm | Revigo | Supek et al., 2011 | ||
| Software, algorithm | STRING v11.5 | Szklarczyk et al., 2023 | ||
| Software, algorithm | Cytoscape | Doncheva et al., 2023 | ||
| Software, algorithm | R2 | http://r2.amc.nl | ||
| Software, algorithm | dcGO Enrichment mining service | Fang and Gough, 2013 | ||
| Software, algorithm | STAR v2.7.7.a | Dobin et al., 2013 | ||
| Software, algorithm | rMATS v4.1.2 | Shen et al., 2014 | ||
| Software, algorithm | rmats2sashimiplot tool | https://github.com/Xinglab/rmats2sashimiplot; Xinglab, 2024 | ||
| Software, algorithm | BEDTools intersect software | Quinlan and Hall, 2010 | ||
| Software, algorithm | Kallisto v0.46.1 | Bray et al., 2016 | ||
| Software, algorithm | R package tximport | Soneson et al., 2015 | ||
| Software, algorithm | DESeq2 | Love et al., 2014 | ||
| Other | Fluor Save | Invitrogen | Cat#:345789 | Reagent, microscopy |
| Other | Prolong Gold Antifade with DAPI | Thermo Fisher | Cat#:P36931 | Reagent, microscopy |
Table 1
Brain tissues analyzed in this study from diseased and age-matched non-demented control subjects are summarized.
| Clinical Diagnosis | Case Number | Age | Gender | PMI (Hours) | Braak Tangles (0–6) | Application |
|---|---|---|---|---|---|---|
| AD | 1154 | 86 | M | 3.25 | 6 | IF/PLA |
| AD | 1098 | 81 | F | 2.75 | 5 | IF/PLA |
| AD | 5773 | 74 | M | 10 | 5 | IF/PLA |
| AD | 5779 | 73 | M | 15 | 6 | WB |
| AD | 5781 | 88 | M | 10 | 5 | WB |
| AD | 5829 | 68 | M | 12 | 6 | WB |
| Control | 5263 | 88 | M | 12.17 | 1 | IF/PLA |
| Control | 1161 | 84 | F | 2.50 | 0 | IF/PLA |
| Control | 1106 | 79 | M | 1.75 | 2 | IF/PLA |
| Control | 1796 | 81 | M | 8 | 0 | WB |
| Control | 2–99 | 74 | F | 2.8 | 2 | WB |
| Control | 13–01 | 95 | M | 3.7 | 1 | WB |
-
IF: Immunofluorescence; PLA: Proximity Ligation Assay; PMI:Postmortem Interval; WB:Western Blotting.
Additional files
-
Supplementary file 1
SERBP1-associated proteins identified by pulldown in 293T cells.
Mass spectrometry results of pulled-down proteins with respective counts in SBP-SERBP1 and control cells in two different experimental conditions. The summary sheet displays gene names and UniProt IDs (Bateman et al., 2023) of identified SERBP1 interactors. Additional sheets show SERBP1-associated proteins present in the nucleus and nucleolus. Also included are complete results of ShinyGO (Ge et al., 2020) and Metascape (Zhou et al., 2019) GO enrichment analyses of SERBP1 and all its identified associated proteins as well as comparisons of newly identified SERBP1 interactors with previous proximity-label (BIO-ID) studies (Go et al., 2021; Youn et al., 2018) and compilations from BioGRID (Stark et al., 2006).
- https://cdn.elifesciences.org/articles/98152/elife-98152-supp1-v1.xlsx
-
Supplementary file 2
snoRNAs and scaRNAs bound by SERBP1 according to RIP-Seq analysis (Kosti et al., 2020) and comparisons to PARP1 bound snoRNAs identified CLIP-identified (Mekishvili et al., 2017).
- https://cdn.elifesciences.org/articles/98152/elife-98152-supp2-v1.xlsx
-
Supplementary file 3
BioGRID data for STM1, SERBP1 yeast homolog.
STM1’s protein interactors as curated by BioGRID (Stark et al., 2006) with their gene ontologies (Ge et al., 2020), human homologs as derived from WORMHOLE (Sutphin et al., 2016), and overlap with SERBP1-associated proteins.
- https://cdn.elifesciences.org/articles/98152/elife-98152-supp3-v1.xlsx
-
Supplementary file 4
Protein domains and intrinsically disordered regions of SERBP1-associated proteins.
Analysis of protein domains present in SERBP1-associated proteins (Bateman et al., 2023) with their respective counts in reference to the total human proteome (Sonnhammer et al., 1997). Additional sheets display the results of gene ontology analyses for top-represented domains (Fang and Gough, 2013). Also shown are derived and curated intrinsically disordered proteins associated with SERBP1 according to MobiDB (Piovesan et al., 2023).
- https://cdn.elifesciences.org/articles/98152/elife-98152-supp4-v1.xlsx
-
Supplementary file 5
Gene expression correlation analysis.
Significant expression correlation values for SERBP1 and associated proteins in glioblastoma, neuroblastoma, pancreatic adenocarcinoma, bladder urothelial carcinoma, sarcoma, and normal brain datasets (Koster, 2023; Puchalski et al., 2018). Additionally, a list of SERBP1-associated proteins displaying a similar expression profile during cortex development according to Cortecon (van de Leemput et al., 2014). The last sheet shows the top SERBP1 interactors with the highest number of high expression correlation instances and their respective proteomics counts from our pulldown experiment.
- https://cdn.elifesciences.org/articles/98152/elife-98152-supp5-v1.xlsx
-
Supplementary file 6
Characteristics of SERBP1-associated proteins.
SERBP1-associated proteins are organized according to the presence of RGG boxes (Thandapani et al., 2013), RRM motifs (Bateman et al., 2023), G4 binding (Su et al., 2021b; Herviou et al., 2020), PAR binding (Dasovich et al., 2021), PARylation (Gibson et al., 2016; Martello et al., 2016) and overlap with SARS-CoV-2 (Lee et al., 2021) and PARP1 (Mosler et al., 2022) interactomes. Additional sheets show gene ontology results (Ge et al., 2020) of SERBP1-associated proteins that (1) get PARylated and/or bind to PAR, (2) overlap with SARS-CoV-2 interactors, or (3) overlap with PARP1 interactors. Mutual SERBP1- and PARP1-associated factors identified in an rRNA transcription and processing screening (Tafforeau et al., 2013) are highlighted on the last sheet.
- https://cdn.elifesciences.org/articles/98152/elife-98152-supp6-v1.xlsx
-
Supplementary file 7
SERBP1 and drug sensitivity.
Results of cell viability screening in SERBP1-overexpressing vs. control U343 cells and information on the utilized drugs. Separate sheets list genes conferring high sensitivity to different PARP inhibitors (Zhang et al., 2023) and SERBP1 interactors identified in this study.
- https://cdn.elifesciences.org/articles/98152/elife-98152-supp7-v1.xlsx
-
Supplementary file 8
Impact of SERBP1 and hnRNPU knockdown on the splicing of U251 cells.
List of splicing events and respective genes affected in siSERBP1 knockdown vs. control and sihnRNPU knockdown vs. control U251 cells. Additional files include splicing events affected by SERBP1 knockdown with evidence of SERBP1 binding sites (CLIP sites) (Kosti et al., 2020; Kitts et al., 2016; Frankish et al., 2021; Dobin et al., 2013) in the proximity (<100 nt) of regulated splice sites and splicing events affected by both SERBP1 and hnRNPU knockdown in the same direction.
- https://cdn.elifesciences.org/articles/98152/elife-98152-supp8-v1.xlsx
-
Supplementary file 9
Participation of SERBP1-associated proteins and snoRNAs in membraneless organelles.
Proteins associated with SERBP1 and their presence in stress granules, paraspeckles, Cajal bodies, nuclear specks, nucleoli, P-bodies (Thomas et al., 2022) and Tau aggregates (Kavanagh et al., 2022). UniProt ID mapping (Bateman et al., 2023) was used to match gene names and UniProt IDs. SERBP1 interactors implicated in membraneless organelles were evaluated for prevalence of intrinsic disorder (Piovesan et al., 2023), G4 binding (Su et al., 2021b; Herviou et al., 2020), PARylation (Gibson et al., 2016; Martello et al., 2016), and PAR binding (Dasovich et al., 2021). snoRNAs found in a previous study to be enriched in Tau aggregates (Lester et al., 2021) that were also identified as SERBP1 targets according to RIP-Seq analysis (Kosti et al., 2020).
- https://cdn.elifesciences.org/articles/98152/elife-98152-supp9-v1.xlsx
-
MDAR checklist
- https://cdn.elifesciences.org/articles/98152/elife-98152-mdarchecklist1-v1.docx
Download links
A two-part list of links to download the article, or parts of the article, in various formats.
Downloads (link to download the article as PDF)
Open citations (links to open the citations from this article in various online reference manager services)
Cite this article (links to download the citations from this article in formats compatible with various reference manager tools)
SERBP1 interacts with PARP1 and is present in PARylation-dependent protein complexes regulating splicing, cell division, and ribosome biogenesis
eLife 13:RP98152.
https://doi.org/10.7554/eLife.98152.3


