Upregulated expression of ubiquitin ligase TRIM21 promotes PKM2 nuclear translocation and astrocyte activation in experimental autoimmune encephalomyelitis
- Key Laboratory of the Ministry of Education for Medicinal Resources and Natural Pharmaceutical Chemistry, National Engineering Laboratory for Resource Development of Endangered Crude Drugs in Northwest of China, College of Life Sciences, Shaanxi Normal University, China
Figures
Figure 1 with 1 supplement
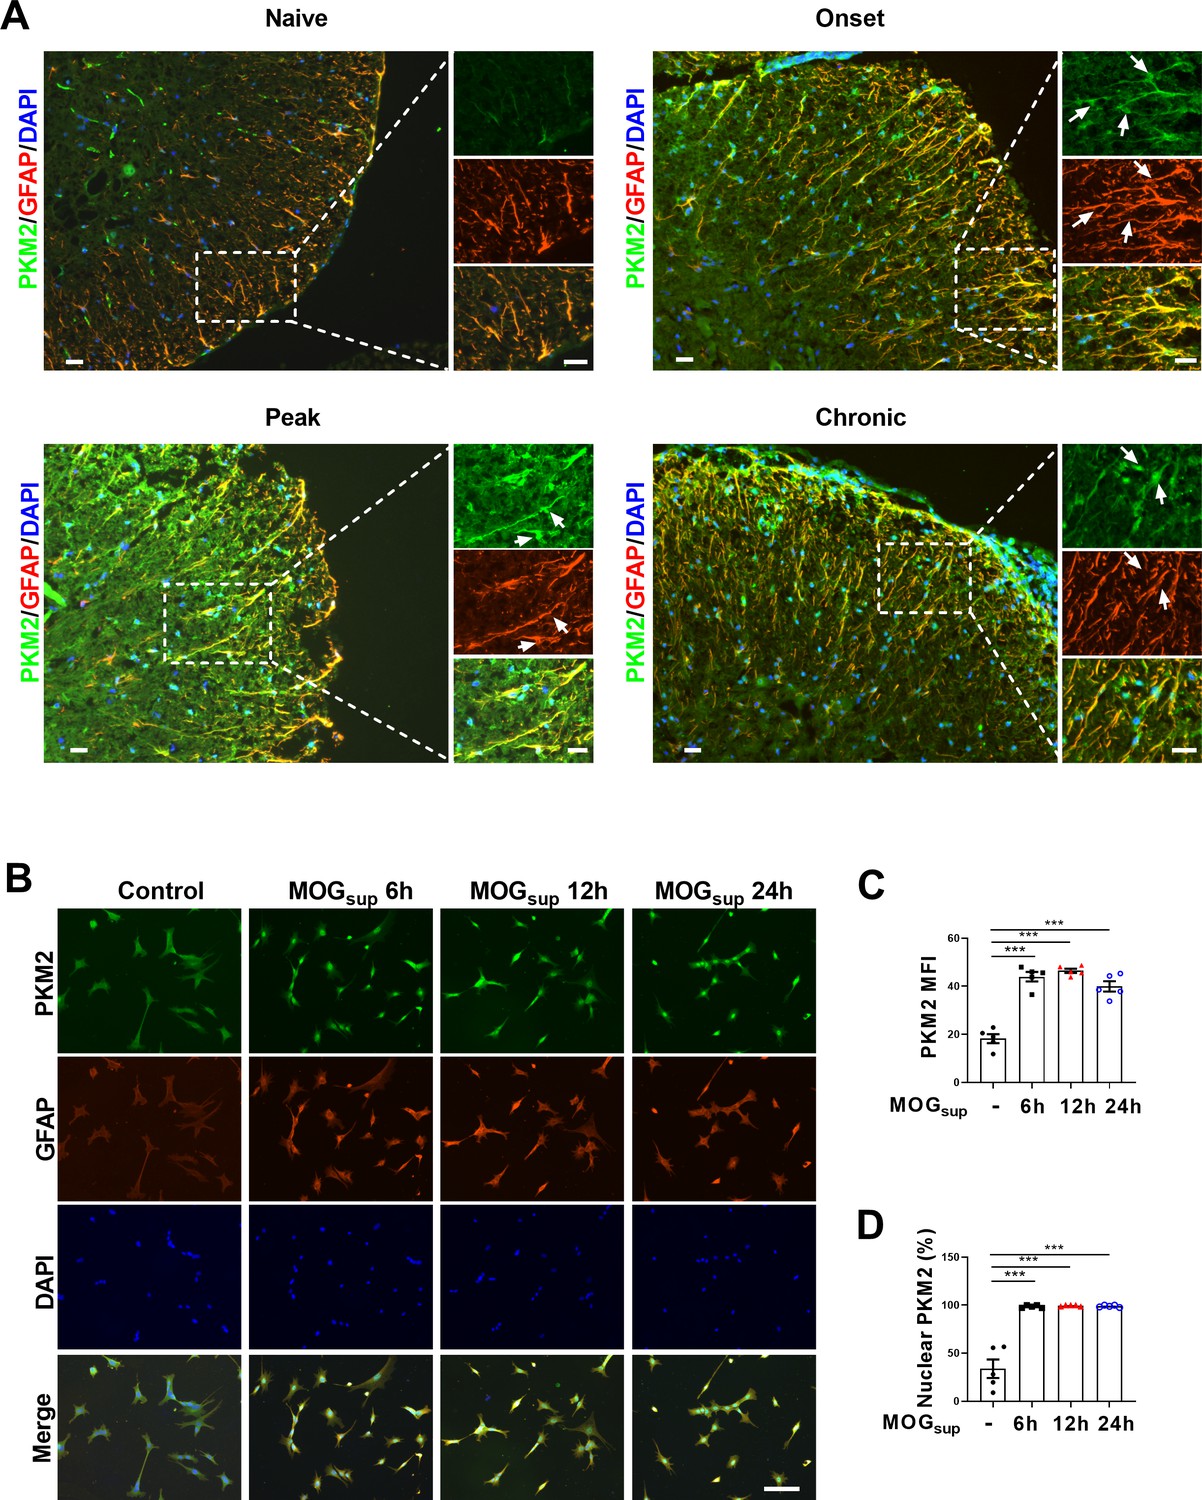
Nuclear translocation of PKM2 in astrocytes of EAE mice.
(A) Immunofluorescence staining of PKM2 with GFAP (astrocyte marker) in spinal cord of control mice (n=4) and MOG35–55-induced EAE mice. Disease onset (dpi 7–17, n=3), peak (dpi 14–24, n=4) and chronic (dpi 21–26, n=2) were defined dependent on the EAE course. Scale bar: 20 μm. White arrows indicated nuclear PKM2. (B) Immunofluorescence staining of PKM2 (green) with GFAP (red) in non-treated primary astrocytes (control) or primary astrocytes cultured with splenocytes supernatants of MOG35–55-induced EAE mice (MOGsup) for different time points (6 hr, 12 hr, and 24 hr). DAPI (blue) was used as a nuclear staining. Scale bar: 100 μm. (C) Mean fluorescence intensity (MFI) of PKM2 in different groups of B was calculated by ImageJ. (D) Nuclear PKM2 ratio in different groups of (B) were calculated. Five fields of views per group were included in the analysis. The number of nuclear PKM2 was quantified by Image-Pro Plus software manually (eg. nuclear or cytoplasmic based on DAPI blue staining). The proportion of nuclear PKM2 is determined by normalizing the count of nuclear PKM2 to the count of nuclear DAPI, which represents the number of cell nuclei. Data are represented as mean ± SEM, one-way ANOVA. ***p<0.001. SEM, standard error of the mean.
-
Figure 1—source data 1
Source data for Figure 1C and D.
- https://cdn.elifesciences.org/articles/98181/elife-98181-fig1-data1-v1.xlsx
Figure 1—figure supplement 1
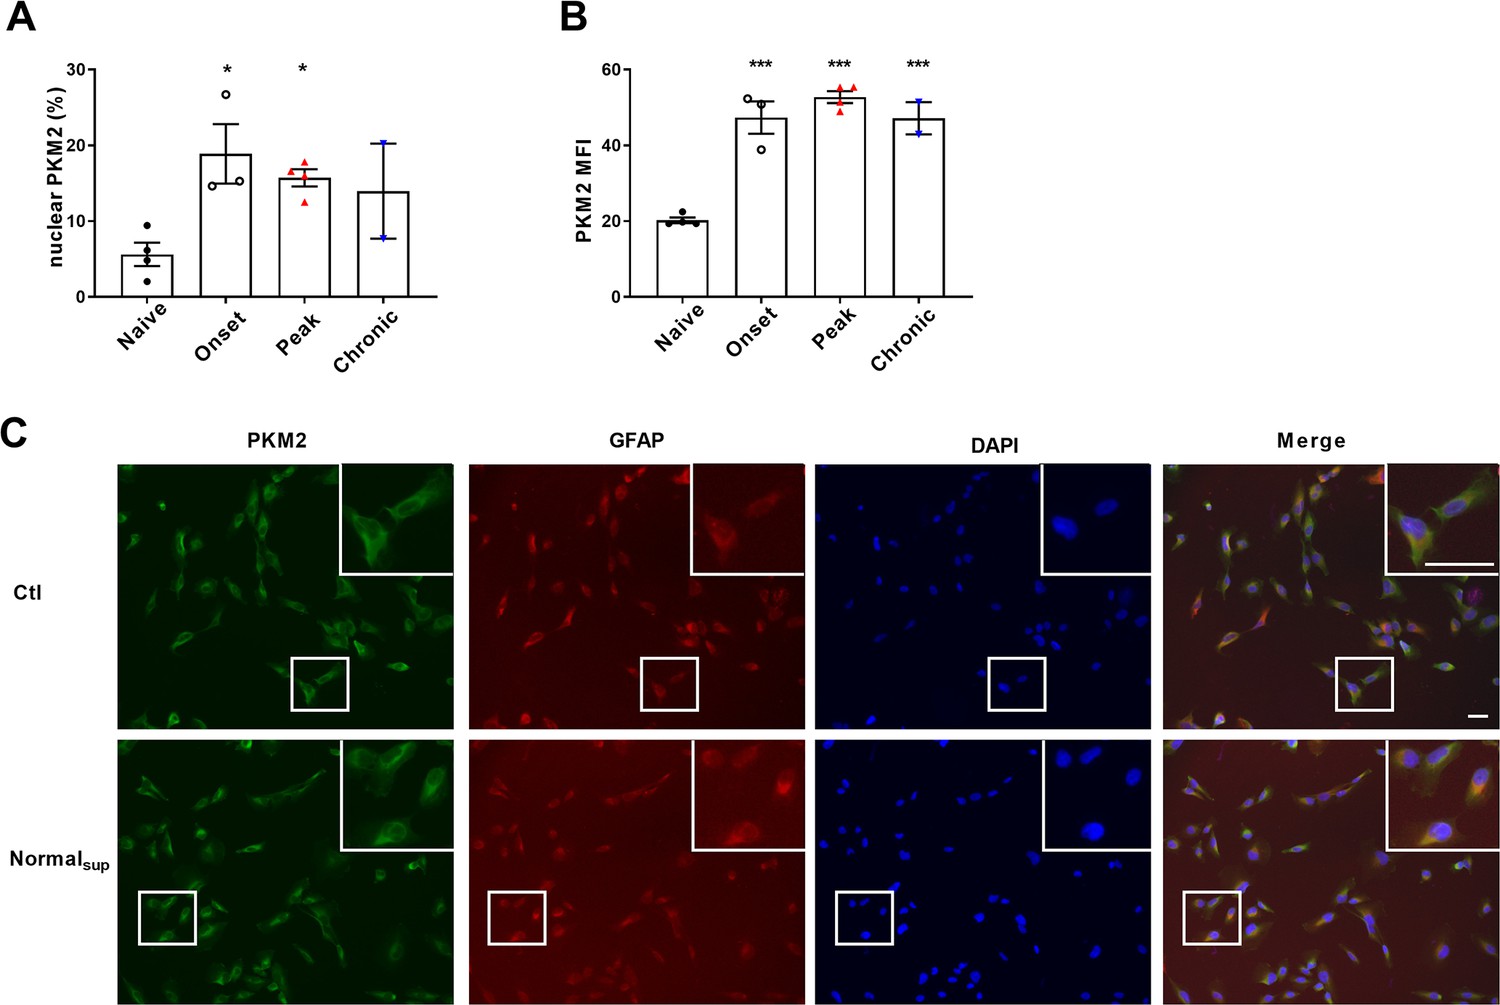
Quantification of nuclear ratio of PKM2 in astrocytes and mean fluorescence intensity of PKM2 in control and EAE mice.
(A) Nuclear PKM2 ratio in control mice and different phases of EAE mice were calculated in Figure 1A. Number of nuclear PKM2 in astrocytes was quantified by Imgae-Pro plus manually (eg. PKM2 was only counted in GFAP+ astrocytes cells, nuclear or cytoplasmic based on DAPI blue staining). The proportion of nuclear PKM2 in astrocytes is determined by normalizing the count of nuclear PKM2 to the count of GFAP+ cell numbers. (B) Mean fluorescence intensity (MFI) of PKM2 in control and EAE mice was calculated by Image J. (C) Immunofluorescence staining of PKM2 (green) with GFAP (red) in non-treated primary astrocytes (control) or primary astrocytes cultured with splenocytes supernatants from normal mice (Normalsup). Scale bar: 50 μm. Data are represented as mean ± SEM, one-way ANOVA, *p<0.05; ***p<0.001. SEM, standard error of the mean.
-
Figure 1—figure supplement 1—source data 1
Source data for Figure 1—figure supplement 1.
- https://cdn.elifesciences.org/articles/98181/elife-98181-fig1-figsupp1-data1-v1.xlsx
Figure 2 with 2 supplements
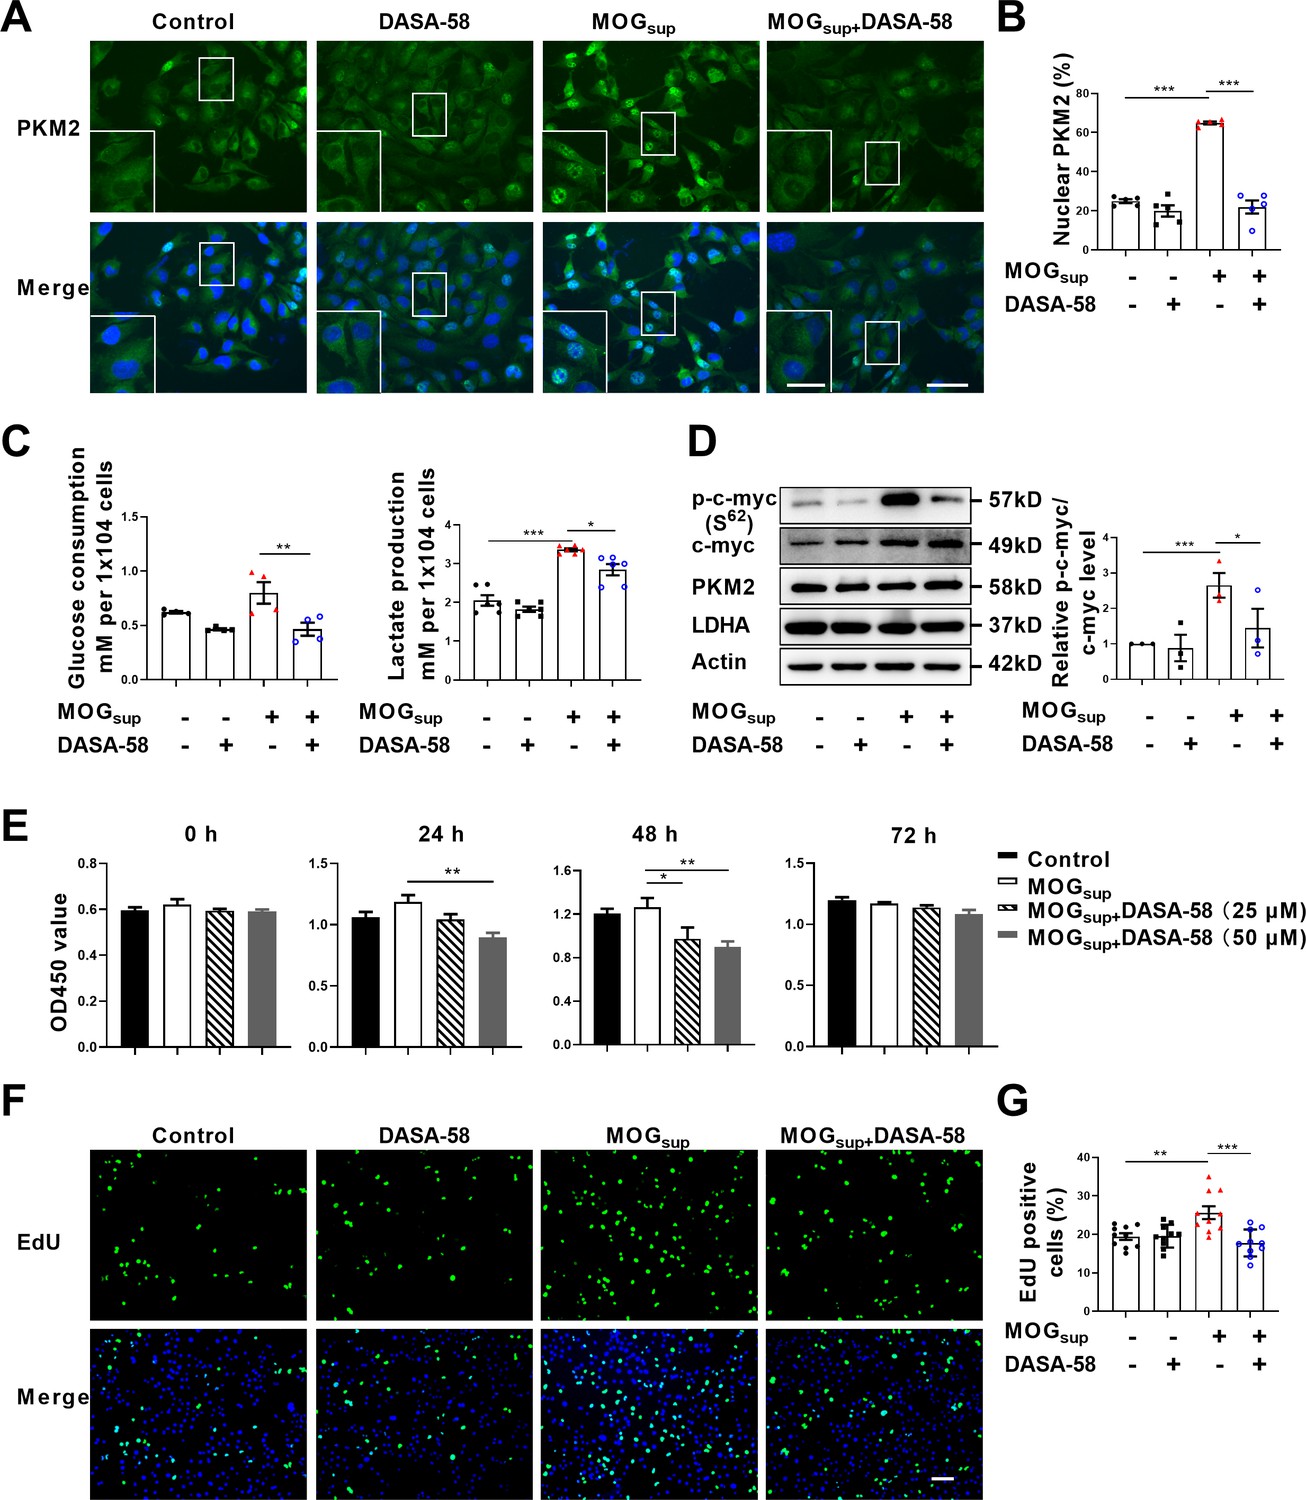
Prevention of PKM2 nuclear transport reduced the glycolysis and proliferation of primary astrocytes.
(A) Verification of DASA-58 effect on the inhibition of PKM2 nuclear transport by immunofluorescence. Primary astrocytes were pretreated with 50 μM DASA-58 for 30 min and stimulated with MOGsup for 12 hr. Scale bar: 50 μm. Scale bar in enlarged image: 20 μm. (B) Nuclear ratio of PKM2 in each group was calculated. Five fields of views per group were included in the analysis. (C) Glycolysis level of astrocytes in each group was assessed by lactate production (N=5) and glucose consumption (N=4) assays. (D) Effect of DASA-58 on protein levels of glycolytic enzymes p-c-myc, LDHA and PKM2 were measured by western blotting. Right panel shows the quantification of phospho-c-myc expression normalized to total c-myc levels. (E) Proliferation of astrocytes were measured by CCK8. N=5. (F) Proliferation of astrocytes were measured by EdU assays. (G) EdU-positive cells in each group was calculated from ten fields of views per group. Scale bar: 100 μm. The blot is representative of three independent experiments. Data are represented as mean ± SEM, one-way ANOVA. *p<0.05; **p<0.01; ***p<0.001.
-
Figure 2—source data 1
Source data for Figure 2B–E and G.
- https://cdn.elifesciences.org/articles/98181/elife-98181-fig2-data1-v1.xlsx
-
Figure 2—source data 2
Uncropped and labeled gels for Figure 2D.
- https://cdn.elifesciences.org/articles/98181/elife-98181-fig2-data2-v1.pdf
-
Figure 2—source data 3
Raw unedited gels for Figure 2D.
- https://cdn.elifesciences.org/articles/98181/elife-98181-fig2-data3-v1.zip
Figure 2—figure supplement 1

Quantification of PKM2 protein level in astrocytes treated with MOGsup or MOGsup pretreated with DASA-58.
Protein levels were calculated by Image J, PKM2 expression was normalized to β-Actin level. One-way ANOVA, data are represented as mean ± SEM.
-
Figure 2—figure supplement 1—source data 1
Source data for Figure 2—figure supplement 1.
- https://cdn.elifesciences.org/articles/98181/elife-98181-fig2-figsupp1-data1-v1.xlsx
Figure 2—figure supplement 2
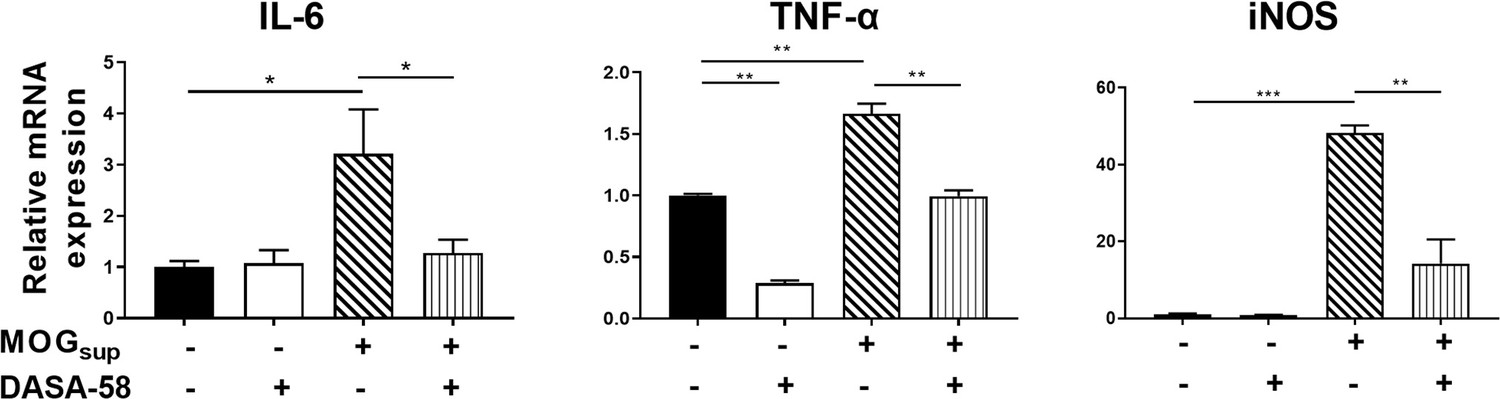
qPCR analysis of mRNA levels of inflammatory cytokines.
Primary astrocytes were pretreated with 50 μM DASA-58 for 30 min and stimulated with MOGsup for 12 hr. Data are represented as mean ± SEM, one-way ANOVA, *p<0.05; **p<0.01; ***p<0.001. SEM, standard error of the mean.
-
Figure 2—figure supplement 2—source data 1
Source data for Figure 2—figure supplement 2.
- https://cdn.elifesciences.org/articles/98181/elife-98181-fig2-figsupp2-data1-v1.xlsx
Figure 3 with 1 supplement
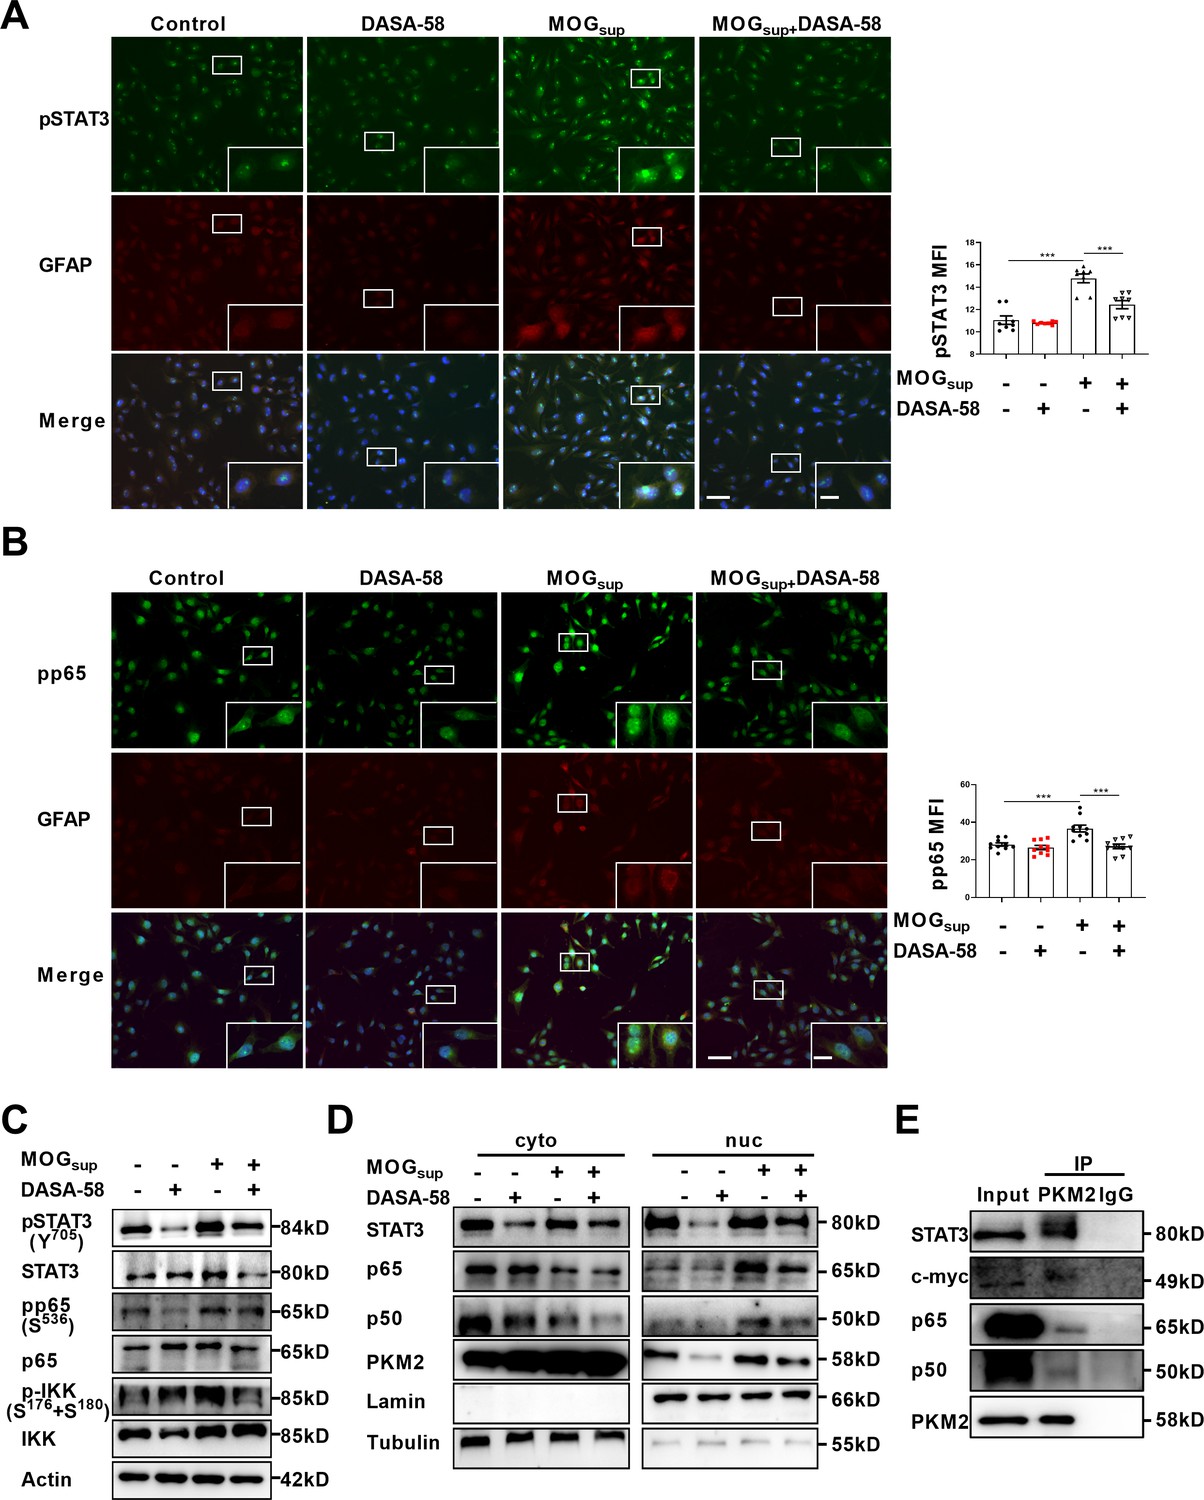
PKM2 interacted with STAT3 and NF-κB and promoted their activation in astrocytes.
(A–B) Immunofluorescence staining of phospho-STAT3 (A) or phospho-p65 (B) with GFAP in astrocytes. Primary astrocytes were pretreated with 50 μM DASA-58 for 30 min and stimulated with MOGsup for 12 hr. Scale bar: 100 μm. Scale bar in enlarged image: 20 μm. (C) Western blotting analysis showed that DASA-58 inhibited the activation of NF-κB and STAT3 induced by MOGsup stimulation. (D) Nuclear-cytoplasmic protein extraction analysis showed cytoplasmic and nuclear protein levels STAT3 and p50/p65 upon DASA-58 treatment. (E) Immunoprecipitation demonstrated the interaction between PKM2 and STAT3, c-myc and p50/p65 subunits of NF-κB in primary astrocyte. Data are represented as mean ± SEM, one-way ANOVA. **p<0.01; ***p<0.001. SEM, standard error of the mean.
-
Figure 3—source data 1
Source data for Figure 3A and B.
- https://cdn.elifesciences.org/articles/98181/elife-98181-fig3-data1-v1.xlsx
-
Figure 3—source data 2
Uncropped and labeled gels for Figure 3C.
- https://cdn.elifesciences.org/articles/98181/elife-98181-fig3-data2-v1.pdf
-
Figure 3—source data 3
Raw unedited gels for Figure 3C.
- https://cdn.elifesciences.org/articles/98181/elife-98181-fig3-data3-v1.zip
-
Figure 3—source data 4
Uncropped and labeled gels for Figure 3D.
- https://cdn.elifesciences.org/articles/98181/elife-98181-fig3-data4-v1.pdf
-
Figure 3—source data 5
Raw unedited gels for Figure 3D.
- https://cdn.elifesciences.org/articles/98181/elife-98181-fig3-data5-v1.zip
-
Figure 3—source data 6
Uncropped and labeled gels for Figure 3E.
- https://cdn.elifesciences.org/articles/98181/elife-98181-fig3-data6-v1.pdf
-
Figure 3—source data 7
Raw unedited gels for Figure 3E.
- https://cdn.elifesciences.org/articles/98181/elife-98181-fig3-data7-v1.zip
Figure 3—figure supplement 1
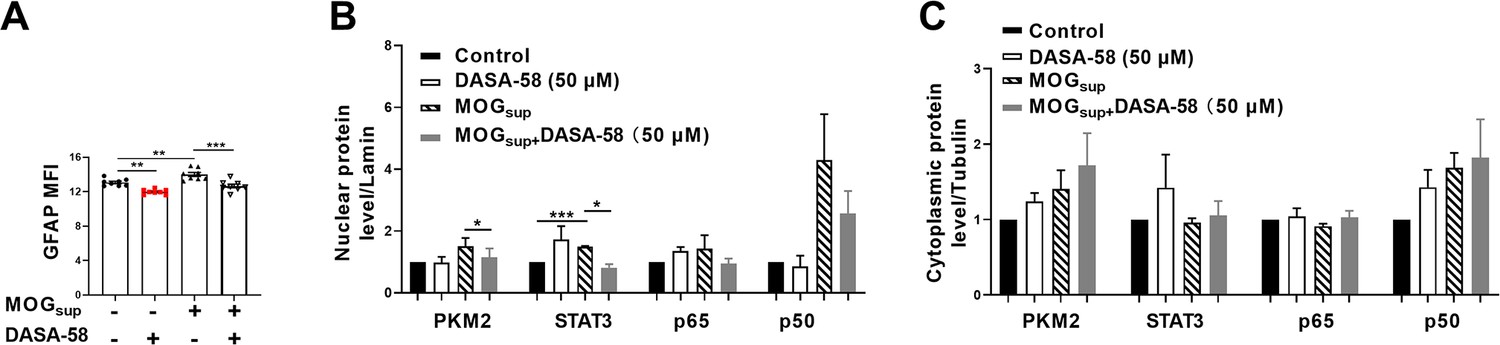
Quantification results of GFAP and cyto-nuclear protein levels in astrocytes treated with MOGsup or MOGsup pretreated with DASA-58.
(A) MFI analysis of GFAP in different groups. Primary astrocytes were pretreated with 50 μM DASA-58 for 30 min and stimulated with MOGsup for 12 hr. (B) Quantification of nuclear protein levels of PKM2, p50, p65, and STAT3 in different groups. The nuclear levels of the indicated proteins were normalized to lamin. (C) Quantification of cytoplasmic protein levels of PKM2, p50, p65, and STAT3 in different groups. The cytoplasmic levels of the indicated proteins were normalized to tubulin. Data are represented as mean ± SEM, one-way ANOVA, *p<0.05; **p<0.01; ***p<0.001.
-
Figure 3—figure supplement 1—source data 1
Source data for Figure 3—figure supplement 1.
- https://cdn.elifesciences.org/articles/98181/elife-98181-fig3-figsupp1-data1-v1.xlsx
Figure 4 with 1 supplement
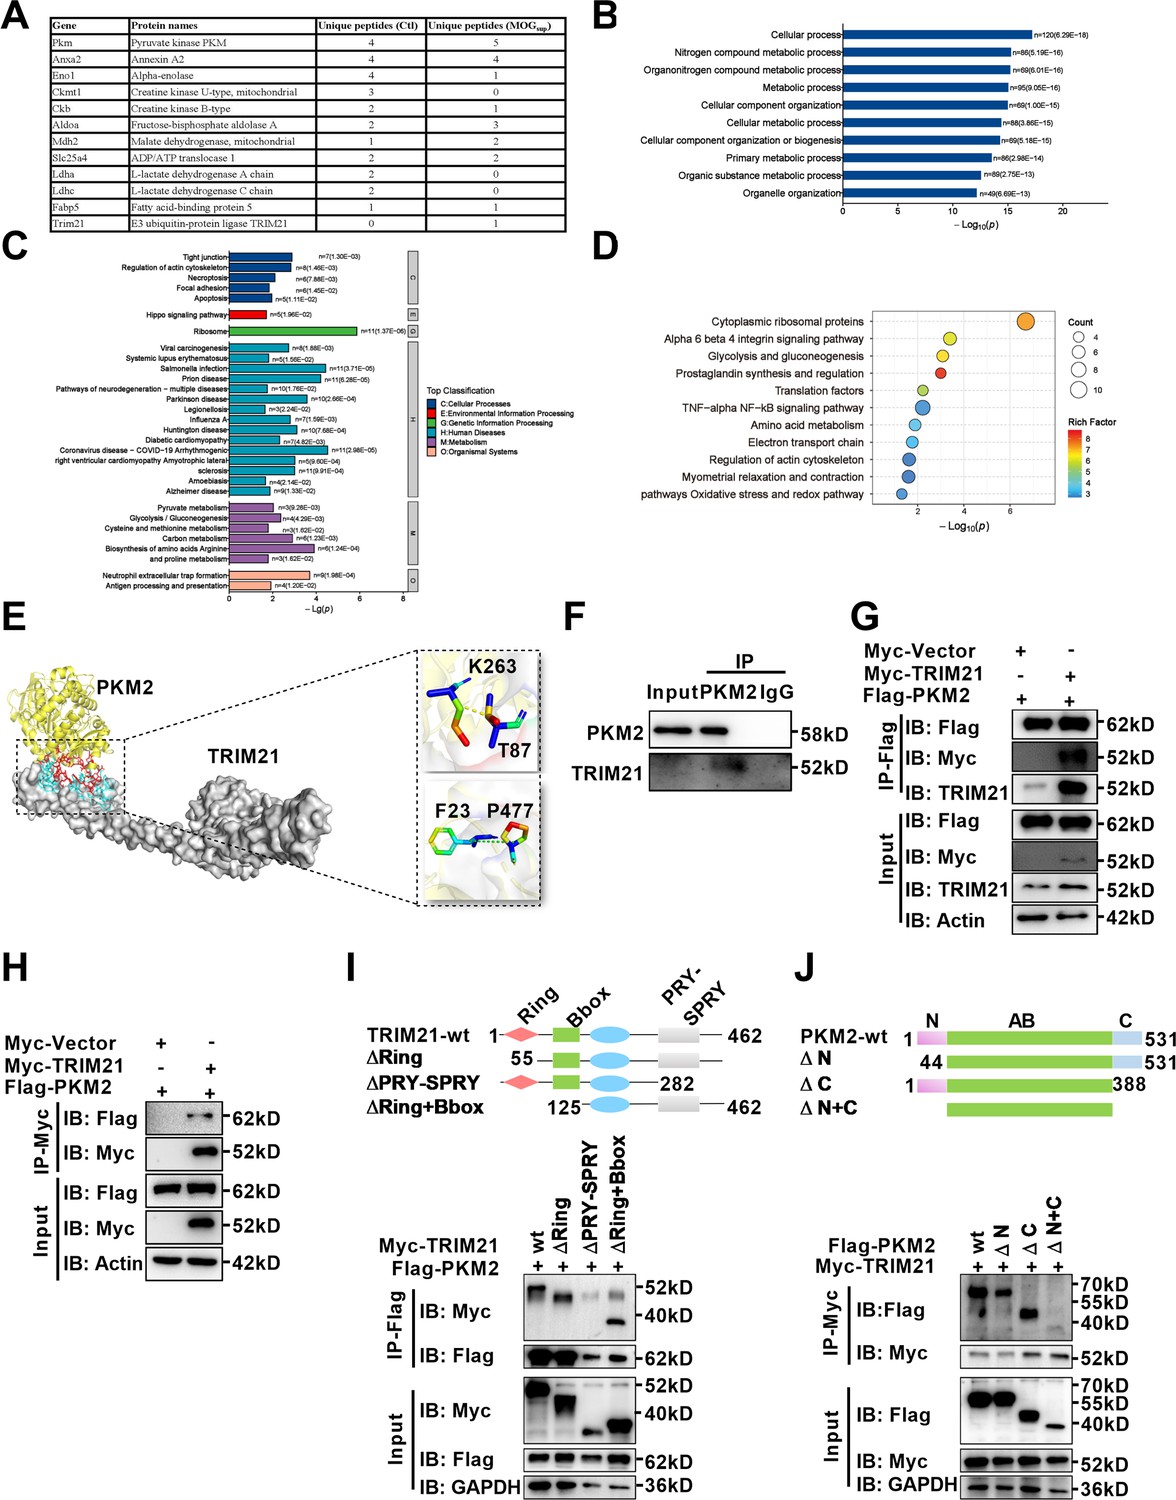
Identification of interaction between E3 ligase TRIM21 and PKM2 in astrocytes.
(A) Mass spectrometry (MS) showed the list of metabolic-related proteins that potentially interact with PKM2 in unstimulated (Ctl) and MOGsup-stimulated primary astrocytes. TRIM21 was identified to interact with PKM2. (B–D) Biological process of GO term (B), KEGG pathway (C) and Wikipathway (D) analysis of proteins identified by MS. (E) Interaction between PKM2 and TRIM21 was predicted with molecular docking and showed by PyMol. The hydrogen bonds were formed between Phe23, Thr87 of TRIM21 and Pro477, Lys 263 of PKM2. (F) Immunoprecipitation showed the interaction between endogenous PKM2 and TRIM21 in primary astrocyte. (G–H) Primary astrocytes were transfected with Myc-tagged TRIM21 and Flag-tagged PKM2, immunoprecipitation with anti-Flag (G) or anti-Myc (H) showed the exogenous binding between PKM2 and TRIM21 in astrocytes. (I) Full-length TRIM21 and a series of TRIM21 mutants with deletion (Δ) of various domains (top panel). 293 T cells were co-transfected with Flag-PKM2 and WT Myc-TRIM21 or their truncation mutants for 48 h. Immunoprecipitation was performed. (J) Full-length PKM2 and a series of PKM2 mutants with deletion (Δ) of various domains (top panel). 293 T cells were co-transfected with Myc-TRIM21 and WT Flag-PKM2 or their truncation mutants for 48 hr. Immunoprecipitation was performed.
-
Figure 4—source data 1
Uncropped and labeled gels for Figure 4F.
- https://cdn.elifesciences.org/articles/98181/elife-98181-fig4-data1-v1.pdf
-
Figure 4—source data 2
Raw unedited gels for Figure 4F.
- https://cdn.elifesciences.org/articles/98181/elife-98181-fig4-data2-v1.zip
-
Figure 4—source data 3
Uncropped and labeled gels for Figure 4G.
- https://cdn.elifesciences.org/articles/98181/elife-98181-fig4-data3-v1.pdf
-
Figure 4—source data 4
Raw unedited gels for Figure 4G.
- https://cdn.elifesciences.org/articles/98181/elife-98181-fig4-data4-v1.zip
-
Figure 4—source data 5
Uncropped and labeled gels for Figure 4H.
- https://cdn.elifesciences.org/articles/98181/elife-98181-fig4-data5-v1.pdf
-
Figure 4—source data 6
Raw unedited gels for Figure 4H.
- https://cdn.elifesciences.org/articles/98181/elife-98181-fig4-data6-v1.zip
-
Figure 4—source data 7
Uncropped and labeled gels for Figure 4I.
- https://cdn.elifesciences.org/articles/98181/elife-98181-fig4-data7-v1.pdf
-
Figure 4—source data 8
Raw unedited gels for Figure 4I.
- https://cdn.elifesciences.org/articles/98181/elife-98181-fig4-data8-v1.zip
-
Figure 4—source data 9
Uncropped and labeled gels for Figure 4J.
- https://cdn.elifesciences.org/articles/98181/elife-98181-fig4-data9-v1.pdf
-
Figure 4—source data 10
Raw unedited gels for Figure 4J.
- https://cdn.elifesciences.org/articles/98181/elife-98181-fig4-data10-v1.zip
Figure 4—figure supplement 1
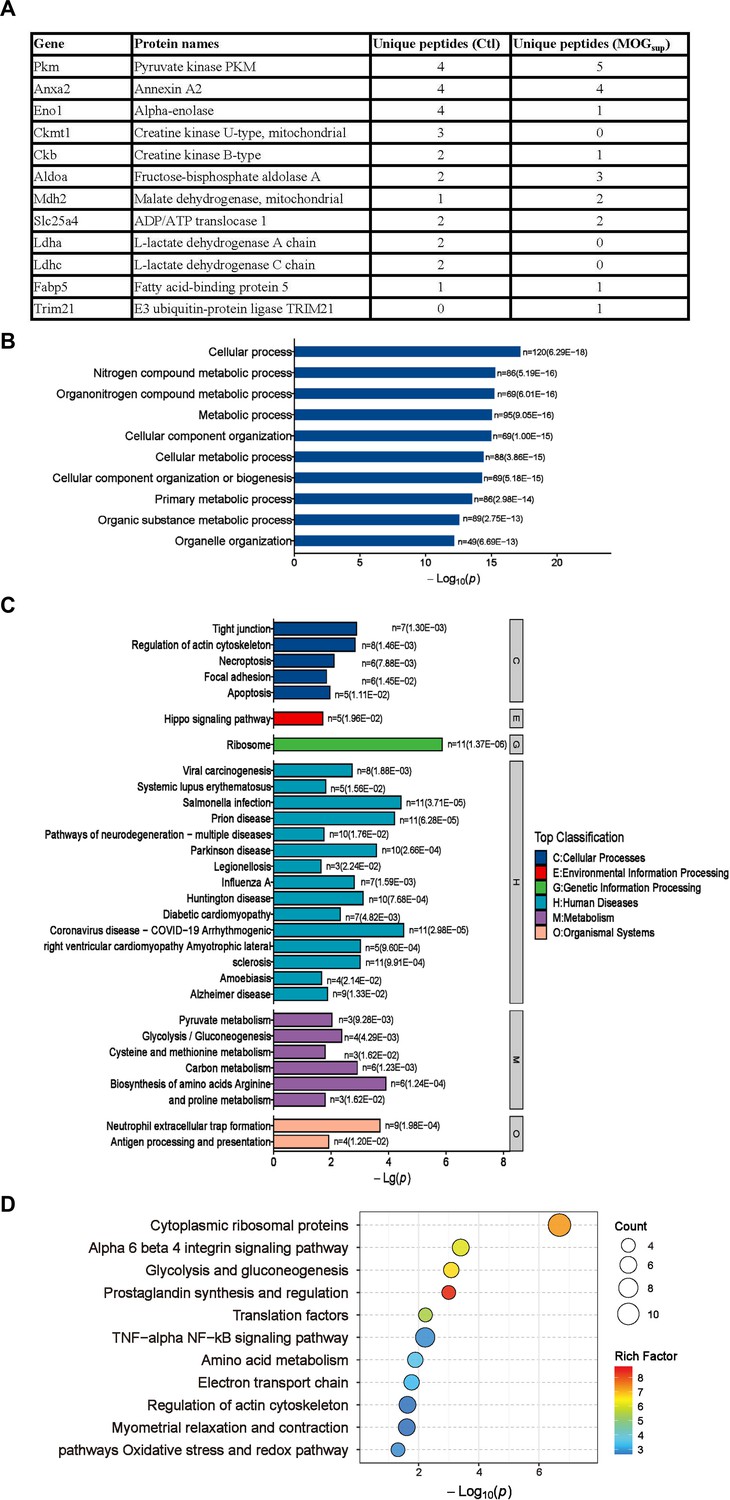
Mass spectrometry results of PKM2-interacting proteins in astrocytes.
(A) Mass spectrometry (MS) showed the list of metabolic-related proteins that potentially interact with PKM2 in unstimulated (Ctl) and MOGsup-stimulated primary astrocytes. TRIM21 was identified to interact with PKM2. (B–D) Biological process of GO term (B), KEGG pathway (C) and Wikipathway (D) analysis of proteins identified by MS.
Figure 5
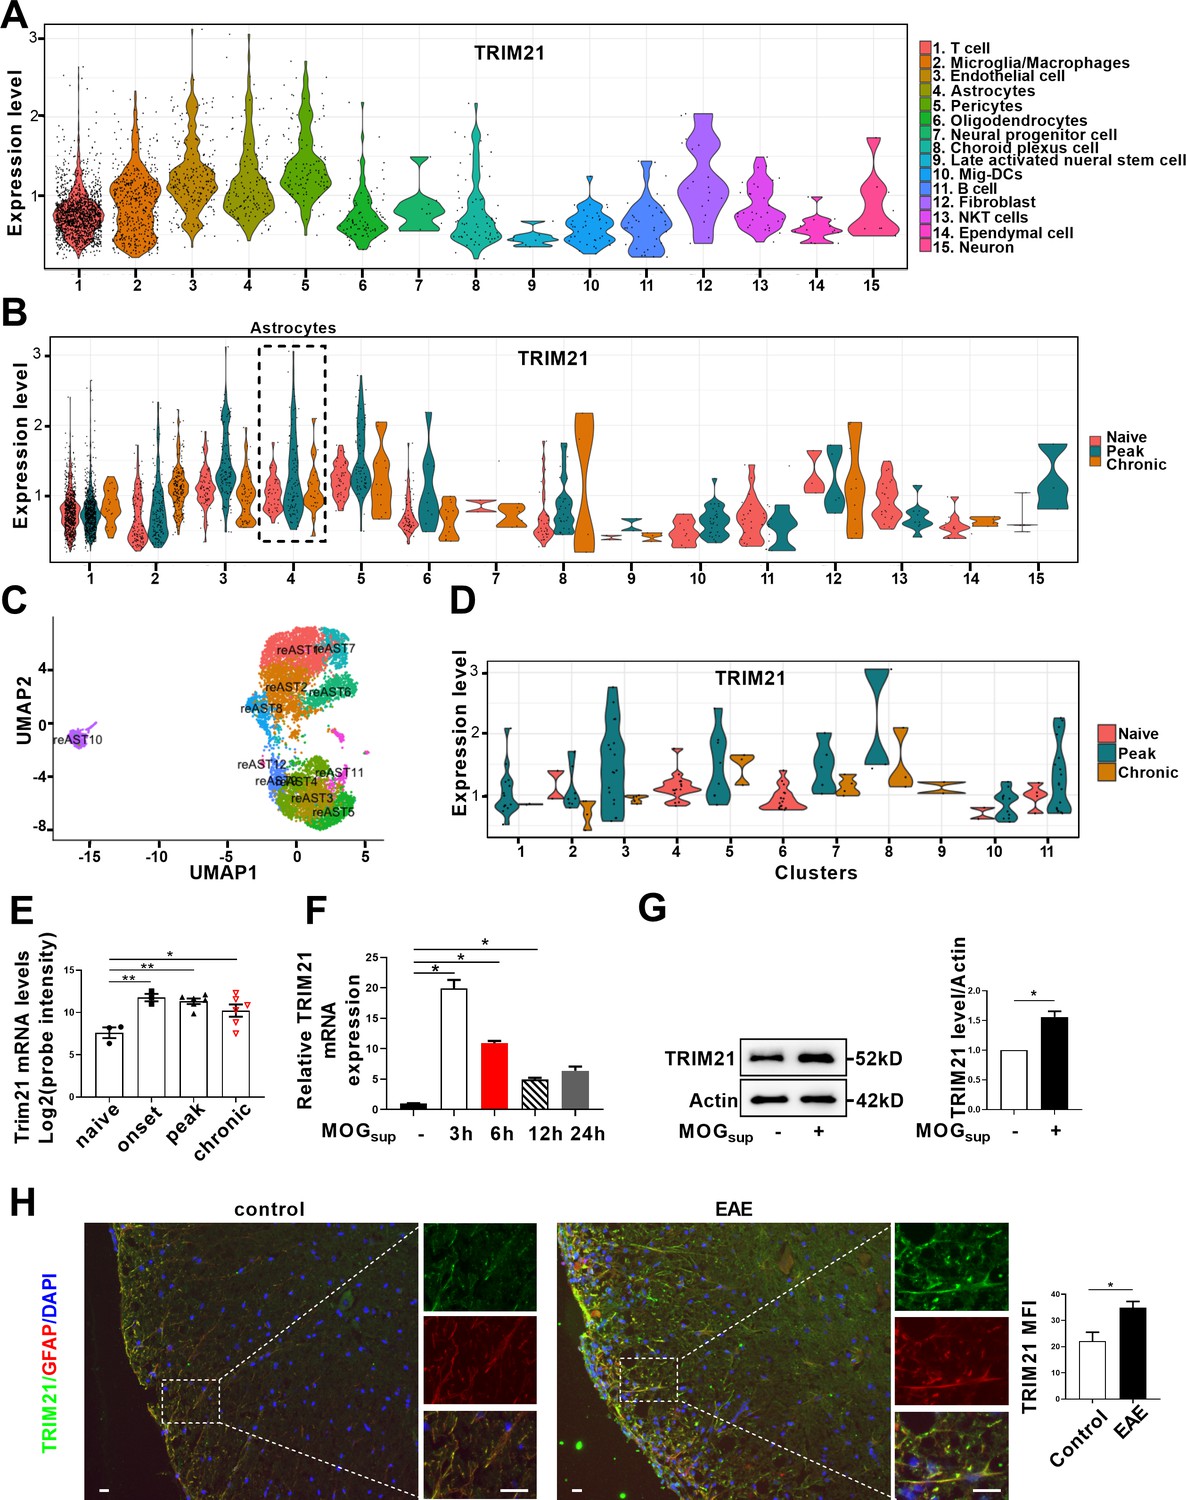
TRIM21 expression is upregulated in astrocytes of EAE mice.
(A–D) Single-cell RNA-seq profiles from naive and EAE mice (peak and chronic phase) CNS tissues. Naive (n=2); peak (dpi 14–24, n=3); chronic (dpi 21–26, n=2). (A) Violin plots displaying the expression of TRIM21 across the cell types identified. (B) Violin plots displaying the expression of TRIM21 in different phases of EAE and naive mice across the cell types identified. Expression of TRIM21 was shown to be elevated in astrocytes of EAE mice (peak and chronic) compared with naive mice. (C) UMAP representation of 12 clusters generated from sub-clustering of astrocytes. (D) Violin plots displaying the expression of TRIM21 at peak, chronic phases from EAE and naive mice in subclusters of astrocytes. (E) Analysis of TRIM21 mRNA expression in astrocytes from spinal cord during three stages (onset, peak, and chronic) of EAE and naive mice from GEO dataset GSE136358 (one-way ANOVA, *p<0.05; **p<0.01). (F) Primary astrocytes were treated with or without MOGsup for different time points. Analysis of TRIM21 expression by qPCR. (G) Western blotting analysis of TRIM21 protein expression in non-treated or MOGsup-treated astrocytes. The right panel shows the quantification of TRIM21 expression normalized to β-actin loading control (Paired t test, *p<0.05). (H) Immunofluorescence staining showed the upregulated expression of TRIM21 in astrocytes (marker: GFAP) of EAE mice (Unpaired t test, *p<0.05). Scale bar: 20 μm. Data are represented as mean ± SEM.
-
Figure 5—source data 1
Source data for Figure 5E–H.
- https://cdn.elifesciences.org/articles/98181/elife-98181-fig5-data1-v1.xlsx
-
Figure 5—source data 2
Uncropped and labeled gels for Figure 5G.
- https://cdn.elifesciences.org/articles/98181/elife-98181-fig5-data2-v1.pdf
-
Figure 5—source data 3
Raw unedited gels for Figure 5G.
- https://cdn.elifesciences.org/articles/98181/elife-98181-fig5-data3-v1.zip
Figure 6 with 1 supplement
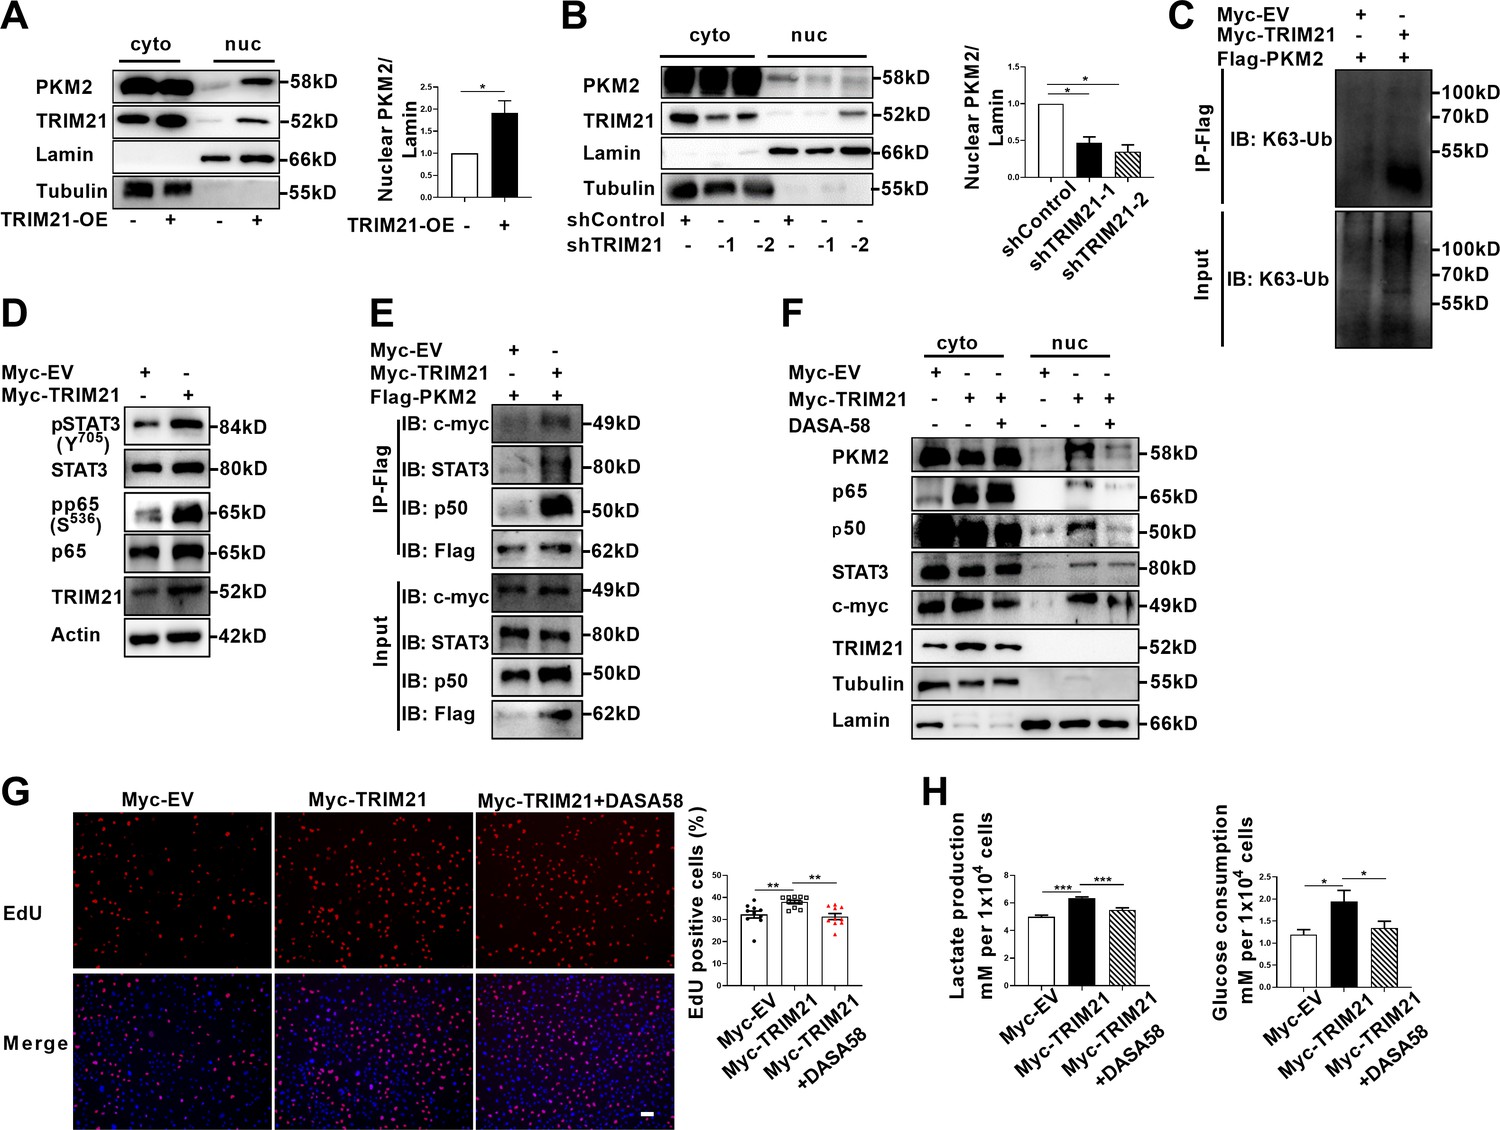
TRIM21-induced nuclear transport of PKM2 promoted glycolysis and proliferation of astrocytes.
(A) Overexpression of TRIM21 promoted nuclear translocation of PKM2. The right panel shows the quantification of nuclear PKM2 expression level normalized to nuclear lamin level (Paired t test, *p<0.05). (B) TRIM21 was silenced in primary astrocytes using two independent short hairpin RNAs. Nuclear-cytoplasmic fraction analysis showed that knockdown of TRIM21 decreased nuclear ratio of PKM2. The right panel shows the quantification of nuclear PKM2 expression level normalized to nuclear lamin level (one-way ANOVA, *p<0.05). (C) Immunoprecipitation showed that TRIM21 promoted the K63-linked ubiquitination of PKM2. (D) Western blotting analysis of STAT3 and NF-κB activation in control or TRIM21-overexpressed astrocytes. (E) Immunoprecipitation showed that TRIM21 promoted the interaction between PKM2 and its interacting proteins c-myc, STAT3, and p50. (F) Prevention of PKM2 nuclear import with DASA-58 (50 μM) reduced the nuclear retention of NF-κB subunits and STAT3 in TRIM21-overexpressed astrocytes. (G) EdU analysis of cell proliferation in TRIM21-overexpressed, DASA-58-treated TRIM21-overexpressed cells and control astrocytes (one-way ANOVA, **p<0.01). Scale bar: 100 μm. (H) Glycolysis of astrocytes were measured in TRIM21-overexpressed, DASA-58 treated TRIM21-OE cells and control astrocytes (one-way ANOVA, *p<0.05; ***p<0.001). EV: empty vector. Data are represented as mean ± SEM.
-
Figure 6—source data 1
Source data for Figure 6A–B, G and H.
- https://cdn.elifesciences.org/articles/98181/elife-98181-fig6-data1-v1.xlsx
-
Figure 6—source data 2
Uncropped and labeled gels for Figure 6A.
- https://cdn.elifesciences.org/articles/98181/elife-98181-fig6-data2-v1.pdf
-
Figure 6—source data 3
Raw unedited gels for Figure 6A.
- https://cdn.elifesciences.org/articles/98181/elife-98181-fig6-data3-v1.zip
-
Figure 6—source data 4
Uncropped and labeled gels for Figure 6B.
- https://cdn.elifesciences.org/articles/98181/elife-98181-fig6-data4-v1.pdf
-
Figure 6—source data 5
Raw unedited gels for Figure 6B.
- https://cdn.elifesciences.org/articles/98181/elife-98181-fig6-data5-v1.zip
-
Figure 6—source data 6
Uncropped and labeled gels for Figure 6C.
- https://cdn.elifesciences.org/articles/98181/elife-98181-fig6-data6-v1.pdf
-
Figure 6—source data 7
Raw unedited gels for Figure 6C.
- https://cdn.elifesciences.org/articles/98181/elife-98181-fig6-data7-v1.zip
-
Figure 6—source data 8
Uncropped and labeled gels for Figure 6D.
- https://cdn.elifesciences.org/articles/98181/elife-98181-fig6-data8-v1.pdf
-
Figure 6—source data 9
Raw unedited gels for Figure 6D.
- https://cdn.elifesciences.org/articles/98181/elife-98181-fig6-data9-v1.zip
-
Figure 6—source data 10
Uncropped and labeled gels for Figure 6E.
- https://cdn.elifesciences.org/articles/98181/elife-98181-fig6-data10-v1.pdf
-
Figure 6—source data 11
Raw unedited gels for Figure 6E.
- https://cdn.elifesciences.org/articles/98181/elife-98181-fig6-data11-v1.zip
-
Figure 6—source data 12
Uncropped and labeled gels for Figure 6F.
- https://cdn.elifesciences.org/articles/98181/elife-98181-fig6-data12-v1.pdf
-
Figure 6—source data 13
Raw unedited gels for Figure 6F.
- https://cdn.elifesciences.org/articles/98181/elife-98181-fig6-data13-v1.zip
Figure 6—figure supplement 1
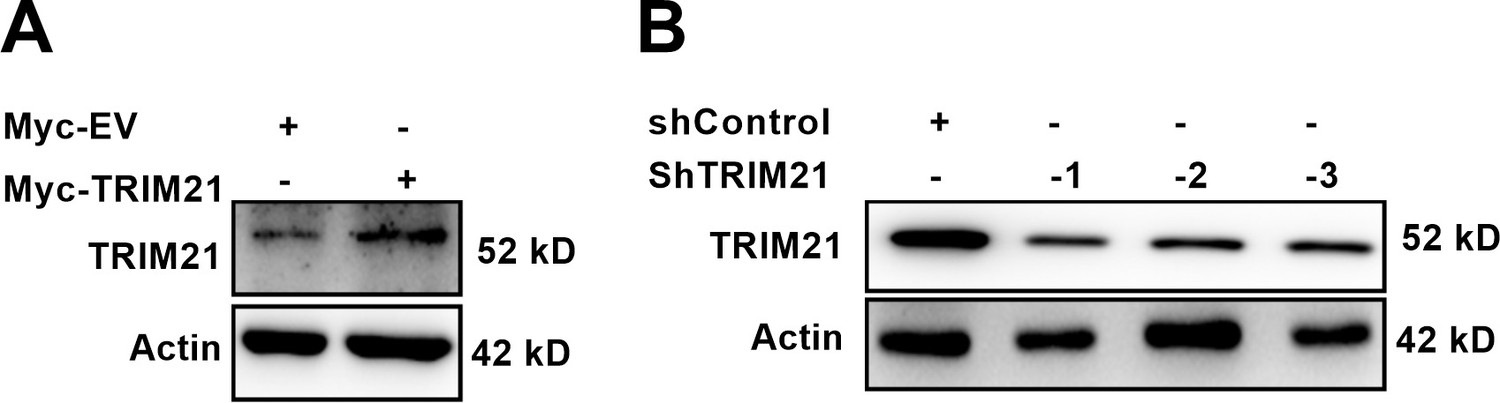
Verification of TRIM21 overexpression and knockdown efficiency.
(A) Overexpression of TRIM21 was verified by western blotting analysis. (B) Western blotting analysis of TRIM21 knockdown efficiency. Sh: short hairpin; EV: empty vector.
-
Figure 6—figure supplement 1—source data 1
Uncropped and labeled gels for Figure 6—figure supplement 1A.
- https://cdn.elifesciences.org/articles/98181/elife-98181-fig6-figsupp1-data1-v1.pdf
-
Figure 6—figure supplement 1—source data 2
Raw unedited gels for Figure 6—figure supplement 1A.
- https://cdn.elifesciences.org/articles/98181/elife-98181-fig6-figsupp1-data2-v1.zip
-
Figure 6—figure supplement 1—source data 3
Uncropped and labeled gels for Figure 6—figure supplement 1B.
- https://cdn.elifesciences.org/articles/98181/elife-98181-fig6-figsupp1-data3-v1.pdf
-
Figure 6—figure supplement 1—source data 4
Raw unedited gels for Figure 6—figure supplement 1B.
- https://cdn.elifesciences.org/articles/98181/elife-98181-fig6-figsupp1-data4-v1.zip
Figure 7 with 2 supplements
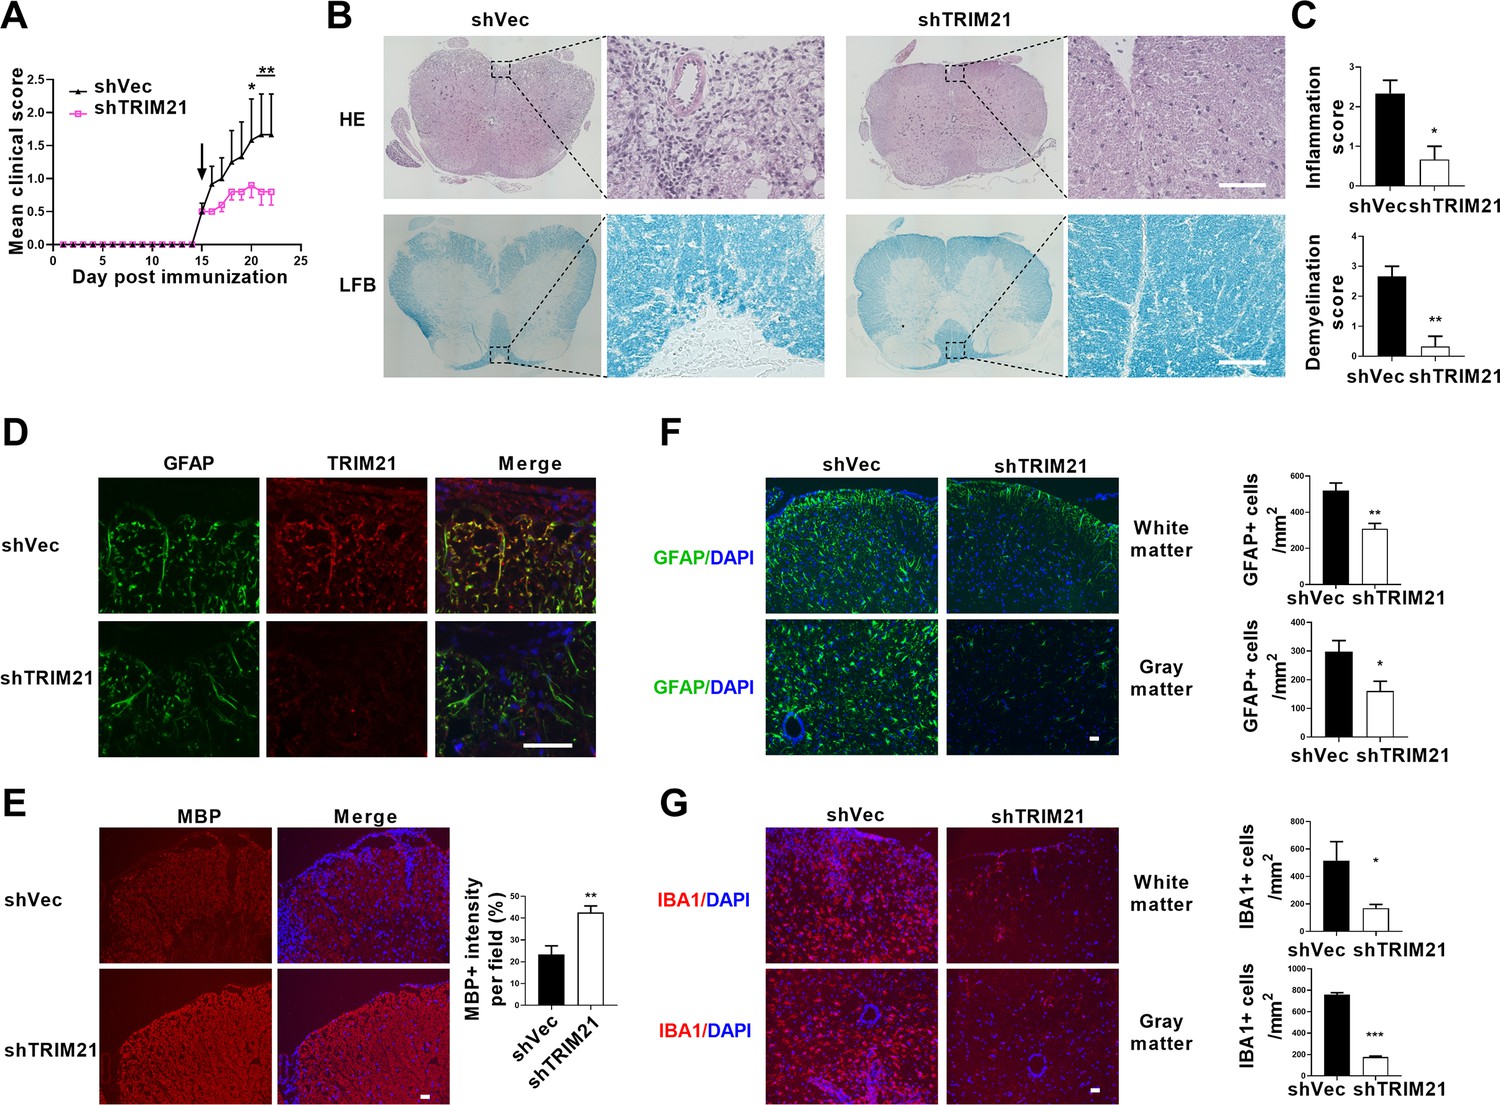
Intracerebroventricular injection of shTRIM21 ameliorates disease severity of Experimental Autoimmune Encephalomyelitis (EAE).
C57BL/6 mice were injected i.c.v with 1x10⁷ IU shTRIM21 or control lentivirus (shVec) 15 days p.i. (onset). Mice were sacrificed at day 22 p.i. and spinal cords were harvested. (A) Disease was scored daily on a 0–5 scale. N=5–6 mice in each group. (B) Spinal cord sections were stained for markers of inflammation by hematoxylin and eosin (H&E) and demyelination by Luxol fast blue (LFB), respectively. (C) Scoring of inflammation (H&E) and demyelination (LFB) on a 0–3 scale. (D) TRIM21 expression in spinal cord of mice from shVec and shTRIM21 group was measured by immunofluorescence. (E) Demyelination in each group was assessed by MBP staining. MBP intensity was measured in the white matter of the spinal cord using Image-Pro. (F–G) Immunostaining of GFAP (F) and IBA1 (G) on spinal cord sections of shVec and shTRIM21-treated EAE mice. White matter and gray matter are shown as representative images. Quantification of GFAP positive cells/mm2, IBA1 positive cells/mm2 in both the white matter and gray matter. The measured areas included 3–5 fields per group. i.c.v., intracerebroventricular; p.i., postimmunization. Scale bar: 50 μm. Data are represented as mean ± SEM. *p<0.05; **p<0.01; ***p<0.001, as determined by two-way ANOVA analysis (A) or unpaired Student’s t test (C, F–G).
-
Figure 7—source data 1
Source data for Figure 7A, C and E–G.
- https://cdn.elifesciences.org/articles/98181/elife-98181-fig7-data1-v1.xlsx
Figure 7—figure supplement 1
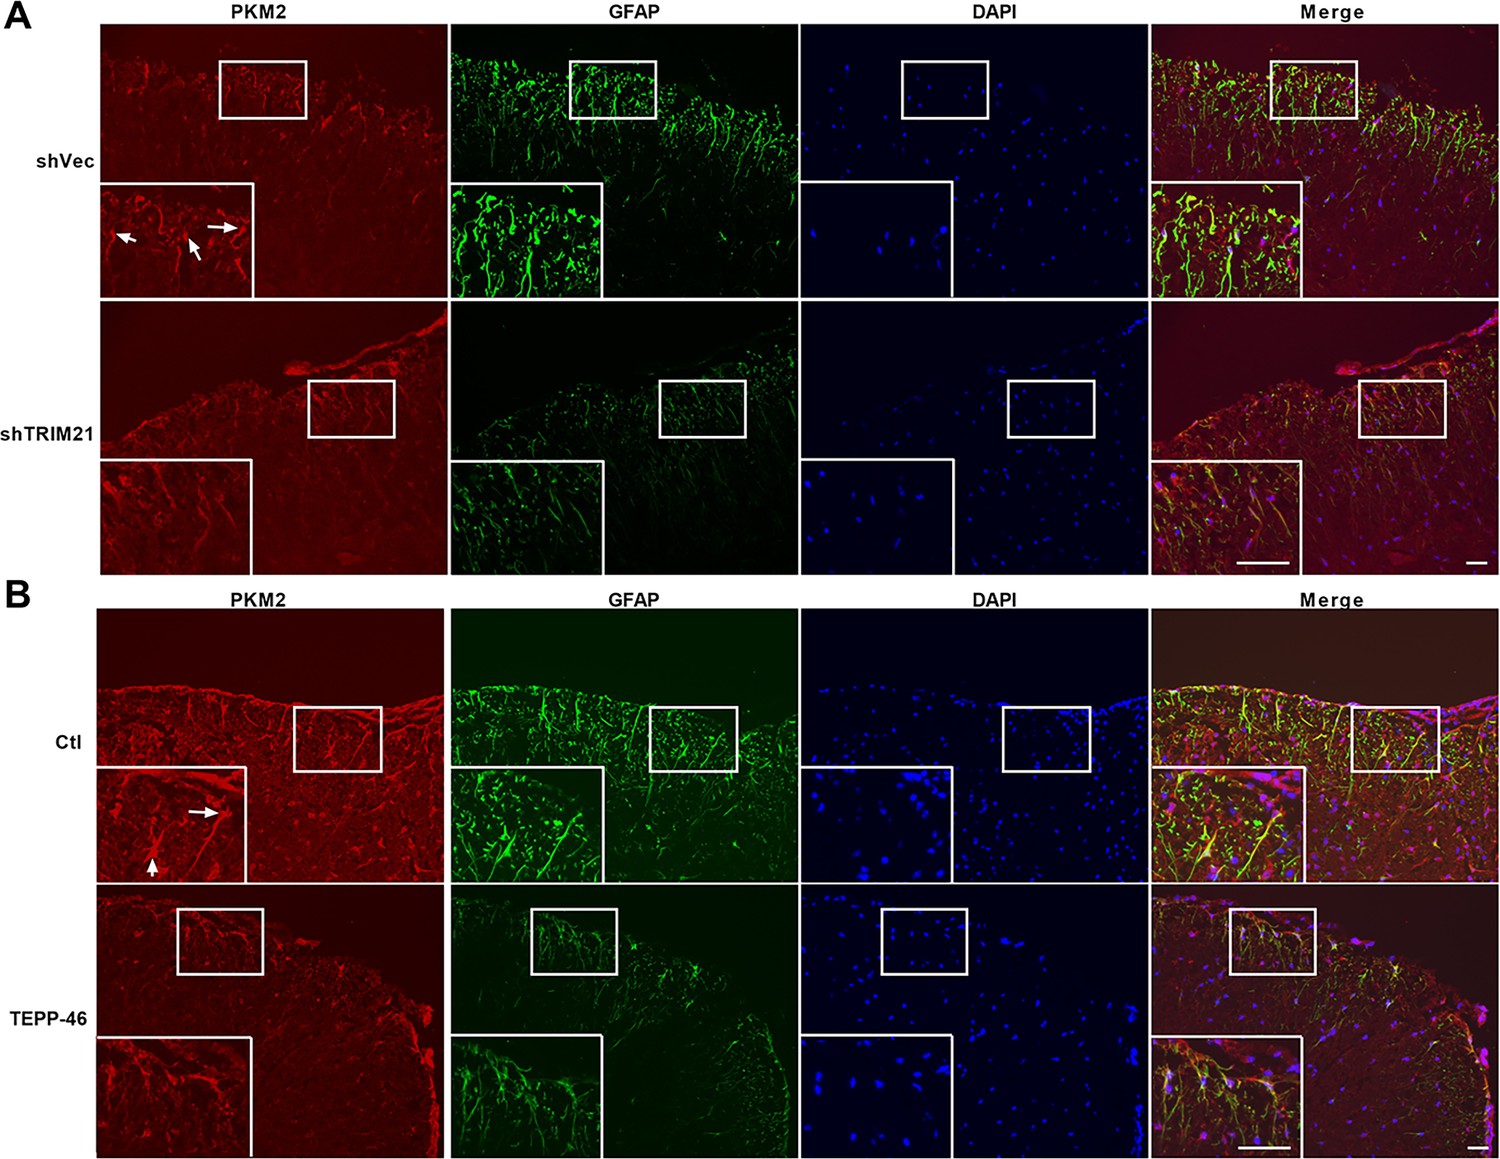
PKM2 expression and localization in shTRIM21-treated and TEPP-treated EAE mice.
(A) PKM2 expression in spinal cord of mice from shVec and shTRIM21-treated EAE mice was measured by immunofluorescence. (B) PKM2 expression in spinal cord of mice from TEPP-46- or vehicle-treated EAE mice was measured by immunofluorescence. White arrows indicate nuclear PKM2. DAPI (blue) was used as a nuclear staining. Scale bar: 50 μm.
Figure 7—figure supplement 2
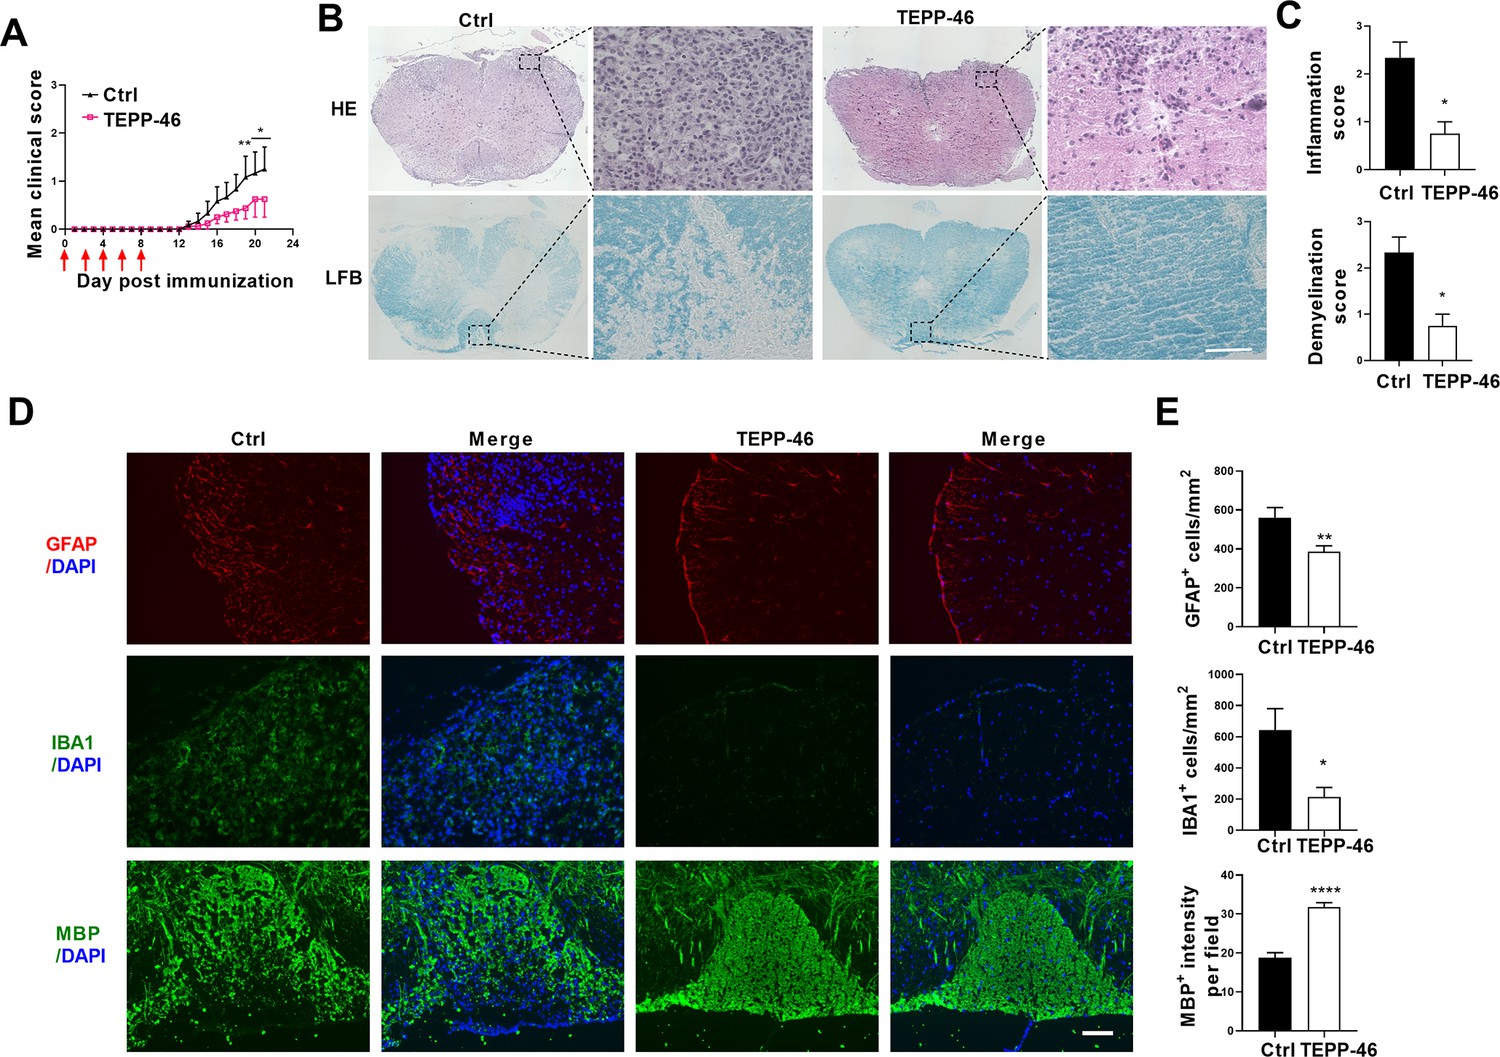
i.p. injection of TEPP-46 alleviated the development of Experimental Autoimmune Encephalomyelitis (EAE).
C57BL/6 mice were i.p injected with 200 μl vehicle or 50 mg/kg TEPP-46 dissolved in vehicle every other day from day 0 to day 8 p.i. Mice were sacrificed at day 21 p.i. and spinal cords were harvested. (A) Disease was scored daily on a 0–5 scale. N=6–8 mice in each group. (B) Spinal cord sections were stained for markers of inflammation by hematoxylin and eosin (H&E) and demyelination by Luxol fast blue (LFB), respectively. Scale bar: 50 μm. (C) Scoring of inflammation (H&E) and demyelination (LFB) on a 0–3 scale. (D) Immunostaining of GFAP, IBA1 and MBP on spinal cord sections of TEPP-46- or vehicle-treated EAE mice. (E) Quantification of GFAP positive cells/mm2, IBA1 positive cells/mm2 in the white matter of the spinal cord. MBP intensity was measured in the white matter of the spinal cord using Image-Pro. The measured areas included 3–5 fields per group. i.p., intraperitoneally; p.i., postimmunization; Scale bar: 100 μm. Data are represented as mean ± SEM. *p<0.05; **p<0.01; ***p<0.001, as determined by two-way ANOVA analysis (A) or unpaired Student’s t test (C, E).
-
Figure 7—figure supplement 2—source data 1
Source data for Figure 7—figure supplement 2A, C and E.
- https://cdn.elifesciences.org/articles/98181/elife-98181-fig7-figsupp2-data1-v1.xlsx
Figure 8
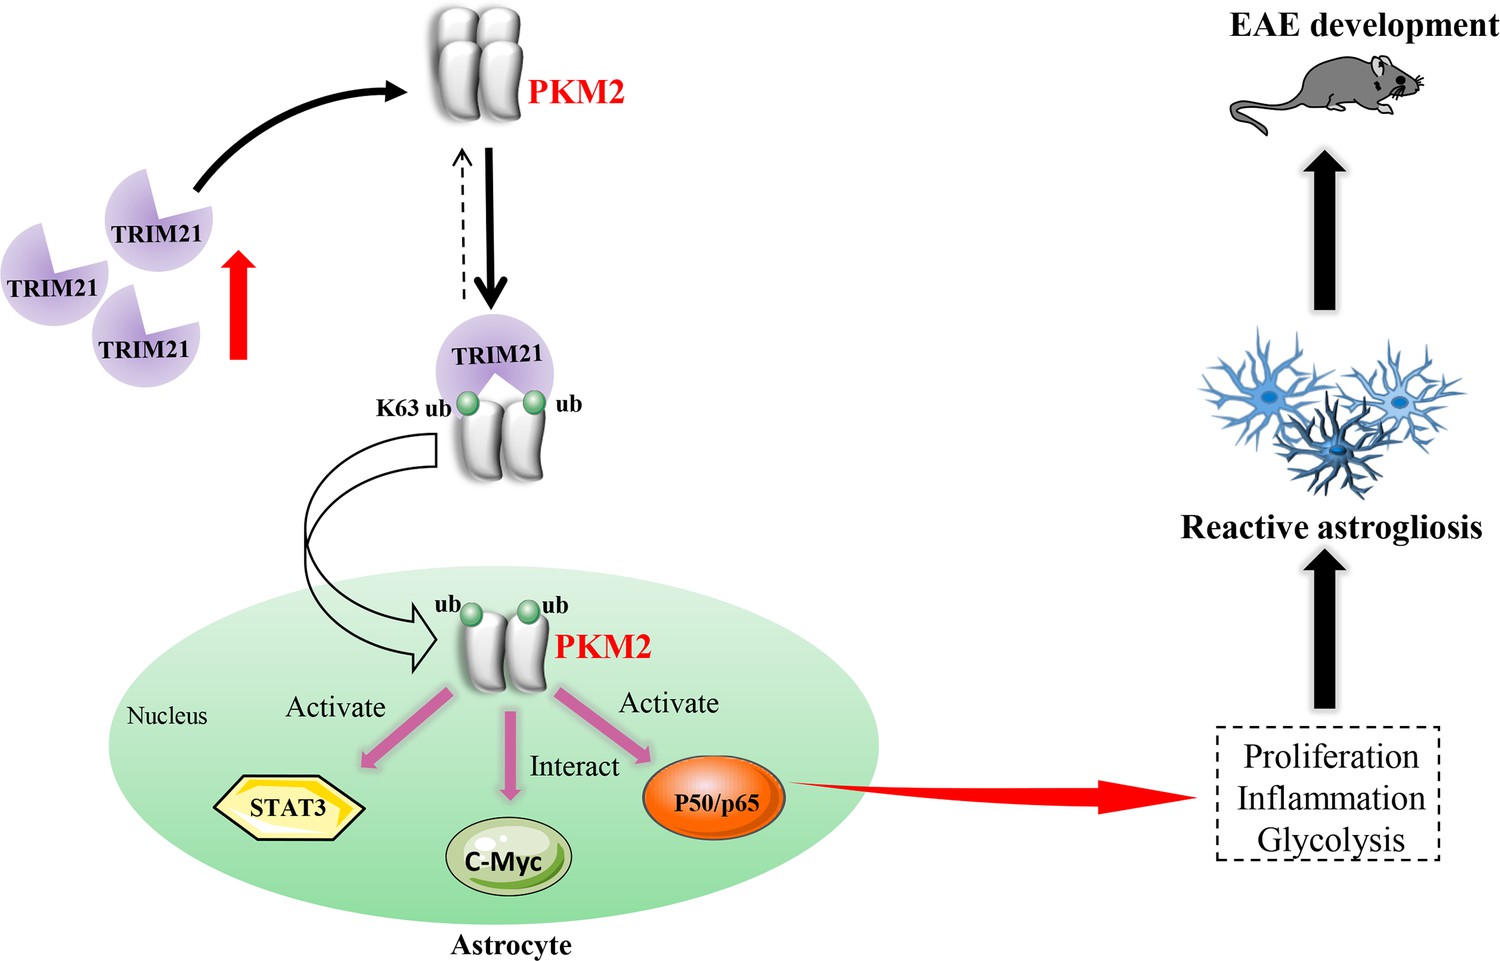
Schematic proposal of nuclear translocation of PKM2 in astrocytes of EAE.
In astrocyte of EAE mice, TRIM21 expression is upregulated. E3 ubiquitin ligase TRIM21 ubiquitylates PKM2 and promotes its nuclear translocation, nuclear PKM2 activated STAT3 and NF-κB pathways and interact with c-Myc to enhance glycolysis and proliferation in astrocytes. Thus, TRIM21-PKM2 pathway exerts a potential role in activating astrocytes and inducing EAE development.
Author response image 1

Upregulated expression of PKM2 in astrocytes following stimulation with TNF-α and IL-1β.
Primary astrocytes were stimulated with TNF-α and IL-1β (50 ng/mL) for 48 h and western blotting analysis were performed.
Author response image 2

MBP staining of the whole spinal cord in EAE mice from shVec and shTRIM21 group.
Scale bar: 100 μm. Demyelinated areas are marked with dashed lines.
Author response image 3

TRIM21 expression in control and MS patients based on published GEO database.
(A) The expression of TRIM21 in normal-appearing white matter in non-MS (Ctl) and different clinical subtypes of MS (RRMS, SPMS, PPMS) based on GSE214334 (one-way ANOVA). (B) The expression of TRIM21 from multiple sclerosis normal appearing white matter (NAWM) and control WM based on GSE83670. RRMS, relapsing--remitting MS; SPMS, secondary progressive MS; PPMS, primary progressive MS (unpaired Student's t test). Data are represented as the means ± SEM.
Author response image 4

TEPP-46 inhibited the nuclear transport of PKM2 in primary astrocytes.
Nuclear-cytoplasmic protein extraction analysis showed the nuclear and cytoplasmic changes of PKM2 in TEPP-46 treated astrocytes and MOGsup-stimulated astrocytes. Primary astrocytes were pretreated with 50 μM TEPP-46 for 30 min and stimulated with MOGsup for 24 h.
Author response image 5

CCK8 analysis of astrocyte proliferation.
Primary astrocytes were pretreated with 50 μM DASA-58 for 30 min before stimulation with MOGsup. Data are represented as mean ± SEM. ***P<0.001. SEM, standard error of the mean.
Additional files
-
MDAR checklist
- https://cdn.elifesciences.org/articles/98181/elife-98181-mdarchecklist1-v1.docx
-
Supplementary file 1
List of primers used in this study.
- https://cdn.elifesciences.org/articles/98181/elife-98181-supp1-v1.docx
Download links
A two-part list of links to download the article, or parts of the article, in various formats.
Downloads (link to download the article as PDF)
Open citations (links to open the citations from this article in various online reference manager services)
Cite this article (links to download the citations from this article in formats compatible with various reference manager tools)
Upregulated expression of ubiquitin ligase TRIM21 promotes PKM2 nuclear translocation and astrocyte activation in experimental autoimmune encephalomyelitis
eLife 13:RP98181.
https://doi.org/10.7554/eLife.98181.3


