Benchmarking reveals superiority of deep learning variant callers on bacterial nanopore sequence data
- Department of Microbiology and Immunology, The University of Melbourne, at the Peter Doherty Institute for Infection and Immunity, Australia
- Centre for Pathogen Genomics, The University of Melbourne, Australia
- Department of Infectious Diseases, The University of Melbourne, at the Peter Doherty Institute for Infection and Immunity, Australia
- Monash Infectious Diseases, Monash Health, Australia
Figures
Figure 1

Median alignment-based read identity (x-axis) for each sample (points) stratified by basecalling model (colours) and read type (y-axis).
The Qscore is the logarithmic transformation of the read identity, , where is the read identity.
Figure 2 with 5 supplements

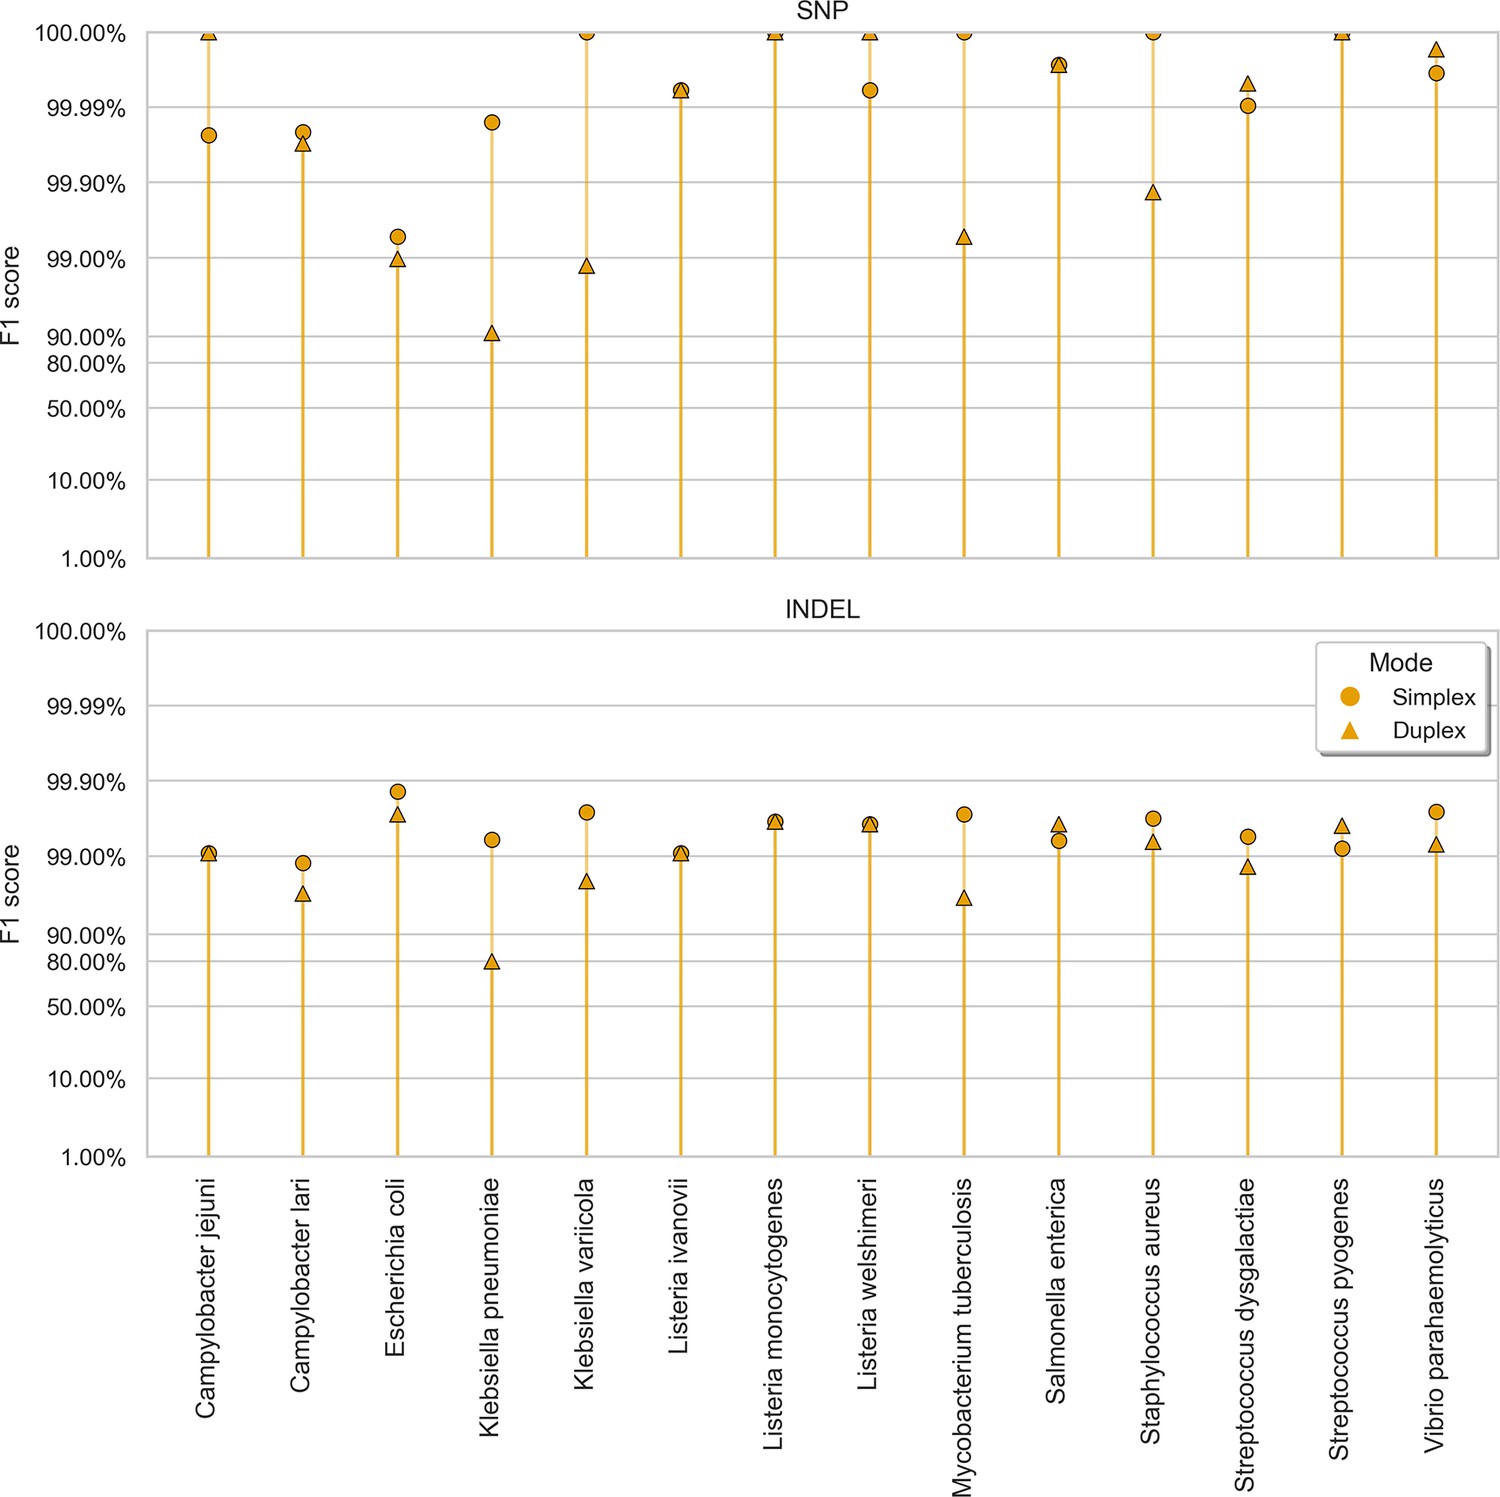
The highest F1 score for each sample (points), stratified by basecalling model (colours), variant type (rows), and read type (columns).
Illumina results (green) are included as a reference and do not have different basecalling models or read types. Note, Longshot does not provide indel calls.
Figure 2—figure supplement 1

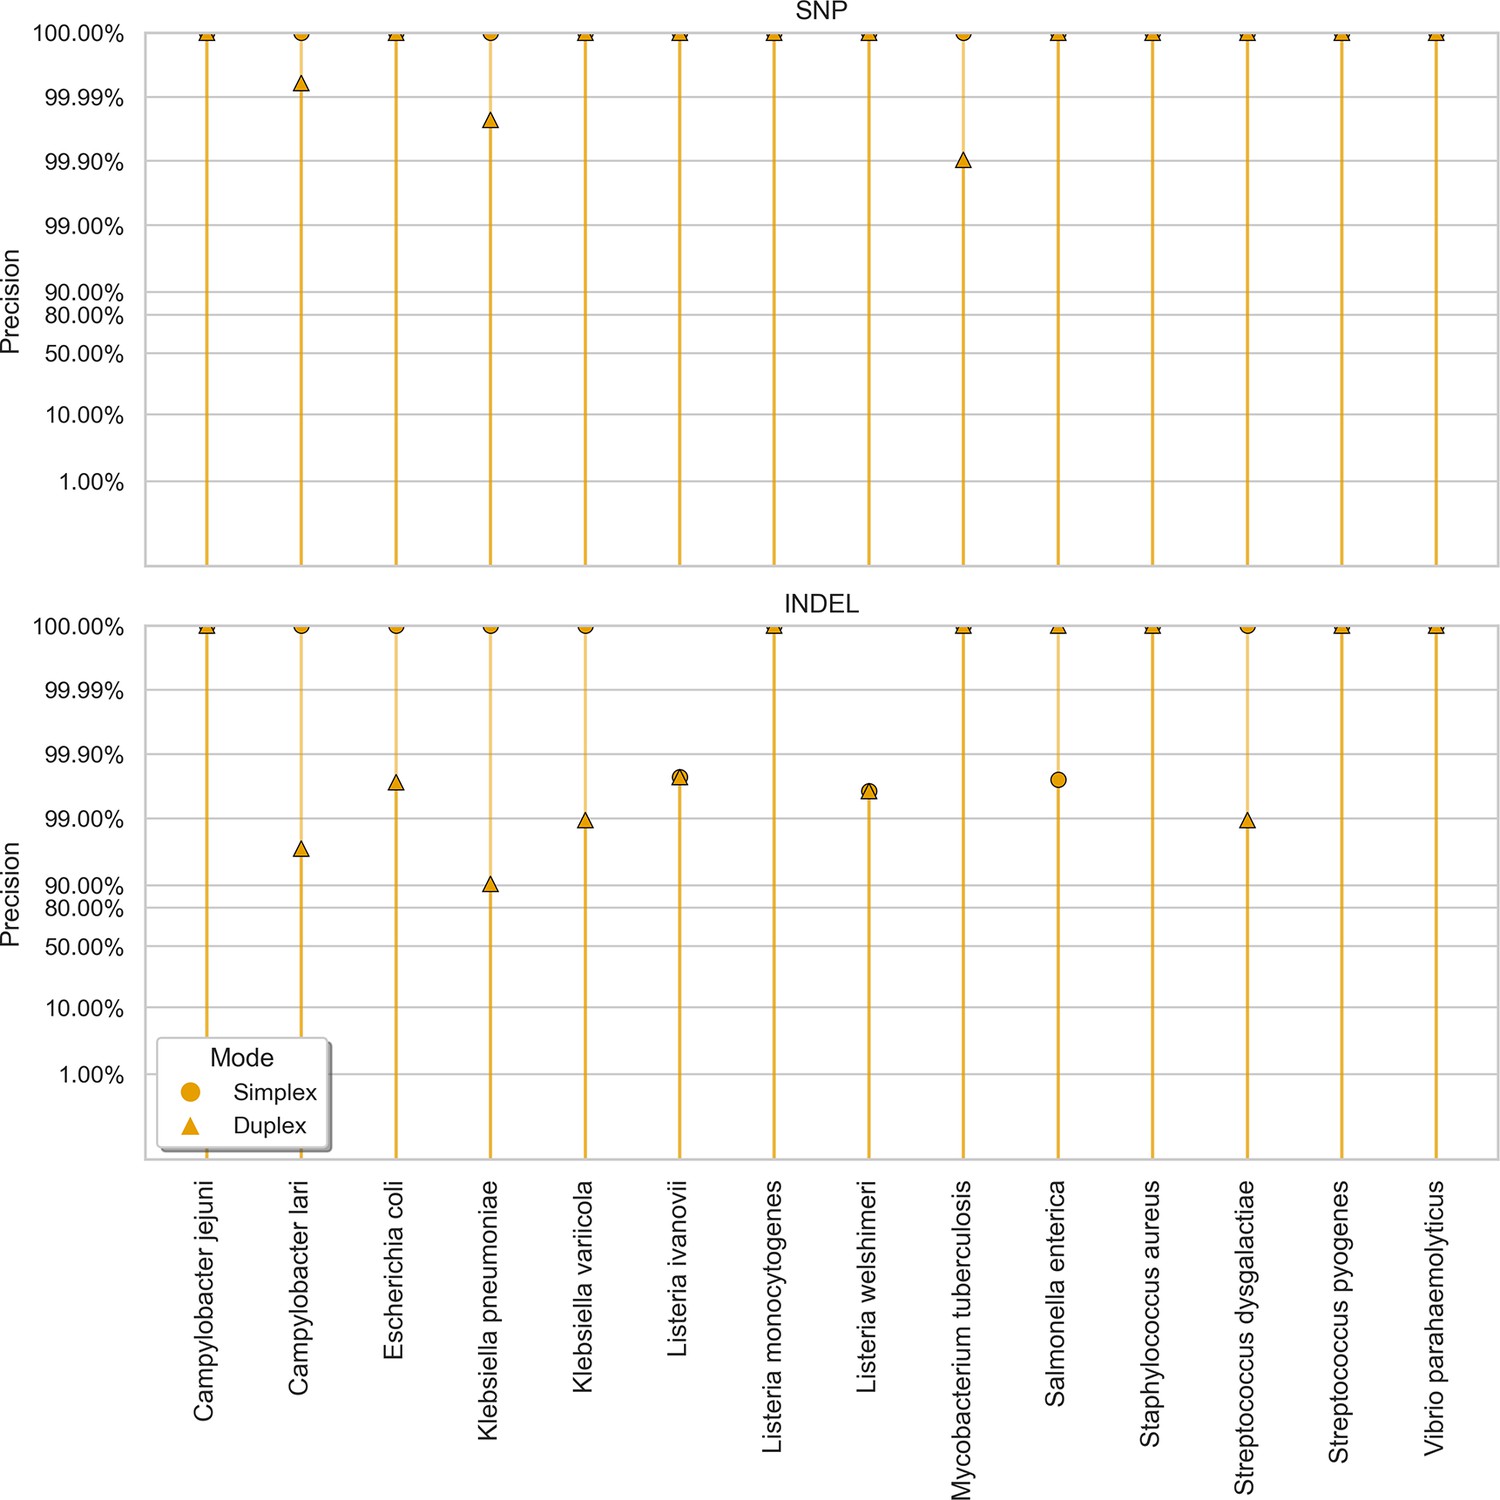
Precision at the highest F1 score for each sample (points), stratified by basecalling model (colours), variant type (rows), and read type (columns).
Illumina results (green) are included as a reference and do not have different basecalling models or read types. Note, Longshot does not provide indel calls.
Figure 2—figure supplement 2

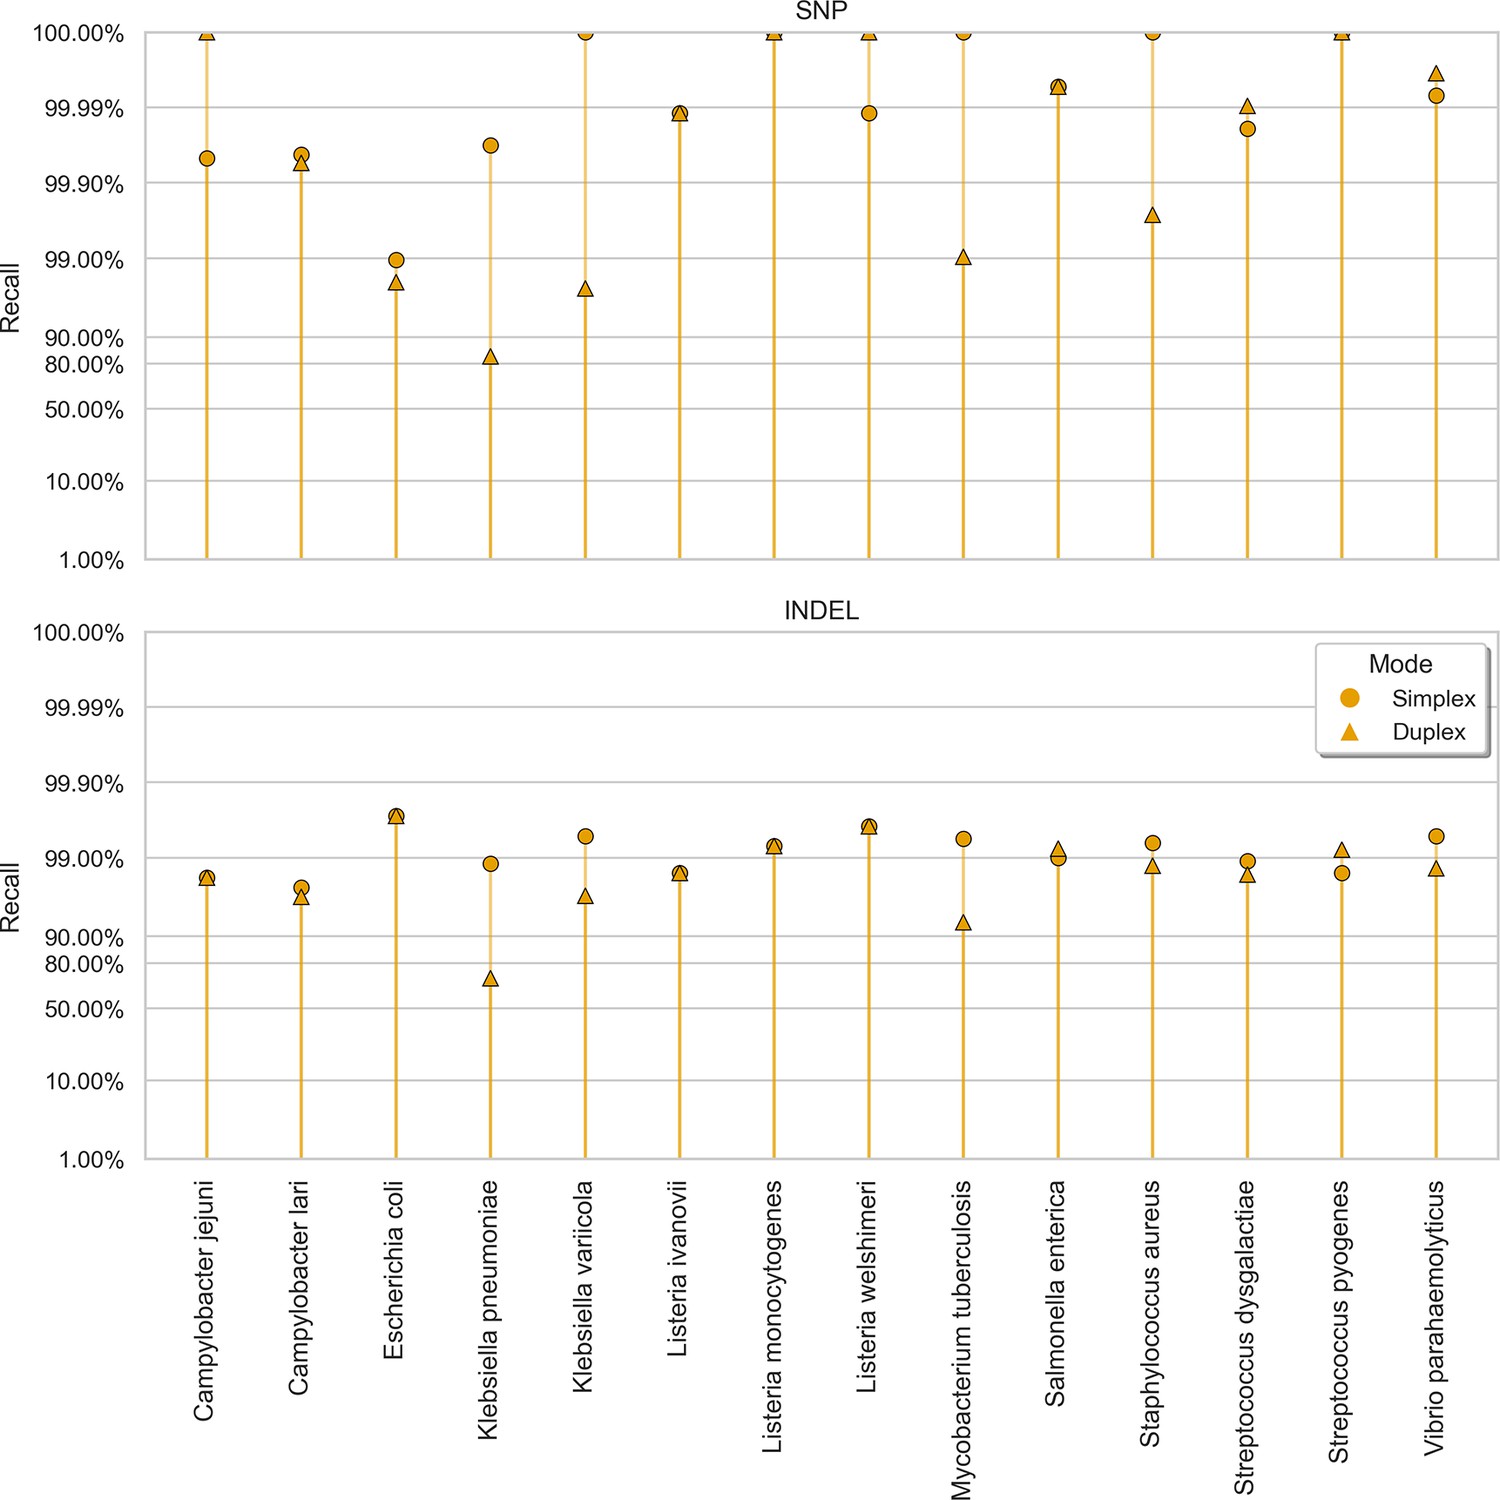
Recall at the highest F1 score for each sample (points), stratified by basecalling model (colours), variant type (rows), and read type (columns).
Illumina results (green) are included as a reference and do not have different basecalling models or read types. Note, Longshot does not provide indel calls.
Figure 2—figure supplement 3
Clair3 sup model F1 score (y-axis) at the highest F1 score for each sample (x-axis), stratified by variant type (rows), and read type (shapes).
Figure 2—figure supplement 4
Clair3 sup model precision (y-axis) at the highest F1 score for each sample (x-axis), stratified by variant type (rows), and read type (shapes).
Figure 2—figure supplement 5
Clair3 sup model recall (y-axis) at the highest F1 score for each sample (x-axis), stratified by variant type (rows), and read type (shapes).
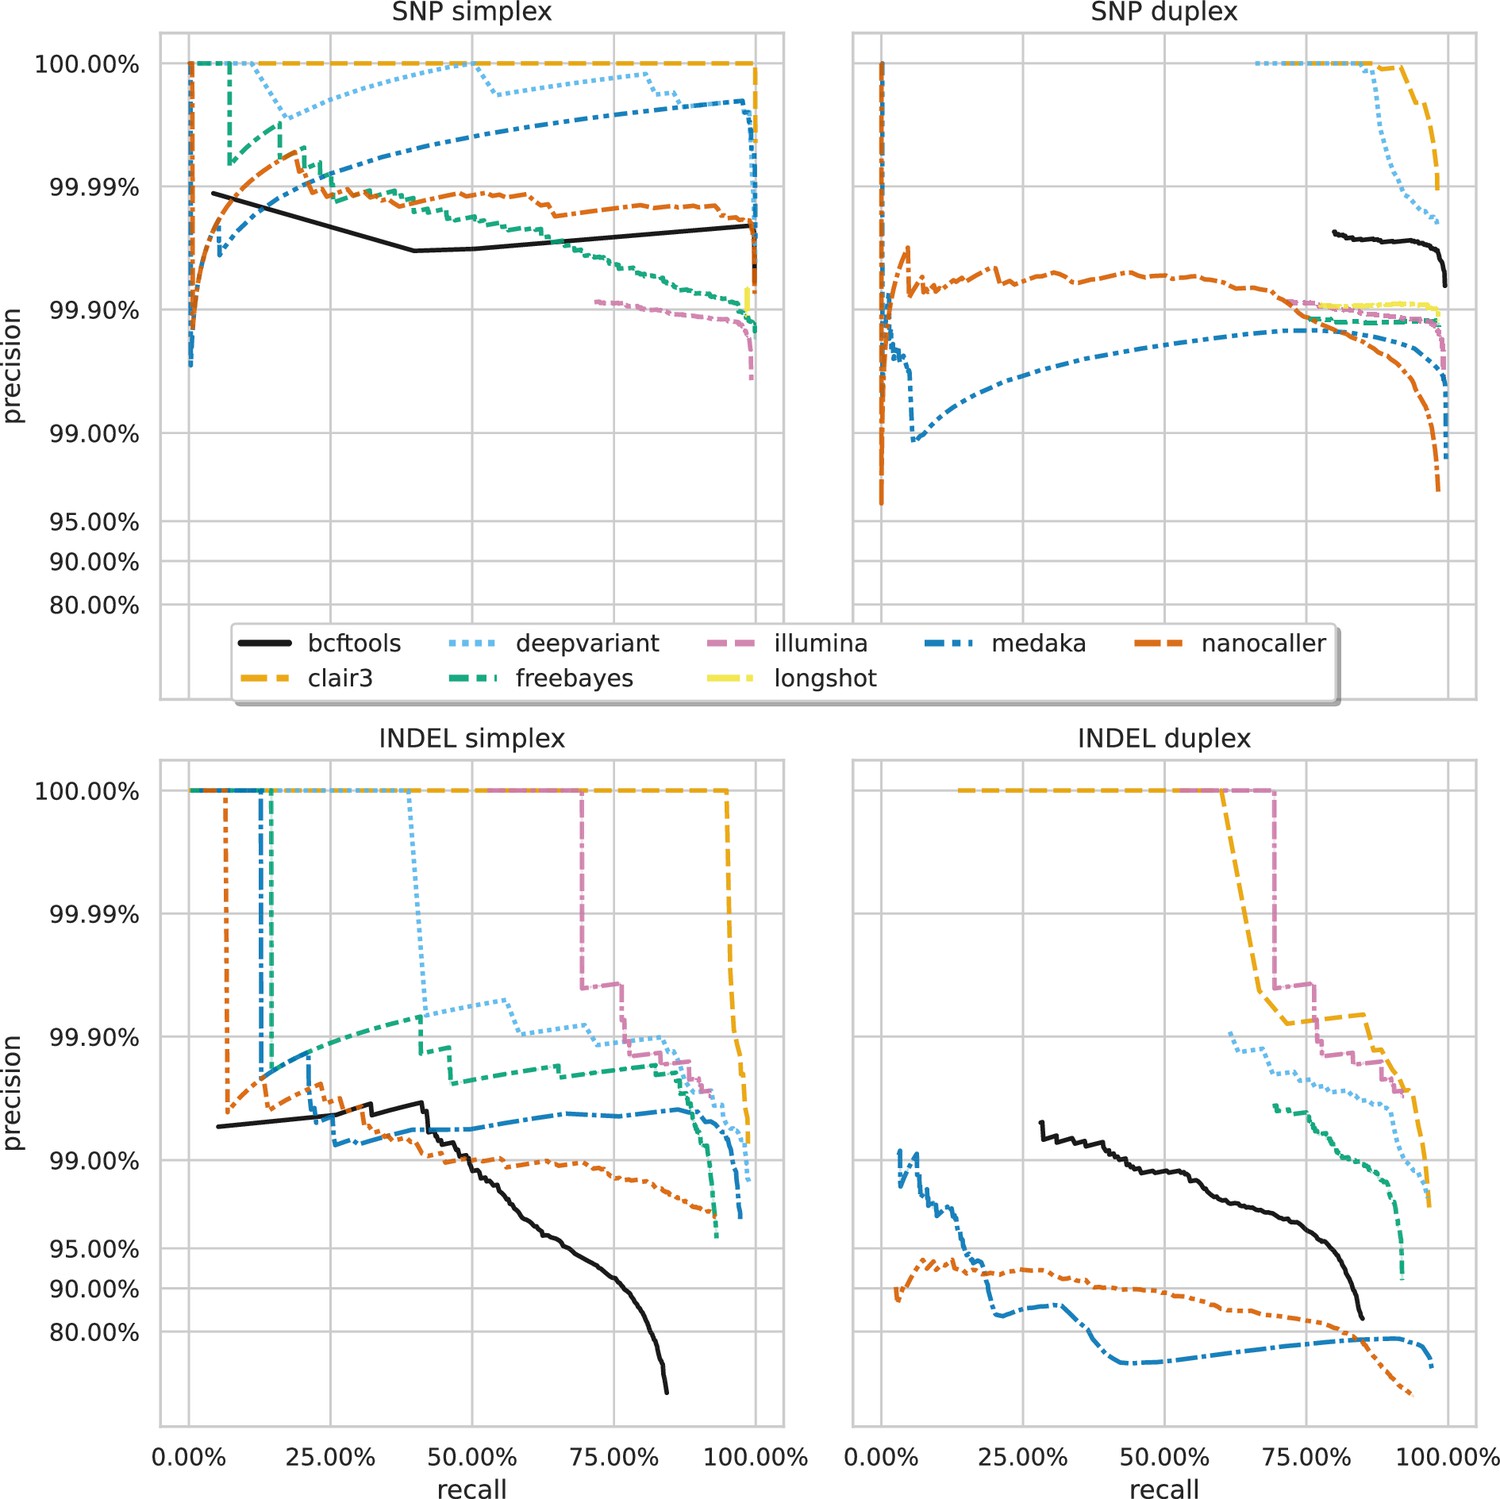
Figure 3 with 2 supplements
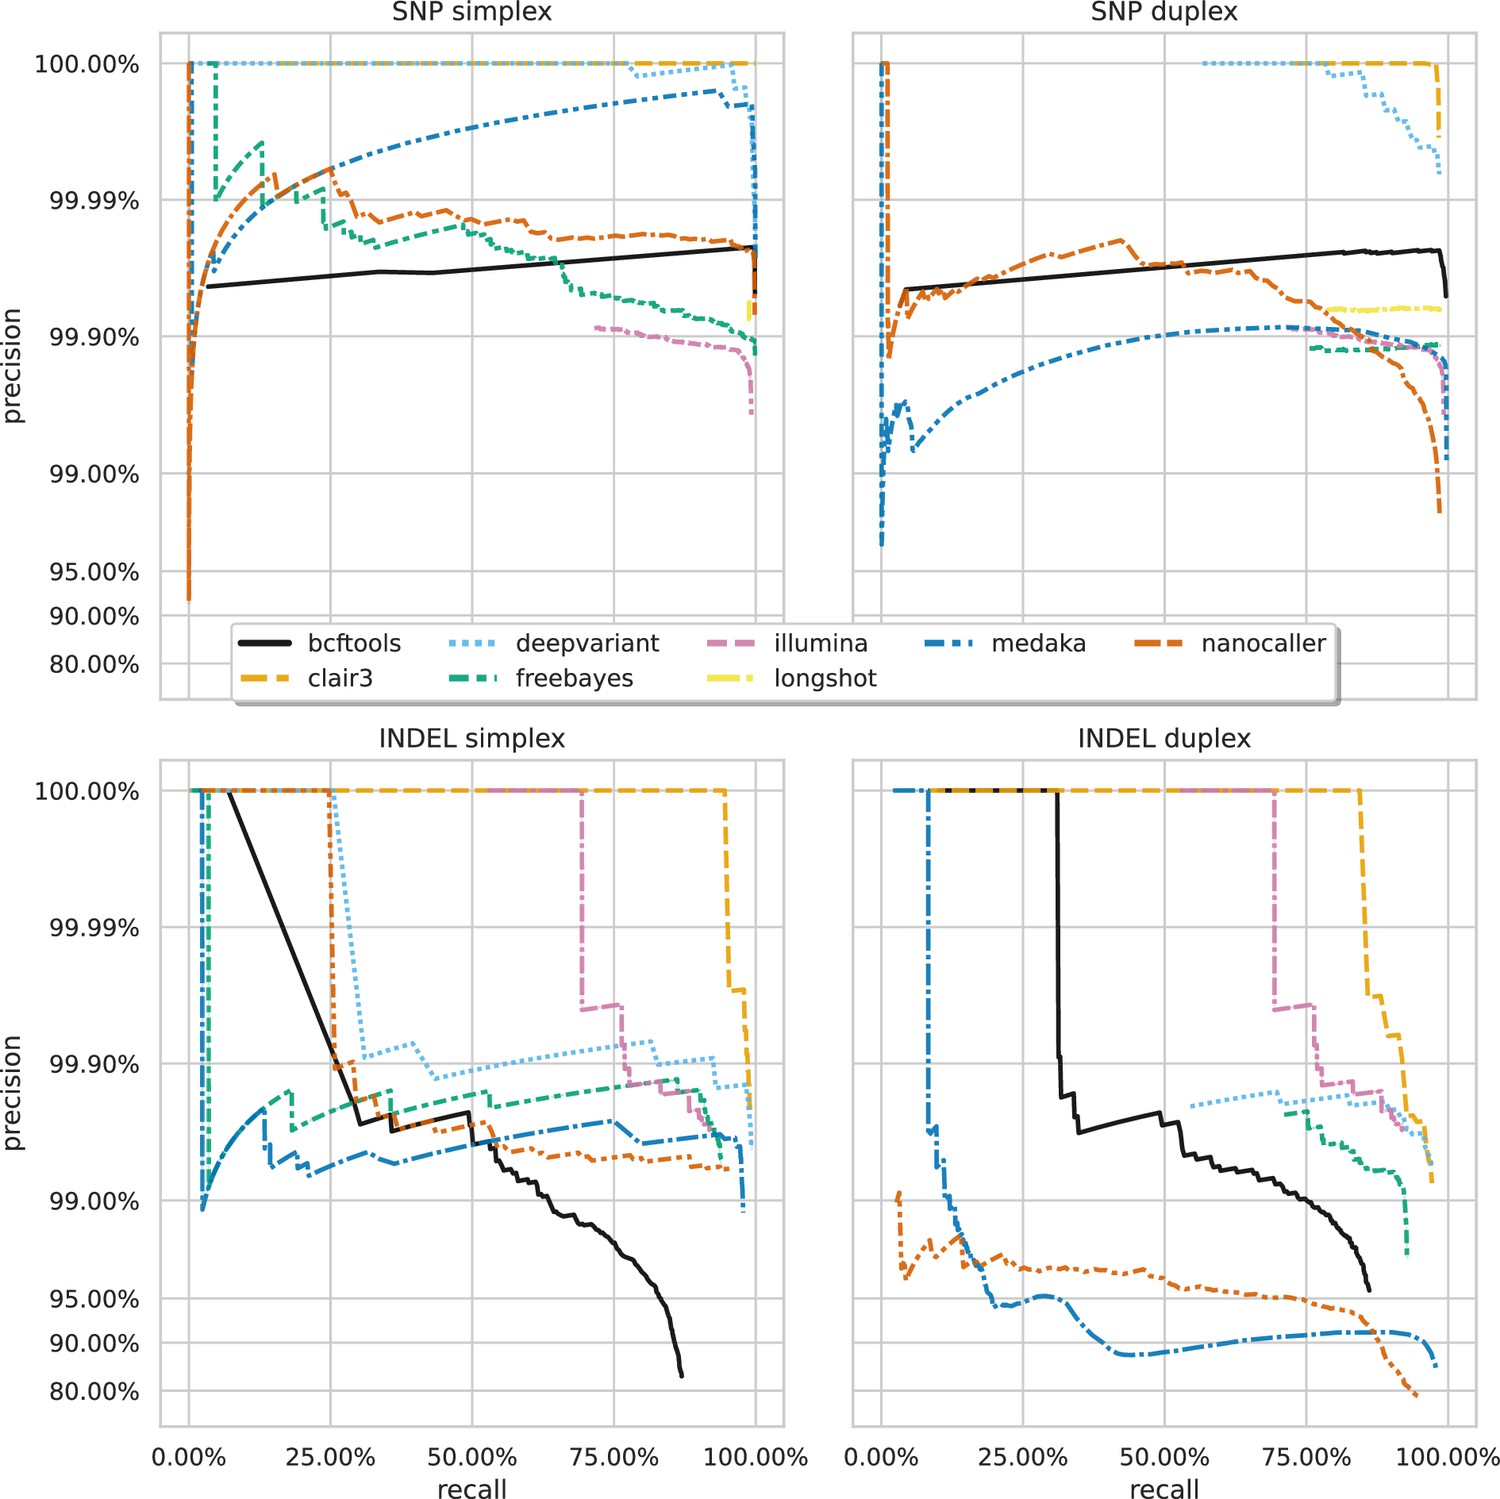
Precision and recall curves for each variant caller (colours and line styles) on sequencing data basecalled with the sup model, stratified by variant type (rows) and read type (columns) and aggregated across samples.
The curves are generated by using increasing variant quality score thresholds to filter variants and calculating precision and recall at each threshold. The lowest threshold is the lower right part of the curve, moving to the highest at the top left. Note, Longshot does not provide indel calls.
Figure 3—figure supplement 1
Precision and recall curves for each variant caller (colours and line styles) on sequencing data basecalled with the hac model, stratified by variant type (rows) and ready type (columns).
The curves are generated by using increasing variant quality score thresholds to filter variants and calculating precision and recall at each threshold. The lowest threshold is the lower right part of the curve, moving to the highest at the top left. Note, Longshot does not provide indel calls.
Figure 3—figure supplement 2

Precision and recall curves for each variant caller (colours and line styles) on sequencing data basecalled with the fast model, stratified by variant type (rows).
The curves are generated by using increasing variant quality score thresholds to filter variants and calculating precision and recall at each threshold. The lowest threshold is the lower right part of the curve, moving to the highest at the top left. Note, Longshot does not provide indel calls.
Figure 4 with 2 supplements
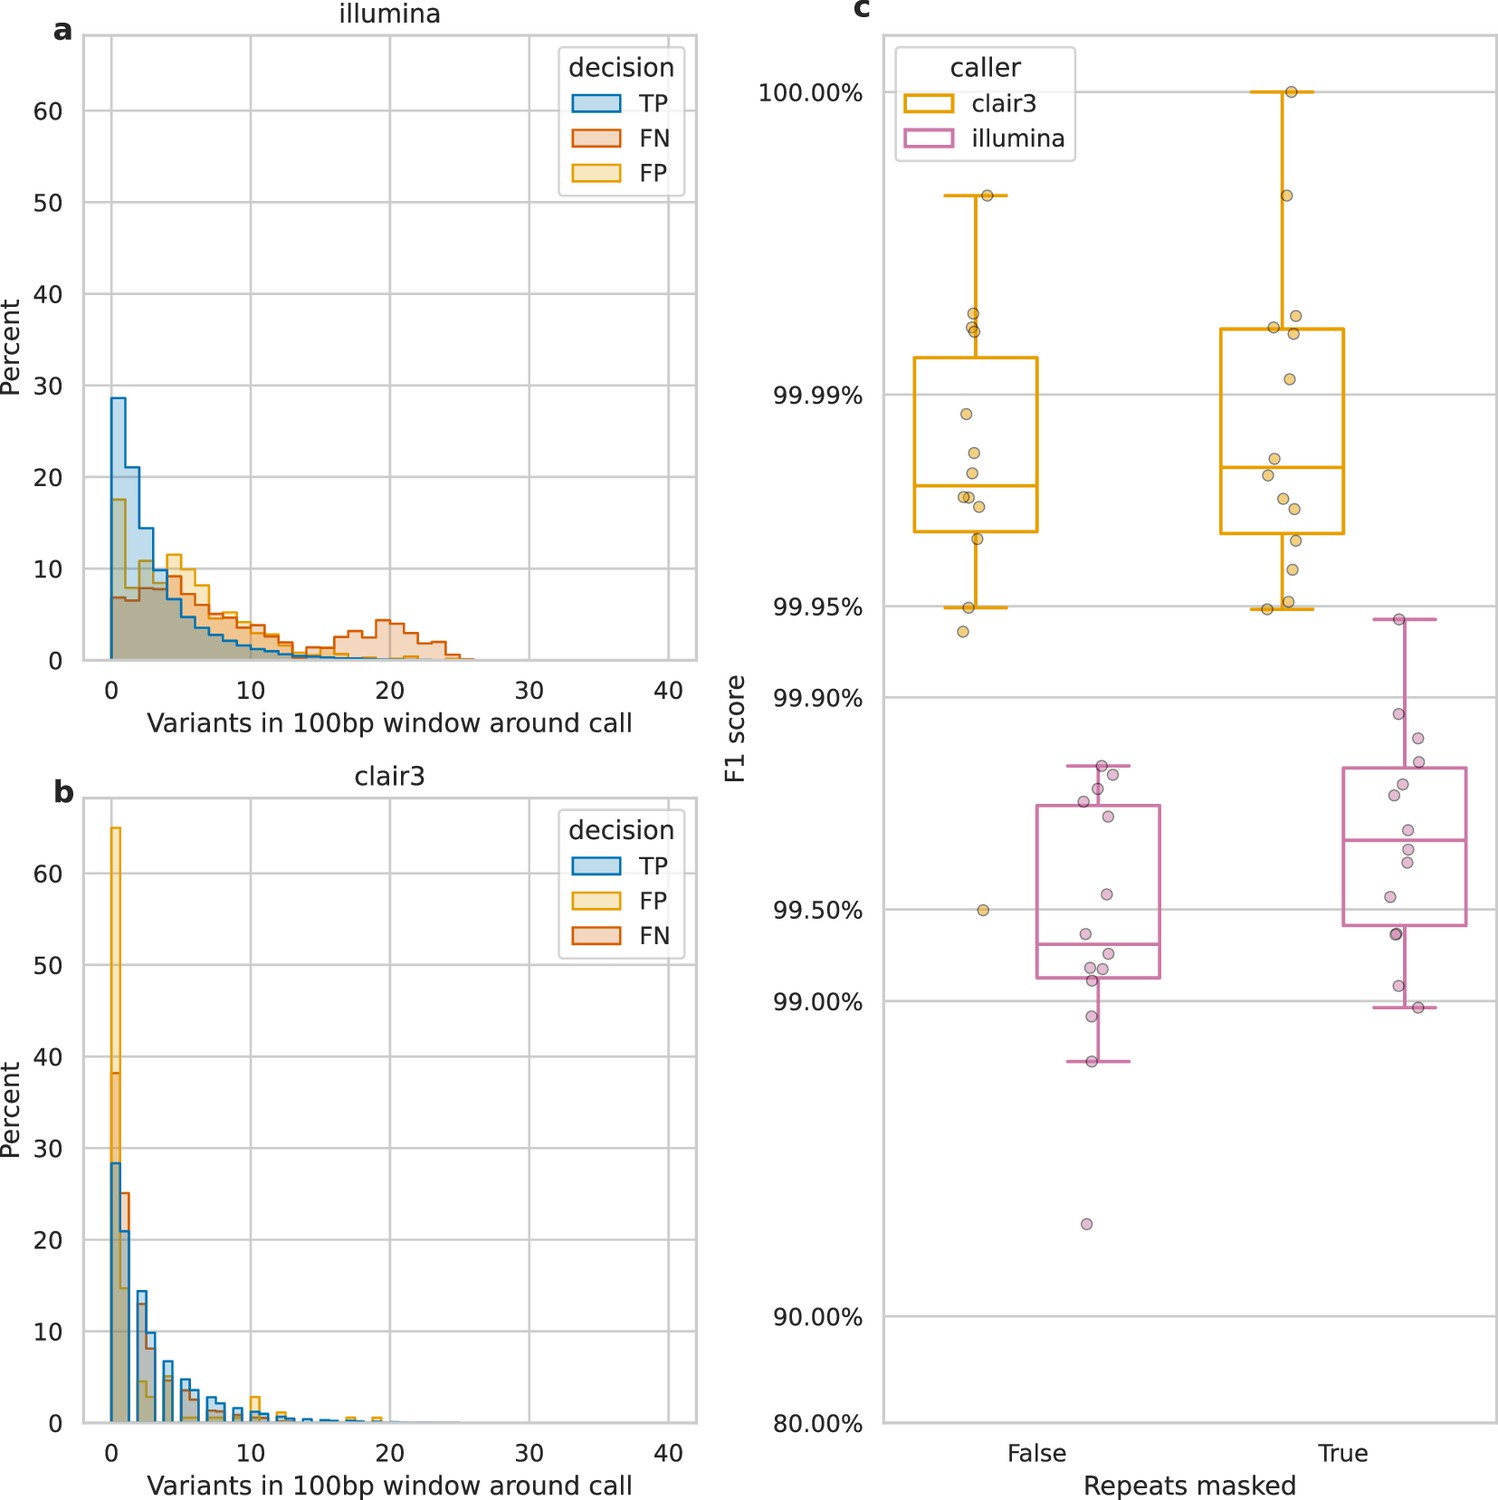
Impact of variant density and repetitive regions on Illumina variant calling.
Variant density is the number of (true or false) variants in a 100 bp window centred on a call. (a and b) The distribution of variant densities for true positive (TP), false positive (FP), and false negative (FN) calls. The y-axis, percent, indicates the percent of all calls of that decision that fall within the density bin on the x-axis. Illumina calls, aggregated across all samples, are shown in a, while b shows Clair3 calls from simplex sup-basecalled reads at 100× depth. (c) Impact of repetitive regions on the F1 score (y-axis) for Clair3 (100× simplex sup) and Illumina. The x-axis indicates whether variants that fall within repetitive regions are excluded from the calculation of the F1 score. Points indicate the F1 score for a single sample.
Figure 4—figure supplement 1
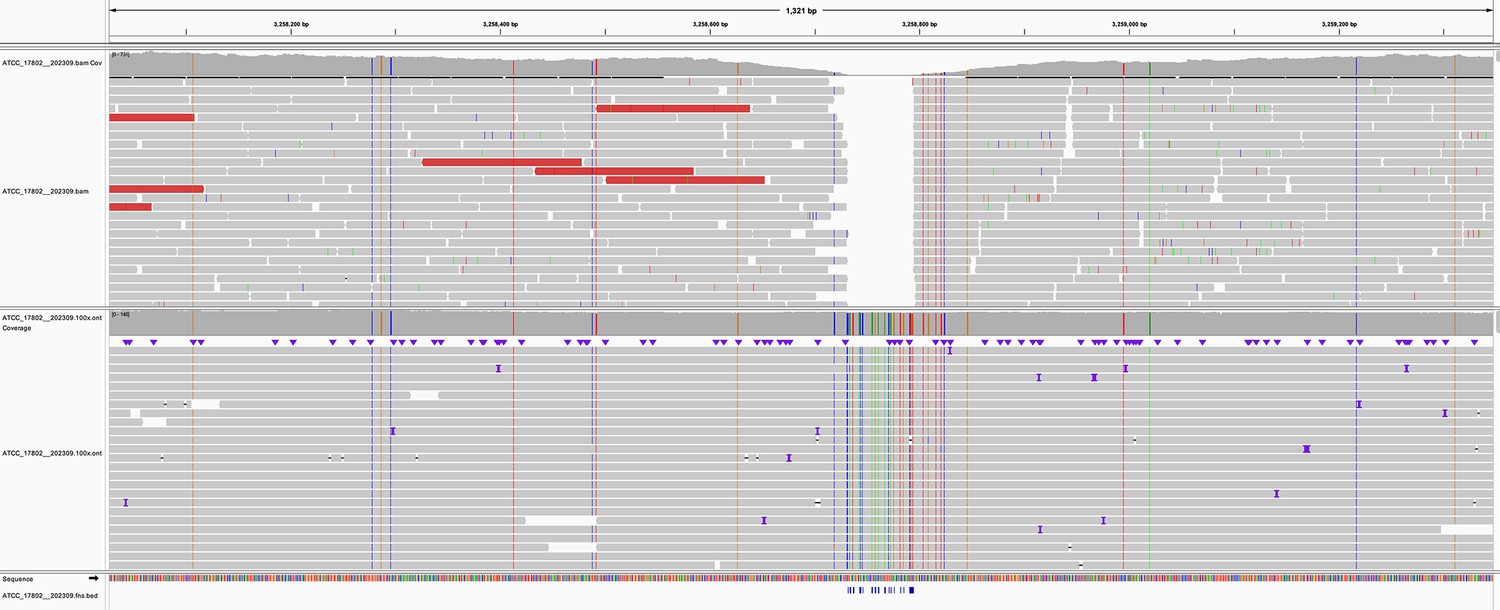
Read pileup in a variant-dense region in the genome of sample ATCC_17802__202309.
The top track shows the alignment of the sample’s Illumina reads, while the lower track is the Oxford Nanopore Technologies (ONT) reads. Missed variant calls (false negatives) are shown by small blue notches at the bottom of the figure, but are also identifiable by vertical coloured lines in the ONT reads. Pileup is visualised in IGV (Robinson et al., 2011).
Figure 4—figure supplement 2
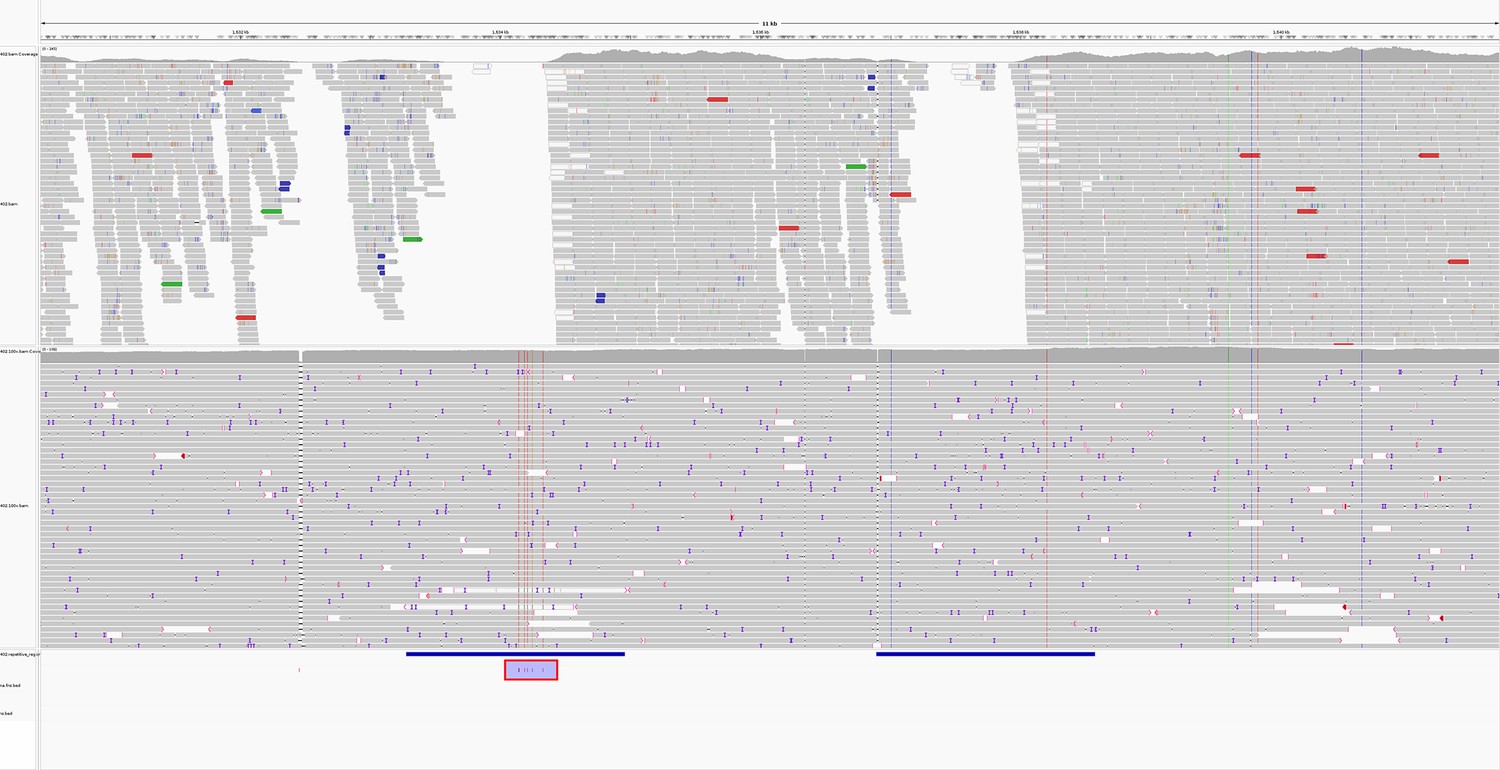
Read pileup around two repetitive regions (horizontal blue bars) in the genome of sample AMtb_1__202401.
The top track shows the alignment of the sample’s Illumina reads, while the lower track is the Oxford Nanopore Technologies (ONT) reads. Missed variant calls (false negatives) are shown by small red notches in a purple box with a red border at the bottom of the figure, but are also identifiable by vertical coloured lines in the ONT reads. Pileup is visualised in IGV (Robinson et al., 2011).
Figure 5 with 11 supplements
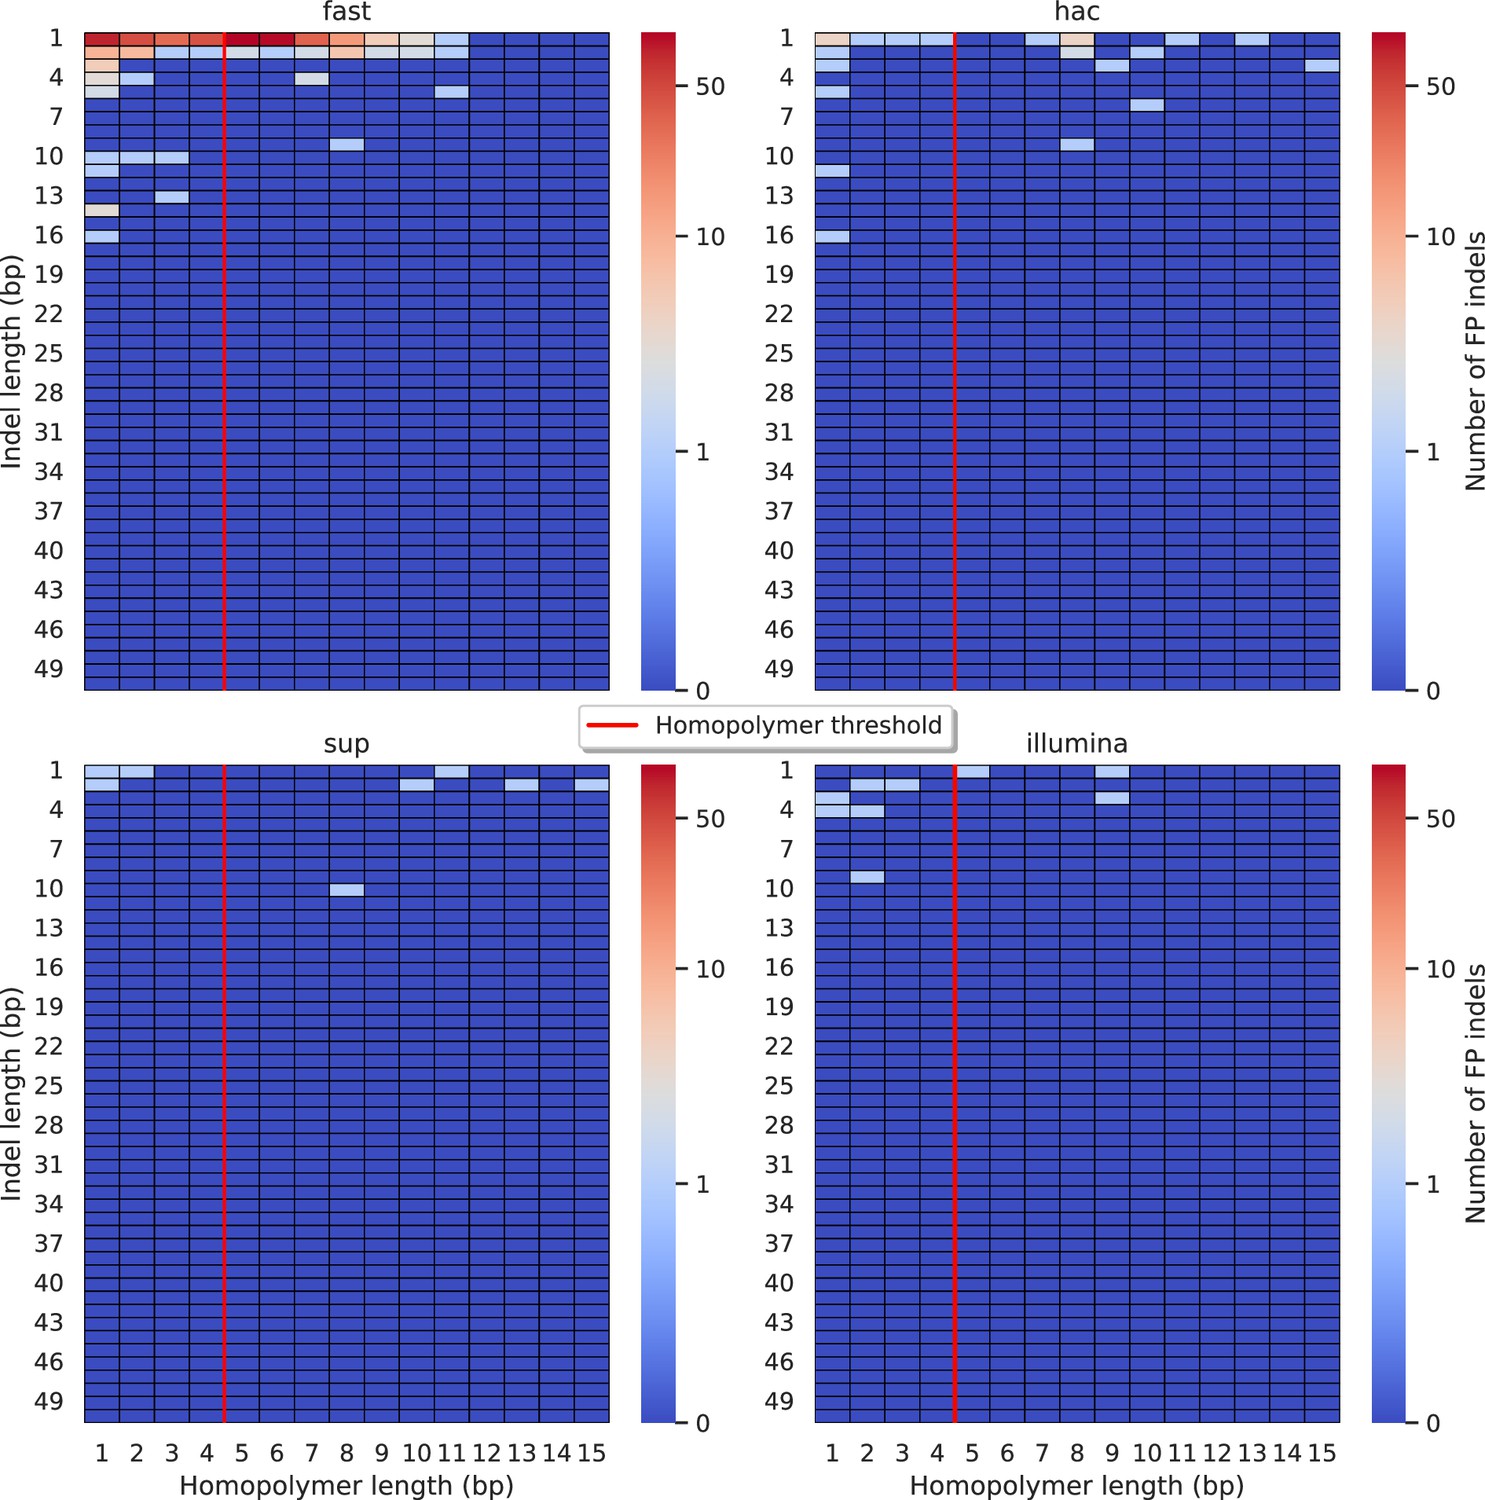
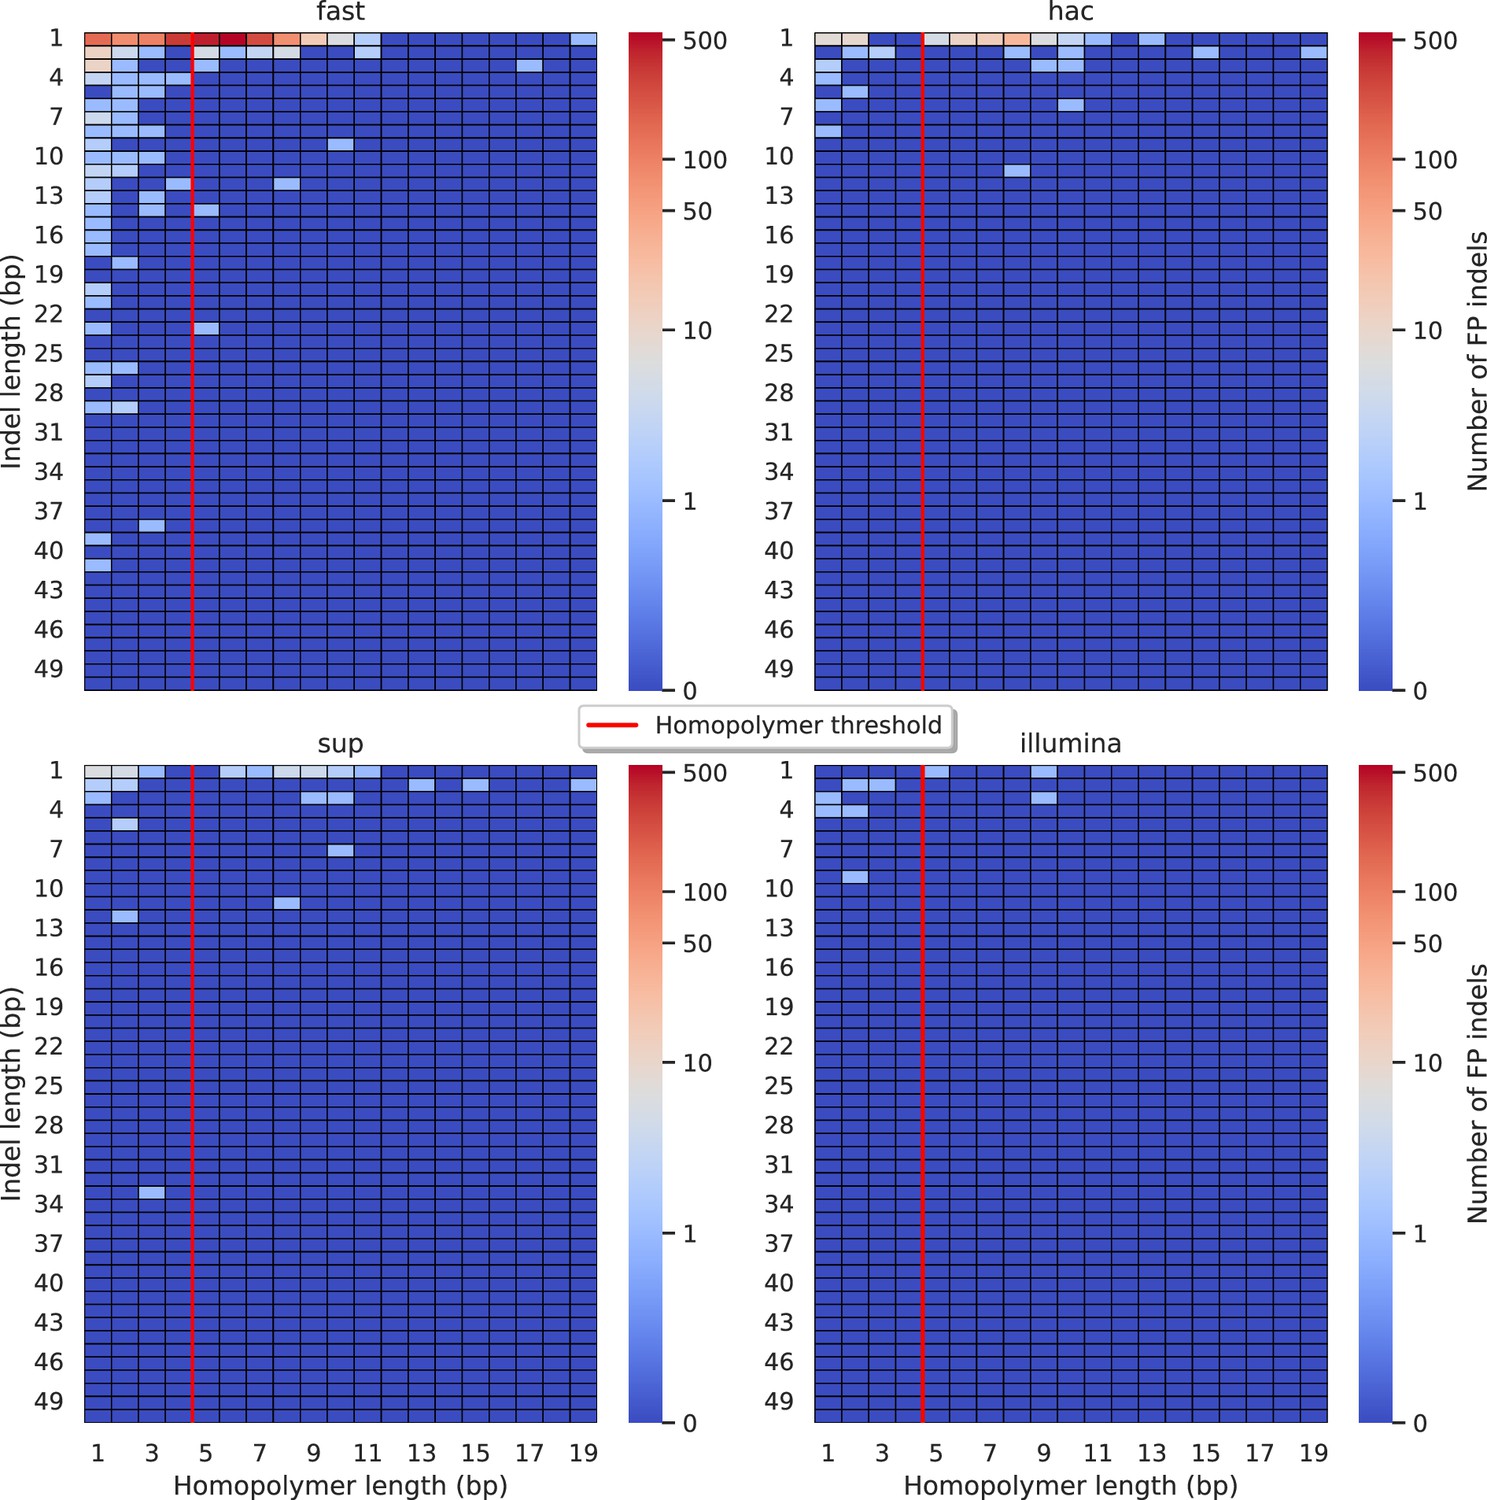
Relationship between indel length (y-axis) and homopolymer length (x-axis) for false positive (FP) indel calls for Clair3 100× simplex fast (top left), hac (top right), and sup (lower left) calls.
Illumina is shown in the lower right for reference. The vertical red line indicates the threshold above which we deem a run of the same nucleotide to be a ‘true’ homopolymer. Indel length is the number of bases inserted/deleted for an indel, whereas the homopolymer length indicates how long the tract of the same nucleotide is after the indel. The colour of a cell indicates number of FP indels of that indel-homopolymer length combination.
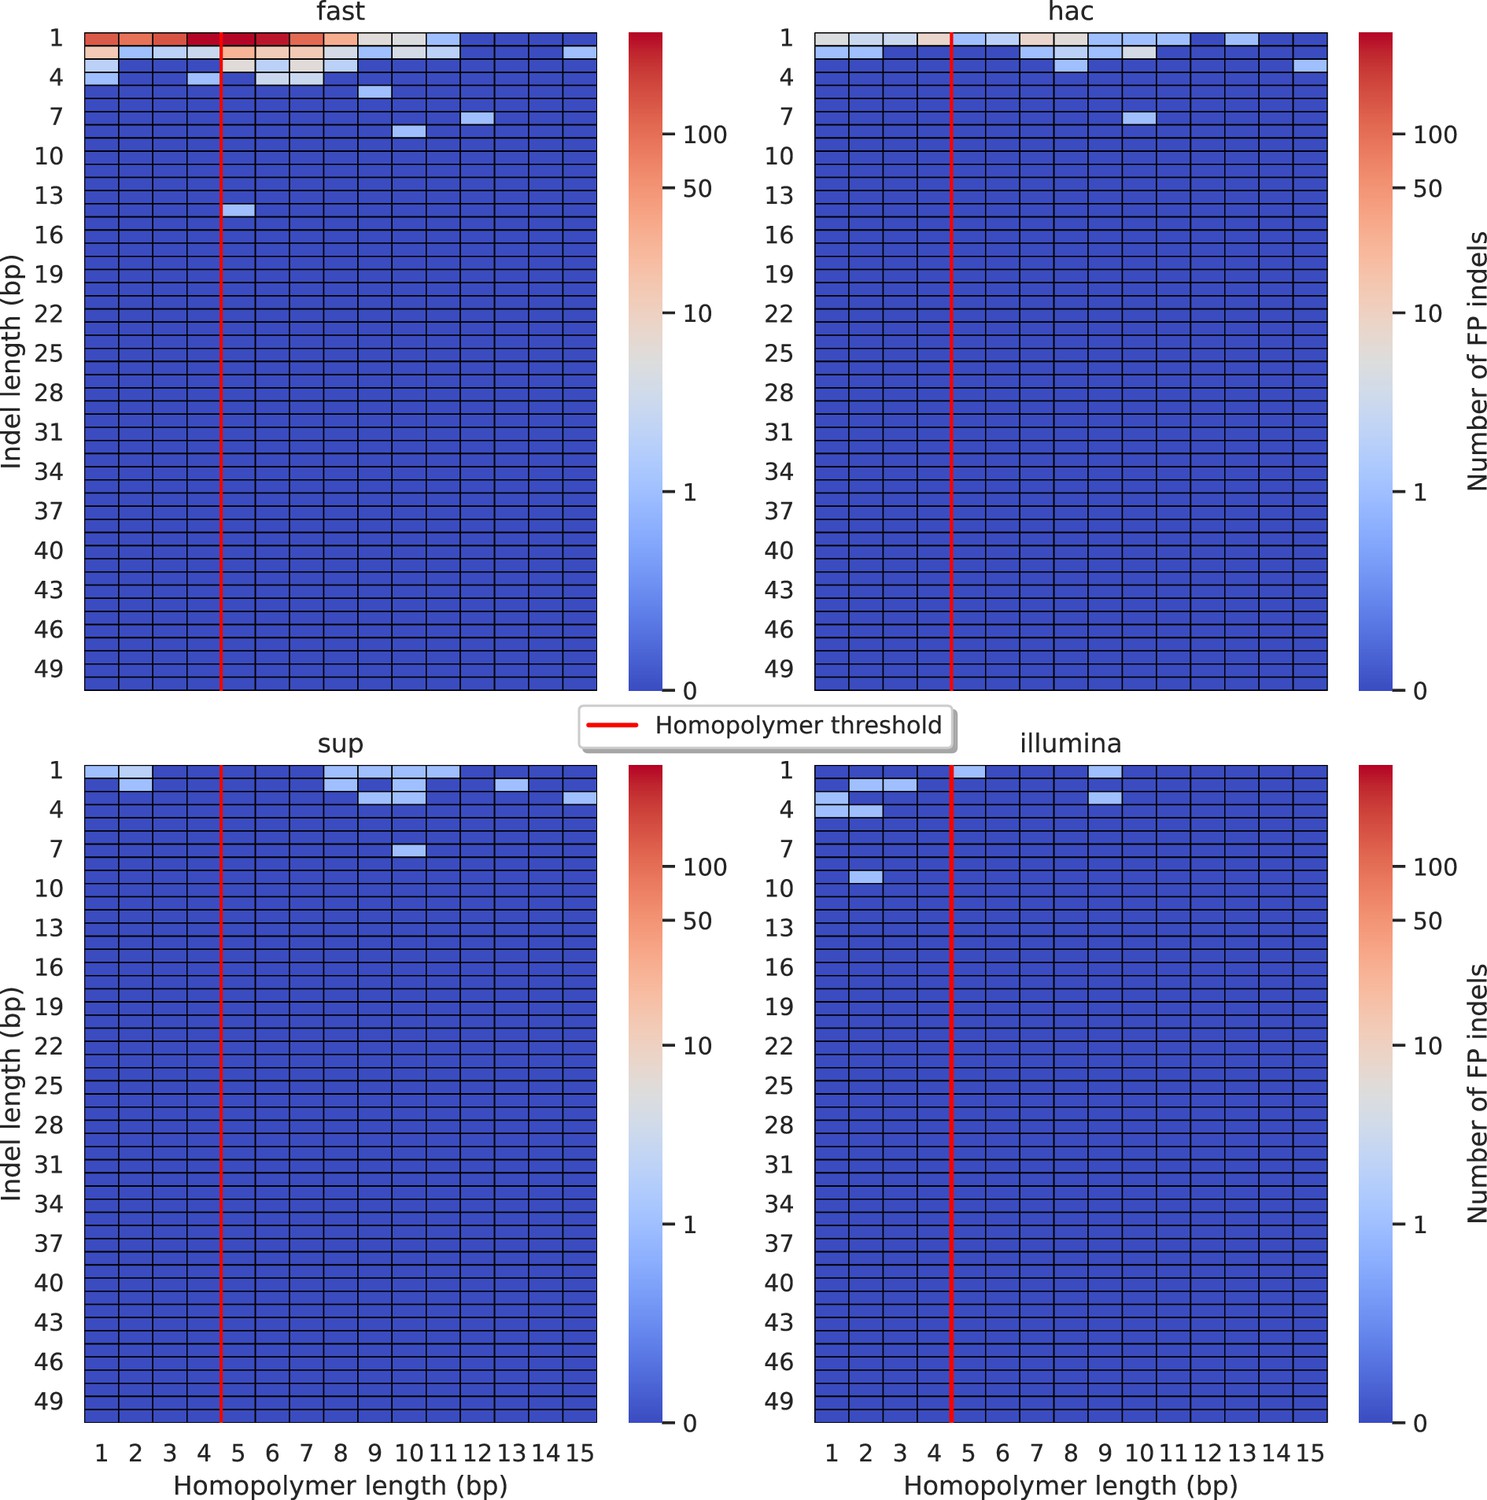
Figure 5—figure supplement 1
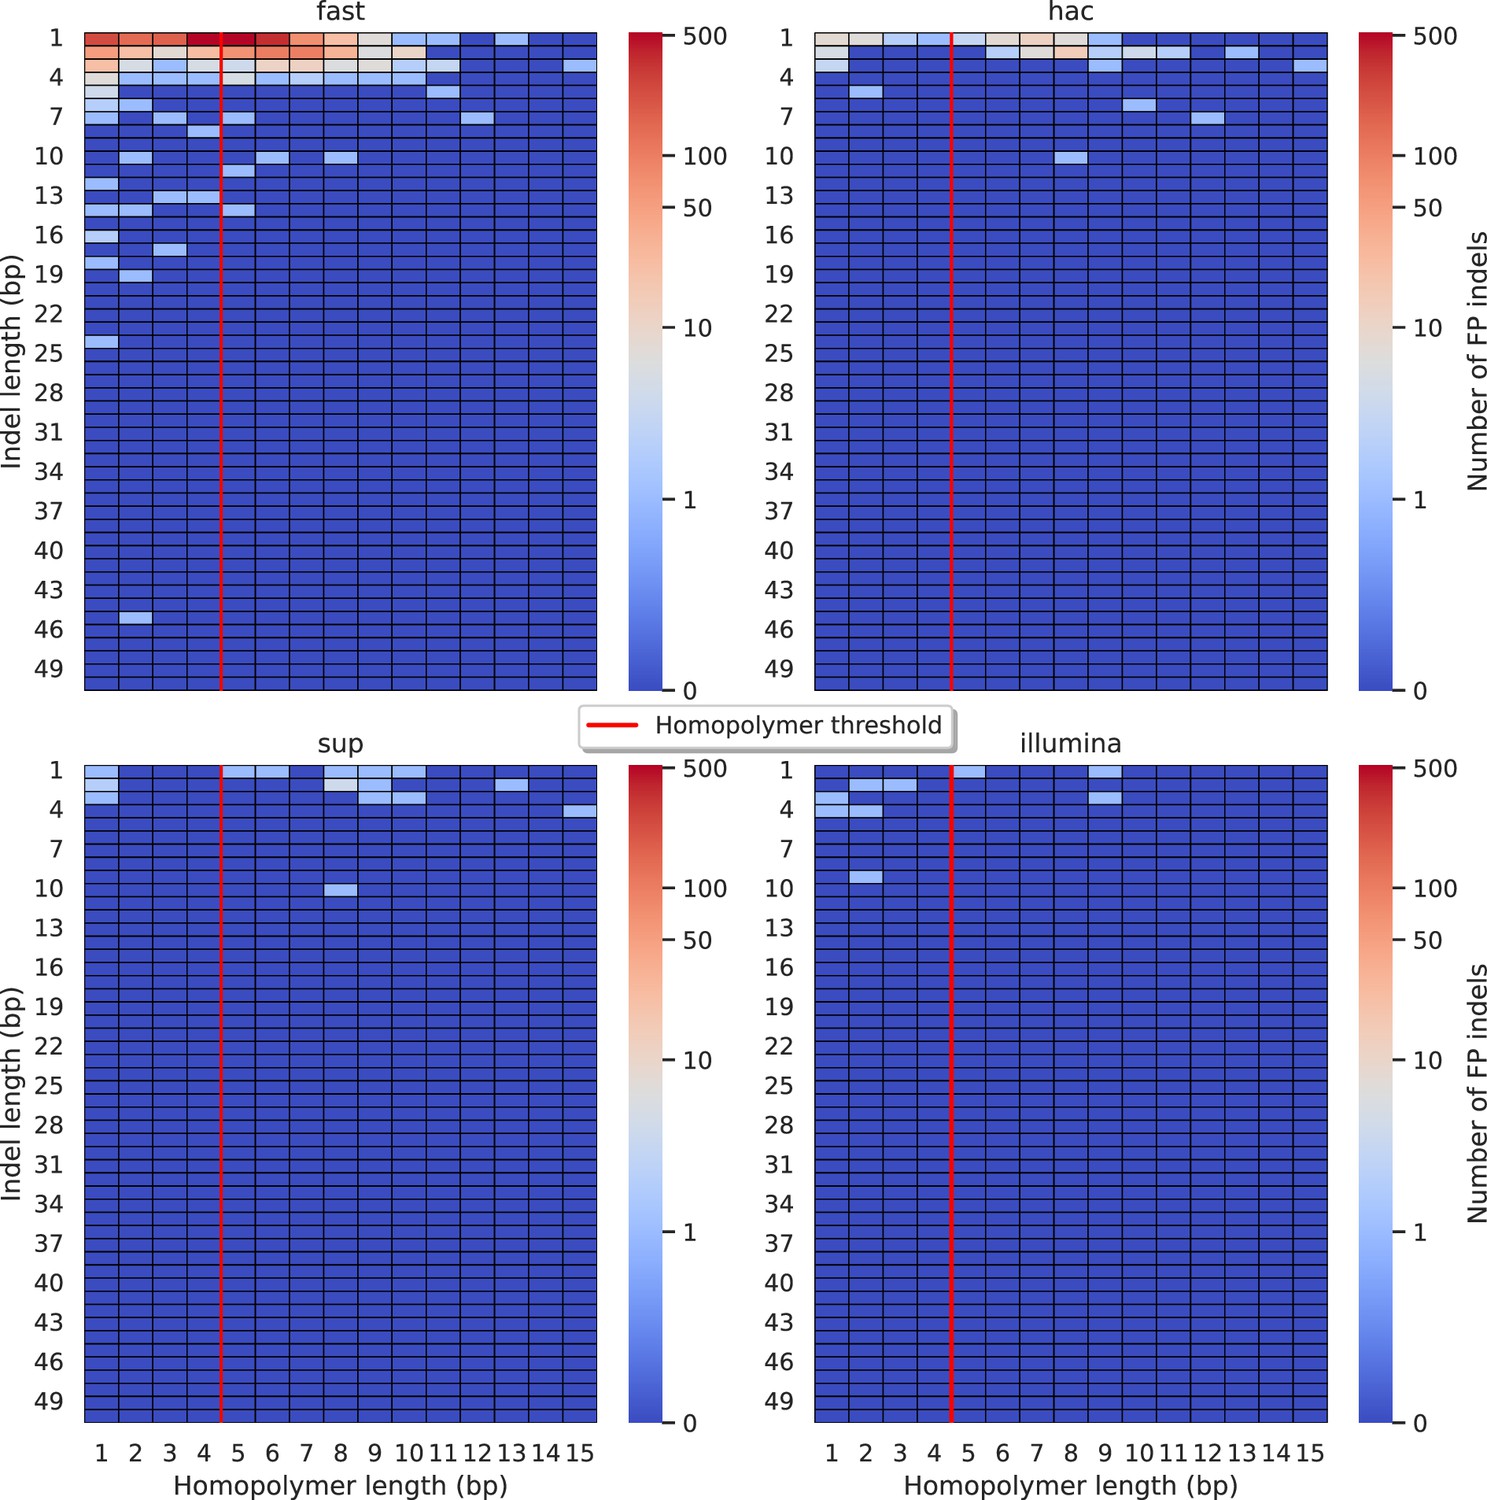
Relationship between indel length (x-axis) and homopolymer length (y-axis) for false positive (FP) indel calls for BCFtools 100× simplex fast (top left), hac (top right), and sup (lower left) calls.
Illumina is shown in the lower right for reference. The vertical red line indicates the threshold above which we deem a run of the same nucleotide to be a ‘true’ homopolymer. Indel length is the number of bases inserted/deleted for an indel, whereas the homopolymer length indicates how long the tract of the same nucleotide is after the indel. The colour of a cell indicates number of FP indels of that indel-homopolymer length combination.
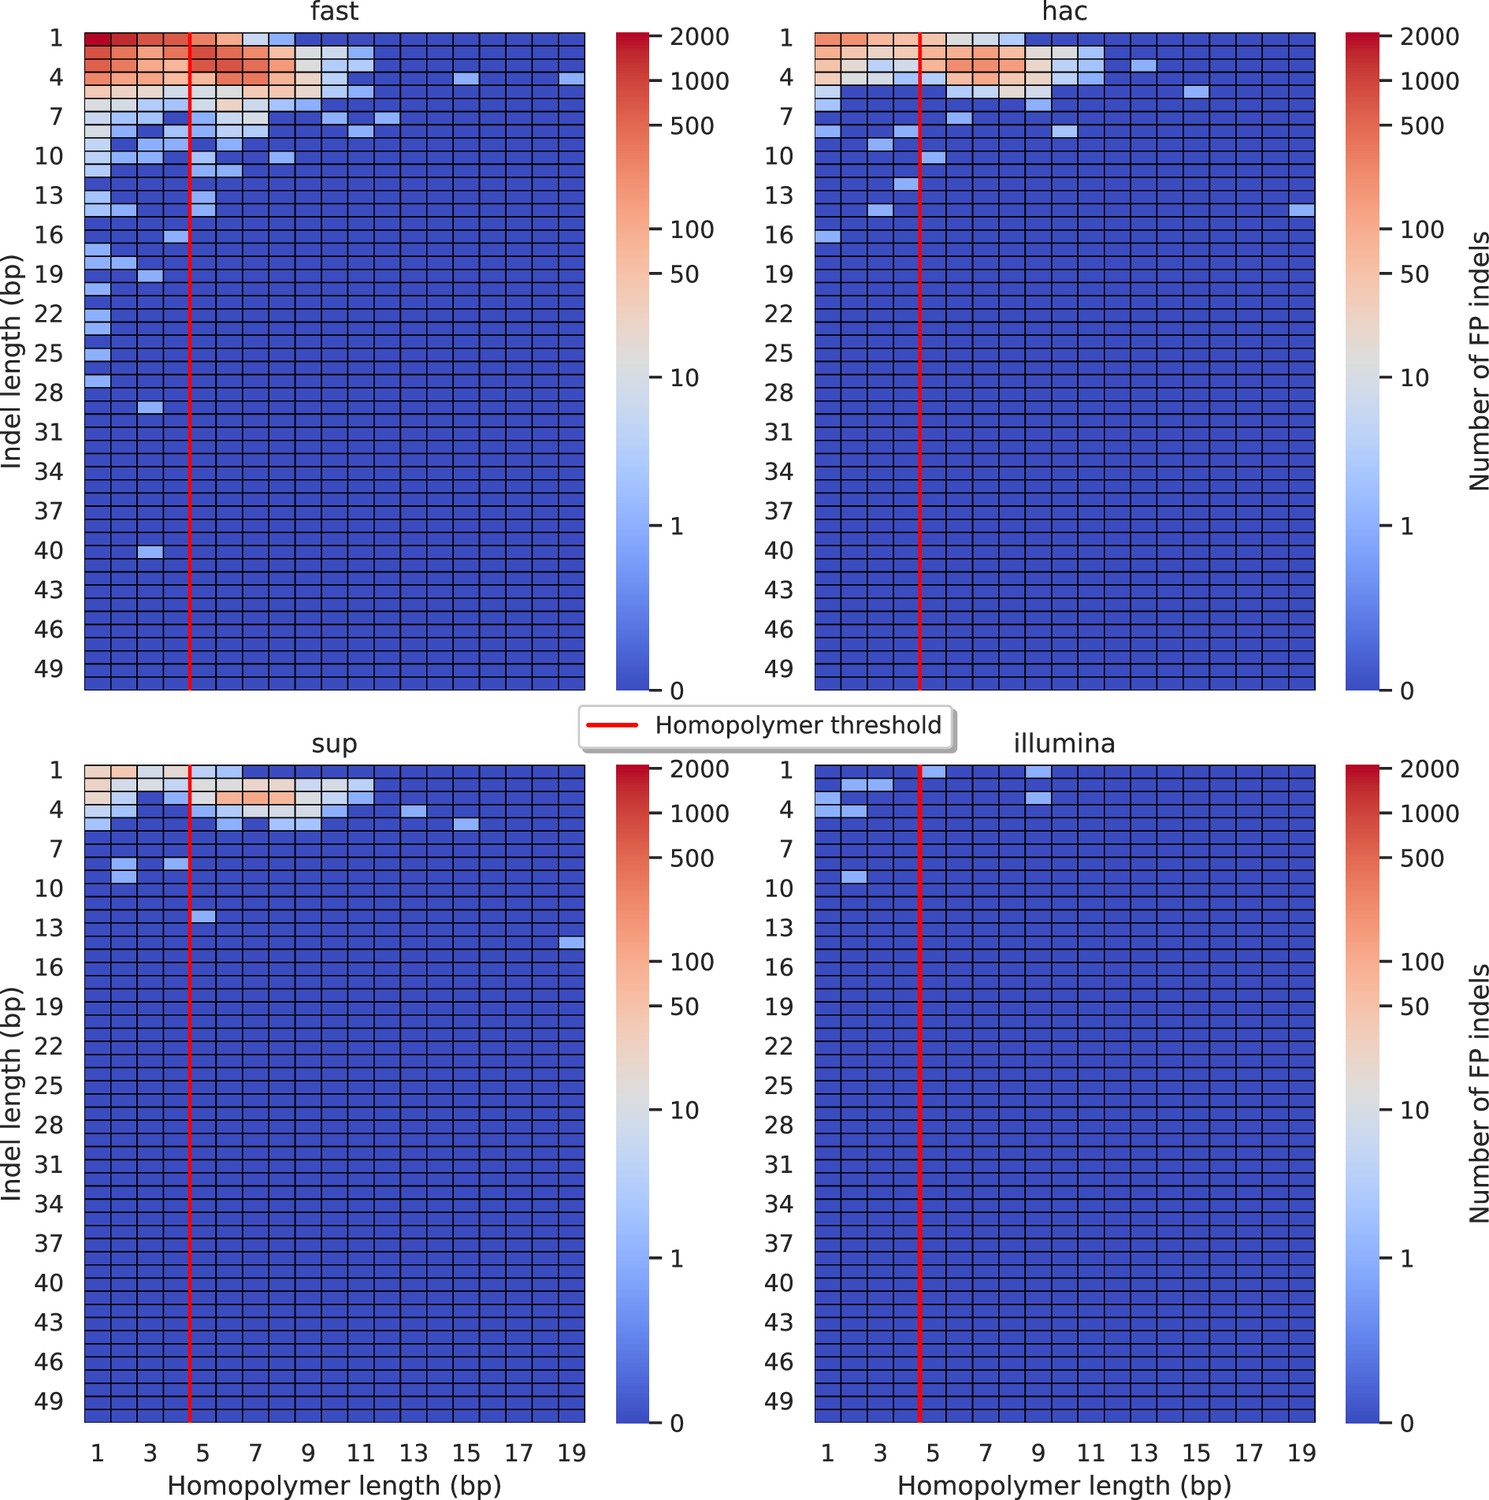
Figure 5—figure supplement 2
Relationship between indel length (x-axis) and homopolymer length (y-axis) for false positive (FP) indel calls for DeepVariant 100× simplex fast (top left), hac (top right), and sup (lower left) calls.
Illumina is shown in the lower right for reference. The vertical red line indicates the threshold above which we deem a run of the same nucleotide to be a ‘true’ homopolymer. Indel length is the number of bases inserted/deleted for an indel, whereas the homopolymer length indicates how long the tract of the same nucleotide is after the indel. The colour of a cell indicates number of FP indels of that indel-homopolymer length combination.
Figure 5—figure supplement 3
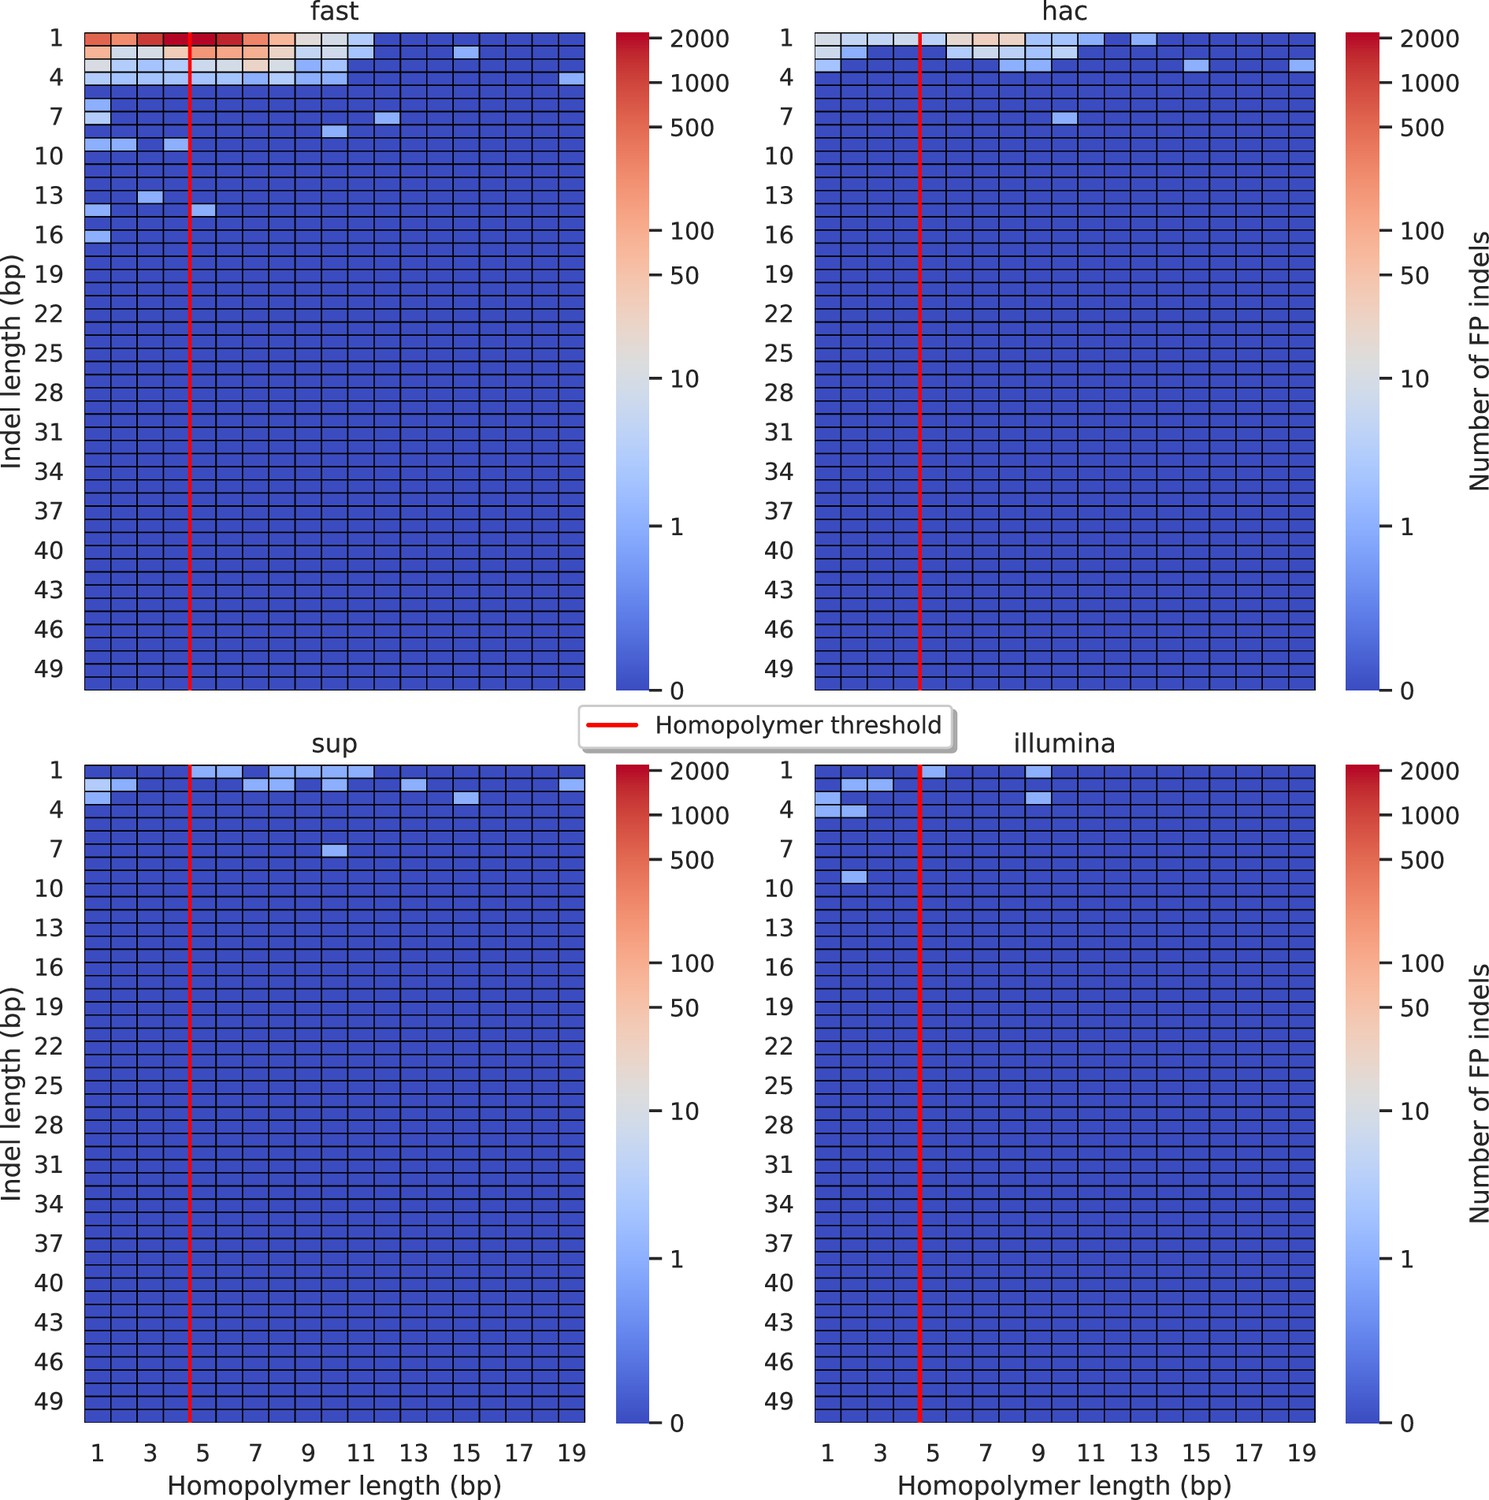
Relationship between indel length (x-axis) and homopolymer length (y-axis) for false positive (FP) indel calls for FreeBayes 100× simplex fast (top left), hac (top right), and sup (lower left) calls.
Illumina is shown in the lower right for reference. The vertical red line indicates the threshold above which we deem a run of the same nucleotide to be a ‘true’ homopolymer. Indel length is the number of bases inserted/deleted for an indel, whereas the homopolymer length indicates how long the tract of the same nucleotide is after the indel. The colour of a cell indicates number of FP indels of that indel-homopolymer length combination.
Figure 5—figure supplement 4
Relationship between indel length (x-axis) and homopolymer length (y-axis) for false positive (FP) indel calls for Medaka 100× simplex fast (top left), hac (top right), and sup (lower left) calls.
Illumina is shown in the lower right for reference. The vertical red line indicates the threshold above which we deem a run of the same nucleotide to be a ‘true’ homopolymer. Indel length is the number of bases inserted/deleted for an indel, whereas the homopolymer length indicates how long the tract of the same nucleotide is after the indel. The colour of a cell indicates number of FP indels of that indel-homopolymer length combination.
Figure 5—figure supplement 5
Relationship between indel length (x-axis) and homopolymer length (y-axis) for false positive (FP) indel calls for NanoCaller 100× simplex fast (top left), hac (top right), and sup (lower left) calls.
Illumina is shown in the lower right for reference. The vertical red line indicates the threshold above which we deem a run of the same nucleotide to be a ‘true’ homopolymer. Indel length is the number of bases inserted/deleted for an indel, whereas the homopolymer length indicates how long the tract of the same nucleotide is after the indel. The colour of a cell indicates number of FP indels of that indel-homopolymer length combination.
Figure 5—figure supplement 6
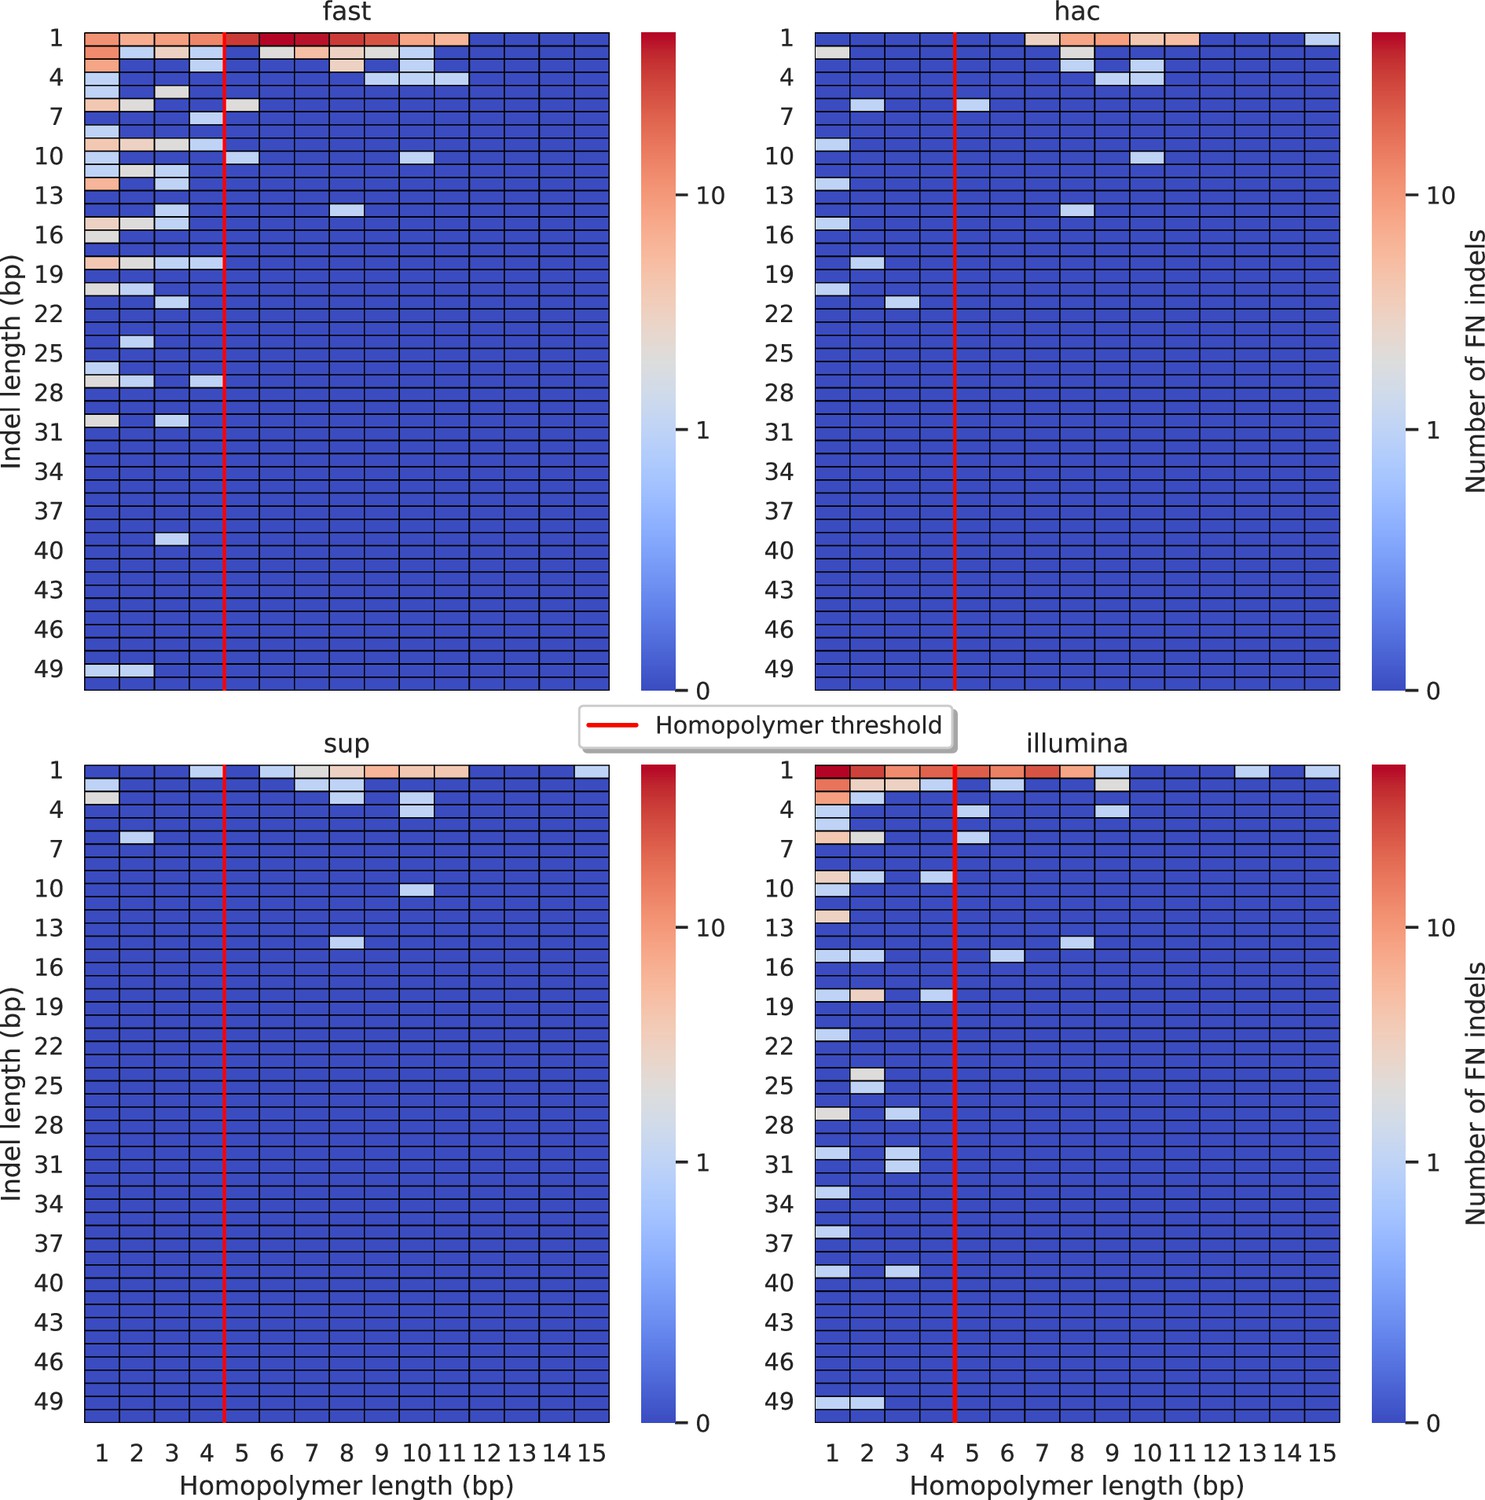
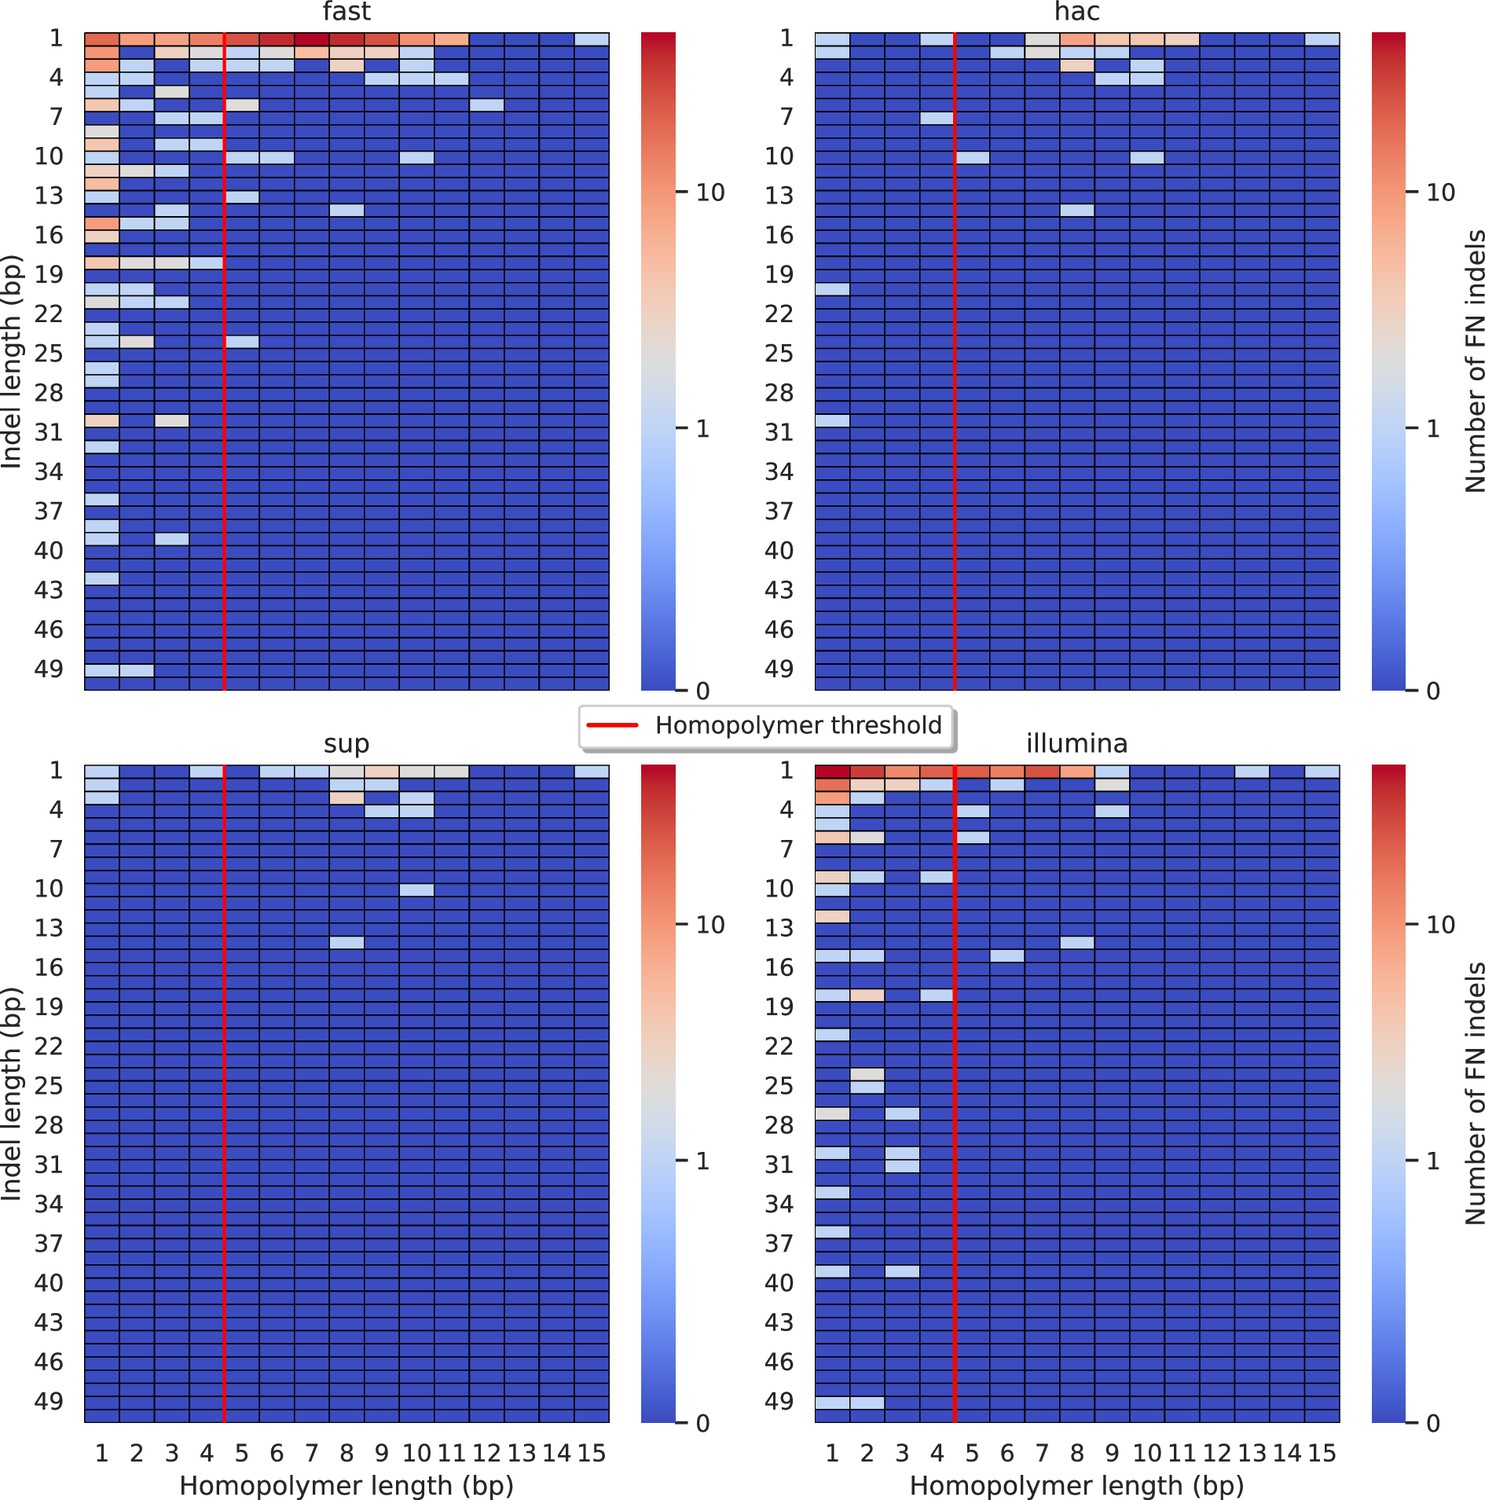
Relationship between indel length (x-axis) and homopolymer length (y-axis) for false negative (FN) indel calls for Clair3 100× simplex fast (top left), hac (top right), and sup (lower left) calls.
Illumina is shown in the lower right for reference. The vertical red line indicates the threshold above which we deem a run of the same nucleotide to be a ‘true’ homopolymer. Indel length is the number of bases inserted/deleted for an indel, whereas the homopolymer length indicates how long the tract of the same nucleotide is after the indel. The colour of a cell indicates number of FN indels of that indel-homopolymer length combination.
Figure 5—figure supplement 7
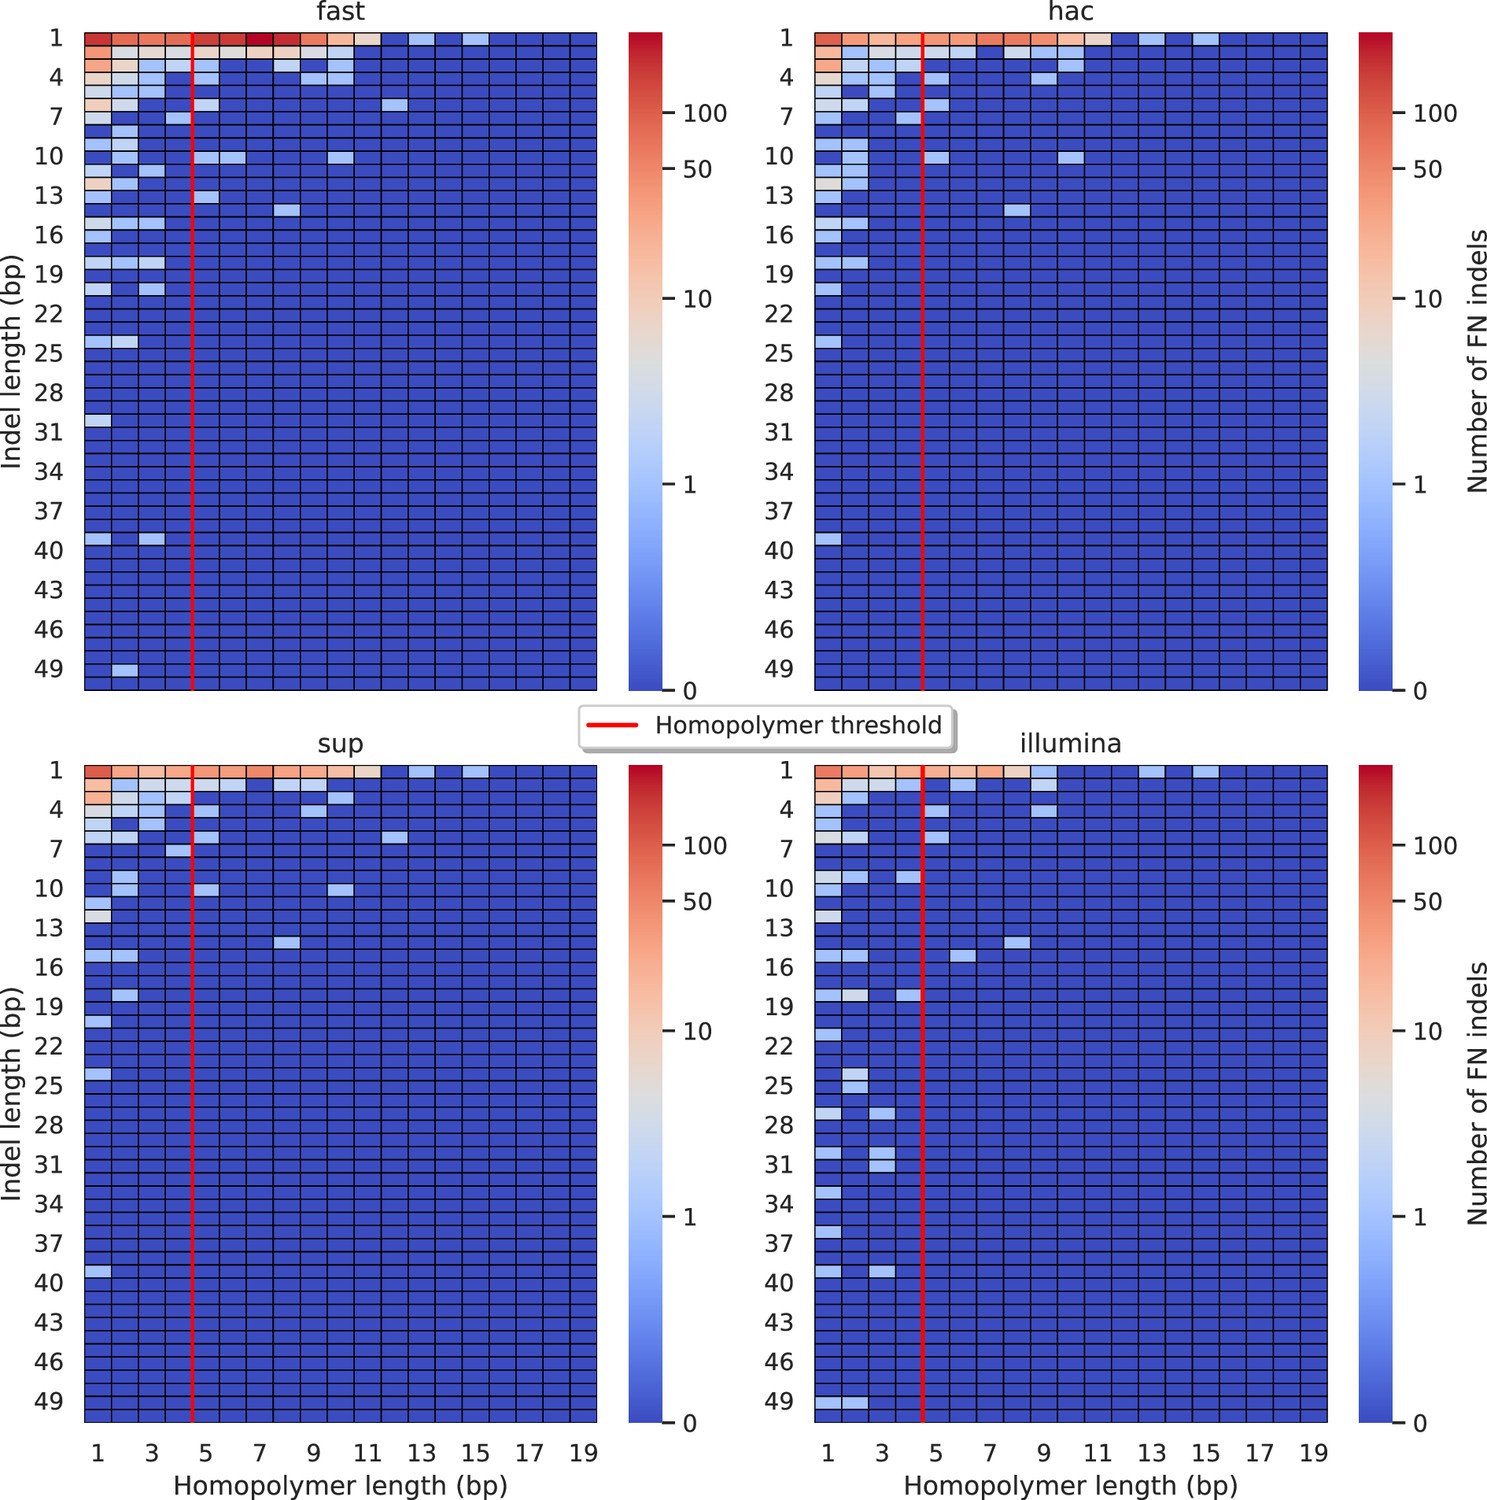
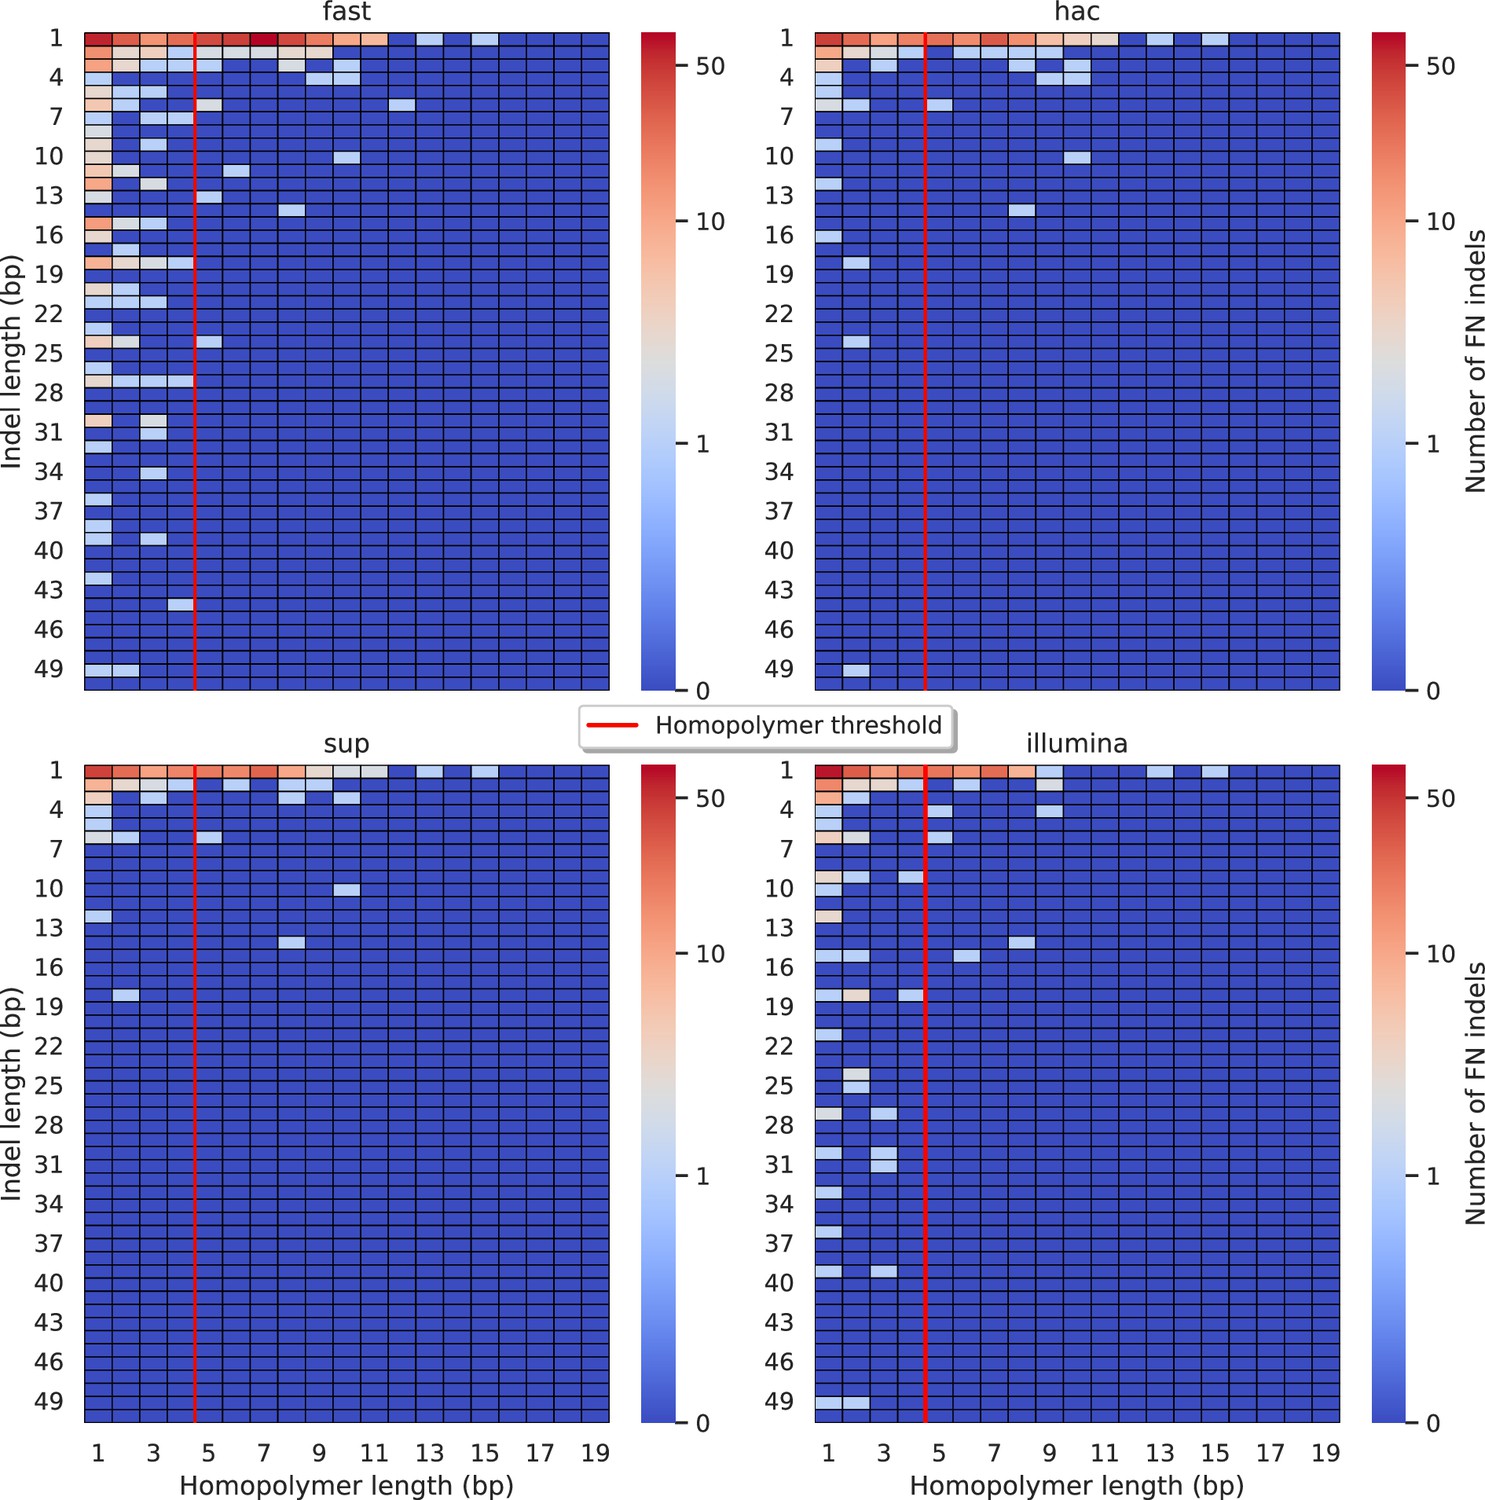
Relationship between indel length (x-axis) and homopolymer length (y-axis) for false negative (FN) indel calls for BCFtools 100× simplex fast (top left), hac (top right), and sup (lower left) calls.
Illumina is shown in the lower right for reference. The vertical red line indicates the threshold above which we deem a run of the same nucleotide to be a ‘true’ homopolymer. Indel length is the number of bases inserted/deleted for an indel, whereas the homopolymer length indicates how long the tract of the same nucleotide is after the indel. The colour of a cell indicates number of FN indels of that indel-homopolymer length combination.
Figure 5—figure supplement 8
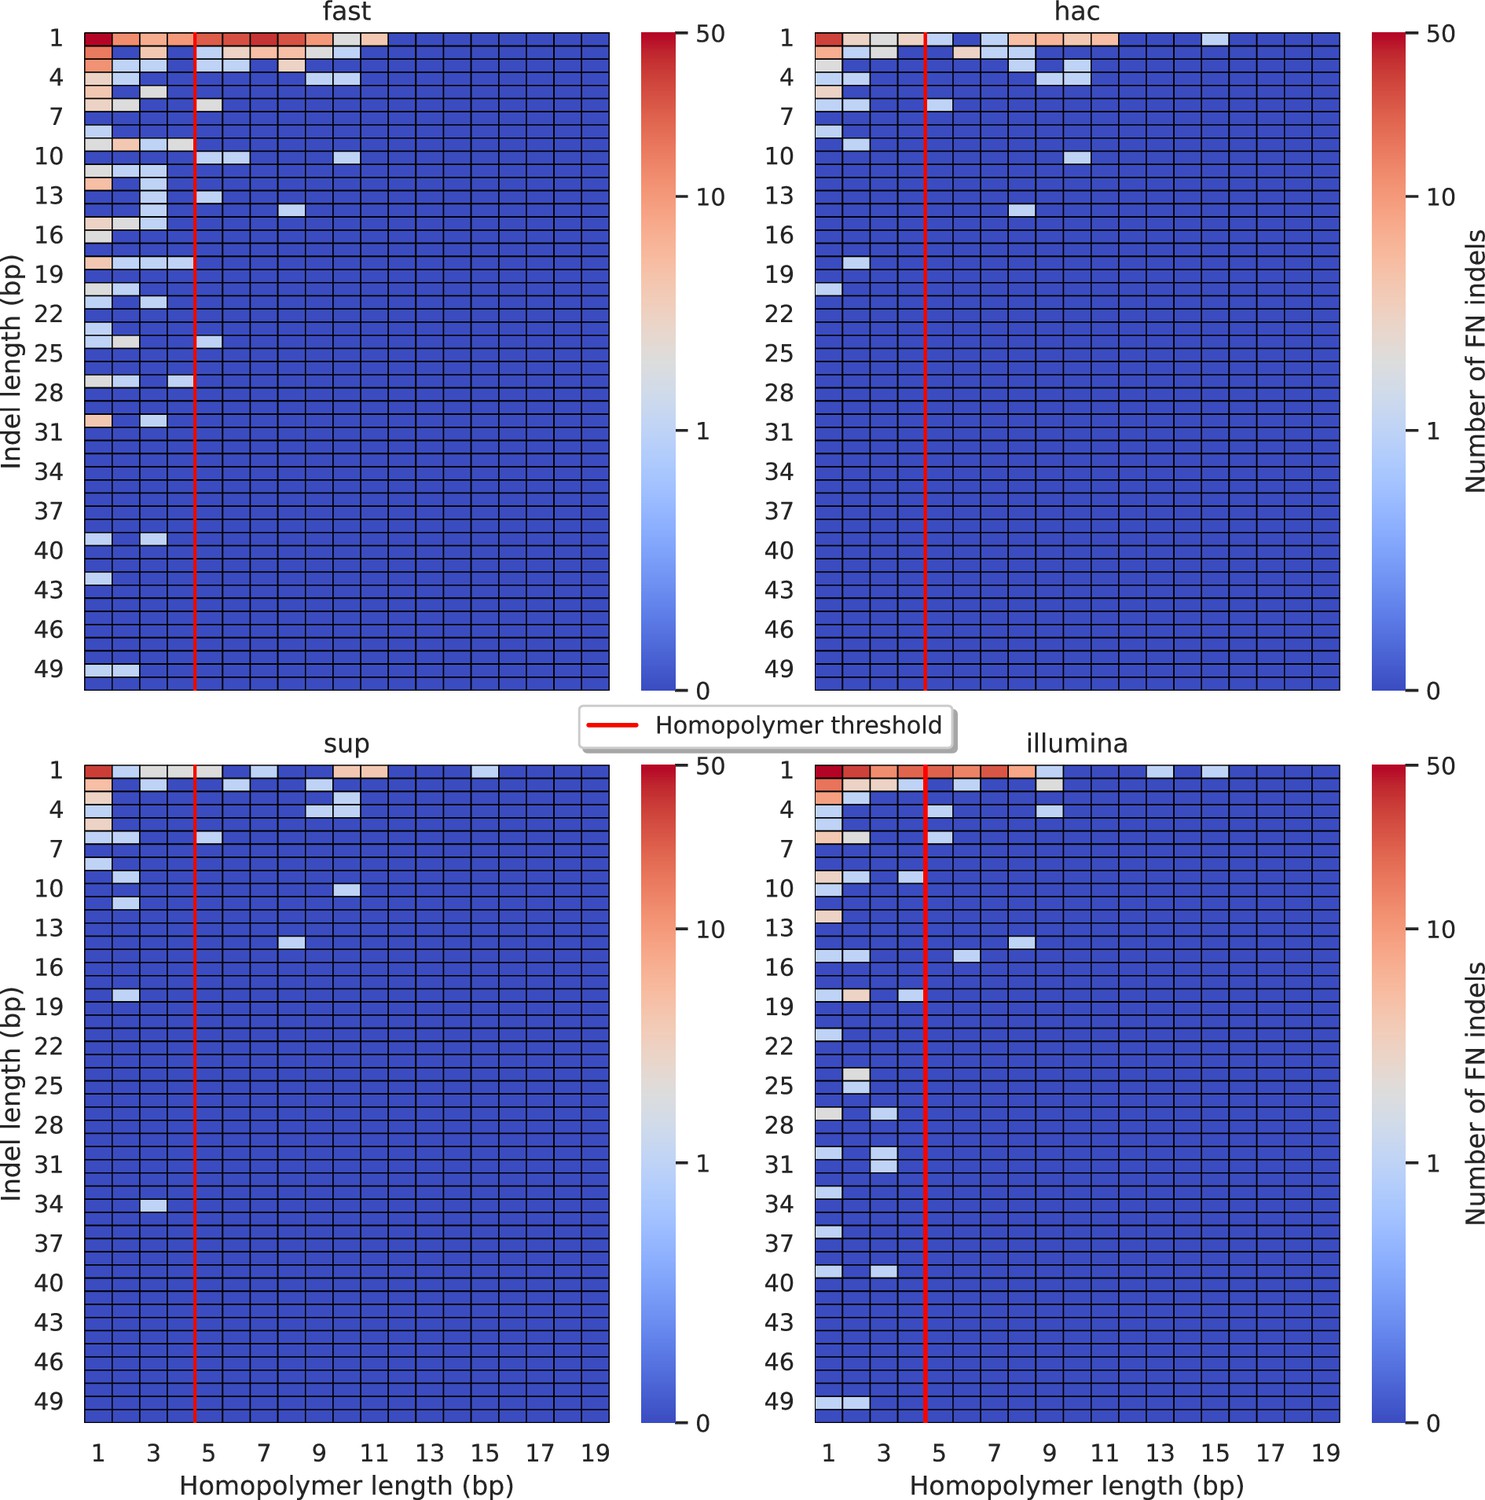
Relationship between indel length (x-axis) and homopolymer length (y-axis) for false negative (FN) indel calls for DeepVariant 100× simplex fast (top left), hac (top right), and sup (lower left) calls.
Illumina is shown in the lower right for reference. The vertical red line indicates the threshold above which we deem a run of the same nucleotide to be a ‘true’ homopolymer. Indel length is the number of bases inserted/deleted for an indel, whereas the homopolymer length indicates how long the tract of the same nucleotide is after the indel. The colour of a cell indicates number of FN indels of that indel-homopolymer length combination.
Figure 5—figure supplement 9
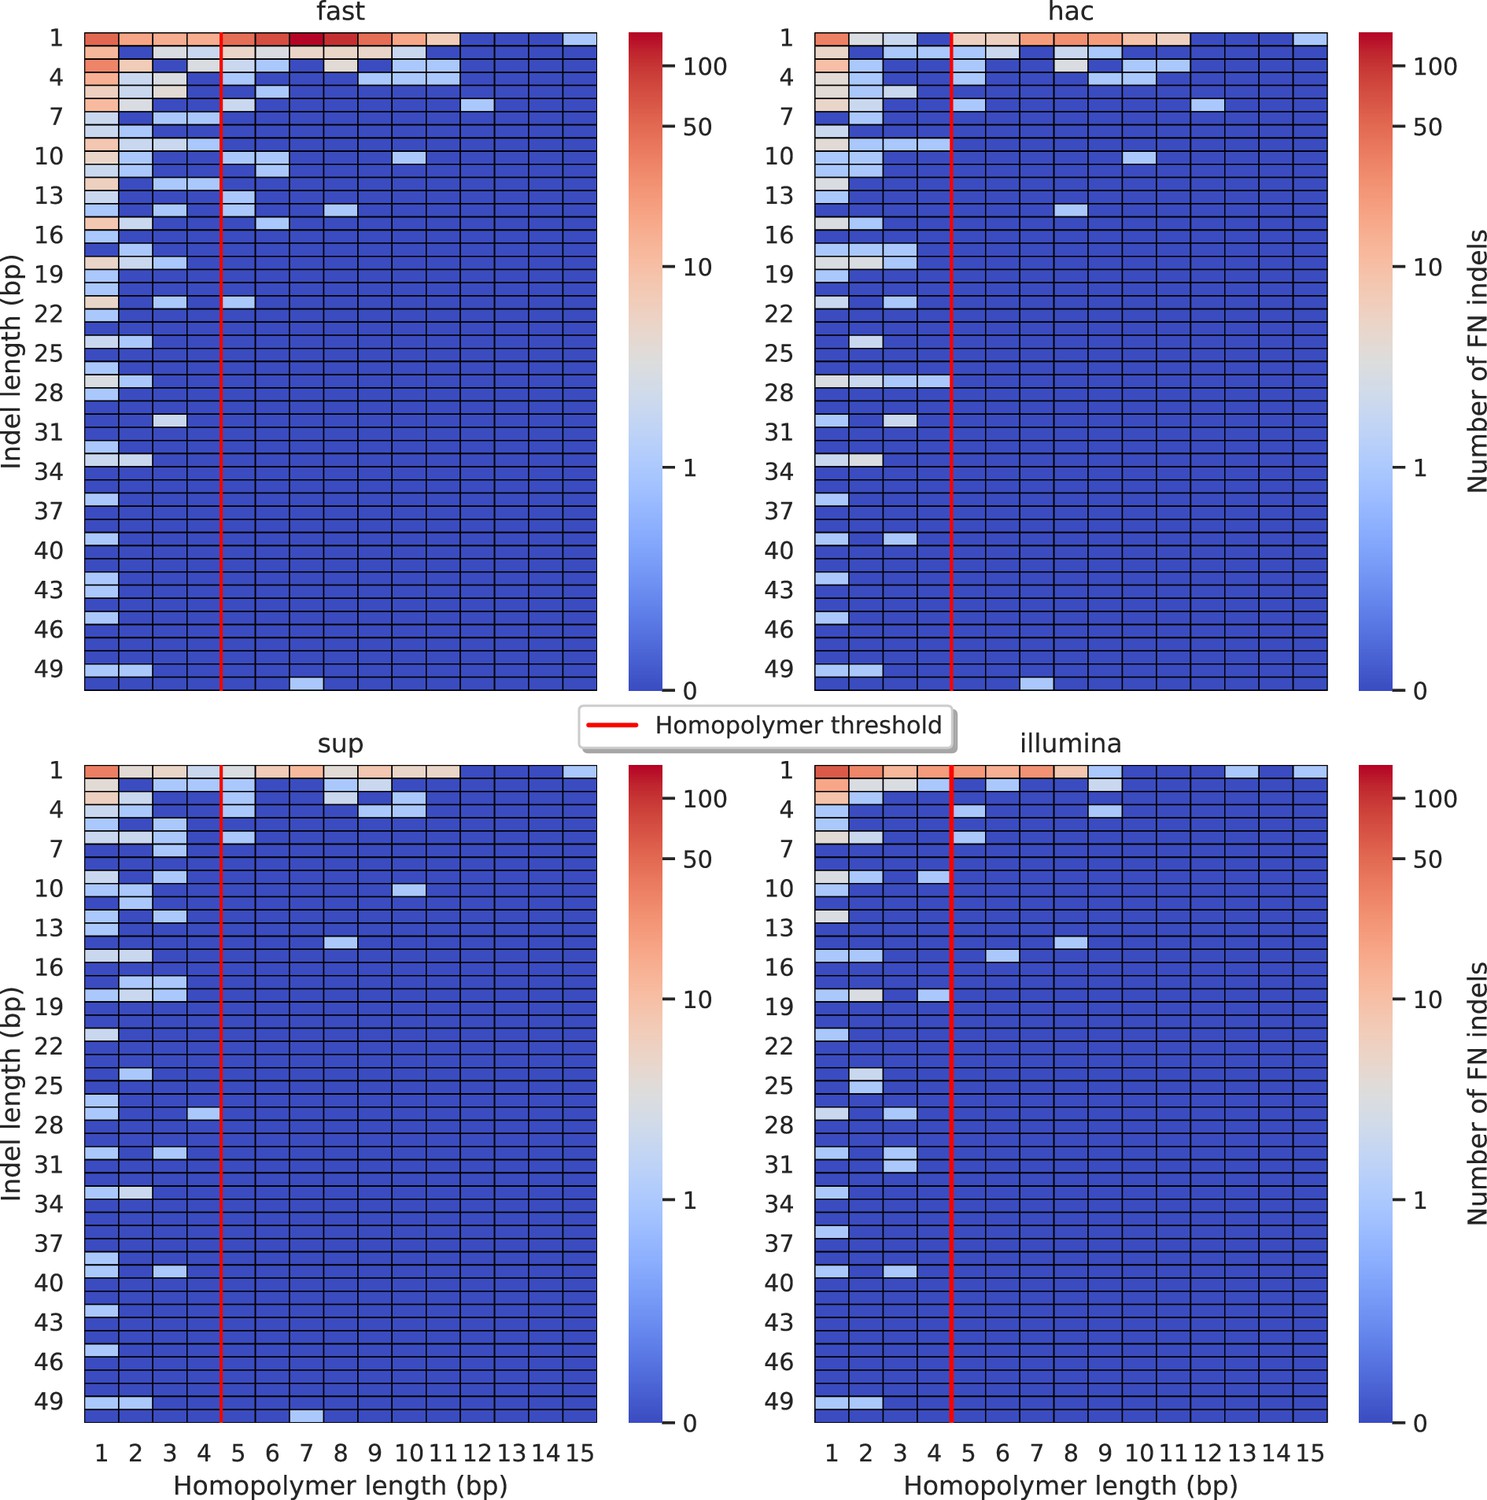
Relationship between indel length (x-axis) and homopolymer length (y-axis) for false negative (FN) indel calls for FreeBayes 100× simplex fast (top left), hac (top right), and sup (lower left) calls.
Illumina is shown in the lower right for reference. The vertical red line indicates the threshold above which we deem a run of the same nucleotide to be a ‘true’ homopolymer. Indel length is the number of bases inserted/deleted for an indel, whereas the homopolymer length indicates how long the tract of the same nucleotide is after the indel. The colour of a cell indicates number of FN indels of that indel-homopolymer length combination.
Figure 5—figure supplement 10
Relationship between indel length (x-axis) and homopolymer length (y-axis) for false negative (FN) indel calls for Medaka 100× simplex fast (top left), hac (top right), and sup (lower left) calls.
Illumina is shown in the lower right for reference. The vertical red line indicates the threshold above which we deem a run of the same nucleotide to be a ‘true’ homopolymer. Indel length is the number of bases inserted/deleted for an indel, whereas the homopolymer length indicates how long the tract of the same nucleotide is after the indel. The colour of a cell indicates number of FN indels of that indel-homopolymer length combination.
Figure 5—figure supplement 11
Relationship between indel length (x-axis) and homopolymer length (y-axis) for false negative (FN) indel calls for NanoCaller 100× simplex fast (top left), hac (top right), and sup (lower left) calls.
Illumina is shown in the lower right for reference. The vertical red line indicates the threshold above which we deem a run of the same nucleotide to be a ‘true’ homopolymer. Indel length is the number of bases inserted/deleted for an indel, whereas the homopolymer length indicates how long the tract of the same nucleotide is after the indel. The colour of a cell indicates number of FN indels of that indel-homopolymer length combination.
Figure 6
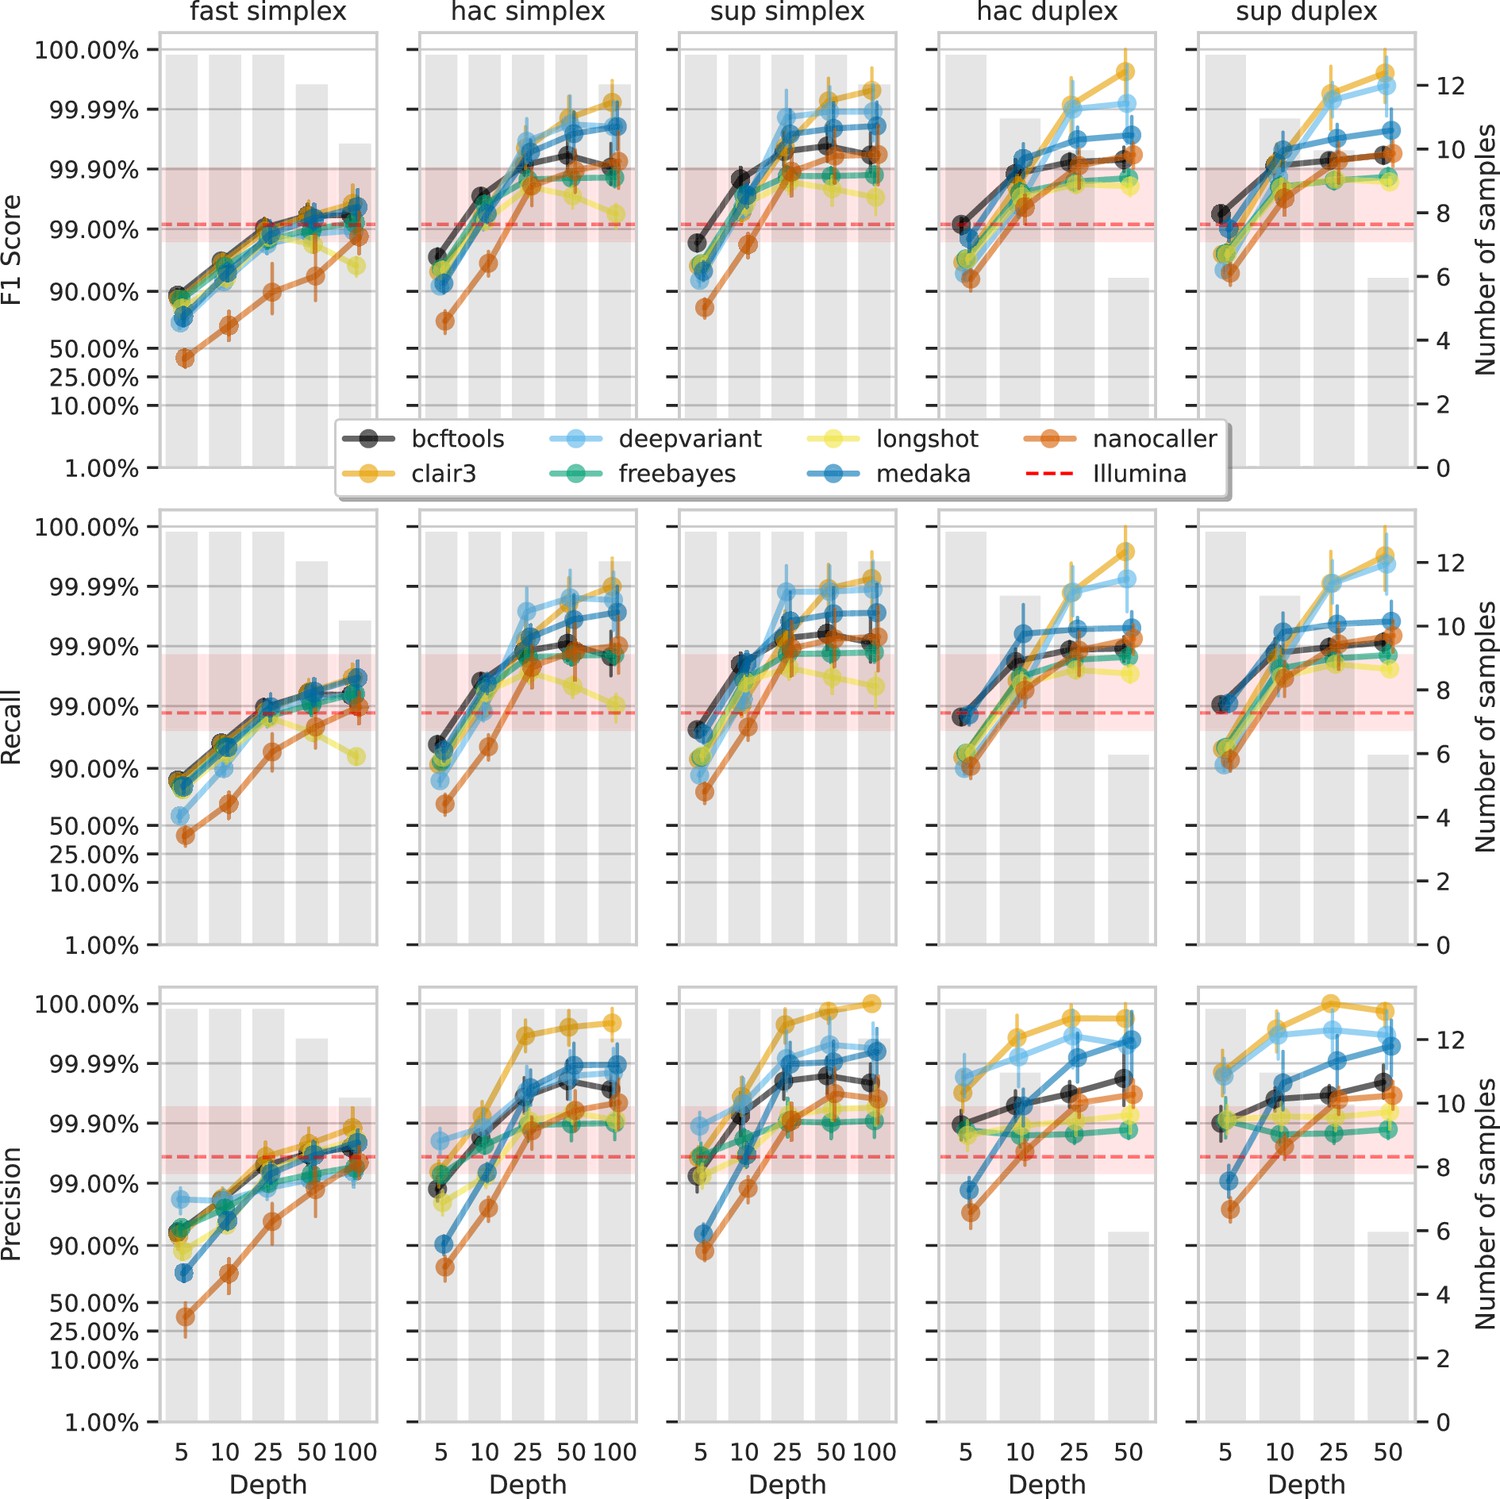
Effect of read depth (x-axis) on the highest SNP F1 score, and precision and recall at that F1 score (y-axis), for each variant caller (colours).
Each column is a basecall model and read type combination. The grey bars indicate the number of samples with at least that much read depth in the full read set. Samples with less than that depth were not used to calculate that depth’s metrics. Bars on each point at each depth depict the 95% confidence interval. The horizontal red dashed line is the full-depth Illumina value for that metric, with the red bands indicating the 95% confidence interval.
Figure 7
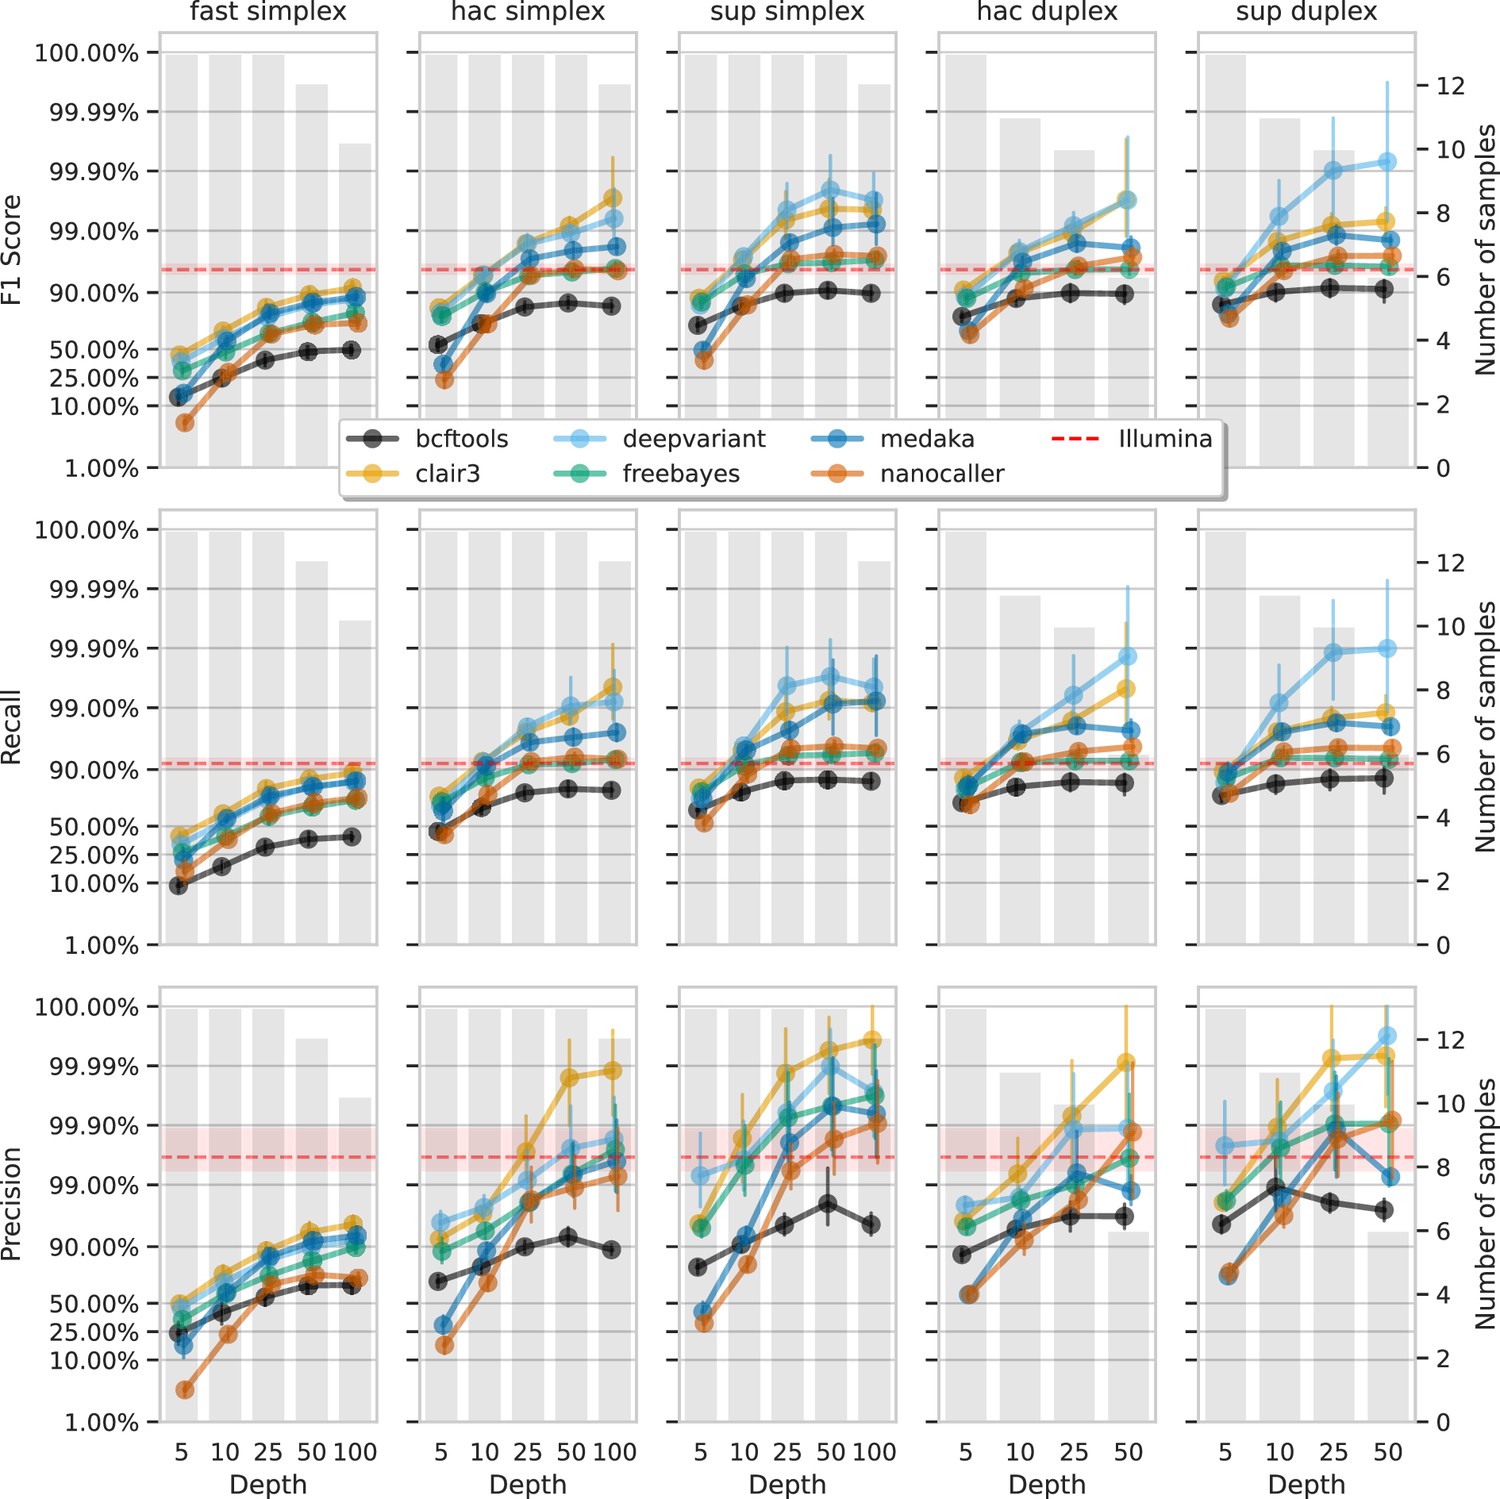
Effect of read depth (x-axis) on the highest indel F1 score, and precision and recall at that F1 score (y-axis), for each variant caller (colours).
Each column is a basecall model and read type combination. The grey bars indicate the number of samples with at least that much read depth in the full read set. Samples with less than that depth were not used to calculate that depth’s metrics. Bars on each point at each depth depict the 95% confidence interval. The horizontal red dashed line is the full-depth Illumina value for that metric, with the red bands indicating the 95% confidence interval.
Figure 8 with 1 supplement

Computational resource usage of alignment and each variant caller (y-axis and colours).
The top panel shows the maximum memory usage (x-axis) and the lower panel shows the runtime as a function of the CPU time (seconds) divided by the number of basepairs in the readset (seconds per megabasepairs; x-axis). Each point represents a single run across read depths, basecalling models, read types, and samples for that variant caller (or alignment).
s=seconds; m=minutes; MB = megabytes; GB = gigabytes; Mbp = megabasepairs.
Figure 8—figure supplement 1

Runtime of basecalling Oxford Nanopore Technologies (ONT) data with different models on GPUs.
Runtime is presented as seconds per megabasepairs, keeping consistent with Figure 8 from the main text. The y-axis represents basecalling with either 8 Nvidia A100 GPUs (cuda:all) or 1 A100 (cuda:single), with each stratified by basecalling model (colours). Points represent running a single sample-model combination, with each combination being run three times.
Appendix 2—figure 1
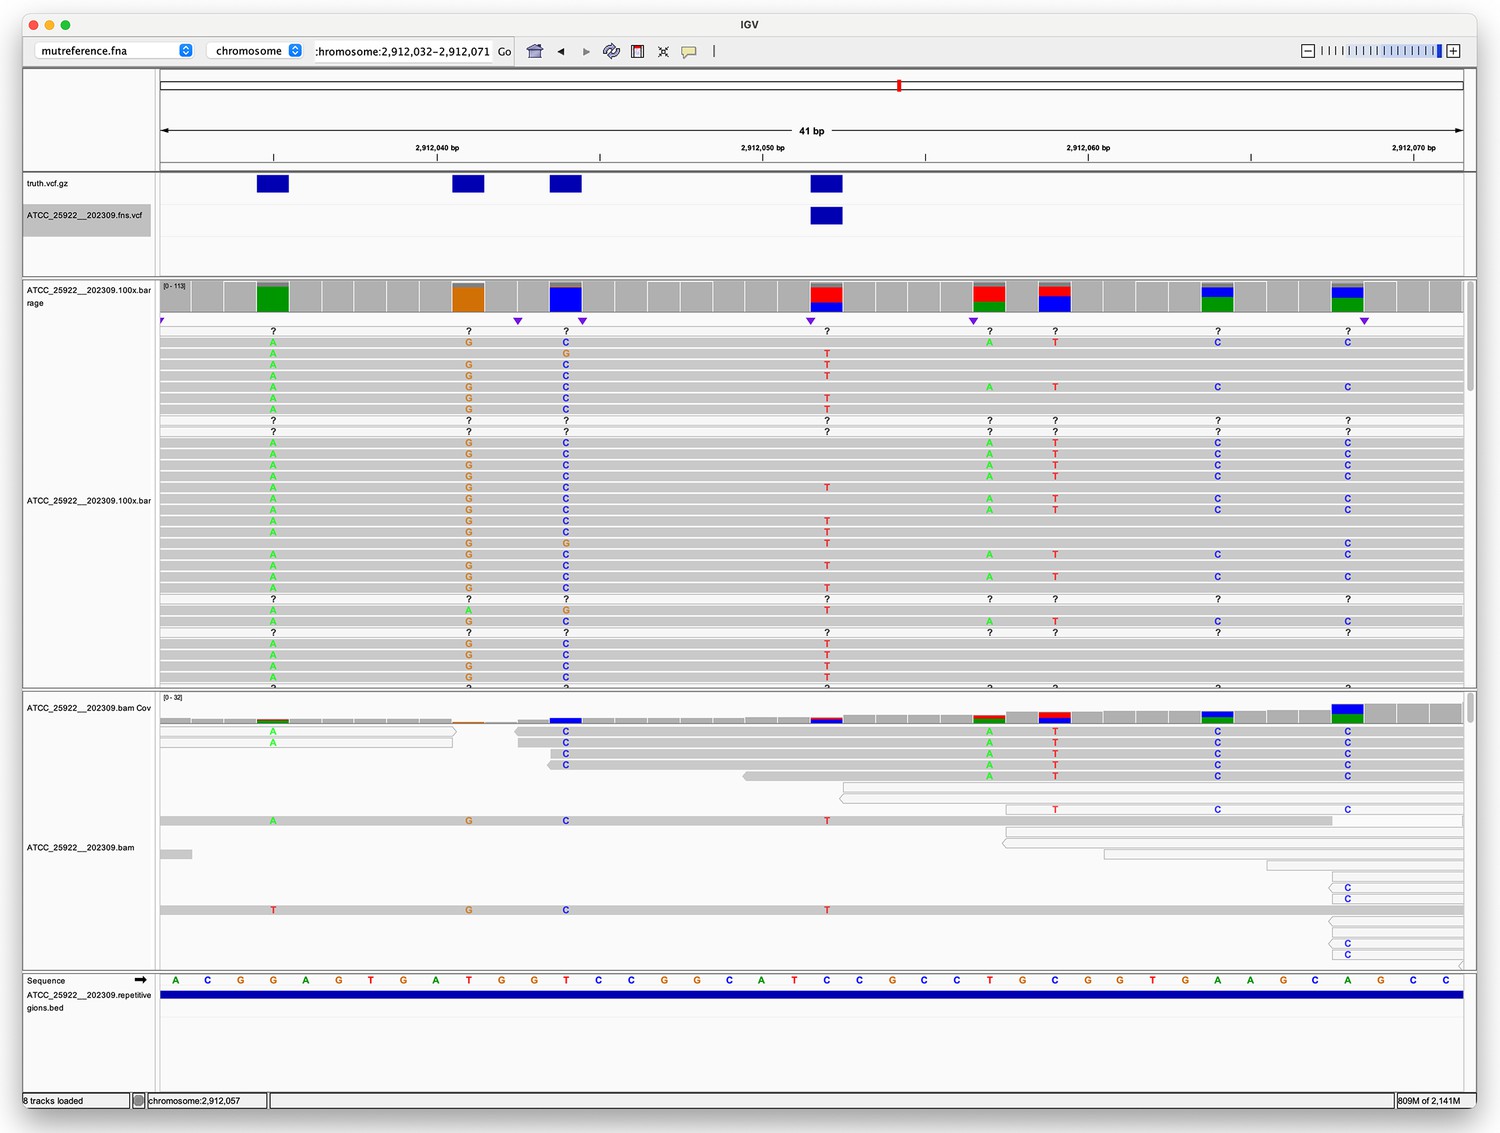
Pileup surrounding a Clair3 false negative variant.
The top track (four blue rectangles) shows true variants – i.e., variants we expect to find. The second track shows a single false negative variant. The third track shows the alignment of Oxford Nanopore Technologies (ONT) reads to this region, with coloured letters indicating where the aligned sequence disagrees with the reference. The fourth track shows the alignment of Illumina reads. The fifth track is the reference sequence. The bottom track shows repetitive regions (the whole region is repetitive as the blue rectangle spans the whole region in view).
Appendix 2—figure 2

Textual example of two small repetitive regions in sample ATCC_25922 that lead to a false negative at position 3 in sequence S1.
Positions 1 and 2 are two other variant positions where a true positive was obtained for S1 (the expected variants at positions 1 and 2 match the sequence in S2).
Tables
Table 1
Summary of the average nucleotide identity (ANI) and number of variants found between each sample and its donor genome.
| Sample | Species | ANI (%) | GC (%) | SNPs | Insertions | Deletions | Total variants |
|---|---|---|---|---|---|---|---|
| ATCC_33560__202309 | Campylobacter jejuni | 99.50 | 30.22 | 6369 | 117 | 106 | 6592 |
| ATCC_35221__202309 | Campylobacter lari | 98.64 | 29.81 | 16541 | 57 | 67 | 16665 |
| ATCC_25922__202309 | Escherichia coli | 99.50 | 50.42 | 4531 | 119 | 242 | 4892 |
| KPC2__202310 | Klebsiella pneumoniae | 99.50 | 57.15 | 15877 | 90 | 78 | 16045 |
| AJ292__202310 | Klebsiella variicola | 99.50 | 57.62 | 22850 | 95 | 98 | 23043 |
| ATCC_19119__202309 | Listeria ivanovii | 99.46 | 37.13 | 8451 | 187 | 259 | 8897 |
| ATCC_BAA-679__202309 | Listeria monocytogenes | 99.50 | 37.98 | 9090 | 66 | 78 | 9234 |
| ATCC_35897__202309 | Listeria welshimeri | 99.03 | 36.35 | 16953 | 130 | 133 | 17216 |
| AMtb_1__202402 | Mycobacterium tuberculosis | 99.73 | 65.62 | 2102 | 95 | 84 | 2281 |
| ATCC_10708__202309 | Salmonella enterica | 99.36 | 52.20 | 18784 | 210 | 189 | 19183 |
| BPH2947__202310 | Staphylococcus aureus | 99.48 | 32.80 | 7894 | 95 | 63 | 8052 |
| MMC234__202311 | Streptococcus dysgalactiae | 99.16 | 39.49 | 10474 | 82 | 100 | 10656 |
| RDH275__202311 | Streptococcus pyogenes | 99.50 | 38.32 | 5361 | 60 | 68 | 5489 |
| ATCC_17802__202309 | Vibrio parahaemolyticus | 98.75 | 45.32 | 57887 | 280 | 304 | 58471 |
Additional files
-
Supplementary file 1
Supplementary tables.
(a) Sequencing read quality metrics. (b) Full details of the donor genomes summarised in Table 1. (c) Summary of the F1 score, precision, and recall at the best F1 score for each variant caller. (d) Variant calling results for each sample across all conditions. (e) Variant call file (VCF) quality scores that produce the optimal F1 score. (f) Summary statistics of CPU and memory usage presented in Figure 8. (g) GPU basecalling runtime statistics. (h) Accession numbers and DOIs for each sample’s sequencing data. (i) Information about the sequencing strategy for each sample on each platform.
- https://cdn.elifesciences.org/articles/98300/elife-98300-supp1-v1.xlsx
-
MDAR checklist
- https://cdn.elifesciences.org/articles/98300/elife-98300-mdarchecklist1-v1.docx
Download links
A two-part list of links to download the article, or parts of the article, in various formats.
Downloads (link to download the article as PDF)
Open citations (links to open the citations from this article in various online reference manager services)
Cite this article (links to download the citations from this article in formats compatible with various reference manager tools)
Benchmarking reveals superiority of deep learning variant callers on bacterial nanopore sequence data
eLife 13:RP98300.
https://doi.org/10.7554/eLife.98300.3


