Interleukin-1 prevents SARS-CoV-2-induced membrane fusion to restrict viral transmission via induction of actin bundles
- The Center for Microbes, Development and Health, National Key Laboratory of Immune Response and Immunotherapy, Shanghai Institute of Immunity and Infection, Chinese Academy of Sciences, University of Chinese Academy of Sciences, China
- Shanghai Municipal Center for Disease Control and Prevention, China
- The First Affiliated Hospital of Guangzhou Medical University, State Key Laboratory of Respiratory Disease, National Clinical Research Center for Respiratory Disease, Guangzhou Institute of Respiratory Health, China
- School of Life Sciences, Soochow University, China
- Shanghai Blood Center, China
Figures
Figure 1 with 2 supplements
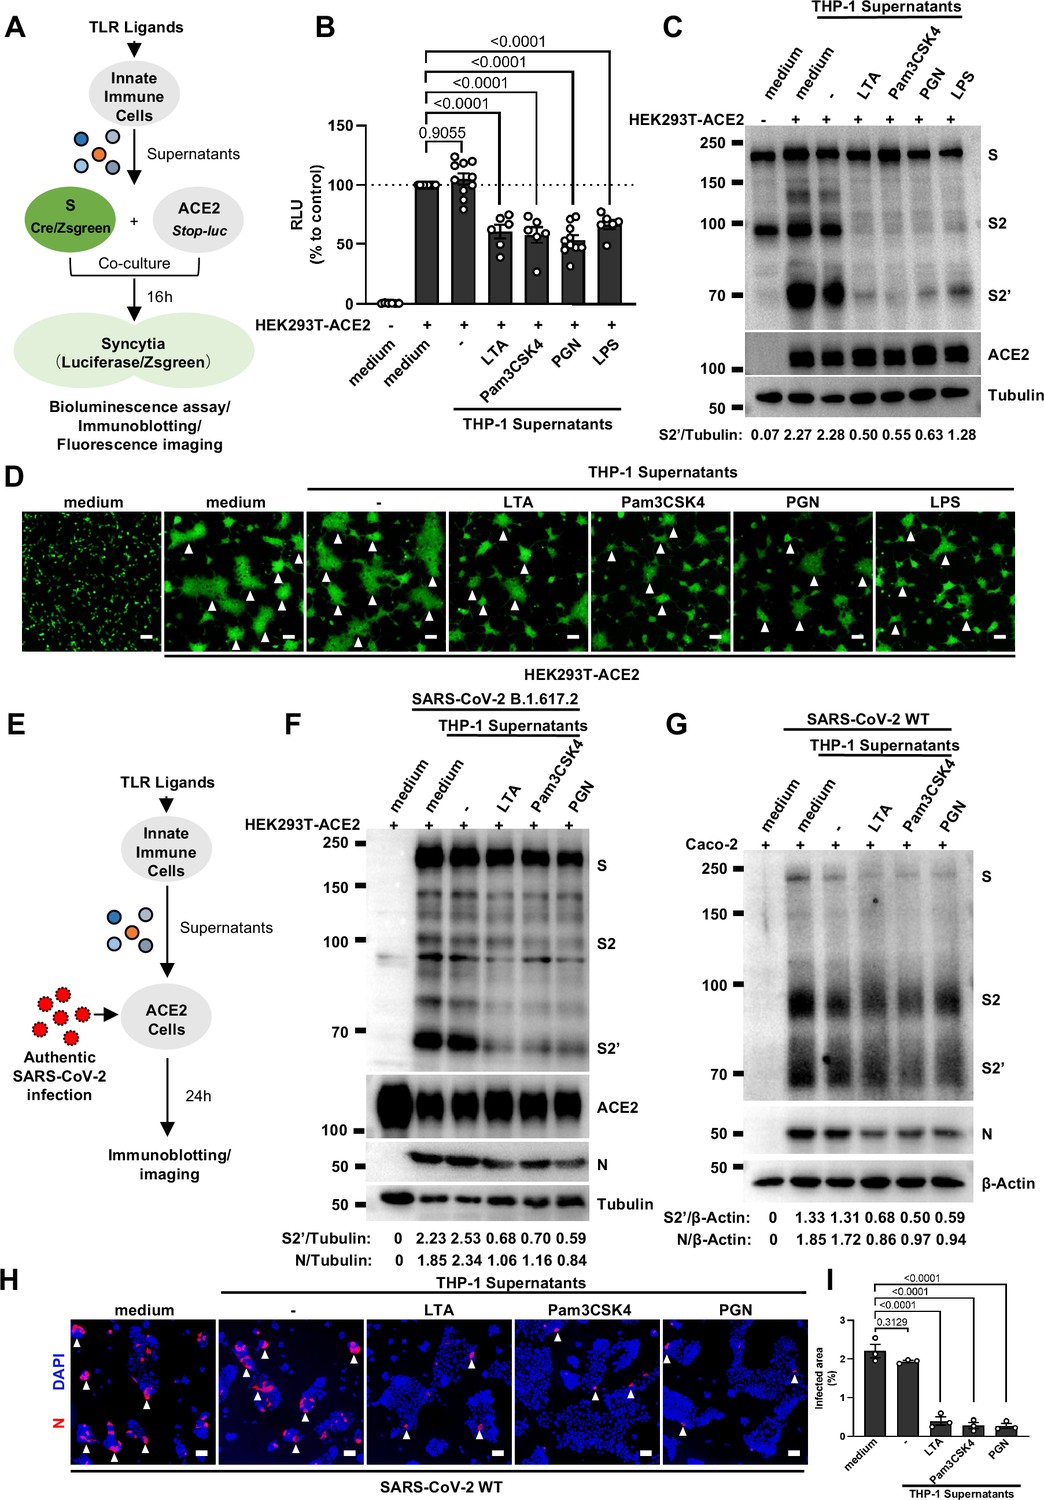
Host factors secreted by activated innate immune cells inhibit severe acute respiratory syndrome coronavirus 2 (SARS-CoV-2)-induced cell-cell fusion.
(A) Schematics of the cell-cell fusion model used to quantify spike-mediated syncytium formation upon treatment with cell culture supernatants from Toll-like receptor (TLR) ligands-stimulated innate immune cells. Cells co-expressing SARS-CoV-2 spike and Cre were co-cultured with ACE2 and Stop-luc co-expressing HEK293T cells for 16 hr, before cell lysates were collected for bioluminescence assay and immunoblotting. Cells co-expressing SARS-CoV-2 spike and ZsGreen were co-cultured with ACE2 expressing HEK293T cells for 16 hr before fluorescence imaging. (B) Luciferase activity (relative luminescence units [RLU]) measured from HEK293T cell lysates collected from THP-1 supernatants-treated HEK293T-S and HEK293T-ACE2 described in (A) for 16 hr. Fetal bovine serum (FBS)-free RPMI 1640 served as medium control. Data are representative of six individual repeats and displayed as individual points with mean ± standard error of the mean (SEM). (C) Immunoblots showing full-length spike, S2, cleaved S2’, and ACE2 collected from THP-1 supernatants-treated HEK293T-S and HEK293T-ACE2 described in (A) for 16 hr. Blots are representative of three independent experiments. Numbers below the blots indicated the intensity of S2’ versus Tubulin. (D) Representative fluorescent image captured at 488 nm from THP-1 supernatants-treated HEK293T-S-ZsGreen and HEK293T-ACE2 for 16 hr. (E) Schematic presentation of THP-1 supernatants pre-treatment on authentic SARS-CoV-2-infected cells. Pre-treatment of HEK293T-ACE2 cells with THP-1 supernatants for 1 hr, then inoculated with 0.5 multiplicity of infection (MOI) Delta or wild-type (WT) authentic SARS-CoV-2 virus. Imaging was performed at 24 hr post-infection (hpi) before cell lysates were harvested for immunoblotting. (F) Immunoblots of Delta SARS-CoV-2 S, S2, cleaved S2’, N, and ACE2 proteins collected from HEK293T-ACE2 cells 24 hpi as described in (E). Blots are representative of three individual experiments. Numbers below the blots indicated the intensity of S2’ or N versus Tubulin. (G) Immunoblots of WT SARS-CoV-2 S, S2, cleaved S2’, and N proteins collected from Caco-2 cells 24 hpi as described in (E). Blots are representative of three individual experiments. Numbers below the blots indicated the intensity of S2’ or N versus β-Actin. (H) Immunofluorescent images showing morphology of SARS-CoV-2-infected Caco-2 cells pre-treated with THP-1 supernatants. Anti-SARS-CoV-2 N was stained with Alexa Fluor 555, and nuclei were counterstained with DAPI, respectively. White arrowheads (D and H) indicate syncytia formation or infected cells, scale bars are indicative of 50 μm, and images are representative of three independent experiments. (I) Quantification of the infected area in (H).
-
Figure 1—source data 1
Annotated, uncropped blots in Figure 1.
- https://cdn.elifesciences.org/articles/98593/elife-98593-fig1-data1-v1.pdf
-
Figure 1—source data 2
Raw, uncropped blots in Figure 1.
- https://cdn.elifesciences.org/articles/98593/elife-98593-fig1-data2-v1.zip
-
Figure 1—source data 3
Source data of the individual points in Figure 1.
- https://cdn.elifesciences.org/articles/98593/elife-98593-fig1-data3-v1.xlsx
Figure 1—figure supplement 1
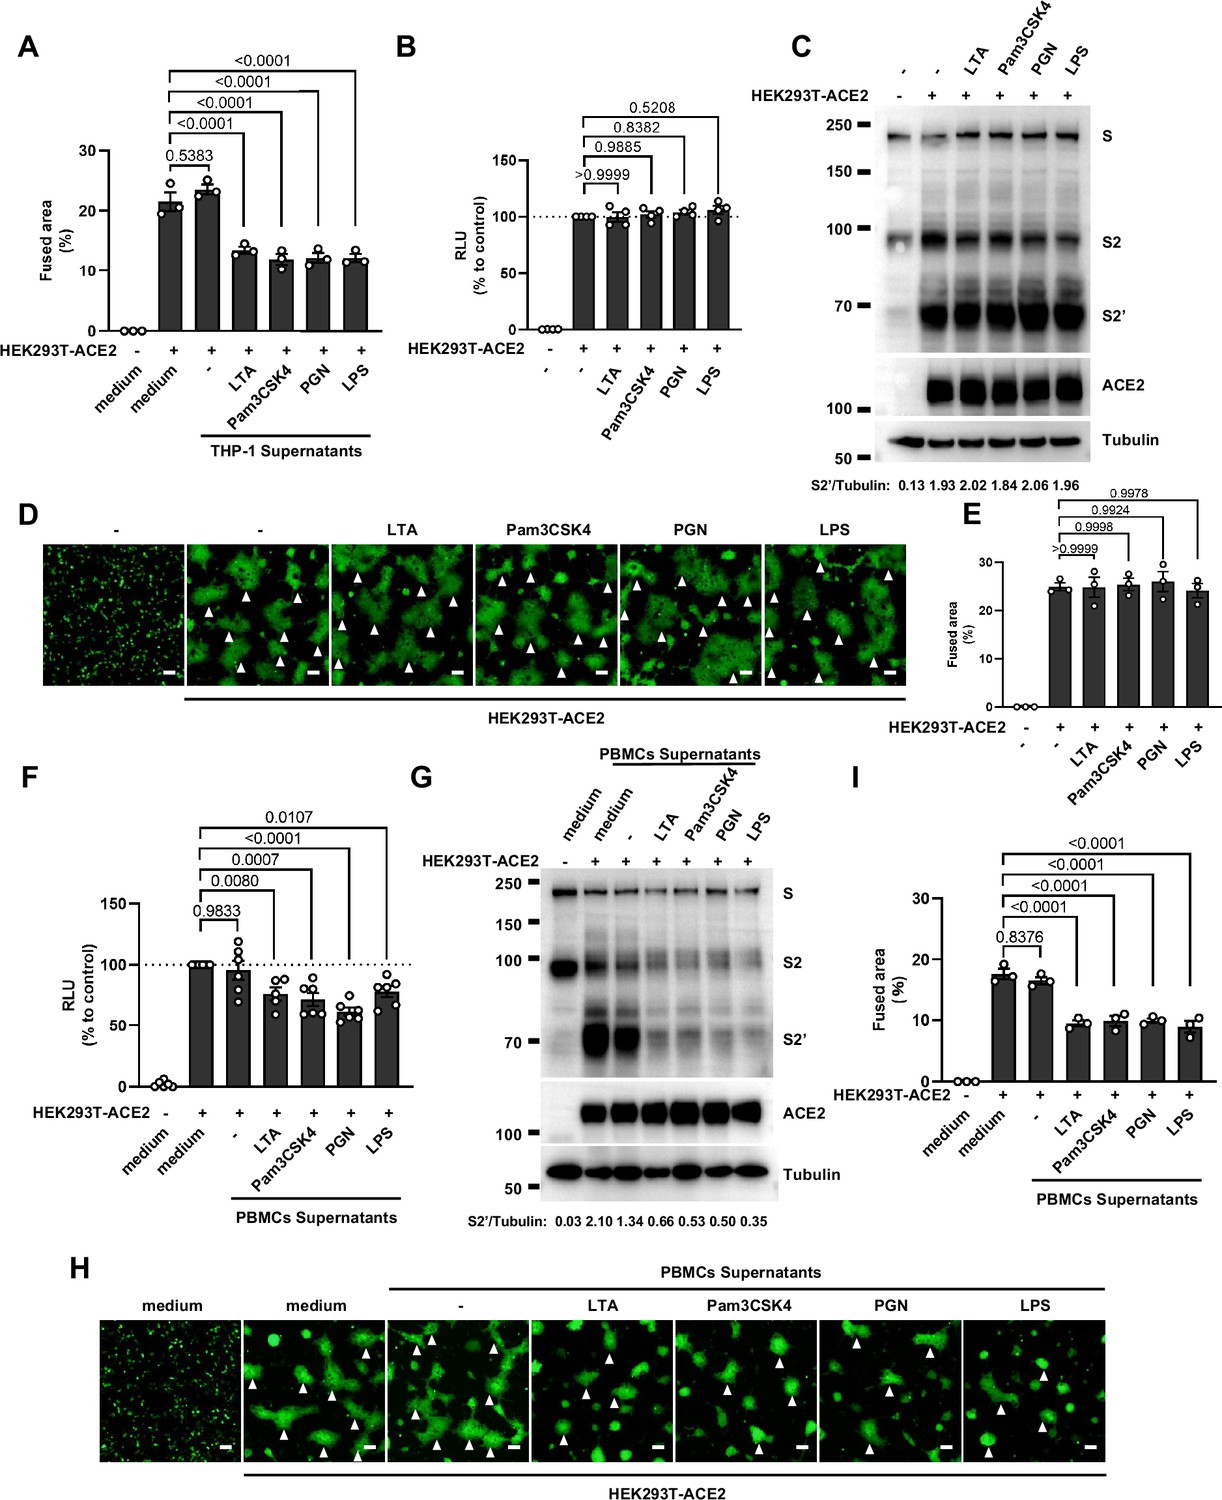
Host factors secreted by activated peripheral blood mononuclear cells (PBMCs) inhibit severe acute respiratory syndrome coronavirus 2 (SARS-CoV-2) spike-induced cell-cell fusion, but Toll-like receptors (TLR) ligands alone have no effect.
(A) Quantification of the fused area in Figure 1D. (B) Luciferase activity (relative luminescence units [RLU]) measured from HEK293T cell lysates collected from TLR ligands-treated HEK293T-S and HEK293T-ACE2 for 16 hr. Data are representative of four individual repeats and displayed as individual points with mean ± standard error of the mean (SEM). (C) Immunoblots showing full-length spike, S2, cleaved S2’, and ACE2 collected from TLR ligands-treated HEK293T-S and HEK293T-ACE2 for 16 hr. Blots are representative of three independent experiments. Numbers below the blots indicated the intensity of S2’ versus Tubulin. (D) Representative fluorescent image captured at 488 nm from TLR ligands-treated HEK293T-S-ZsGreen and HEK293T-ACE2 for 16 hr. (E) Quantification of the infected area in (D). (F) Luciferase activity (RLU) measured from HEK293T cell lysates collected from PBMCs supernatants-treated HEK293T-S and HEK293T-ACE2 for 16 hr. 1% fetal bovine serum (FBS) RPMI 1640 served as medium control. Data are representative of five individual repeats and displayed as individual points with mean ± SEM. (G) Immunoblots showing full-length spike, S2, cleaved S2’, and ACE2 collected from PBMCs supernatants-treated HEK293T-S and HEK293T-ACE2 for 16 hr. Blots are representative of three independent experiments. Numbers below the blots indicated the intensity of S2’ versus Tubulin. (H) Representative fluorescent image captured at 488 nm from PBMCs supernatants-treated HEK293T-S-ZsGreen and HEK293T-ACE2 for 16 hr. White arrowheads (D and H) indicate syncytia formation. Scale bars, 50 μm. Images are representative of three individual repeats. (I) Quantification of the fused area in (H).
-
Figure 1—figure supplement 1—source data 1
Annotated, uncropped blots in Figure 1—figure supplement 1.
- https://cdn.elifesciences.org/articles/98593/elife-98593-fig1-figsupp1-data1-v1.pdf
-
Figure 1—figure supplement 1—source data 2
Raw, uncropped blots in Figure 1—figure supplement 1.
- https://cdn.elifesciences.org/articles/98593/elife-98593-fig1-figsupp1-data2-v1.zip
-
Figure 1—figure supplement 1—source data 3
Source data of the individual points in Figure 1—figure supplement 1.
- https://cdn.elifesciences.org/articles/98593/elife-98593-fig1-figsupp1-data3-v1.xlsx
Figure 1—figure supplement 2
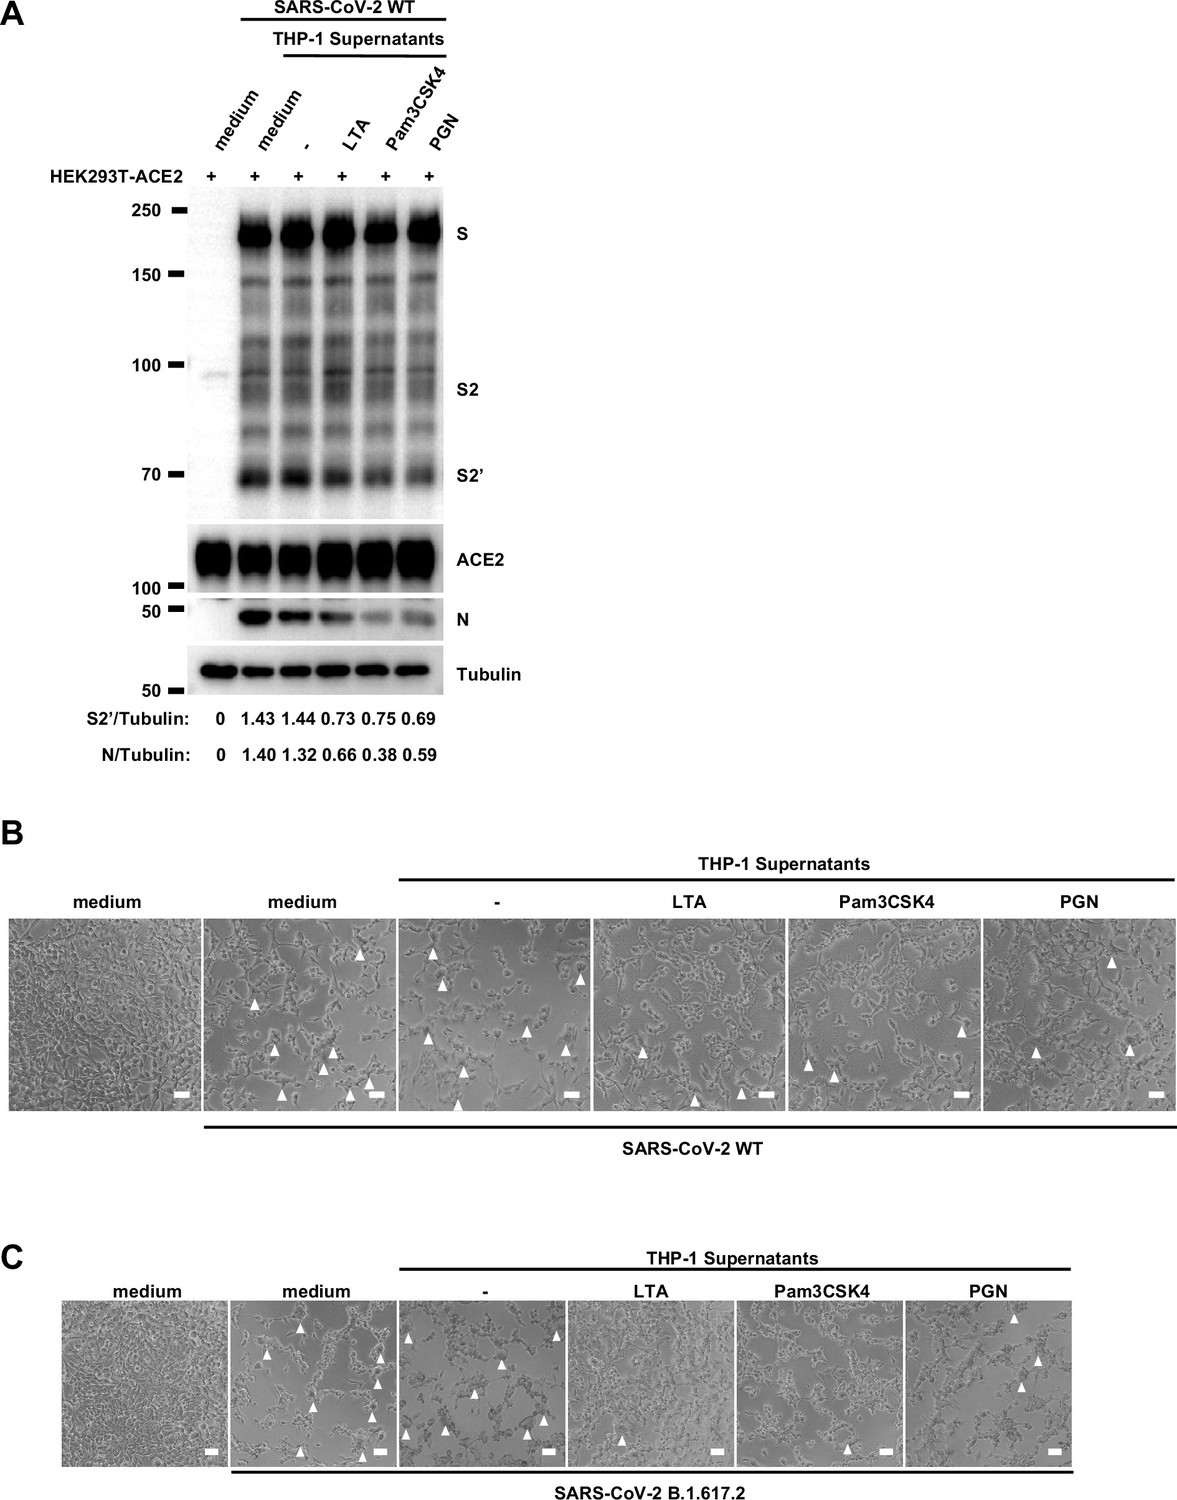
Host factors secreted by activated THP-1 cells inhibit authentic severe acute respiratory syndrome coronavirus 2 (SARS-CoV-2)-induced cell-cell fusion.
(A) Immunoblots of wild-type (WT) SARS-CoV-2 S, S2, cleaved S2’, and N proteins collected from HEK293T-ACE2 cells 24 hr post-infection (hpi) as described in Figure 1E. Blots are representative of three individual experiments. Numbers below the blots indicated the intensity of S2’ or N versus Tubulin. (B, C) Bright-field images of 0.5 multiplicity of infection (MOI) WT (B) or Delta (C) SARS-CoV-2-infected HEK293T-ACE2 cells pre-treated with THP-1 supernatants. White arrowheads indicate syncytia formation, scale bars are indicative of 50 μm, and images are representative of three independent experiments.
-
Figure 1—figure supplement 2—source data 1
Annotated, uncropped blots in Figure 1—figure supplement 2.
- https://cdn.elifesciences.org/articles/98593/elife-98593-fig1-figsupp2-data1-v1.pdf
-
Figure 1—figure supplement 2—source data 2
Raw, uncropped blots in Figure 1—figure supplement 2.
- https://cdn.elifesciences.org/articles/98593/elife-98593-fig1-figsupp2-data2-v1.zip
Figure 2 with 7 supplements
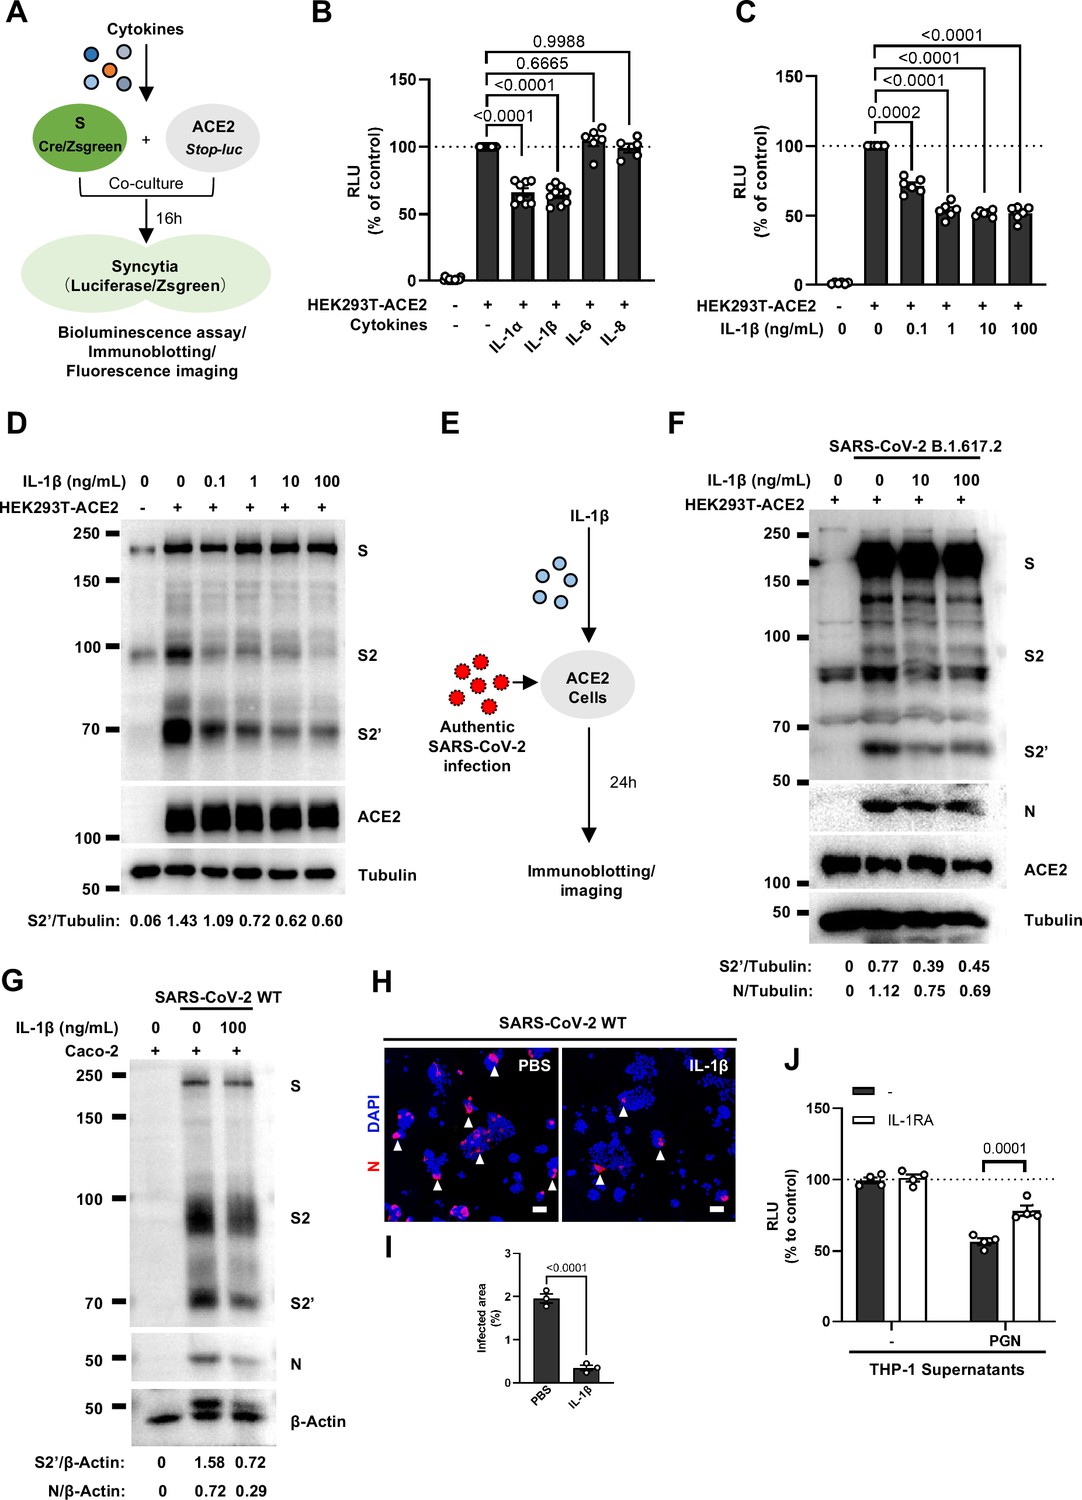
Interleukin-1β (IL-1β) inhibits severe acute respiratory syndrome coronavirus 2 (SARS-CoV-2)-induced cell-cell fusion.
(A) Schematics of the cell-cell fusion model used to quantify spike-mediated syncytium formation upon treatment with different cytokines. Cells co-expressing SARS-CoV-2 spike and Cre were co-cultured with ACE2 and Stop-luc co-expressing HEK293T cells for 16 hr, before cell lysates were collected for bioluminescence assay and immunoblotting. Cells co-expressing SARS-CoV-2 spike and ZsGreen were co-cultured with ACE2 expressing HEK293T cells for 16 hr before fluorescence imaging. (B) Luciferase activity (relative luminescence units [RLU]) measured from HEK293T cell lysates collected from different cytokines-treated HEK293T-S and HEK293T-ACE2 described in (A) for 16 hr. IL-1α (10 ng/mL), IL-1β (1 ng/mL), IL-6 (100 ng/mL), or IL-8 (100 ng/mL) were added into the cell-cell fusion system. Data are representative of six individual repeats and displayed as individual points with mean ± standard error of mean (SEM). (C) Luciferase activity (RLU) measured from HEK293T cell lysates collected from different concentrations of IL-1β-treated HEK293T-S and HEK293T-ACE2 for 16 hr. Data are representative of six individual repeats and displayed as individual points with mean ± SEM. (D) Immunoblots showing full-length spike, S2, cleaved S2’, and ACE2 collected from different concentrations of IL-1β-treated HEK293T-S and HEK293T-ACE2 for 16 hr. Blots are representative of three independent experiments. Numbers below the blots indicated the intensity of S2’ versus Tubulin. (E) Schematic presentation of IL-1β pre-treatment on authentic SARS-CoV-2-infected cells. Pre-treatment of HEK293T-ACE2 cells with different concentrations of IL-1β for 1 hr, then inoculated with 0.5 multiplicity of infection (MOI) Delta or wild-type (WT) authentic SARS-CoV-2 virus. Bright-field images were captured at 24 hr post-infection (hpi) before cell lysates were harvested for immunoblotting. (F) Immunoblots of Delta SARS-CoV-2 S, S2, cleaved S2’, N, and ACE2 proteins collected from HEK293T-ACE2 cells 24 hpi as described in (E). Blots are representative of three individual experiments. Numbers below the blots indicated the intensity of S2’ or N versus Tubulin. (G) Immunoblots of WT SARS-CoV-2 S, S2, cleaved S2’, and N proteins collected from Caco-2 cells 24 hpi as described in (E). Blots are representative of three individual experiments. Numbers below the blots indicated the intensity of S2’ or N versus β-Actin. (H) Immunofluorescent images showing morphology of SARS-CoV-2-infected Caco-2 cells pre-treated with or without IL-1β. Anti-SARS-CoV-2 N was stained with Alexa Fluor 555, and nuclei were counterstained with DAPI, respectively. White arrowheads indicate syncytia formation or infected cells, scale bars are indicative of 50 μm and images are representative of three independent experiments. (I) Quantification of the infected area in (H). (J) Luciferase activity (RLU) measured from THP-1 supernatants-treated HEK293T-S and HEK293T-ACE2 in the presence or absence of IL-1 receptor antagonist (IL-1RA). Data are representative of four individual repeats and displayed as individual points with mean ± SEM.
-
Figure 2—source data 1
Annotated, uncropped blots in Figure 2.
- https://cdn.elifesciences.org/articles/98593/elife-98593-fig2-data1-v1.pdf
-
Figure 2—source data 2
Raw, uncropped blots in Figure 2.
- https://cdn.elifesciences.org/articles/98593/elife-98593-fig2-data2-v1.zip
-
Figure 2—source data 3
Source data of the individual points in Figure 2.
- https://cdn.elifesciences.org/articles/98593/elife-98593-fig2-data3-v1.xlsx
Figure 2—figure supplement 1
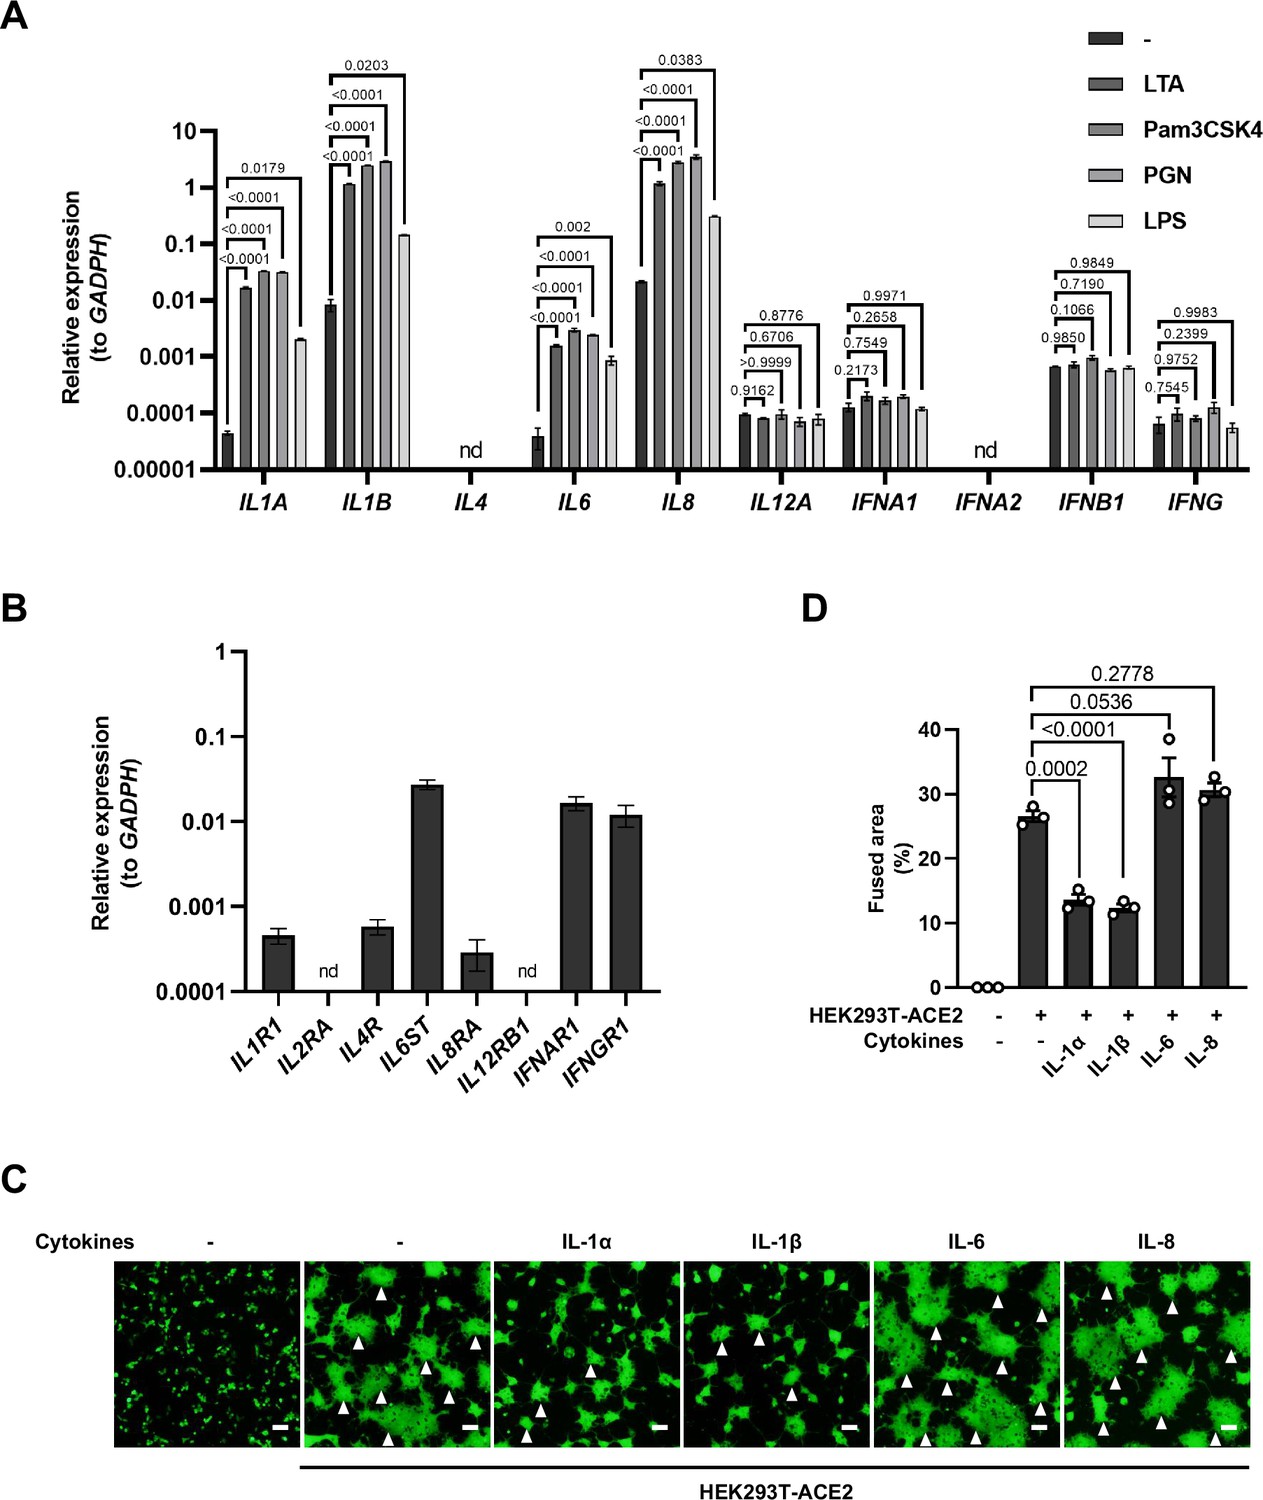
mRNA levels of different cytokine genes in THP-1 cells and selected cytokine receptor genes in HEK293T cells, as well as fluorescent images indicating cell-cell fusion in the presence of indicated cytokines.
(A) mRNA levels of different cytokine genes in THP-1 cells after Toll-like receptor (TLR) ligands stimulation for 4 hr. Data are representative of three individual repeats. (B) mRNA levels of indicated cytokine receptor genes in HEK293T cells. Data are representative of five individual repeats. (C) Representative fluorescent image captured at 488 nm from different cytokines-treated HEK293T-S-ZsGreen and HEK293T-ACE2 for 16 hr. White arrowheads indicate syncytia formation. Scale bars, 50 μm. Images are representative of three individual repeats. (D) Quantification of the fused area in (C).
-
Figure 2—figure supplement 1—source data 1
Source data of the individual points in Figure 2—figure supplement 1.
- https://cdn.elifesciences.org/articles/98593/elife-98593-fig2-figsupp1-data1-v1.xlsx
Figure 2—figure supplement 2
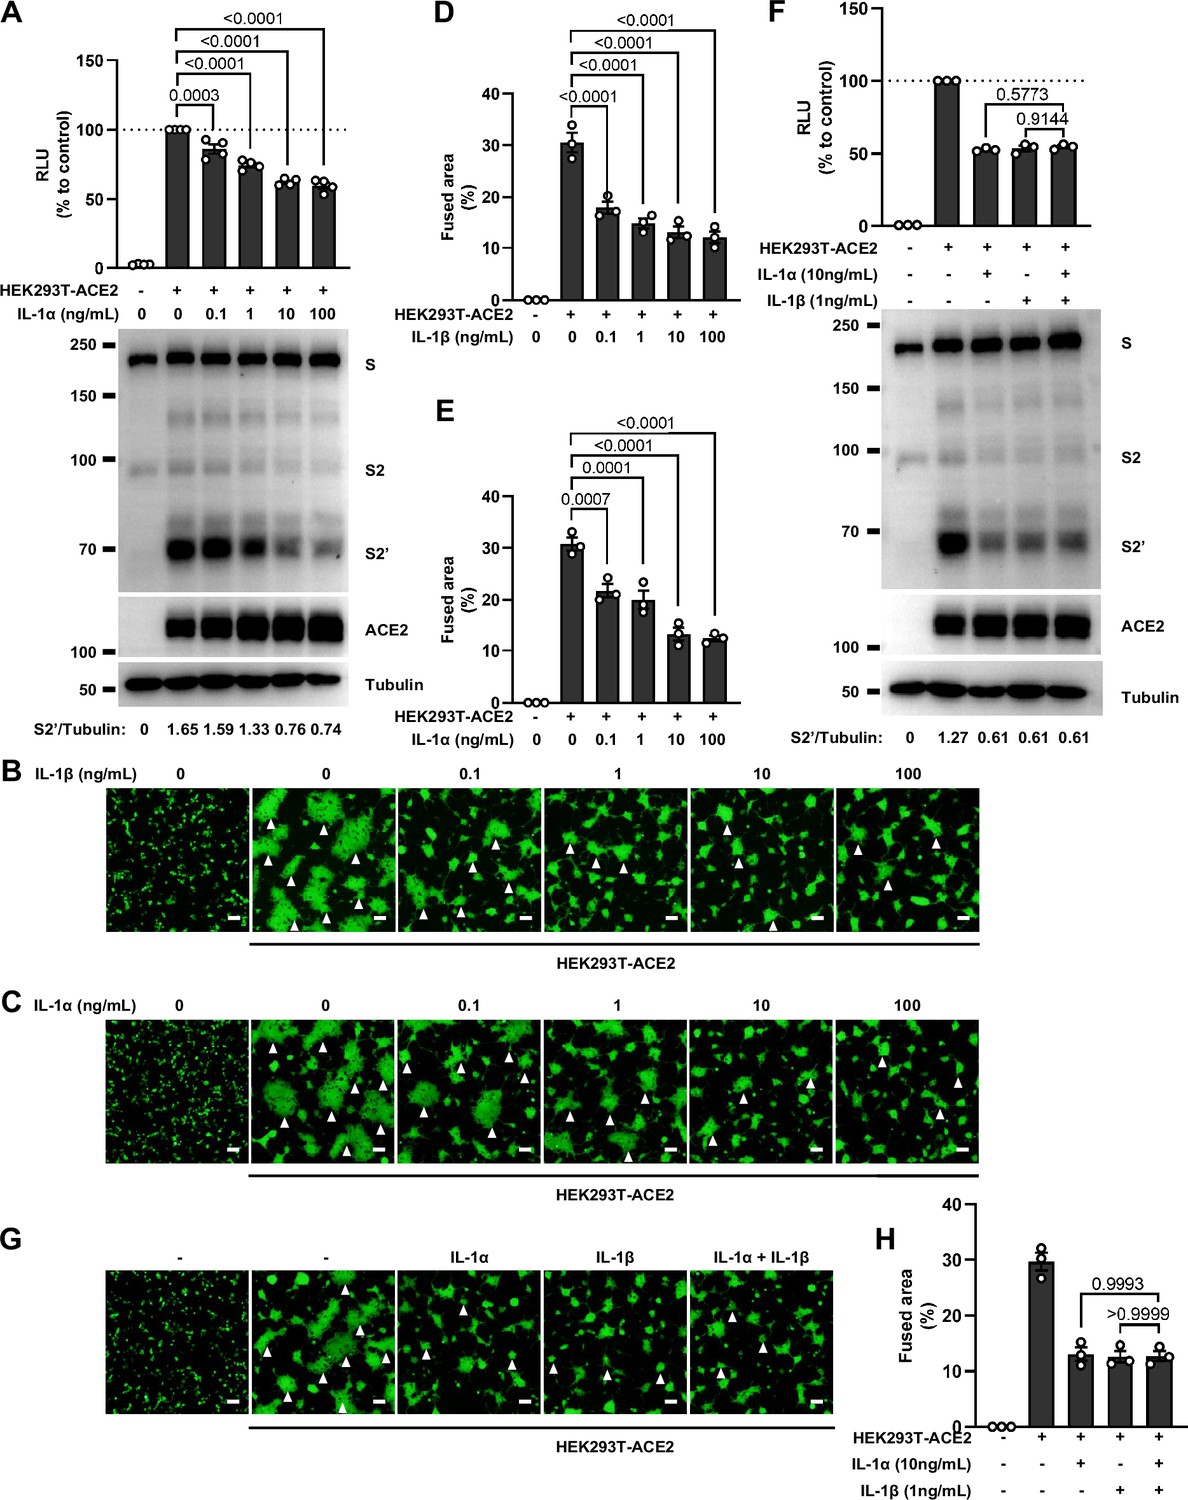
No synergistic inhibition of severe acute respiratory syndrome coronavirus 2 (SARS-CoV-2) spike-induced cell-cell fusion by interleukin-1α (IL-1α) and IL-1β co-treatment.
(A) Luciferase activity (relative luminescence units [RLU]) measured from HEK293T cell lysates and immunoblots showing full-length spike, S2, cleaved S2’, and ACE2 collected from different concentrations of IL-1α-treated HEK293T-S and HEK293T-ACE2 for 16 hr. Data and blots are representative of four individual repeats. Numbers below the blots indicated the intensity of S2’ versus Tubulin. (B, C) Representative fluorescent image captured at 488 nm from different concentrations of IL-1β (B) or IL-1α (C) treated HEK293T-S-ZsGreen and HEK293T-ACE2 for 16 hr. (D) Quantification of the fused area in (B). (E) Quantification of the fused area in (C). (F) Luciferase activity (RLU) measured from HEK293T cell lysates and immunoblots showing full-length spike, S2, cleaved S2’, and ACE2 collected from IL-1α and IL-1β co-treated HEK293T-S and HEK293T-ACE2 for 16 hr. Data and blots are representative of three individual repeats. Numbers below the blots indicated the intensity of S2’ versus Tubulin. (G) Representative fluorescent image captured at 488 nm from IL-1α and IL-1β co-treated HEK293T-S-ZsGreen and HEK293T-ACE2 for 16 hr. White arrowheads (B, C, and G) indicate syncytia formation. Scale bars, 50 μm. Images are representative of three individual repeats. (H) Quantification of the fused area in (G).
-
Figure 2—figure supplement 2—source data 1
Annotated, uncropped blots in Figure 2—figure supplement 2.
- https://cdn.elifesciences.org/articles/98593/elife-98593-fig2-figsupp2-data1-v1.pdf
-
Figure 2—figure supplement 2—source data 2
Raw, uncropped blots in Figure 2—figure supplement 2.
- https://cdn.elifesciences.org/articles/98593/elife-98593-fig2-figsupp2-data2-v1.zip
-
Figure 2—figure supplement 2—source data 3
Source data of the individual points in Figure 2—figure supplement 2.
- https://cdn.elifesciences.org/articles/98593/elife-98593-fig2-figsupp2-data3-v1.xlsx
Figure 2—figure supplement 3

Interleukin-1β (IL-1β) inhibits authentic severe acute respiratory syndrome coronavirus 2 (SARS-CoV-2)-induced cell-cell fusion.
(A) Immunoblots of wild-type (WT) SARS-CoV-2 S, S2, cleaved S2’, and N proteins collected from HEK293T-ACE2 cells 24 hr post-infection (hpi) as described in Figure 2E. Blots are representative of three individual experiments. Numbers below the blots indicated the intensity of S2’ or N versus Tubulin. (B, C) Bright-field images of 0.5 multiplicity of infection (MOI) WT (B) or Delta (C) SARS-CoV-2-infected HEK293T-ACE2 cells pre-treated with different concentrations of IL-1β. White arrowheads indicate syncytia formation, scale bars are indicative of 50 μm, and images are representative of three independent experiments.
-
Figure 2—figure supplement 3—source data 1
Annotated, uncropped blots in Figure 2—figure supplement 3.
- https://cdn.elifesciences.org/articles/98593/elife-98593-fig2-figsupp3-data1-v1.pdf
-
Figure 2—figure supplement 3—source data 2
Raw, uncropped blots in Figure 2—figure supplement 3.
- https://cdn.elifesciences.org/articles/98593/elife-98593-fig2-figsupp3-data2-v1.zip
Figure 2—figure supplement 4

Interleukin-1β (IL-1β) is an important host factor from innate immune cells inhibiting severe acute respiratory syndrome coronavirus 2 (SARS-CoV-2) spike-induced cell-cell fusion.
(A, B) ELISA of IL-1β concentrations in supernatants from THP-1 (A) and peripheral blood mononuclear cells (PBMCs) (B) after Toll-like receptor (TLR) ligands stimulation. Data are representative of three individual repeats. (C) Immunoblots showing full-length spike, S2, cleaved S2’, and ACE2 collected from THP-1 supernatants-treated HEK293T-S and HEK293T-ACE2 in the presence or absence of IL-1 receptor antagonist (IL-1RA). Blots are representative of three individual repeats. Numbers below the blots indicated the intensity of S2’ versus Tubulin. (D) ELISA of IL-1β concentrations in supernatants from sgControl and sgTLR2 THP-1 cells after TLR ligands stimulation. Data are representative of four individual repeats. (E) Luciferase activity (relative luminescence units [RLU]) measured from HEK293T cell lysates collected from sgControl and sgTLR2 THP-1 supernatants-treated HEK293T-S and HEK293T-ACE2 for 16 hr. Fetal bovine serum (FBS)-free RPMI 1640 served as medium control. Data are representative of three individual repeats and displayed as individual points with mean ± standard error of mean (SEM). (F) ELISA of IL-1β concentrations in supernatants from TAK1/IKKβ inhibitors-treated THP-1 cells after PGN stimulation. Data are representative of three individual repeats. (G) Luciferase activity (RLU) measured from HEK293T cell lysates collected from TAK1/IKKβ inhibitors pre-treated THP-1 supernatants added onto HEK293T-S and HEK293T-ACE2 cells for 16 hr. FBS-free RPMI 1640 served as medium control. Data are representative of three individual repeats and displayed as individual points with mean ± SEM. (H) ELISA of IL-1β concentrations in supernatants from TAK1/IKKβ inhibitors-treated PBMCs after PGN stimulation. Data are representative of three individual repeats. (I) Luciferase activity (RLU) measured from HEK293T cell lysates collected from TAK1/IKKβ inhibitors pre-treated PBMCs supernatants added onto HEK293T-S and HEK293T-ACE2 cells for 16 hr. 1% FBS RPMI 1640 served as medium control. Data are representative of three individual repeats and displayed as individual points with mean ± SEM.
-
Figure 2—figure supplement 4—source data 1
Annotated, uncropped blots in Figure 2—figure supplement 4.
- https://cdn.elifesciences.org/articles/98593/elife-98593-fig2-figsupp4-data1-v1.pdf
-
Figure 2—figure supplement 4—source data 2
Raw, uncropped blots in Figure 2—figure supplement 4.
- https://cdn.elifesciences.org/articles/98593/elife-98593-fig2-figsupp4-data2-v1.zip
-
Figure 2—figure supplement 4—source data 3
Source data of the individual points in Figure 2—figure supplement 4.
- https://cdn.elifesciences.org/articles/98593/elife-98593-fig2-figsupp4-data3-v1.xlsx
Figure 2—figure supplement 5
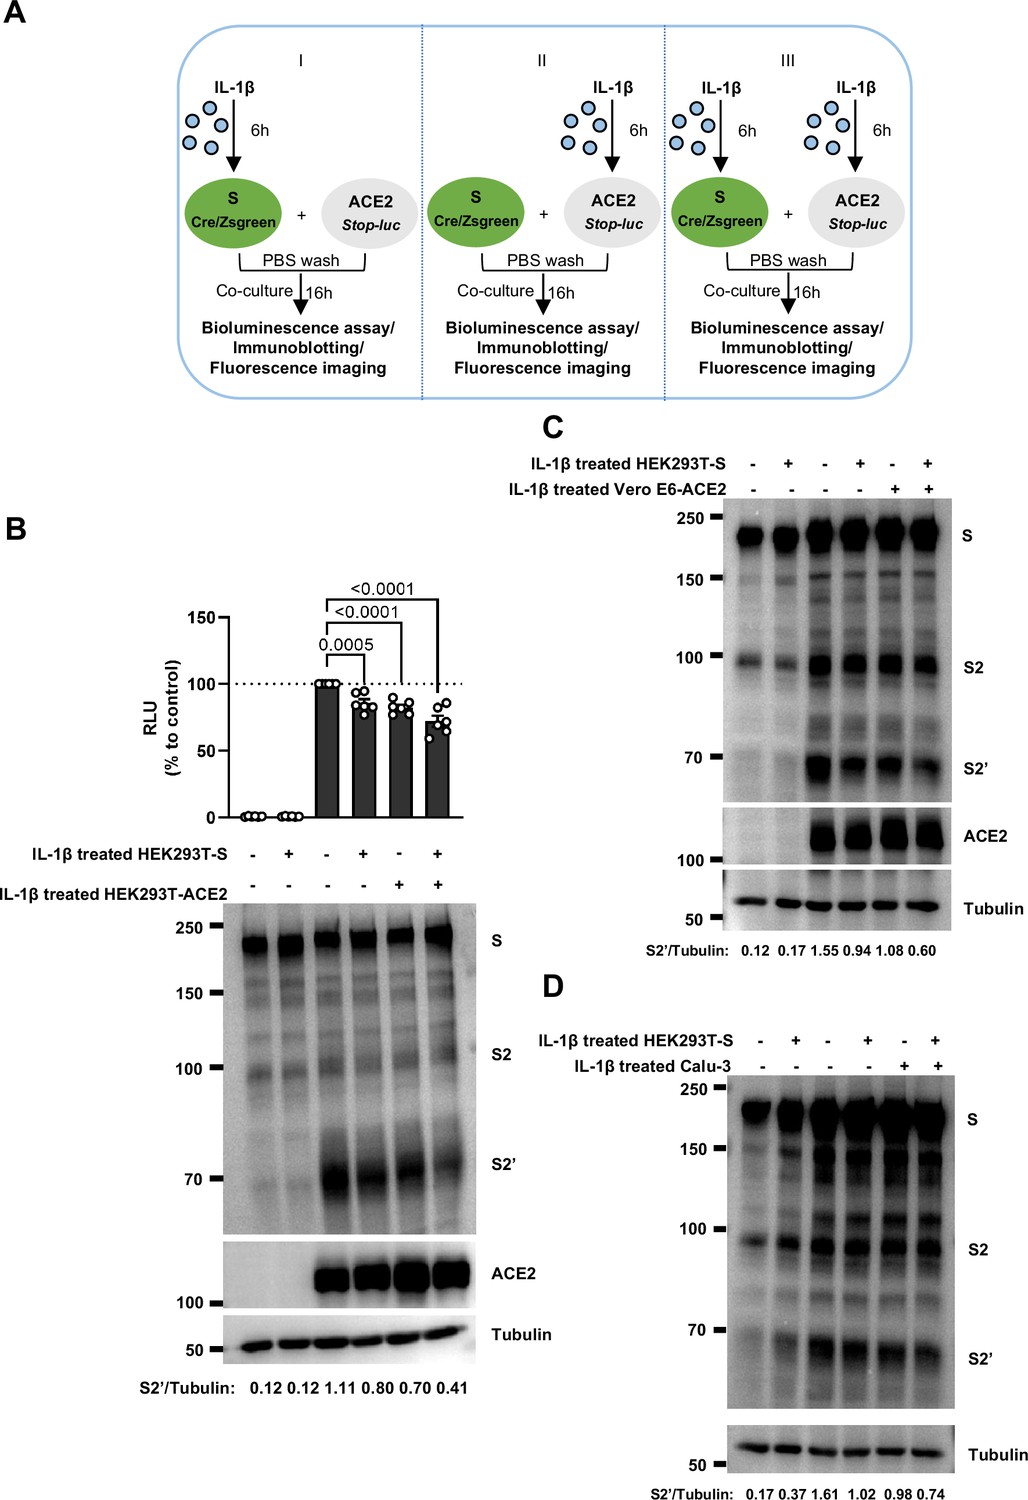
Interleukin-1β (IL-1β) inhibits severe acute respiratory syndrome coronavirus 2 (SARS-CoV-2)-induced cell-cell fusion through acting on both donor and acceptor cells.
(A) Schematics of the cell-cell fusion model used to determine cell types affected by IL-1β. Pre-treated HEK293T-S or HEK293T-ACE2 cells or both with 1 ng/mL IL-1β for 6 hr, then co-cultured for 16 hr after washing with phosphate buffered saline (PBS). Cells co-expressing SARS-CoV-2 spike and Cre were co-cultured with ACE2 and Stop-luc co-expressing HEK293T cells for 16 hr, before cell lysates were collected for bioluminescence assay and immunoblotting. Cells co-expressing SARS-CoV-2 spike and ZsGreen were co-cultured with ACE2 expressing HEK293T cells for 16 hr before fluorescence imaging. (B) Luciferase activity (relative luminescence units [RLU]) measured from HEK293T cell lysates and immunoblots showing full-length spike, S2, cleaved S2’, and ACE2 collected from different treatments of IL-1β described in (A) for 16 hr. Data and blots are representative of six individual repeats. Numbers below the blots indicated the intensity of S2’ versus Tubulin. (C) Immunoblots showing full-length spike, S2, cleaved S2’, and ACE2 collected from 1 ng/mL IL-1β-treated HEK293T-S and Vero E6-ACE2 for 16 hr. Blots are representative of three independent experiments. Numbers below the blots indicated the intensity of S2’ versus Tubulin. (D) Immunoblots showing full-length spike, S2, and cleaved S2’ collected from 1 ng/mL IL-1β-treated HEK293T-S and Calu-3 for 16 hr. Blots are representative of three independent experiments. Numbers below the blots indicated the intensity of S2’ versus Tubulin.
-
Figure 2—figure supplement 5—source data 1
Annotated, uncropped blots in Figure 2—figure supplement 5.
- https://cdn.elifesciences.org/articles/98593/elife-98593-fig2-figsupp5-data1-v1.pdf
-
Figure 2—figure supplement 5—source data 2
Raw, uncropped blots in Figure 2—figure supplement 5.
- https://cdn.elifesciences.org/articles/98593/elife-98593-fig2-figsupp5-data2-v1.zip
-
Figure 2—figure supplement 5—source data 3
Source data of the individual points in Figure 2—figure supplement 5.
- https://cdn.elifesciences.org/articles/98593/elife-98593-fig2-figsupp5-data3-v1.xlsx
Figure 2—figure supplement 6
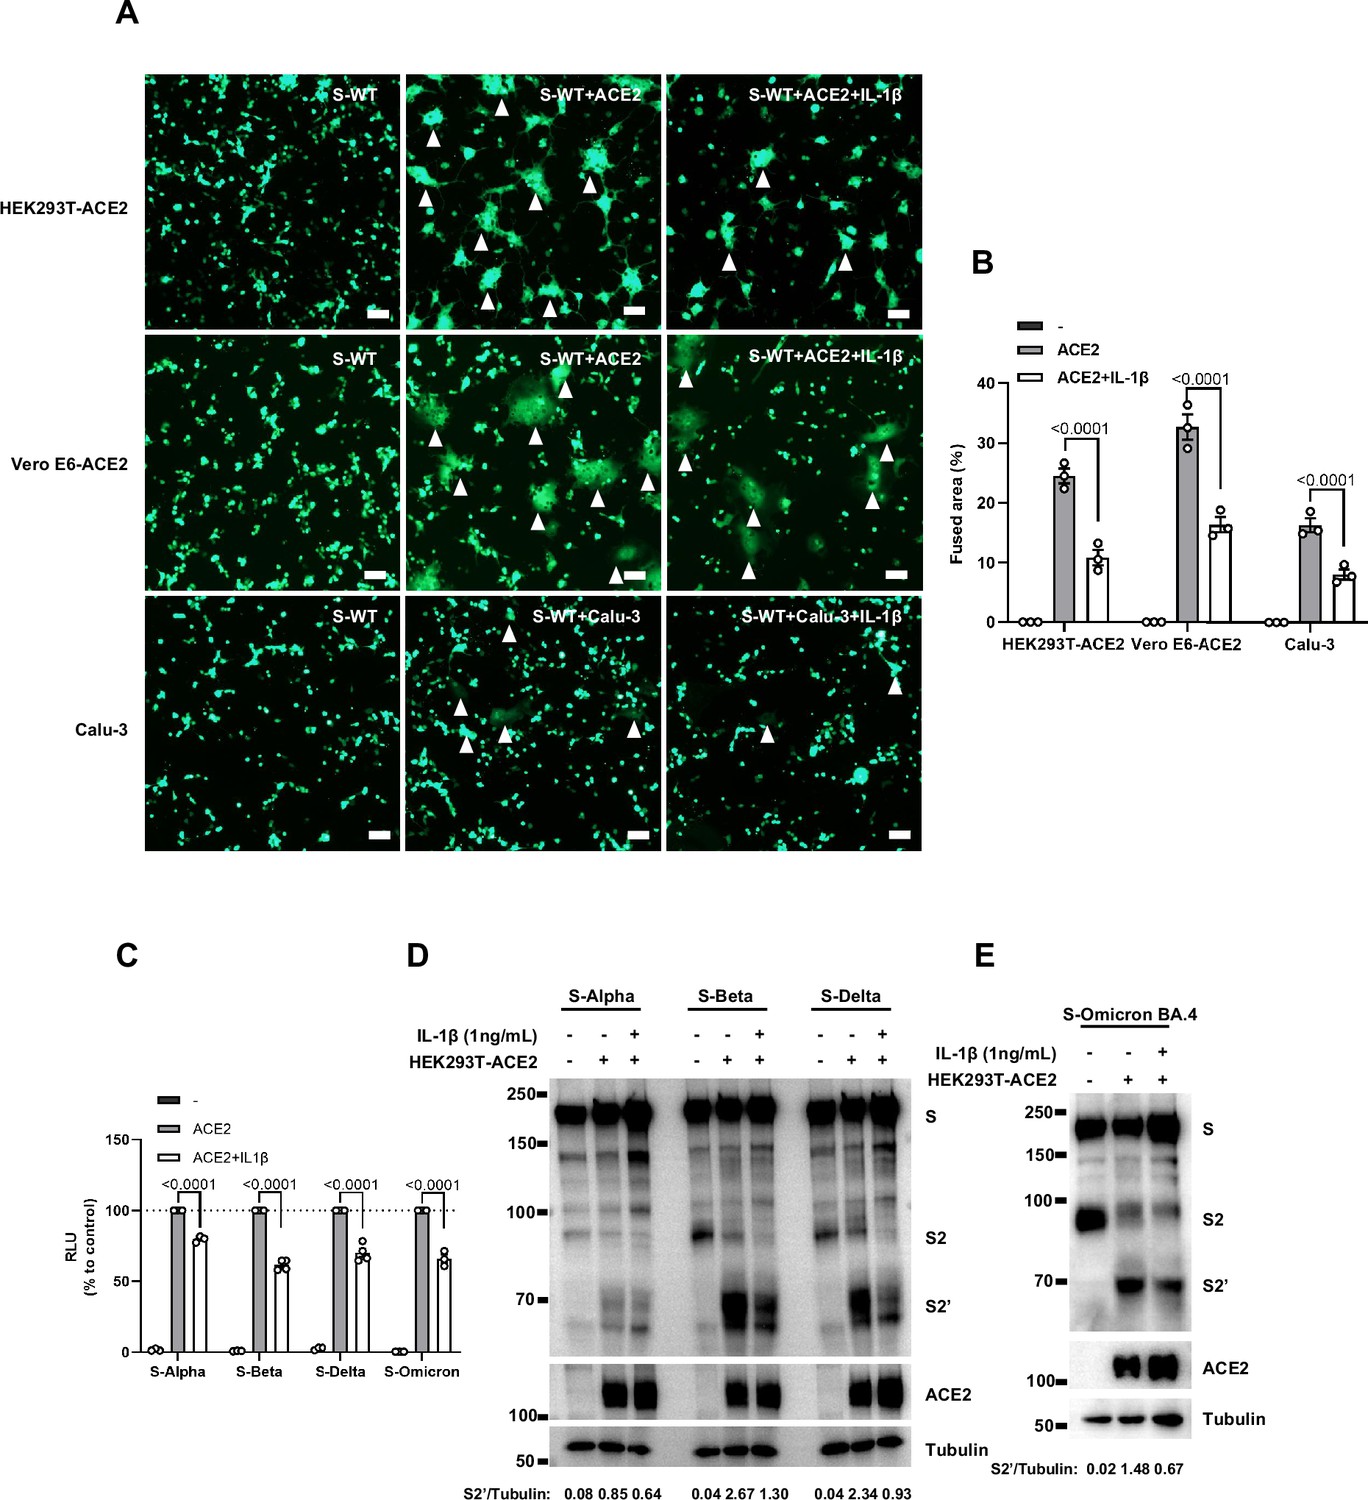
Interleukin-1β (IL-1β) inhibits severe acute respiratory syndrome coronavirus 2 (SARS-CoV-2) spike-induced syncytia formation in different cells.
(A) Representative fluorescent image captured at 488 nm from HEK293T-S-ZsGreen co-cultured with HEK293T-ACE2, Vero E6-ACE2, and Calu-3 for 16 hr with or without 1 ng/mL IL-1β. White arrowheads indicate syncytia formation. Scale bars, 50 μm. Images are representative of three individual repeats. (B) Quantification of the fused area in (A). (C) Luciferase activity (relative luminescence units [RLU]) measured from HEK293T cell lysates from 1 ng/mL IL-1β-treated HEK293T-S (S-Alpha, S-Beta, S-Delta, S-Omicron BA.4) and HEK293T-ACE2 for 16 hr. Data are representative of four individual repeats and displayed as individual points with mean ± standard error of mean (SEM). (D, E) Immunoblots showing full-length spike, S2, cleaved S2’, and ACE2 collected from 1 ng/mL IL-1β-treated HEK293T-S (S-Alpha, S-Beta, S-Delta (D), S-Omicron BA.4 (E)) and HEK293T-ACE2 for 16 hr. Blots are representative of three independent experiments. Numbers below the blots indicated the intensity of S2’ versus Tubulin.
-
Figure 2—figure supplement 6—source data 1
Annotated, uncropped blots in Figure 2—figure supplement 6.
- https://cdn.elifesciences.org/articles/98593/elife-98593-fig2-figsupp6-data1-v1.pdf
-
Figure 2—figure supplement 6—source data 2
Raw, uncropped blots in Figure 2—figure supplement 6.
- https://cdn.elifesciences.org/articles/98593/elife-98593-fig2-figsupp6-data2-v1.zip
-
Figure 2—figure supplement 6—source data 3
Source data of the individual points in Figure 2—figure supplement 6.
- https://cdn.elifesciences.org/articles/98593/elife-98593-fig2-figsupp6-data3-v1.xlsx
Figure 2—figure supplement 7
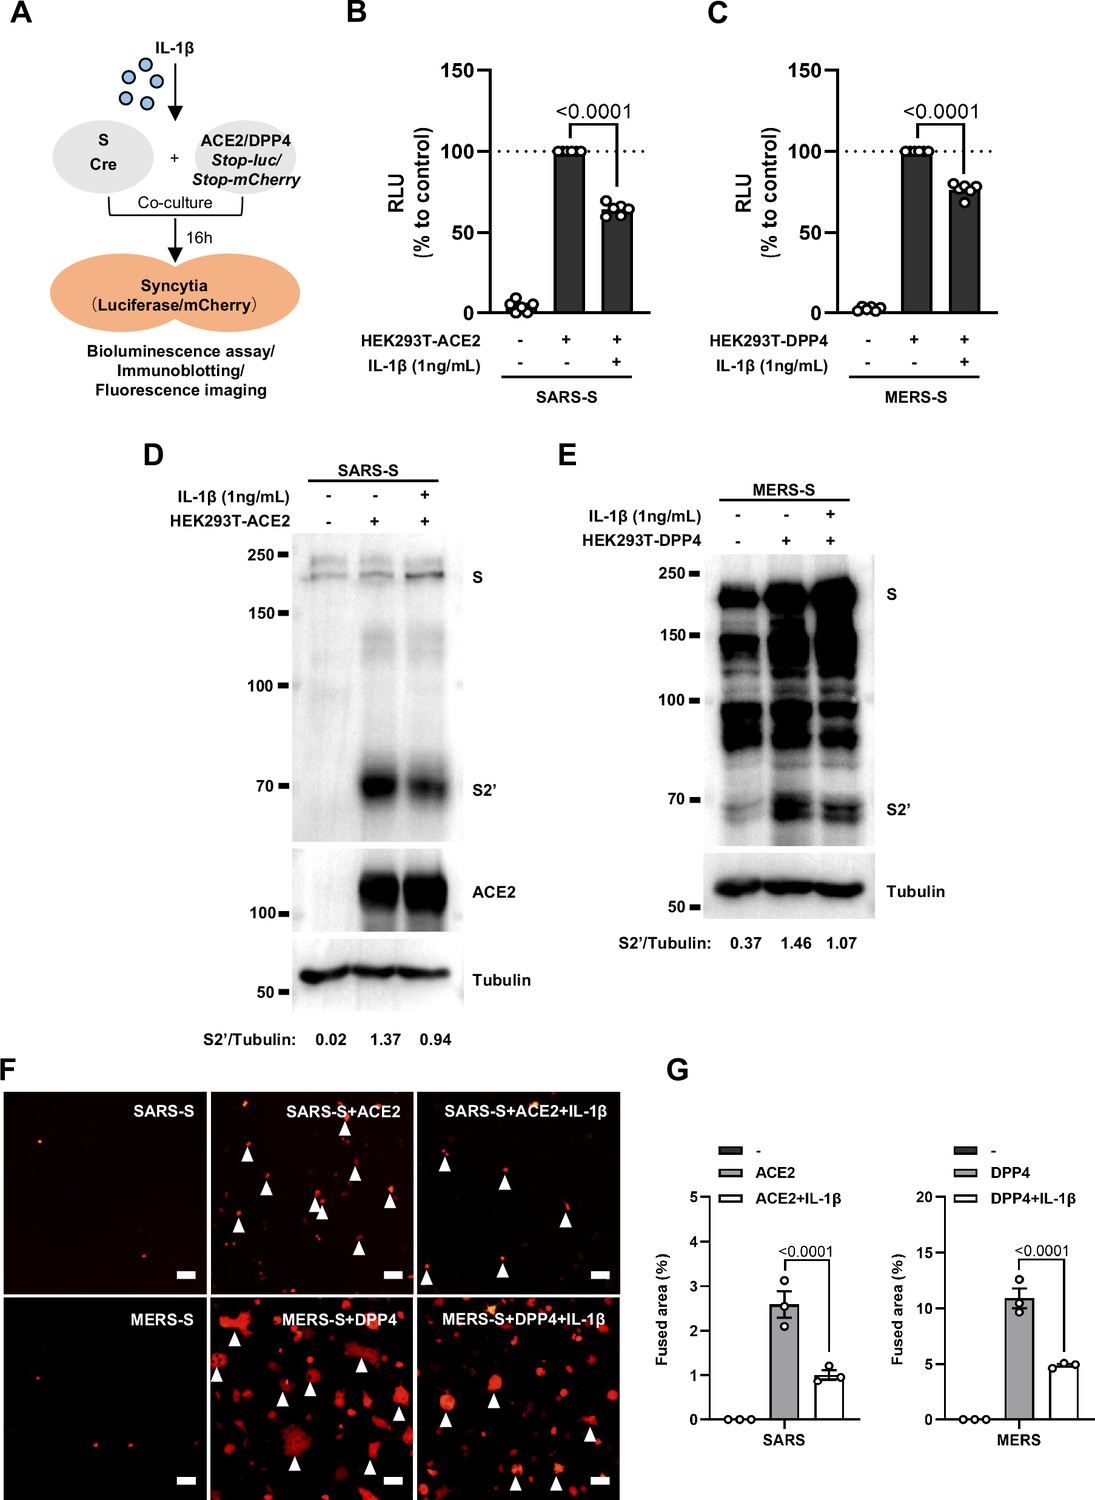
Interleukin-1β (IL-1β) inhibits severe acute respiratory syndrome coronavirus (SARS-CoV) and MERS-CoV spike-induced cell-cell fusion.
(A) Schematics of the cell-cell fusion model used to quantify SARS-CoV and MERS-CoV spike-mediated syncytia formation upon IL-1β treatment. Cells co-expressing SARS-CoV or MERS-CoV spike and Cre were co-cultured with ACE2 or DPP4 and Stop-luc co-expressing HEK293T cells for 16 hr, before cell lysates were collected for bioluminescence assay and immunoblotting. Cells co-expressing SARS-CoV or MERS-CoV spike and Cre were co-cultured with ACE2 or DPP4 and Stop-mCherry co-expressing HEK293T cells for 16 hr before fluorescence imaging. (B) Luciferase activity (relative luminescence units [RLU]) measured from HEK293T cell lysates from 1 ng/mL IL-1β-treated HEK293T-S (SARS-S) and HEK293T-ACE2 for 16 hr. Data are representative of four individual repeats and displayed as individual points with mean ± SEM. (C) Luciferase activity (RLU) measured from HEK293T cell lysates from 1 ng/mL IL-1β-treated HEK293T-S (MERS-S) and HEK293T-DPP4 for 16 hr. Data are representative of four individual repeats and displayed as individual points with mean ± SEM. (D) Immunoblots showing SARS-CoV full-length spike, cleaved S2’ and ACE2 collected from 1 ng/mL IL-1β-treated HEK293T-S (SARS-S) and HEK293T-ACE2 for 16 hr. Blots are representative of three independent experiments. Numbers below the blots indicated the intensity of S2’ versus Tubulin. (E) Immunoblots showing MERS-CoV full-length spike, cleaved S2’ collected from 1 ng/mL IL-1β-treated HEK293T-S (MERS-S) and HEK293T-DPP4 for 16 hr. Blots are representative of three independent experiments. Numbers below the blots indicated the intensity of S2’ versus Tubulin. (F) Representative fluorescent images captured at 594 nm from 1 ng/mL IL-1β-treated HEK293T-S (SARS-S) and HEK293T-ACE2 or HEK293T-S (MERS-S) and HEK293T-DPP4 for 16 hr. White arrowheads indicate syncytia formation. Scale bars, 50 μm. Images are representative of three individual experiments. (G) Quantification of the fused area in (F).
-
Figure 2—figure supplement 7—source data 1
Annotated, uncropped blots in Figure 2—figure supplement 7.
- https://cdn.elifesciences.org/articles/98593/elife-98593-fig2-figsupp7-data1-v1.pdf
-
Figure 2—figure supplement 7—source data 2
Raw, uncropped blots in Figure 2—figure supplement 7.
- https://cdn.elifesciences.org/articles/98593/elife-98593-fig2-figsupp7-data2-v1.zip
-
Figure 2—figure supplement 7—source data 3
Source data of the individual points in Figure 2—figure supplement 7.
- https://cdn.elifesciences.org/articles/98593/elife-98593-fig2-figsupp7-data3-v1.xlsx
Figure 3 with 2 supplements
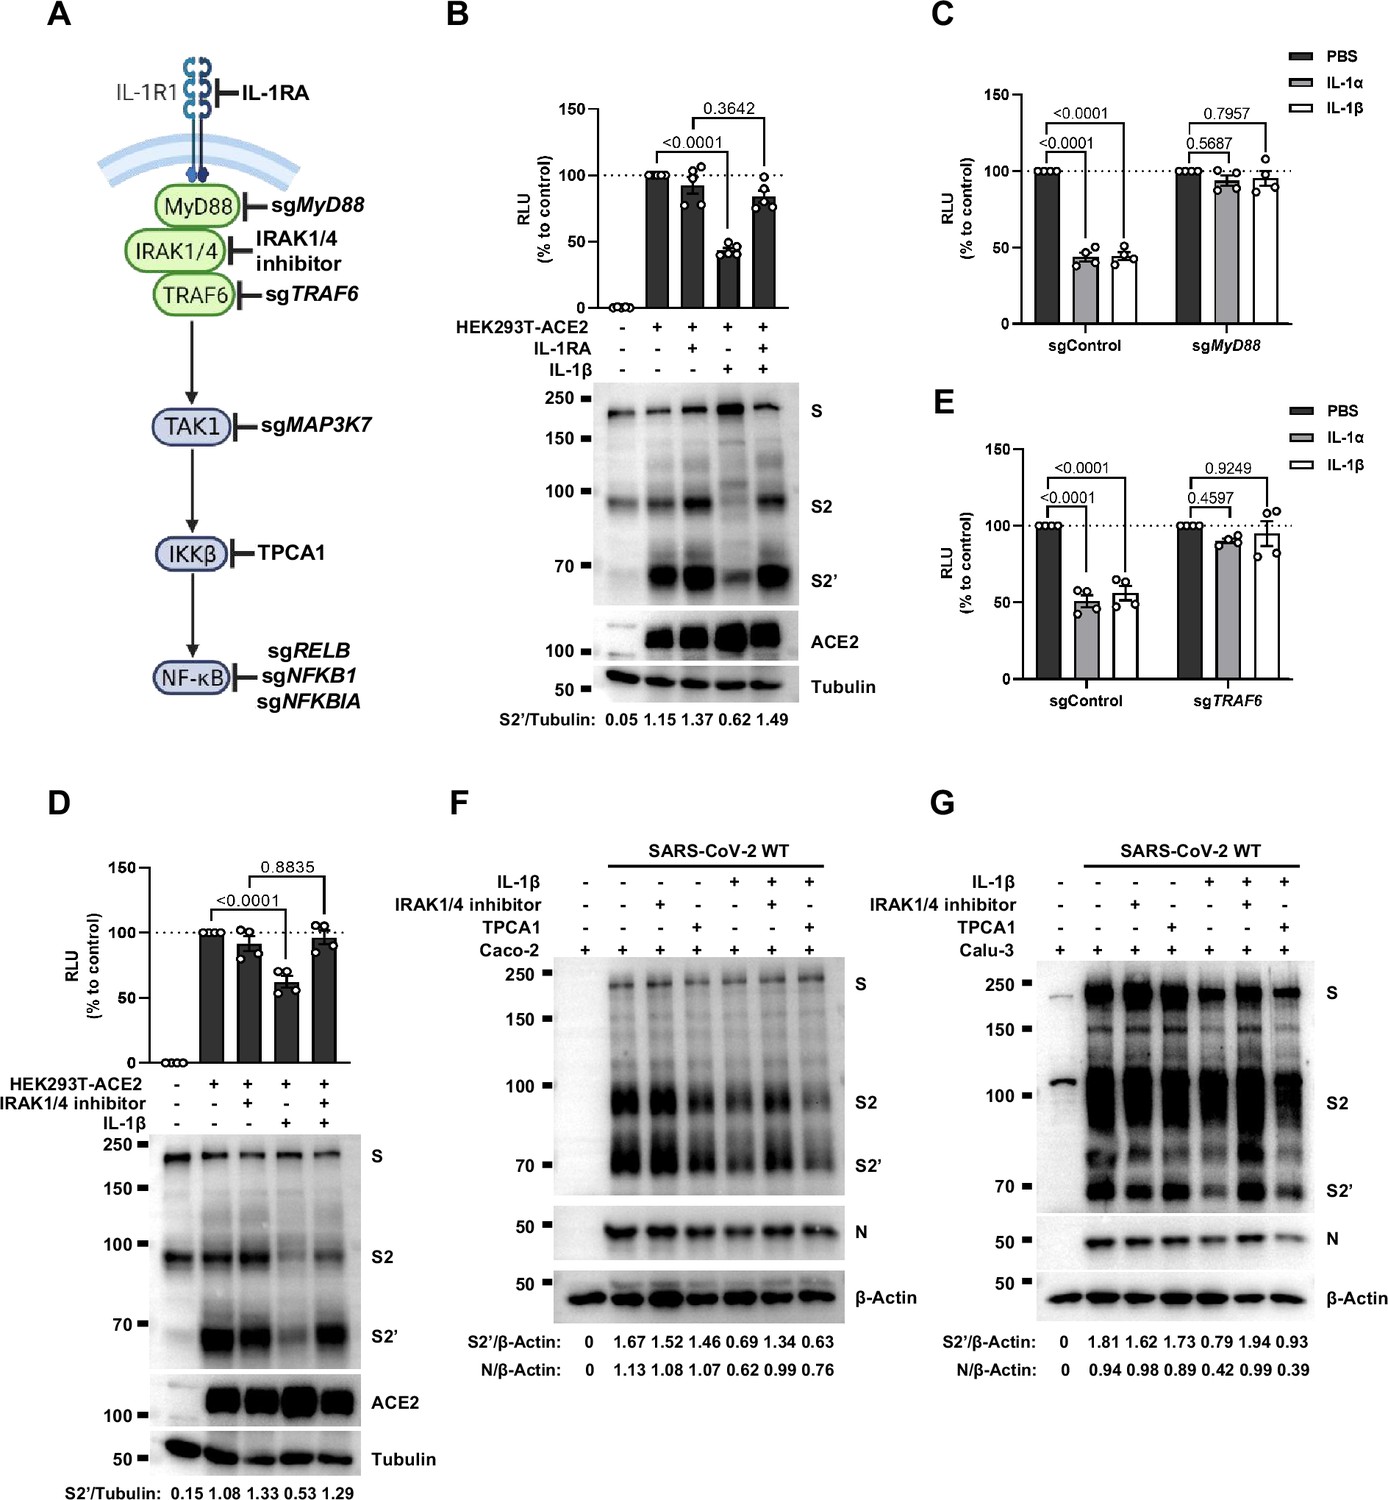
Interleukin-1β (IL-1β) inhibits severe acute respiratory syndrome coronavirus 2 (SARS-CoV-2)-induced cell-cell fusion through the IL-1R1/MyD88/IRAK/TRAF6 pathway.
(A) Schematics of gene knockout or inhibitor treatment in the IL-1 receptor pathway. (B) Luciferase activity (relative luminescence units [RLU]) measured from HEK293T cell lysates and immunoblots showing full-length spike, S2, cleaved S2’, and ACE2 collected from HEK293T-S and HEK293T-ACE2 pre-treated with 1000 ng/mL IL-1 receptor antagonist (IL-1RA) for 30 min, then treated with 1 ng/mL IL-1β for 16 hr. Data and blots are representative of five individual repeats. Numbers below the blots indicated the intensity of S2’ versus Tubulin. (C) Luciferase activity (RLU) measured from cell lysates collected from 10 ng/mL IL-1α or 1 ng/mL IL-1β-treated sgControl or sgMyD88 HEK293T cell-cell fusion system for 16 hr. Data are representative of four individual repeats and displayed as individual points with mean ± SEM. (D) Luciferase activity (RLU) measured from HEK293T cell lysates and immunoblots showing full-length spike, S2, cleaved S2’, and ACE2 collected from HEK293T-S and HEK293T-ACE2 pre-treated with 2 μM IRAK1/4 inhibitor for 30 min, then treated with 1 ng/mL IL-1β for 16 hr. Data and blots are representative of four individual repeats. Numbers below the blots indicated the intensity of S2’ versus Tubulin. (E) Luciferase activity (RLU) measured from cell lysates collected from 10 ng/mL IL-1α- or 1 ng/mL IL-1β-treated sgControl or sgTRAF6 HEK293T cell-cell fusion system for 16 hr. Data are representative of four individual repeats and displayed as individual points with mean ± SEM. (F) Immunoblots showing full-length spike, S2, cleaved S2’, and N collected from Caco-2 cells, which were pre-treated with 2 μM IRAK1/4 inhibitor and 10 ng/mL IL-1β for 1 hr, then infected with authentic SARS-CoV-2 for 24 hr. Blots are representative of three independent experiments. Numbers below the blots indicated the intensity of S2’ or N versus β-Actin. (G) Immunoblots showing full-length spike, S2, cleaved S2’, and N collected from Calu-3 cells, which were infected with authentic SARS-CoV-2 for 1 hr, then washed with phosphate buffered saline (PBS) before treated with 2 μM IRAK1/4 inhibitor and 10 ng/mL IL-1β for 24 hr. Blots are representative of three independent experiments. Numbers below the blots indicated the intensity of S2’ or N versus β-Actin.
-
Figure 3—source data 1
Annotated, uncropped blots in Figure 3.
- https://cdn.elifesciences.org/articles/98593/elife-98593-fig3-data1-v1.pdf
-
Figure 3—source data 2
Raw, uncropped blots in Figure 3.
- https://cdn.elifesciences.org/articles/98593/elife-98593-fig3-data2-v1.zip
-
Figure 3—source data 3
Source data of the individual points in Figure 3.
- https://cdn.elifesciences.org/articles/98593/elife-98593-fig3-data3-v1.xlsx
Figure 3—figure supplement 1
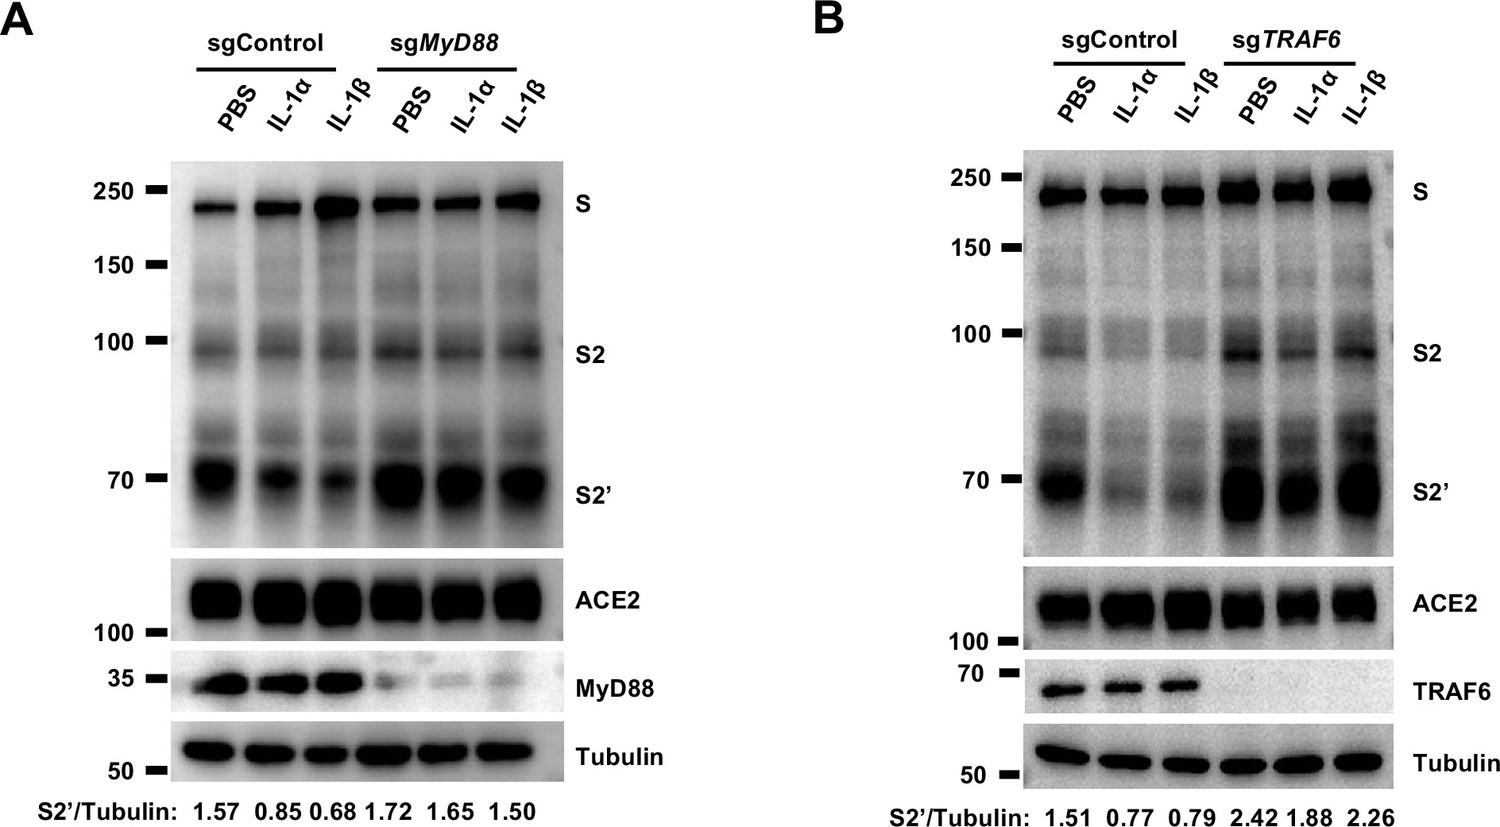
Interleukin-1β (IL-1β) inhibits severe acute respiratory syndrome coronavirus 2 (SARS-CoV-2) spike-induced cell-cell fusion through the IL-1R1/MyD88/IRAK/TRAF6 pathway.
(A) Immunoblots showing full-length spike, S2 and cleaved S2’, ACE2, and MyD88 collected from 10 ng/mL IL-1α- or 1 ng/mL IL-1β-treated sgControl or sgMyD88 HEK293T cell-cell fusion system for 16 hr. Blots are representative of three independent experiments. Numbers below the blots indicated the intensity of S2’ versus Tubulin. (B) Immunoblots showing full-length spike, S2 and cleaved S2’, ACE2, and TRAF6 collected from 10 ng/mL IL-1α- or 1 ng/mL IL-1β-treated sgControl or sgTRAF6 HEK293T cell-cell fusion system for 16 hr. Blots are representative of three independent experiments. Numbers below the blots indicated the intensity of S2’ versus Tubulin.
-
Figure 3—figure supplement 1—source data 1
Annotated, uncropped blots in Figure 3—figure supplement 1.
- https://cdn.elifesciences.org/articles/98593/elife-98593-fig3-figsupp1-data1-v1.pdf
-
Figure 3—figure supplement 1—source data 2
Raw, uncropped blots in Figure 3—figure supplement 1.
- https://cdn.elifesciences.org/articles/98593/elife-98593-fig3-figsupp1-data2-v1.zip
Figure 3—figure supplement 2
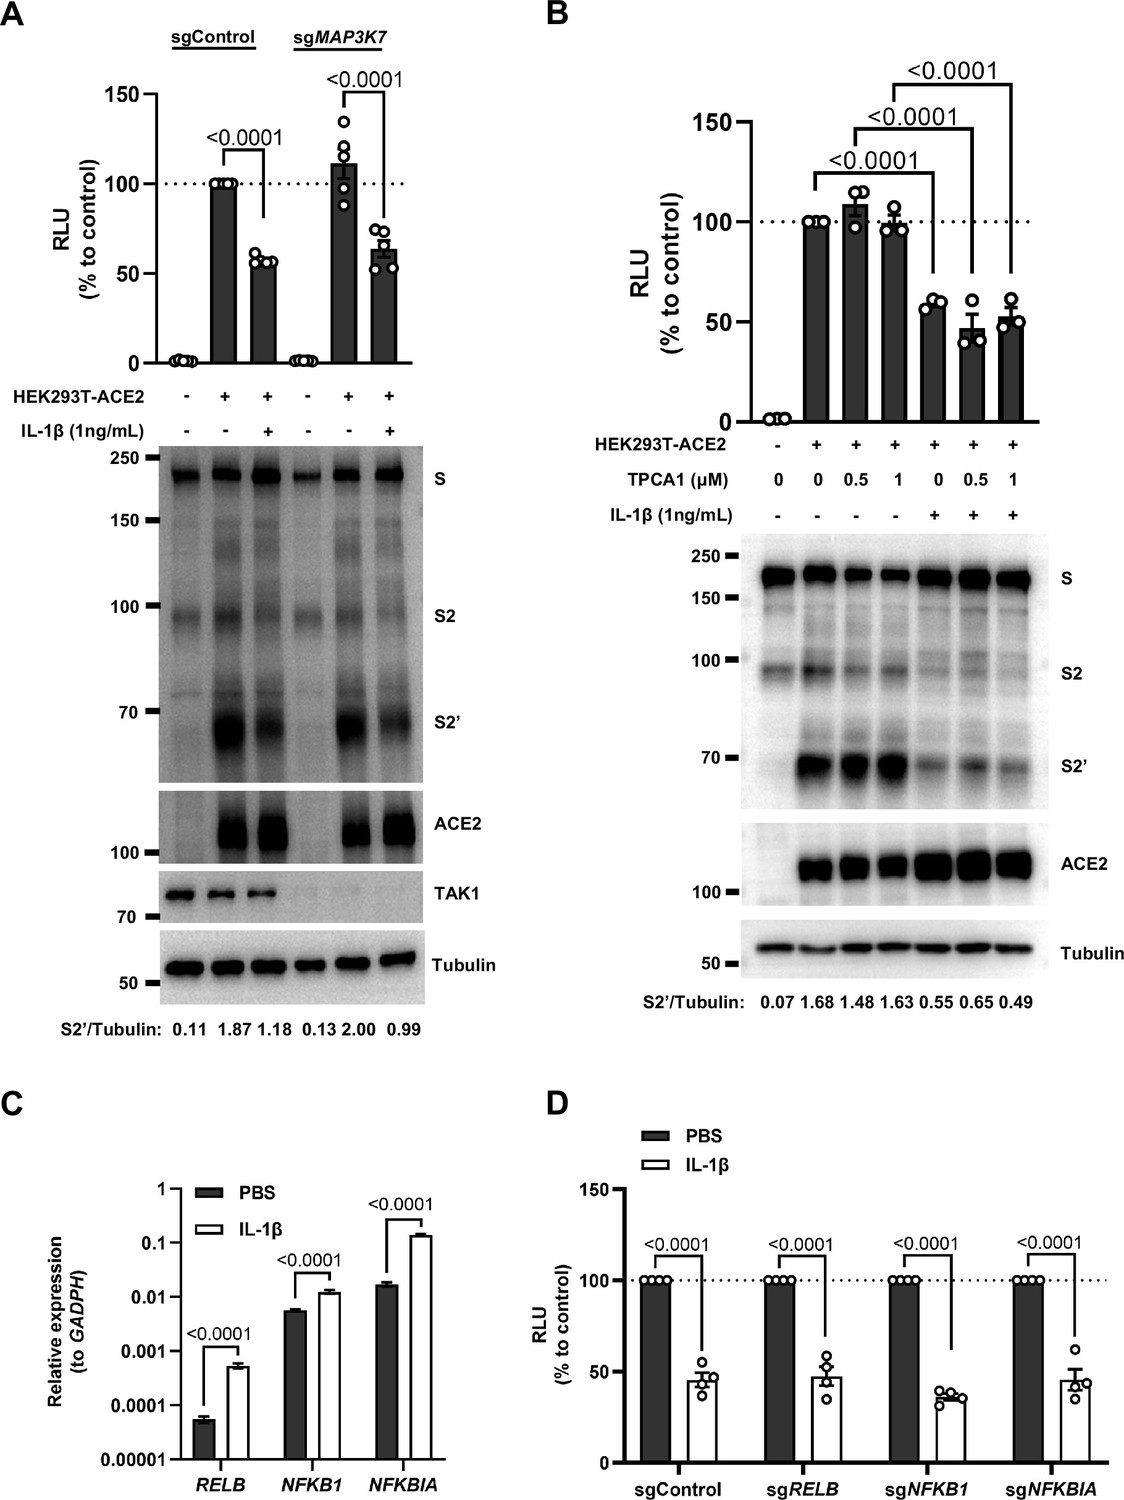
Interleukin-1β (IL-1β) inhibits severe acute respiratory syndrome coronavirus 2 (SARS-CoV-2) spike-induced cell-cell fusion independent from the TAK1/IKKβ/NF-κB pathway.
(A) Luciferase activity (relative luminescence units [RLU]) measured from cell lysates and immunoblots showing full-length spike, S2 and cleaved S2’, ACE2 collected from 1 ng/mL IL-1β-treated sgControl or sgMAP3K7 HEK293T cell-cell fusion system for 16 hr. Data and blots are representative of five individual repeats. Numbers below the blots indicated the intensity of S2’ versus Tubulin. (B) Luciferase activity (RLU) measured from HEK293T cell lysates and immunoblots showing full-length spike, S2 and cleaved S2’, ACE2 collected from HEK293T-S and HEK293T-ACE2 pre-treated with different concentrations of TPCA1 for 30 min, then treated with 1 ng/mL IL-1β for 16 hr. Data and blots are representative of three individual repeats. Numbers below the blots indicated the intensity of S2’ versus Tubulin. (C) mRNA levels of NF-κB pathway-related genes in HEK293T cells after 1 ng/mL IL-1β for 4 hr. Data are representative of three individual repeats. (D) Luciferase activity (RLU) measured from cell lysates collected from 1 ng/mL IL-1β-treated sgControl, sgRELB, sgNFKB1, or sgNFKBIA HEK293T cell-cell fusion system for 16 hr. Data are representative of four individual repeats and displayed as individual points with mean ± standard error of mean (SEM).
-
Figure 3—figure supplement 2—source data 1
Annotated, uncropped blots in Figure 3—figure supplement 2.
- https://cdn.elifesciences.org/articles/98593/elife-98593-fig3-figsupp2-data1-v1.pdf
-
Figure 3—figure supplement 2—source data 2
Raw, uncropped blots in Figure 3—figure supplement 2.
- https://cdn.elifesciences.org/articles/98593/elife-98593-fig3-figsupp2-data2-v1.zip
-
Figure 3—figure supplement 2—source data 3
Source data of the individual points in Figure 3—figure supplement 2.
- https://cdn.elifesciences.org/articles/98593/elife-98593-fig3-figsupp2-data3-v1.xlsx
Figure 4 with 3 supplements
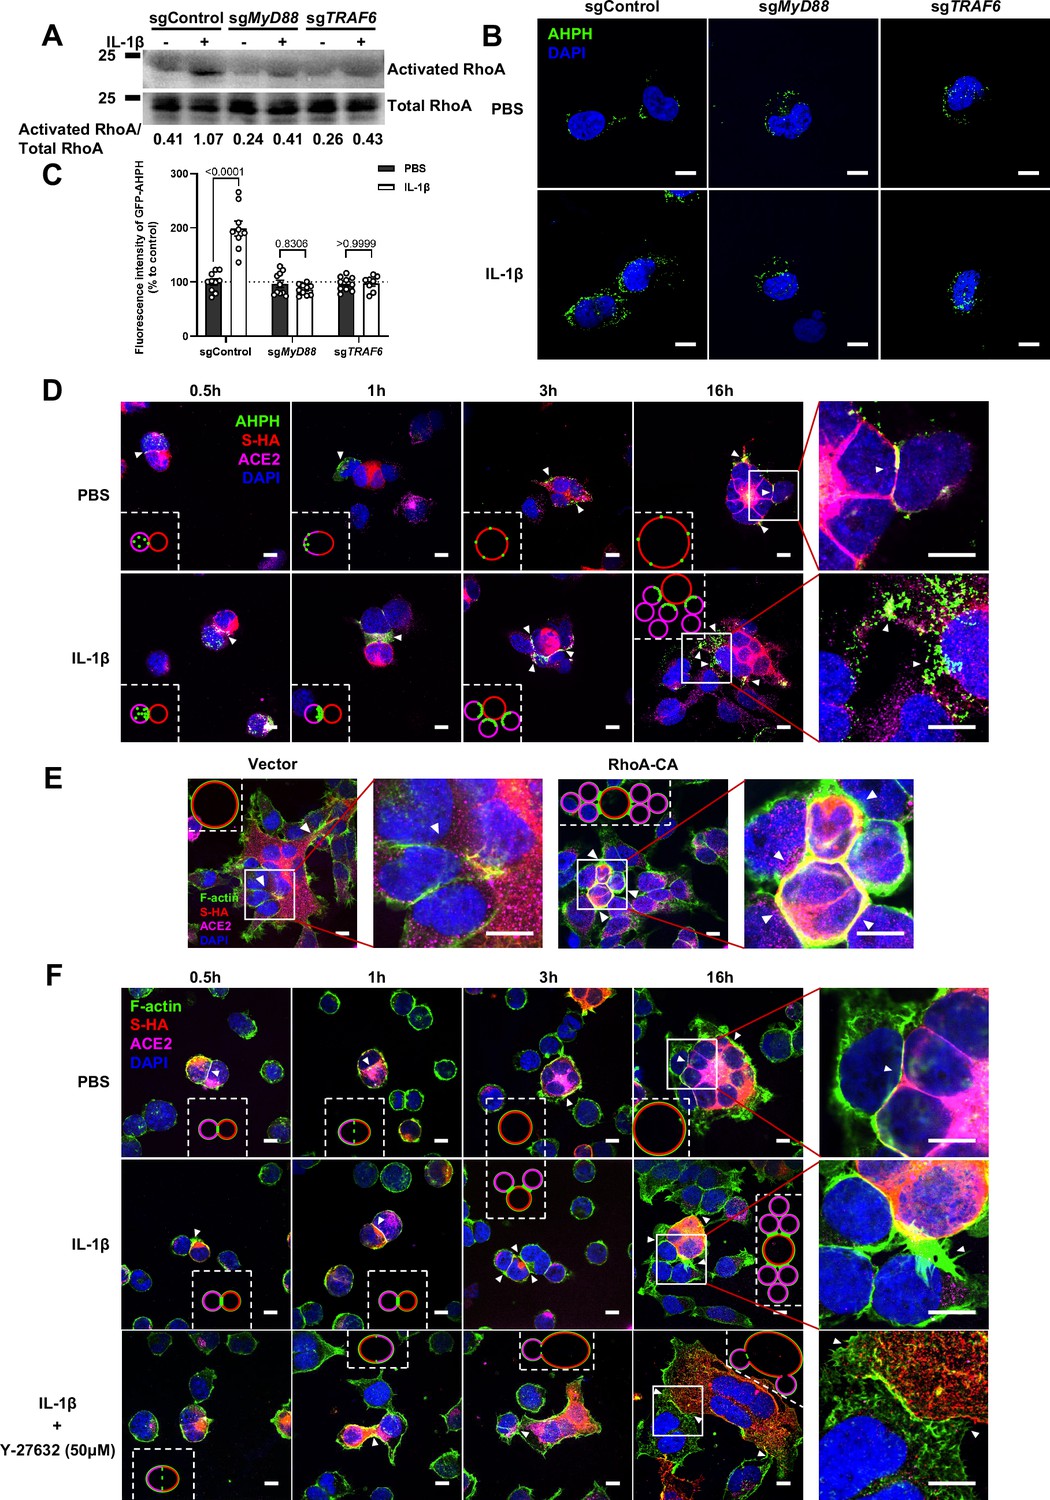
Interleukin-1β (IL-1β) inhibits severe acute respiratory syndrome coronavirus 2 (SARS-CoV-2)-induced cell-cell fusion through RhoA/ROCK-mediated actin bundles assembly at cell-cell junction.
(A) GTP-RhoA pull-down assay to detect the active level of RhoA in sgControl, sgMyD88, and sgTRAF6 HEK293T cells after 1 ng/mL IL-1β treatment for 30 min. Immunoblots showing activated RhoA and total RhoA. Blots are representative of three independent experiments. Numbers below the blots indicated the intensity of active RhoA versus total RhoA. (B) Representative confocal images of GFP-AHPH after 1 ng/mL IL-1β treatment for 30 min in sgControl, sgMyD88, and sgTRAF6 HEK293T cells. Scale bars, 10 μm. (C) Quantification of fluorescence intensity of GFP-AHPH in (B). Data are representative of eight individual repeats. (D) Representative confocal images of GFP-AHPH localization with or without 1 ng/mL IL-1β treatment at different time points of syncytia formation in HEK293T-S-HA and HEK293T-ACE2 cells. Schematics with green dots in the white dashed line boxes representing GFP-AHPH, red cycles representing S-expressing cells, and magenta cycles representing ACE2-expressing cells. White arrowheads indicate the localization of GFP-AHPH, scale bars, 10 μm. Images are representative of three independent experiments. (E) Representative confocal images of F-actin stained with phalloidin-488 in transfected vector or 20 ng RhoA-CA HEK293T-S-HA and HEK293T-ACE2 cells. Schematics with green lines in the white dashed line boxes representing actin bundles, red cycles representing S-expressing cells, and magenta cycles representing ACE2-expressing cells. Scale bars, 10 μm. Images are representative of three independent experiments. (F) Representative confocal images of F-actin stained with phalloidin-488 in the presence or absence of 1 ng/mL IL-1β or 50 μM Y-27632 treatment at different time points of syncytia formation in HEK293T-S-HA and HEK293T-ACE2 cells. Schematics with green lines in the white dashed line boxes representing actin bundles, red cycles representing S-expressing cells, and magenta cycles representing ACE2-expressing cells. White arrowheads (E and F) indicate the enrichment or disappearance of F-actin, scale bars, 10 μm. Images are representative of three independent experiments.
-
Figure 4—source data 1
Annotated, uncropped blots in Figure 4.
- https://cdn.elifesciences.org/articles/98593/elife-98593-fig4-data1-v1.pdf
-
Figure 4—source data 2
Raw, uncropped blots in Figure 4.
- https://cdn.elifesciences.org/articles/98593/elife-98593-fig4-data2-v1.zip
-
Figure 4—source data 3
Source data of the individual points in Figure 4.
- https://cdn.elifesciences.org/articles/98593/elife-98593-fig4-data3-v1.xlsx
Figure 4—figure supplement 1
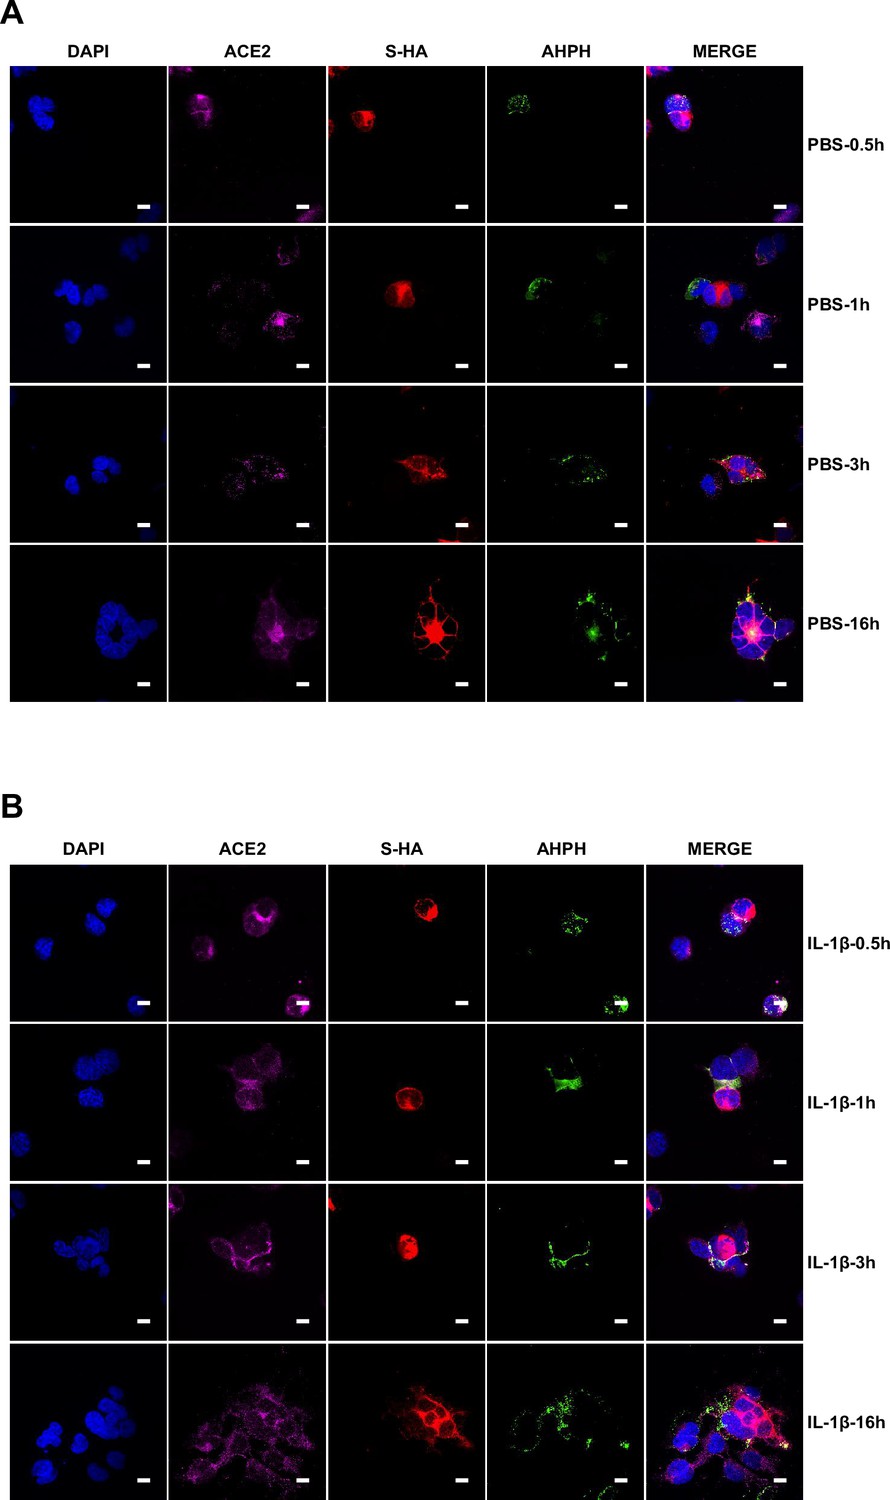
Single-channel confocal images.
Figure 4—figure supplement 2
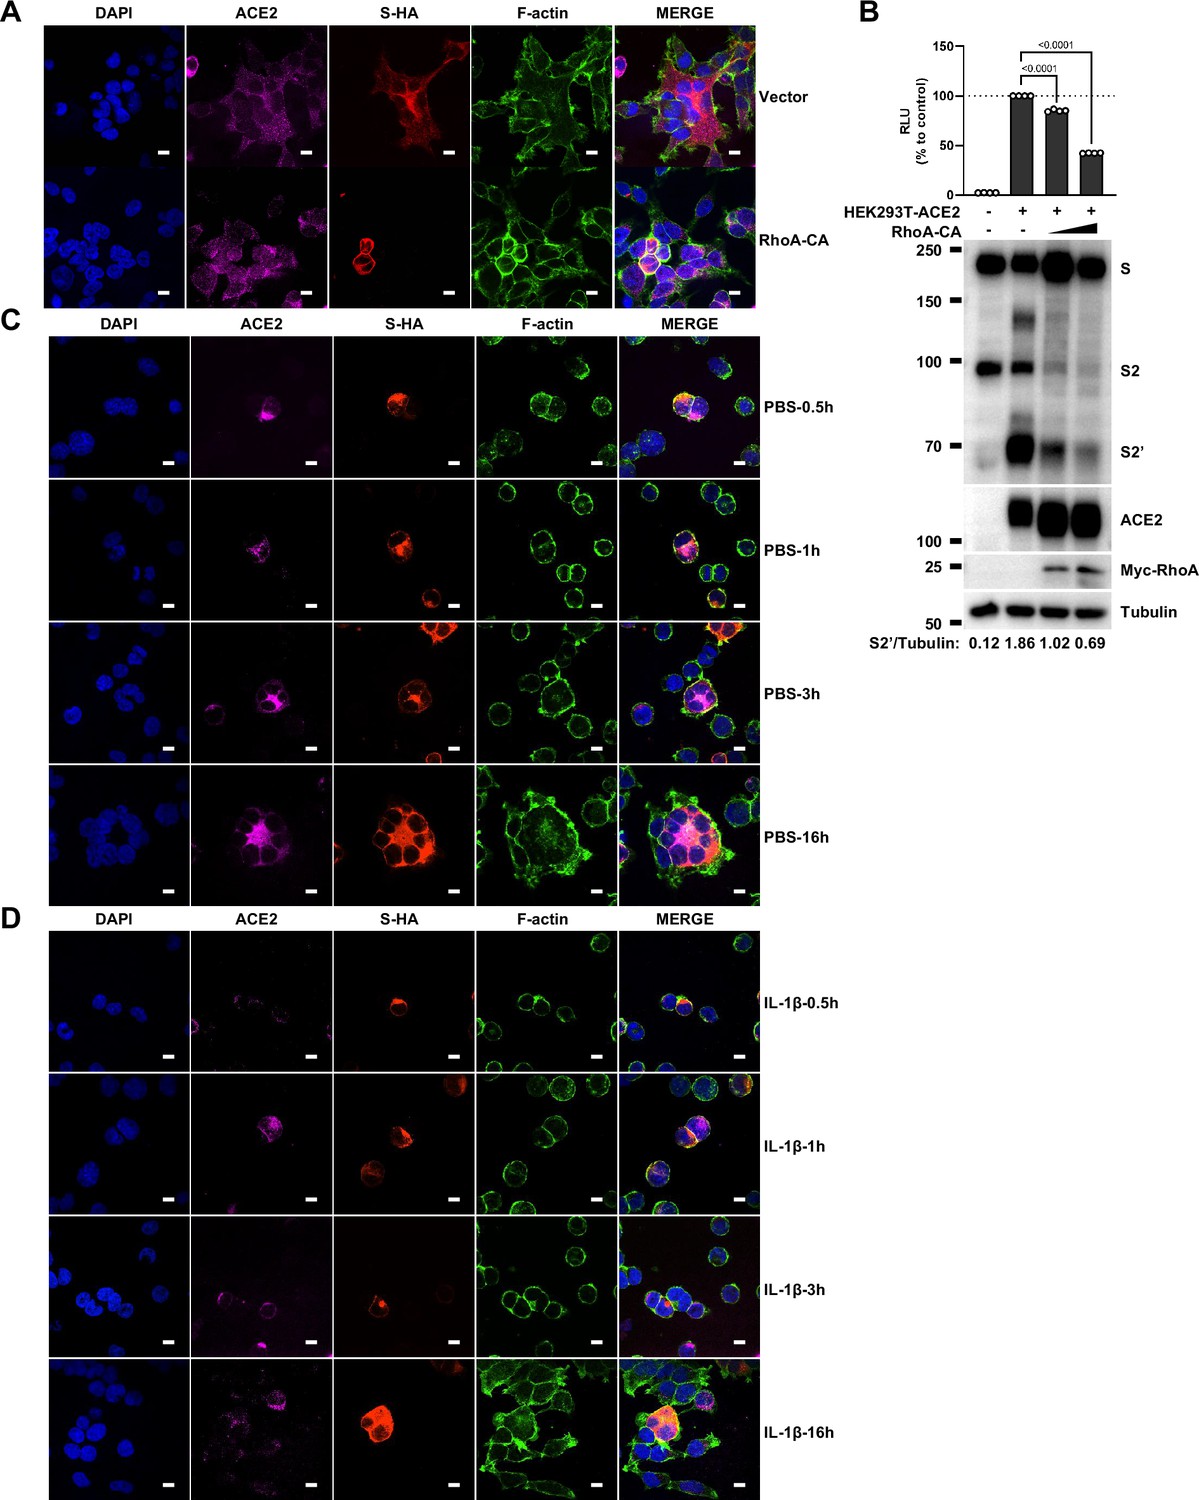
Single-channel confocal images.
(A) Single-channel confocal images of Figure 4E. (B) Luciferase activity (relative luminescence units [RLU]) measured from HEK293T cell lysates and immunoblots showing full-length spike, S2, cleaved S2’, ACE2, and Myc-RhoA collected from transfected vector, 10 or 20 ng constitutively active RhoA mutant (RhoA-CA) both in HEK293T-S and in HEK293T-ACE2 cells. Data and blots are representative of four individual repeats. Numbers below the blots indicated the intensity of S2’ versus Tubulin. (C) Single-channel confocal images of Figure 4F (top panel). (D) Single-channel confocal images of Figure 4F (middle panel).
-
Figure 4—figure supplement 2—source data 1
Annotated, uncropped blots in Figure 4—figure supplement 2.
- https://cdn.elifesciences.org/articles/98593/elife-98593-fig4-figsupp2-data1-v1.pdf
-
Figure 4—figure supplement 2—source data 2
Raw, uncropped blots in Figure 4—figure supplement 2.
- https://cdn.elifesciences.org/articles/98593/elife-98593-fig4-figsupp2-data2-v1.zip
-
Figure 4—figure supplement 2—source data 3
Source data of the individual points in Figure 4—figure supplement 2.
- https://cdn.elifesciences.org/articles/98593/elife-98593-fig4-figsupp2-data3-v1.xlsx
Figure 4—figure supplement 3

Single-channel confocal images.
(A) Single-channel confocal images of Figure 4F (bottom panel).
Figure 5 with 4 supplements
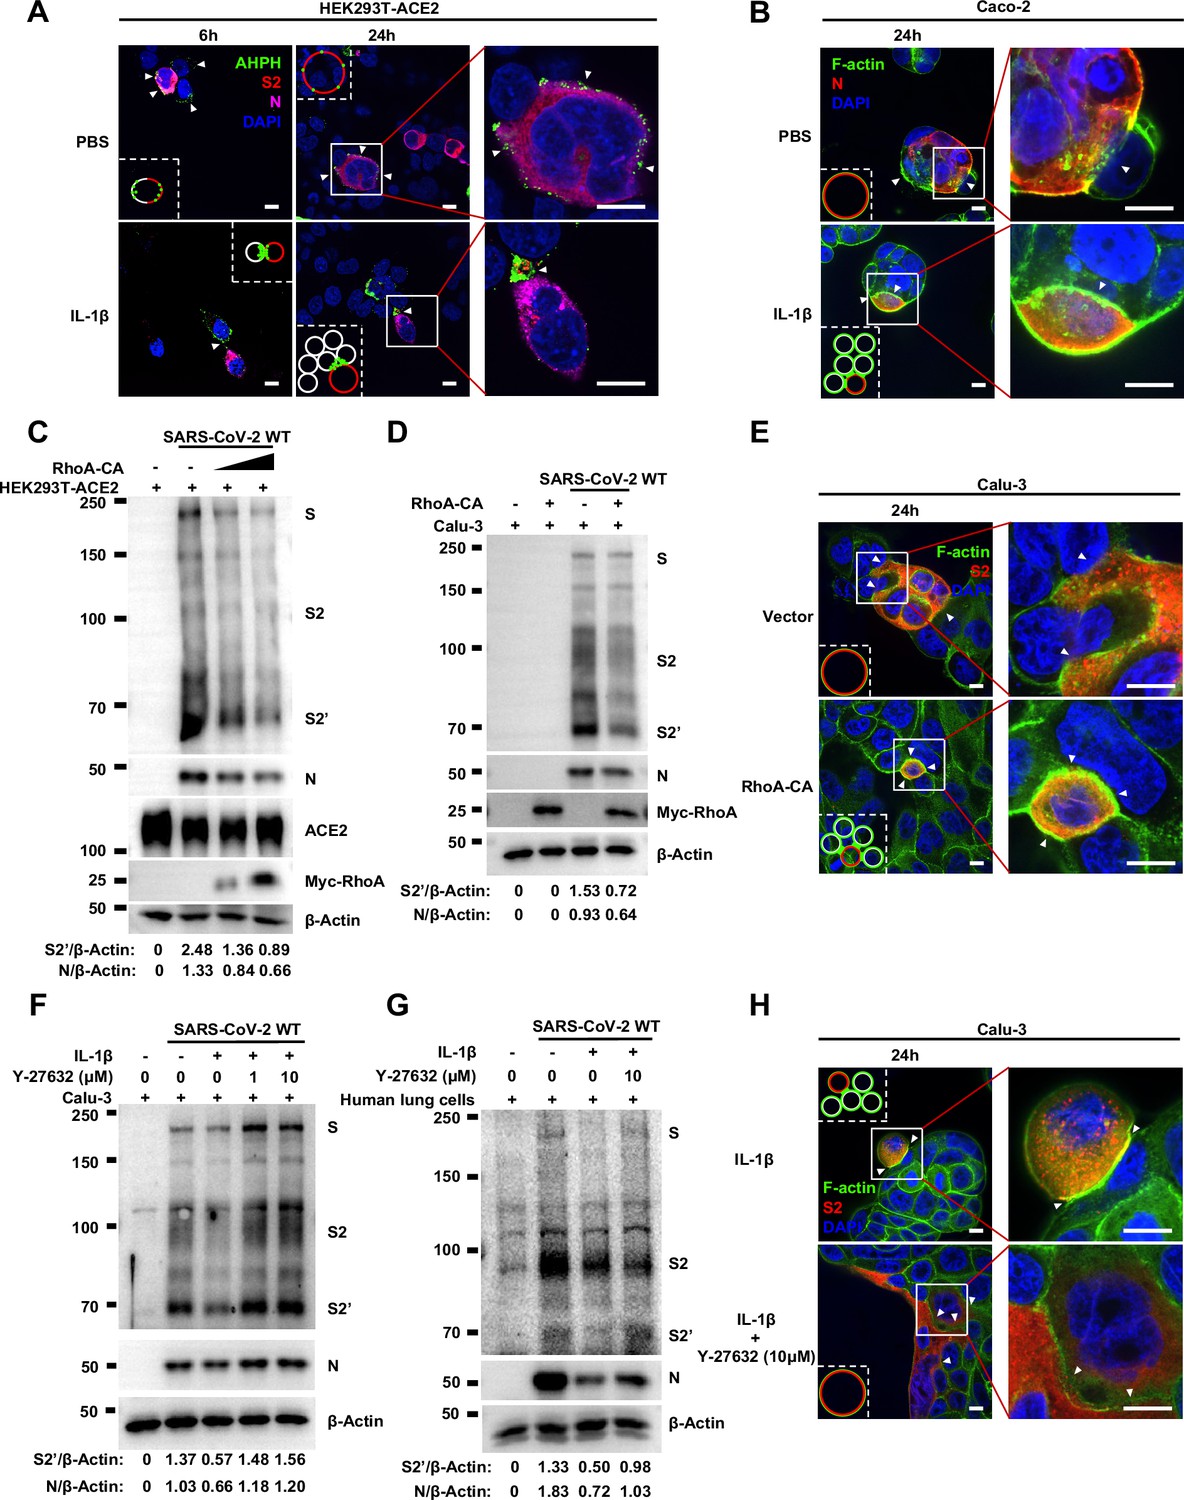
Activation of RhoA/ROCK pathway prevents authentic severe acute respiratory syndrome coronavirus 2 (SARS-CoV-2)-induced cell-cell fusion via forming actin bundles.
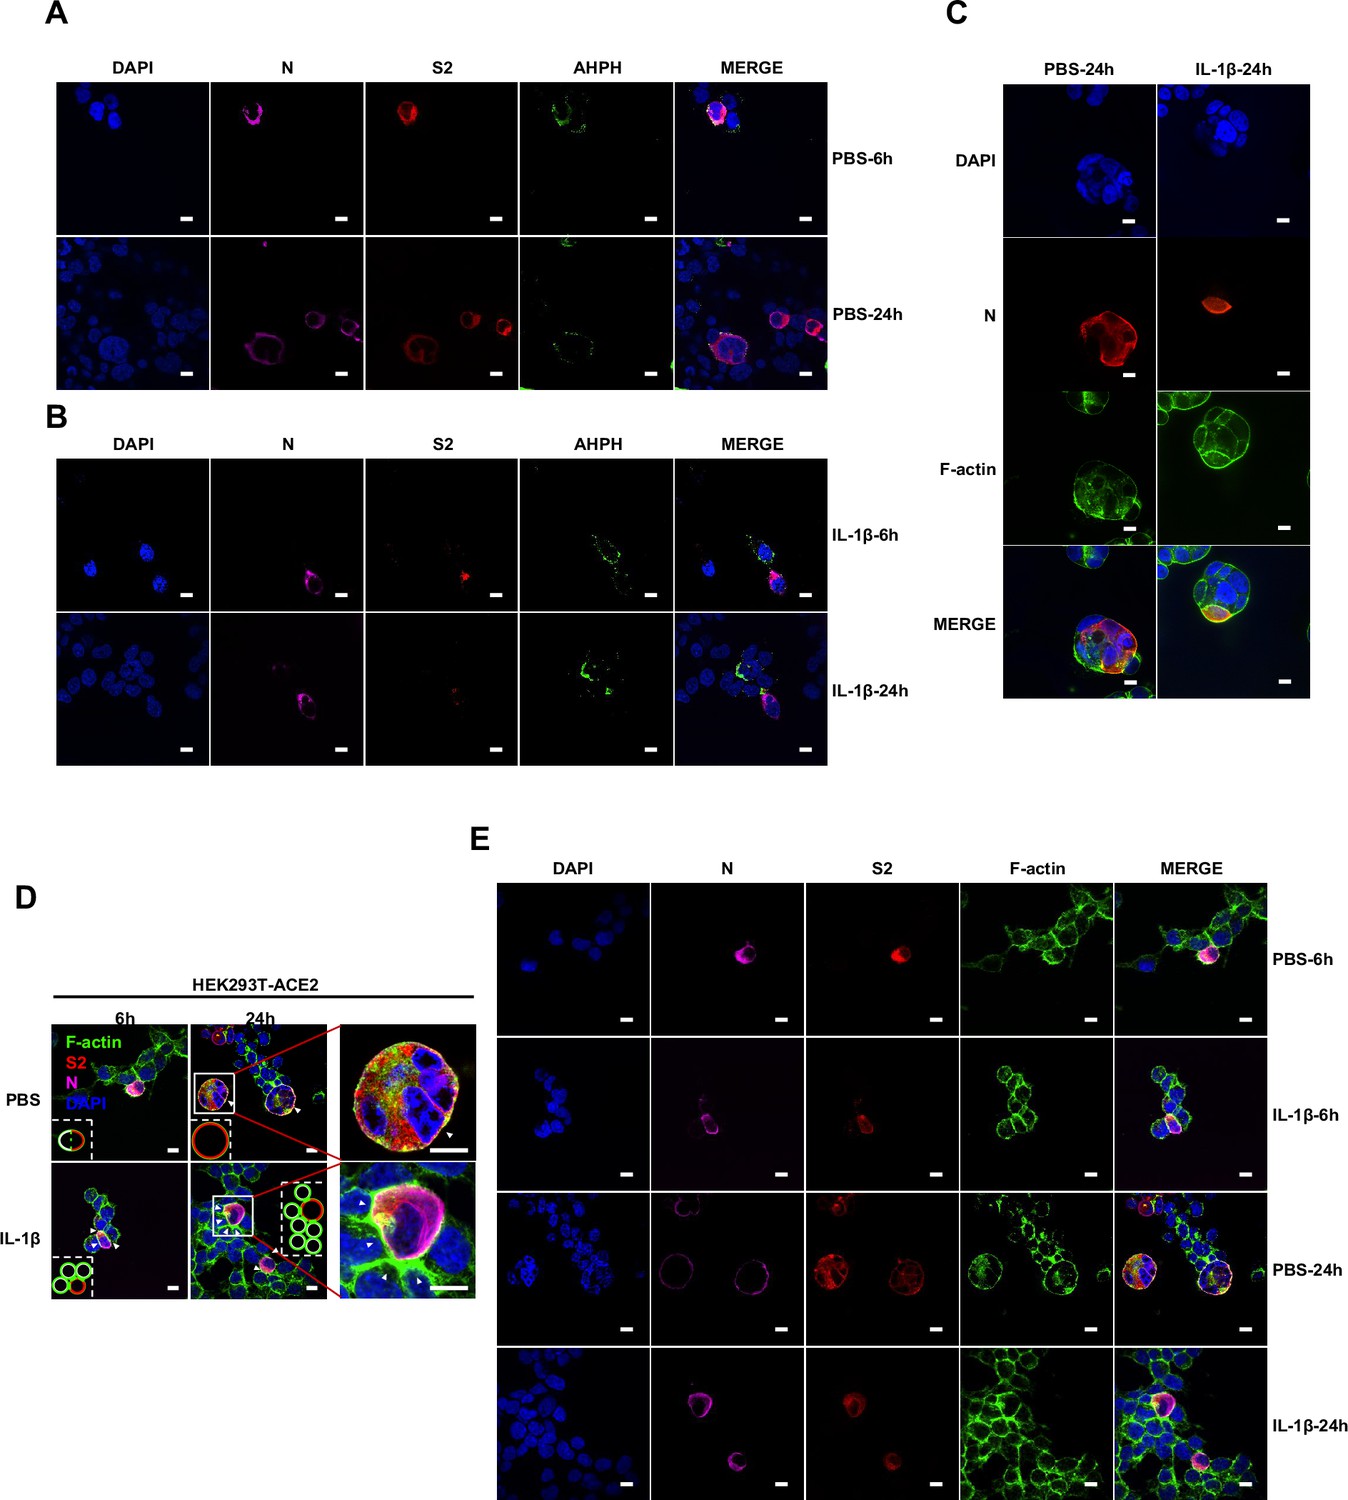
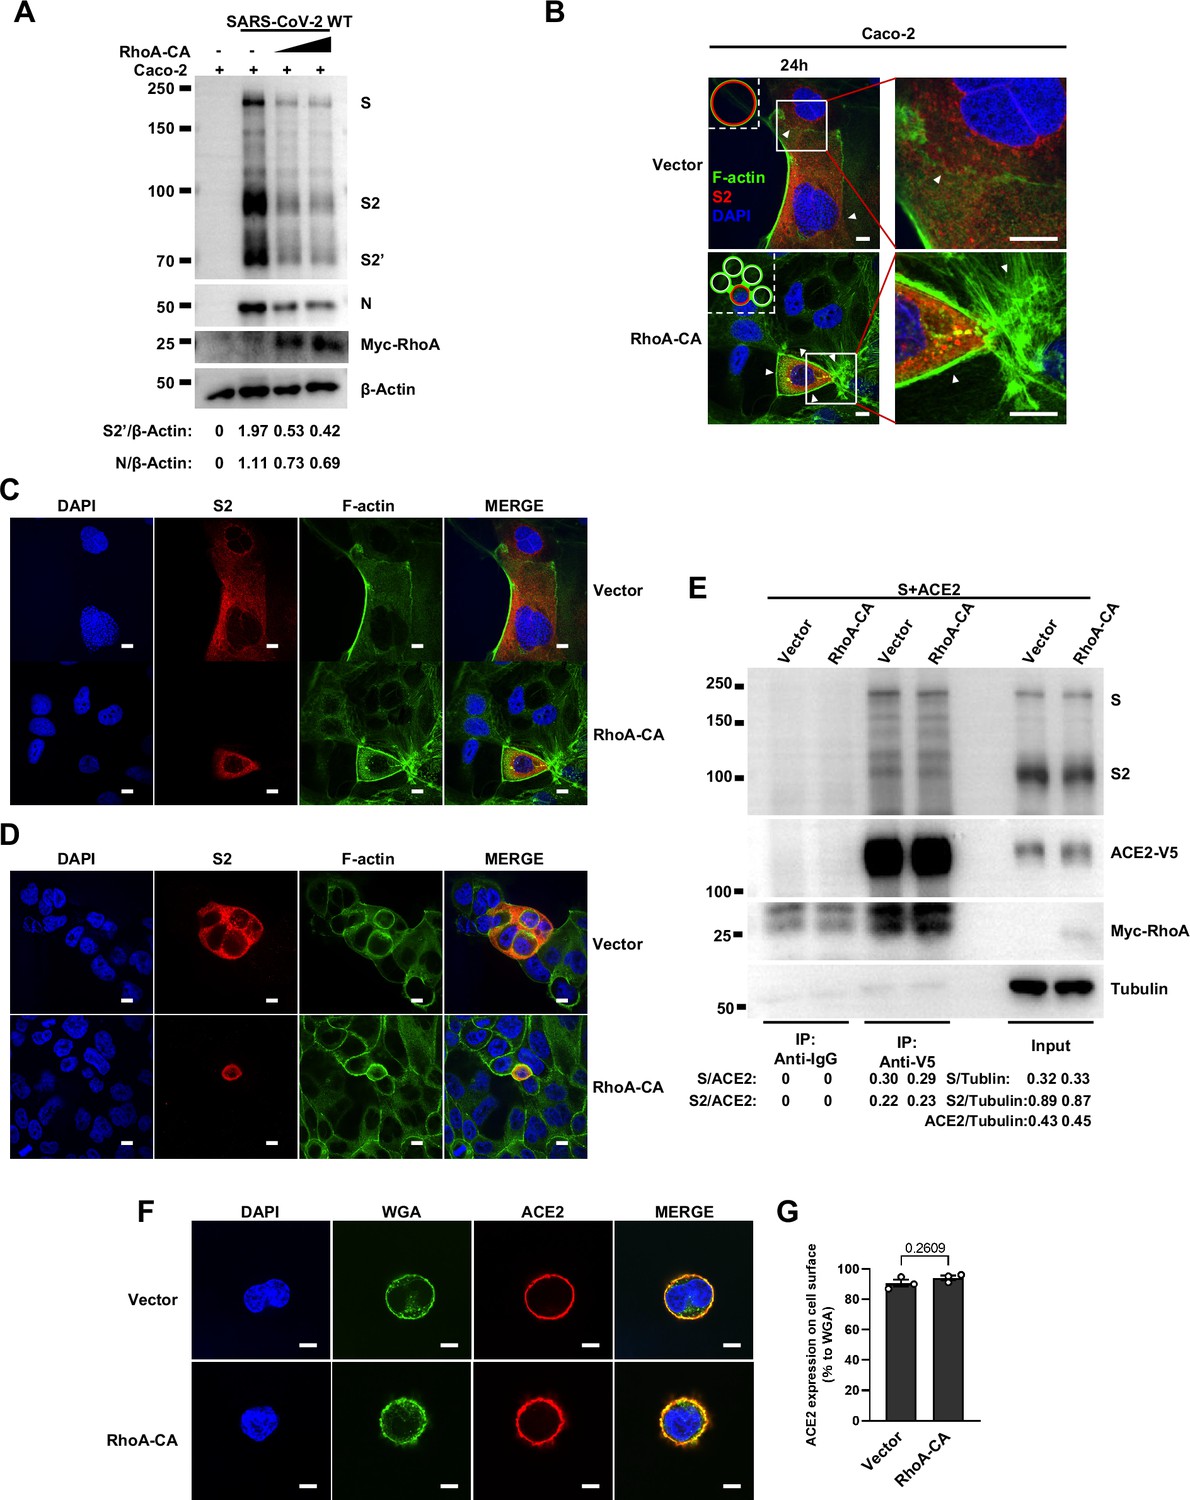
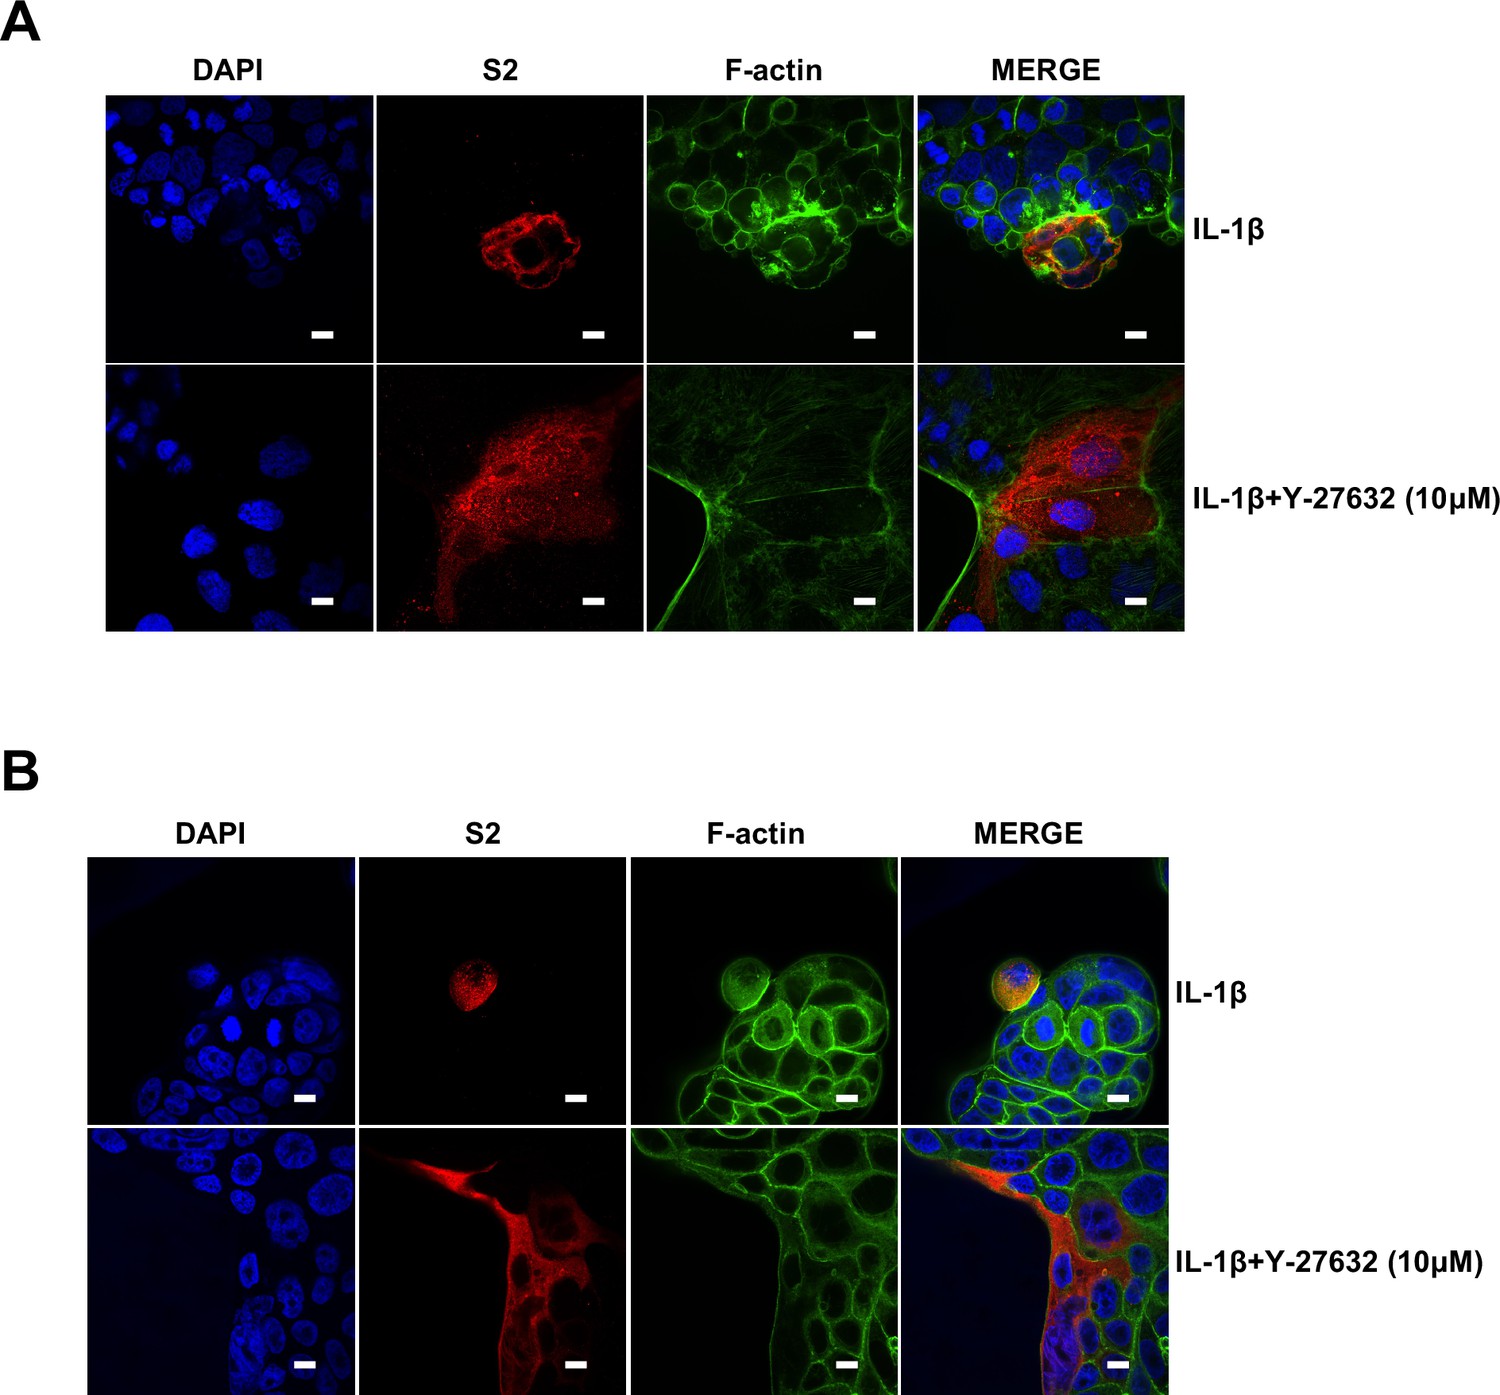
(A) Representative confocal images of GFP-AHPH localization with or without 1 ng/mL interleukin-1β (IL-1β) treatment in 0.5 multiplicity of infection (MOI) wild-type (WT) authentic SARS-CoV-2-infected HEK293T-ACE2 cells at 6 and 24 hr post-infection (hpi). Schematics with green dots in the white dashed line boxes representing GFP-AHPH, red cycles representing SARS-CoV-2-infected cells, and white cycles representing neighboring cells. White arrowheads indicate the localization of GFP-AHPH, scale bars, 10 μm. Images are representative of three independent experiments. (B) Representative confocal images of F-actin stained with phalloidin-488 in the presence or absence of 1 ng/mL IL-1β treatment upon 0.5 MOI WT authentic SARS-CoV-2 infection of Caco-2 cells at 24 hpi. Schematics with green lines in the white dashed line boxes representing actin bundles, red cycles representing SARS-CoV-2-infected cells, and white cycles representing neighboring cells. Scale bars, 10 μm. Images are representative of three independent experiments. (C) Immunoblots of WT SARS-CoV-2 S, S2, cleaved S2’, N, and Myc-RhoA collected from HEK293T-ACE2 cells, which were transfected with vector, 10 or 20 ng RhoA-CA before infection with 0.5 MOI authentic SARS-CoV-2 WT strain for 24 hr. Blots are representative of three individual experiments. Numbers below the blots indicated the intensity of S2’ or N versus β-Actin. (D) Immunoblots of WT SARS-CoV-2 S, S2, cleaved S2’, N, and Myc-RhoA collected from lentivirus-transduced Calu-3 cells expressing vector or RhoA-CA, infected with WT authentic SARS-CoV-2 for 24 hr. Blots are representative of three individual experiments. Numbers below the blots indicated the intensity of S2’ or N versus β-Actin. (E) Representative confocal images of F-actin stained with phalloidin-488 from Calu-3 cells described in (D). Schematics with green lines in the white dashed line boxes representing actin bundles, red cycles representing S-expressing cells, scale bars, 10 μm. Images are representative of four independent experiments. (F, G) Immunoblots of WT SARS-CoV-2 S, S2, cleaved S2’, and N collected from Calu-3 cells (F) or primary human lung cells (G), which were infected with authentic SARS-CoV-2 for 1 hr, then washed with phosphate buffered saline (PBS) before being treated with different concentrations of Y-27632 and 10 ng/mL IL-1β for 24 hr. Blots are representative of three independent experiments. Numbers below the blots indicated the intensity of S2’ or N versus β-Actin. (H) Representative confocal images of F-actin stained with phalloidin-488 in Calu-3 cells described in (F). Schematics with green lines in the white dashed line boxes representing actin bundles, red cycles representing S-expressing cells. White arrowheads (B, E, and H) indicate the enrichment or disappearance of F-actin, scale bars, 10 μm. Images are representative of four independent experiments.
-
Figure 5—source data 1
Annotated, uncropped blots in Figure 5.
- https://cdn.elifesciences.org/articles/98593/elife-98593-fig5-data1-v1.pdf
-
Figure 5—source data 2
Raw, uncropped blots in Figure 5.
- https://cdn.elifesciences.org/articles/98593/elife-98593-fig5-data2-v1.zip
Figure 5—figure supplement 1
Single-channel confocal images.
(A) Single-channel confocal images of Figure 5A (top panel). (B) Single-channel confocal images of Figure 5A (bottom panel). (C) Single-channel confocal images of Figure 5B. (D) Representative confocal images of F-actin stained with phalloidin-488 in the presence or absence of 1 ng/mL interleukin-1β (IL-1β) treatment in 0.5 multiplicity of infection (MOI) wild-type (WT) authentic severe acute respiratory syndrome coronavirus 2 (SARS-CoV-2)-infected HEK293T-ACE2 cells at 6 or 24 hr post-infection (hpi). Schematics with green lines in the white dashed line boxes representing actin bundles, red cycles representing SARS-CoV-2-infected cells, and white cycles representing neighboring cells. White arrowheads indicate the enrichment or disappearance of F-actin, scale bars, 10 μm. Images are representative of four independent experiments. (E) Single-channel confocal images of (D).
Figure 5—figure supplement 2
RhoA-CA does not affect Spike protein binding to ACE2 or ACE2 distribution on the cell surface.
(A) Immunoblots of wild-type (WT) severe acute respiratory syndrome coronavirus 2 (SARS-CoV-2) S, S2, cleaved S2’, N, and Myc-RhoA collected from Caco-2 cells, which were transfected with vector, 10 or 20 ng RhoA-CA before infection with 0.5 multiplicity of infection (MOI) WT authentic SARS-CoV-2 for 24 hr. Blots are representative of three individual experiments. Numbers below the blots indicated the intensity of S2’ or N versus β-Actin. (B) Representative confocal images of F-actin stained with phalloidin-488 from Caco-2 cells described in (A). Schematics with green lines in the white dashed line boxes representing actin bundles, red cycles representing S-expressing cells. White arrowheads indicate the enrichment or disappearance of F-actin, scale bars, 10 μm. Images are representative of four independent experiments. (C) Single-channel confocal images of (B). (D) Single-channel confocal images of Figure 5E. (E) Co-immunoprecipitation (IP) and input controls of full-length spike protein after anti-V5 or anti-IgG pull-down from cell lysates mixed between HEK293T cells expressing ACE2-V5-6his or Spike protein with vector or RhoA-CA (10 ng). Blots are representative of three individual experiments. Numbers below the blots indicated the intensity of S or S2 versus ACE2 in IP group and S, S2, or ACE2 versus Tubulin in input group. (F) Representative confocal images of wheat germ agglutinin (WGA, cell surface marker) and ACE2 from HEK293T cells co-transfected with ACE2 and vector or RhoA-CA (10 ng). Scale bars, 10 μm. Images are representative of three independent experiments. (G) Quantification of the relative ACE2 expression on the cell surface in (F).
-
Figure 5—figure supplement 2—source data 1
Annotated, uncropped blots in Figure 5—figure supplement 2.
- https://cdn.elifesciences.org/articles/98593/elife-98593-fig5-figsupp2-data1-v1.pdf
-
Figure 5—figure supplement 2—source data 2
Raw, uncropped blots in Figure 5—figure supplement 2.
- https://cdn.elifesciences.org/articles/98593/elife-98593-fig5-figsupp2-data2-v1.zip
-
Figure 5—figure supplement 2—source data 3
Source data of the individual points in Figure 5—figure supplement 2.
- https://cdn.elifesciences.org/articles/98593/elife-98593-fig5-figsupp2-data3-v1.xlsx
Figure 5—figure supplement 3

Interleukin-1β (IL-1β) does not affect ACE2 and Spike distribution on the cell surface.
(A) Representative confocal images of wheat germ agglutinin (WGA) and ACE2 from HEK293T cells transfected with ACE2 and treated with phosphate buffered saline (PBS) or IL-1β. Scale bars, 10 μm. Images are representative of three independent experiments. (B) Quantification of the relative ACE2 expression on the cell surface in (A). (C) Representative confocal images of WGA and Spike from HEK293T cells transfected with Spike and treated with PBS or IL-1β. Scale bars, 10 μm. Images are representative of three independent experiments. (D) Quantification of the relative Spike expression on the cell surface in (C). (E) Luciferase activity (relative luminescence units [RLU]) measured from HEK293T cell lysates and immunoblots showing full-length spike, S2 and cleaved S2’, ACE2 collected from HEK293T-S, and HEK293T-ACE2 pre-treated with different concentrations of Y-27632 for 30 min, then treated with 1 ng/mL IL-1β for 16 hr. Data and blots are representative of three independent experiments. Numbers below the blots indicated the intensity of S2’ versus Tubulin. (F) Immunoblots of wild-type (WT) severe acute respiratory syndrome coronavirus 2 (SARS-CoV-2) S, S2, cleaved S2’, and N collected from Caco-2 cells, which were treated with different concentrations of Y-27632 and 10 ng/mL IL-1β for 1 hr, then infected with 0.5 multiplicity of infection (MOI) WT authentic SARS-CoV-2 for 24 hr. Blots are representative of three individual experiments. Numbers below the blots indicated the intensity of S2’ or N versus β-Actin. (G) Representative confocal images of F-actin stained with phalloidin-488 in Caco-2 cells described in (F). Schematics with green lines in the white dashed line boxes representing actin bundles, red cycles representing S-expressing cells. White arrowheads indicate the enrichment or disappearance of F-actin, scale bars, 10 μm. Images are representative of four independent experiments.
-
Figure 5—figure supplement 3—source data 1
Annotated, uncropped blots in Figure 5—figure supplement 3.
- https://cdn.elifesciences.org/articles/98593/elife-98593-fig5-figsupp3-data1-v1.pdf
-
Figure 5—figure supplement 3—source data 2
Raw, uncropped blots in Figure 5—figure supplement 3.
- https://cdn.elifesciences.org/articles/98593/elife-98593-fig5-figsupp3-data2-v1.zip
-
Figure 5—figure supplement 3—source data 3
Source data of the individual points in Figure 5—figure supplement 3.
- https://cdn.elifesciences.org/articles/98593/elife-98593-fig5-figsupp3-data3-v1.xlsx
Figure 5—figure supplement 4
Single-channel confocal images.
(A) Single-channel confocal images of Figure 5—figure supplement 3G. (B) Single-channel confocal images of Figure 5H.
Figure 6 with 2 supplements
Interleukin-1β (IL-1β) restricts severe acute respiratory syndrome coronavirus 2 (SARS-CoV-2) transmission via induction of actin bundles in the lung in vivo.
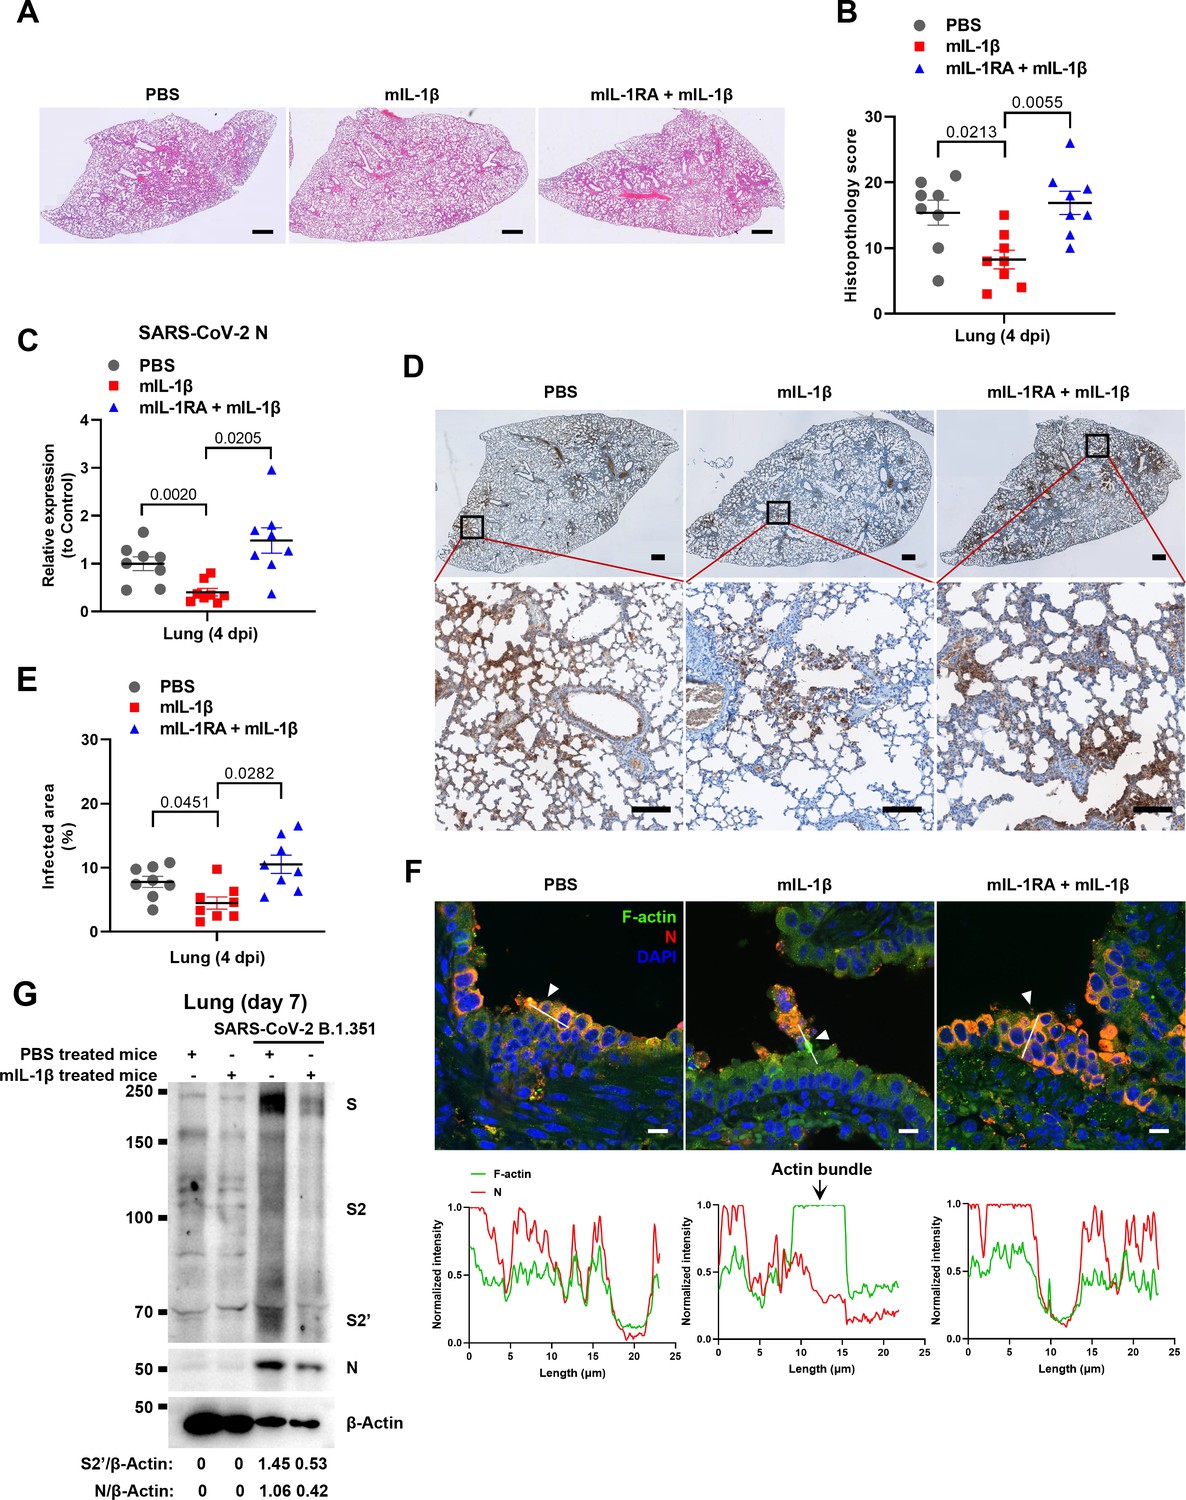
(A, B) Representative images of hematoxylin and eosin (H&E)-stained lung sections (A) and histopathology scores (B) from phosphate buffered saline (PBS); 1 μg/kg mIL-1β; 150 μg/kg mIL-1RA+mIL-1β pre-treated mice infected with SARS-CoV-2 at 4 days post-infection (dpi), scale bars are indicative of 500 μm and images are representative of eight samples. (C) qPCR analysis of SARS-CoV-2 N mRNA collected from infected lung tissues at 4 dpi. (D) Immunohistochemistry analysis of SARS-CoV-2 N staining in the lung tissue slices at 4 dpi, scale bars are indicative of 500 μm (top panel), 50 μm (bottom panel), and images are representative of eight samples. (E) The percentages of SARS-CoV-2-infected area in (D) were quantified. (F) Representative confocal images of F-actin stained with phalloidin-488 and SARS-CoV-2 N in the area 1 of lung tissue at 4 dpi. White arrowheads indicate syncytia formation or infected cells, scale bars are indicative of 10 μm and images are representative of three samples (top). White lines indicate SARS-CoV-2 cell-cell transmission and quantify with fluorescence intensity of F-actin and SARS-CoV-2 N (bottom). (G) Immunoblots of SARS-CoV-2 S, S2, cleaved S2’, and N proteins collected from SARS-CoV-2 B.1.351-infected lung tissue cells, which were isolated from BALB/c mice treated with or without 1 μg/kg mIL-1β at day 7. Blots are representative of three individual mouse. Numbers below the blots indicated the intensity of S2’ or N versus β-Actin.
-
Figure 6—source data 1
Annotated, uncropped blots in Figure 6.
- https://cdn.elifesciences.org/articles/98593/elife-98593-fig6-data1-v1.pdf
-
Figure 6—source data 2
Raw, uncropped blots in Figure 6.
- https://cdn.elifesciences.org/articles/98593/elife-98593-fig6-data2-v1.zip
-
Figure 6—source data 3
Source data of the individual points in Figure 6.
- https://cdn.elifesciences.org/articles/98593/elife-98593-fig6-data3-v1.xlsx
Figure 6—figure supplement 1
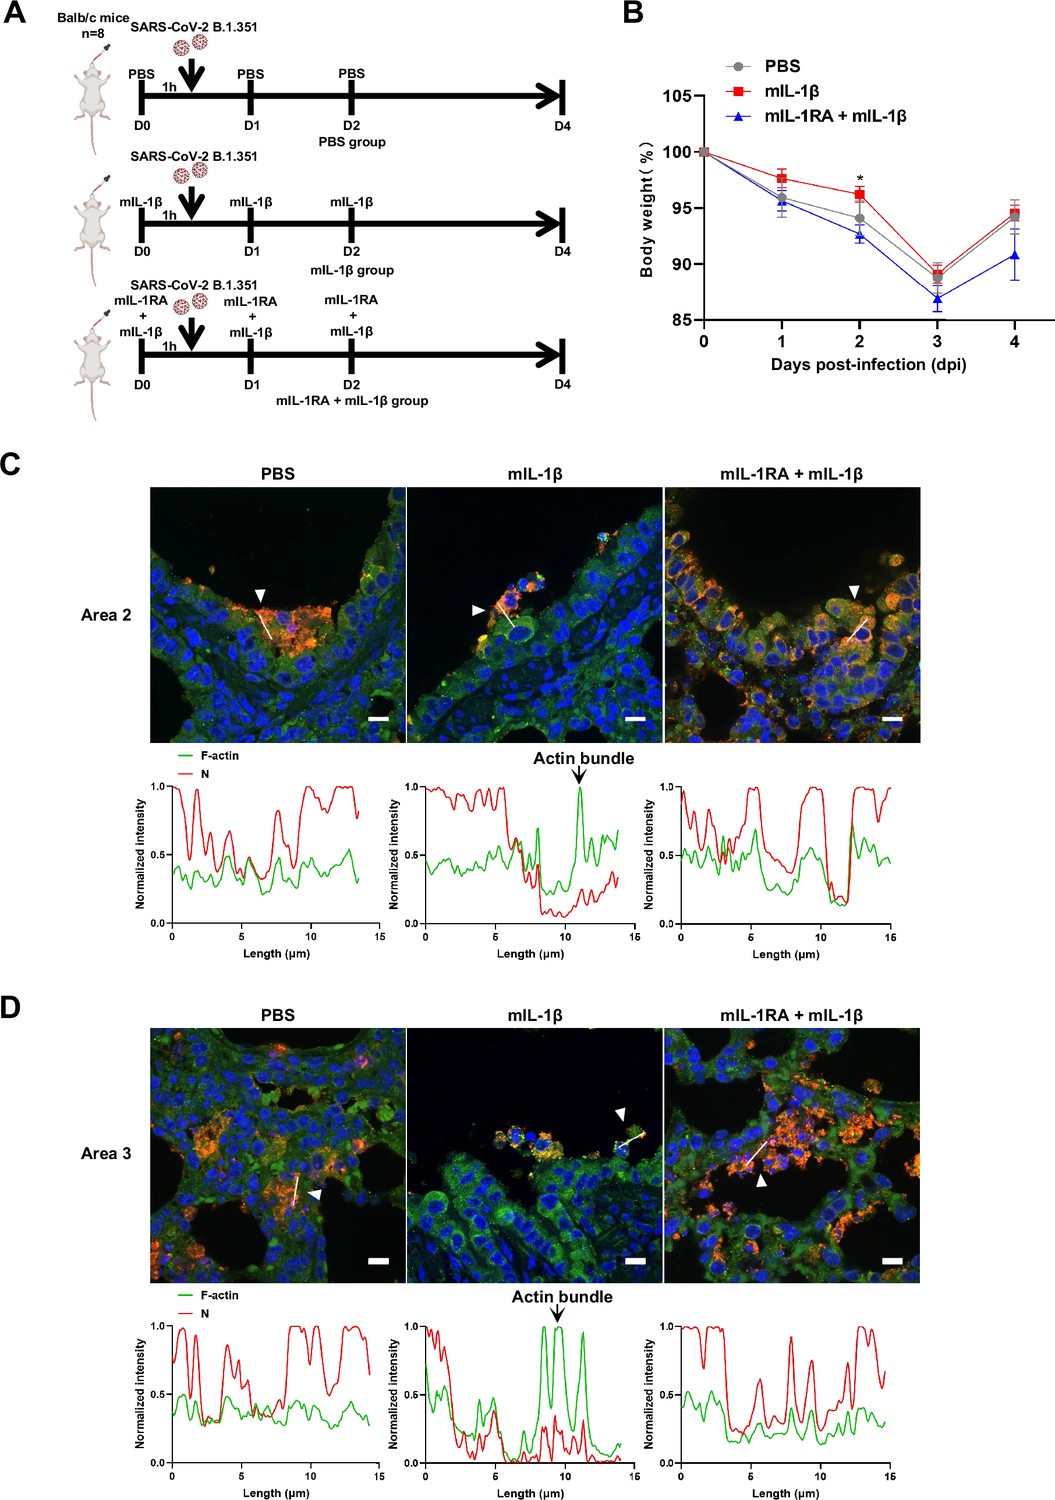
Interleukin-1β (IL-1β) reduces the weight loss and viral transmission upon severe acute respiratory syndrome coronavirus 2 (SARS-CoV-2) infection in vivo.
(A) Schematic for a murine model of authentic SARS-CoV-2 infection, phosphate buffered saline (PBS) control (n=8); 1 μg/kg mIL-1β (n=8); 150 μg/kg mIL-1RA+1 μg/kg mIL-1β (n=8) were administered 1 hr before intranasal challenge with 5×10⁴ FFU of SARS-CoV-2 B.1.351; mice were then intraperitoneally injected with PBS, mIL-1β and mIL-1RA+mIL-1β at 1 and 2 day post-infection (dpi), before sacrificed at 4 dpi. (B) The body weights were assessed daily for weight loss after SARS-CoV-2 infection. (C, D) Representative confocal images of F-actin stained with phalloidin-488 and SARS-CoV-2 N in the area 2 (C) and area 3 (D) of lung tissue at 4 dpi. White arrowheads indicate syncytia formation or infected cells, scale bars are indicative of 10 μm and images are representative of three samples (top). White lines indicate SARS-CoV-2 cell-cell transmission and quantify with fluorescence intensity of F-actin and SARS-CoV-2 N (bottom).
-
Figure 6—figure supplement 1—source data 1
Source data of the individual points in Figure 6—figure supplement 1.
- https://cdn.elifesciences.org/articles/98593/elife-98593-fig6-figsupp1-data1-v1.xlsx
Figure 6—figure supplement 2
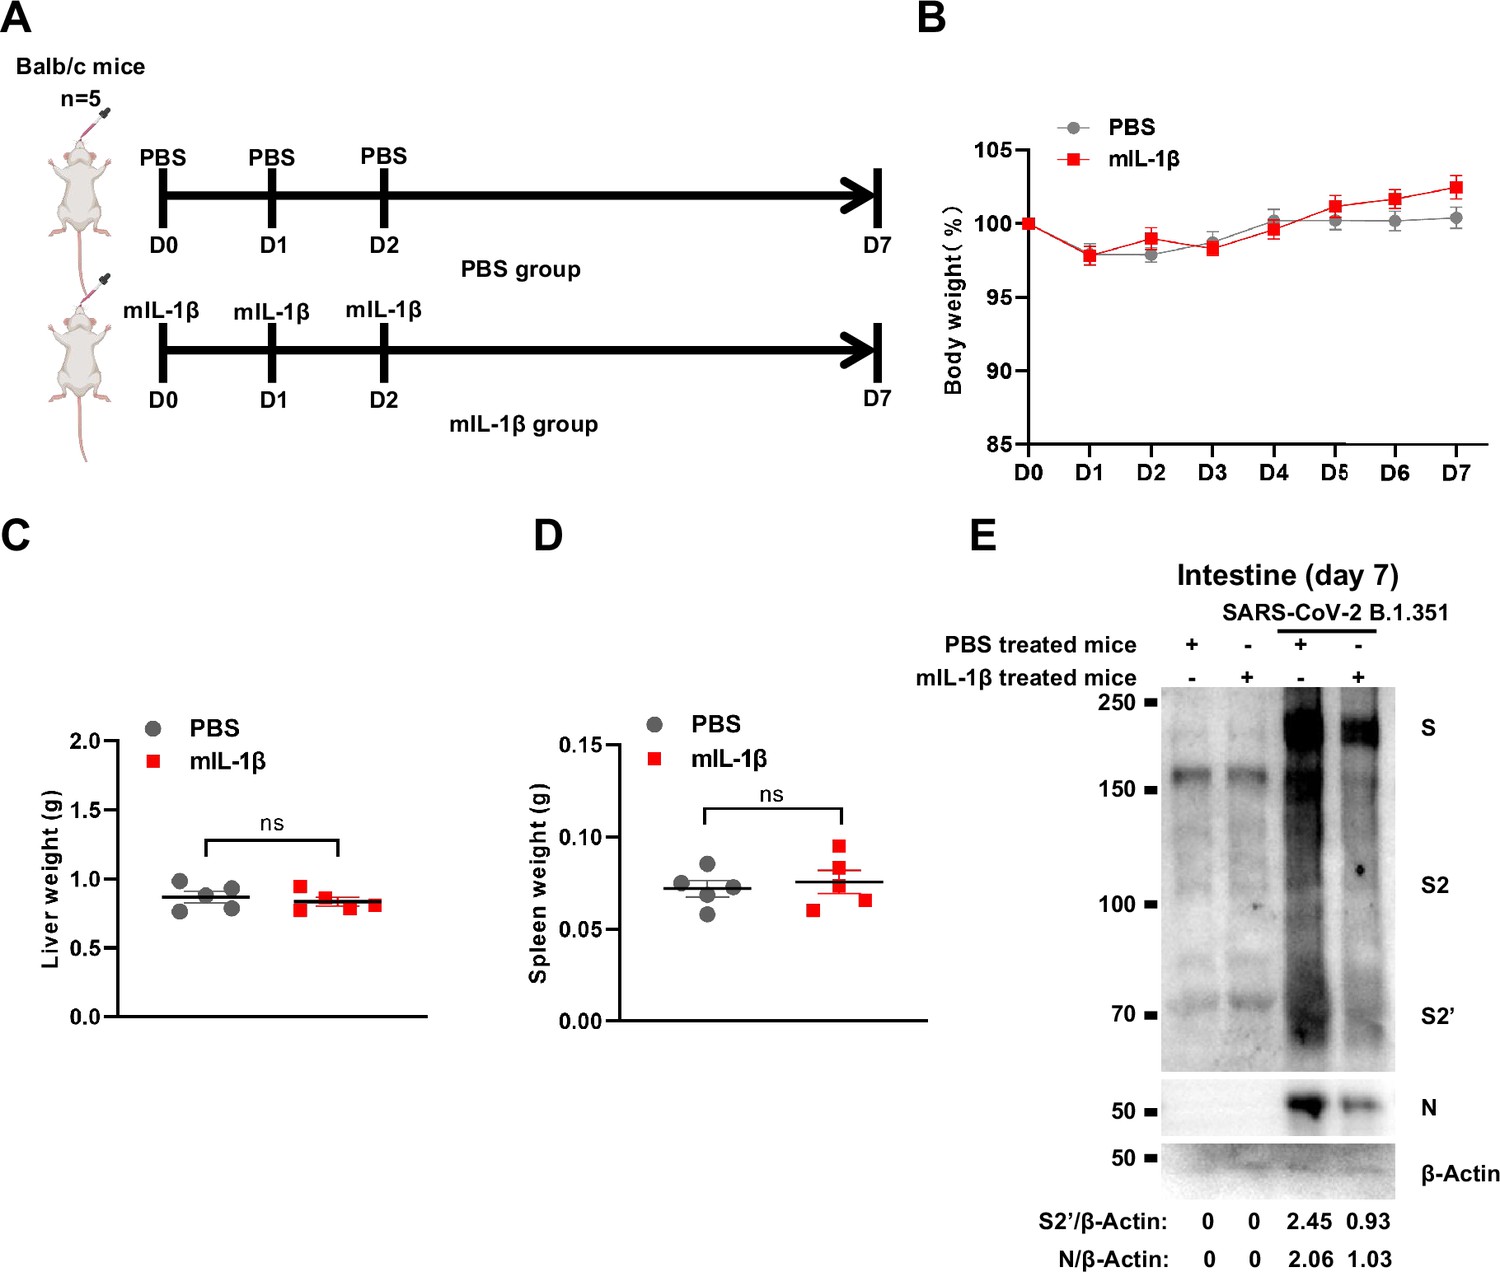
Treatment with 1 μg/kg mIL-1β protects mouse lung and intestinal tissue cells against severe acute respiratory syndrome coronavirus 2 (SARS-CoV-2) infection without toxicity in vivo.
(A) Schematic of phosphate buffered saline (PBS) (n=5) and mIL-1β (n=5) treated BALB/c mice. (B) The body weights were assessed daily for weight loss. Liver (C) and spleen (D) weights were assessed at day 7. (E) Immunoblots of SARS-CoV-2 S, S2, cleaved S2’, and N proteins collected from SARS-CoV-2 B.1.351-infected intestine tissue cells, which isolated from BALB/c mice treated with or without 1 μg/kg mIL-1β at day 7. Blots are representative of three individual mouse. Numbers below the blots indicated the intensity of S2’ or N versus β-Actin.
-
Figure 6—figure supplement 2—source data 1
Annotated, uncropped blots in Figure 6—figure supplement 2.
- https://cdn.elifesciences.org/articles/98593/elife-98593-fig6-figsupp2-data1-v1.pdf
-
Figure 6—figure supplement 2—source data 2
Raw, uncropped blots in Figure 6—figure supplement 2.
- https://cdn.elifesciences.org/articles/98593/elife-98593-fig6-figsupp2-data2-v1.zip
-
Figure 6—figure supplement 2—source data 3
Source data of the individual points in Figure 6—figure supplement 2.
- https://cdn.elifesciences.org/articles/98593/elife-98593-fig6-figsupp2-data3-v1.xlsx
Figure 7 with 3 supplements
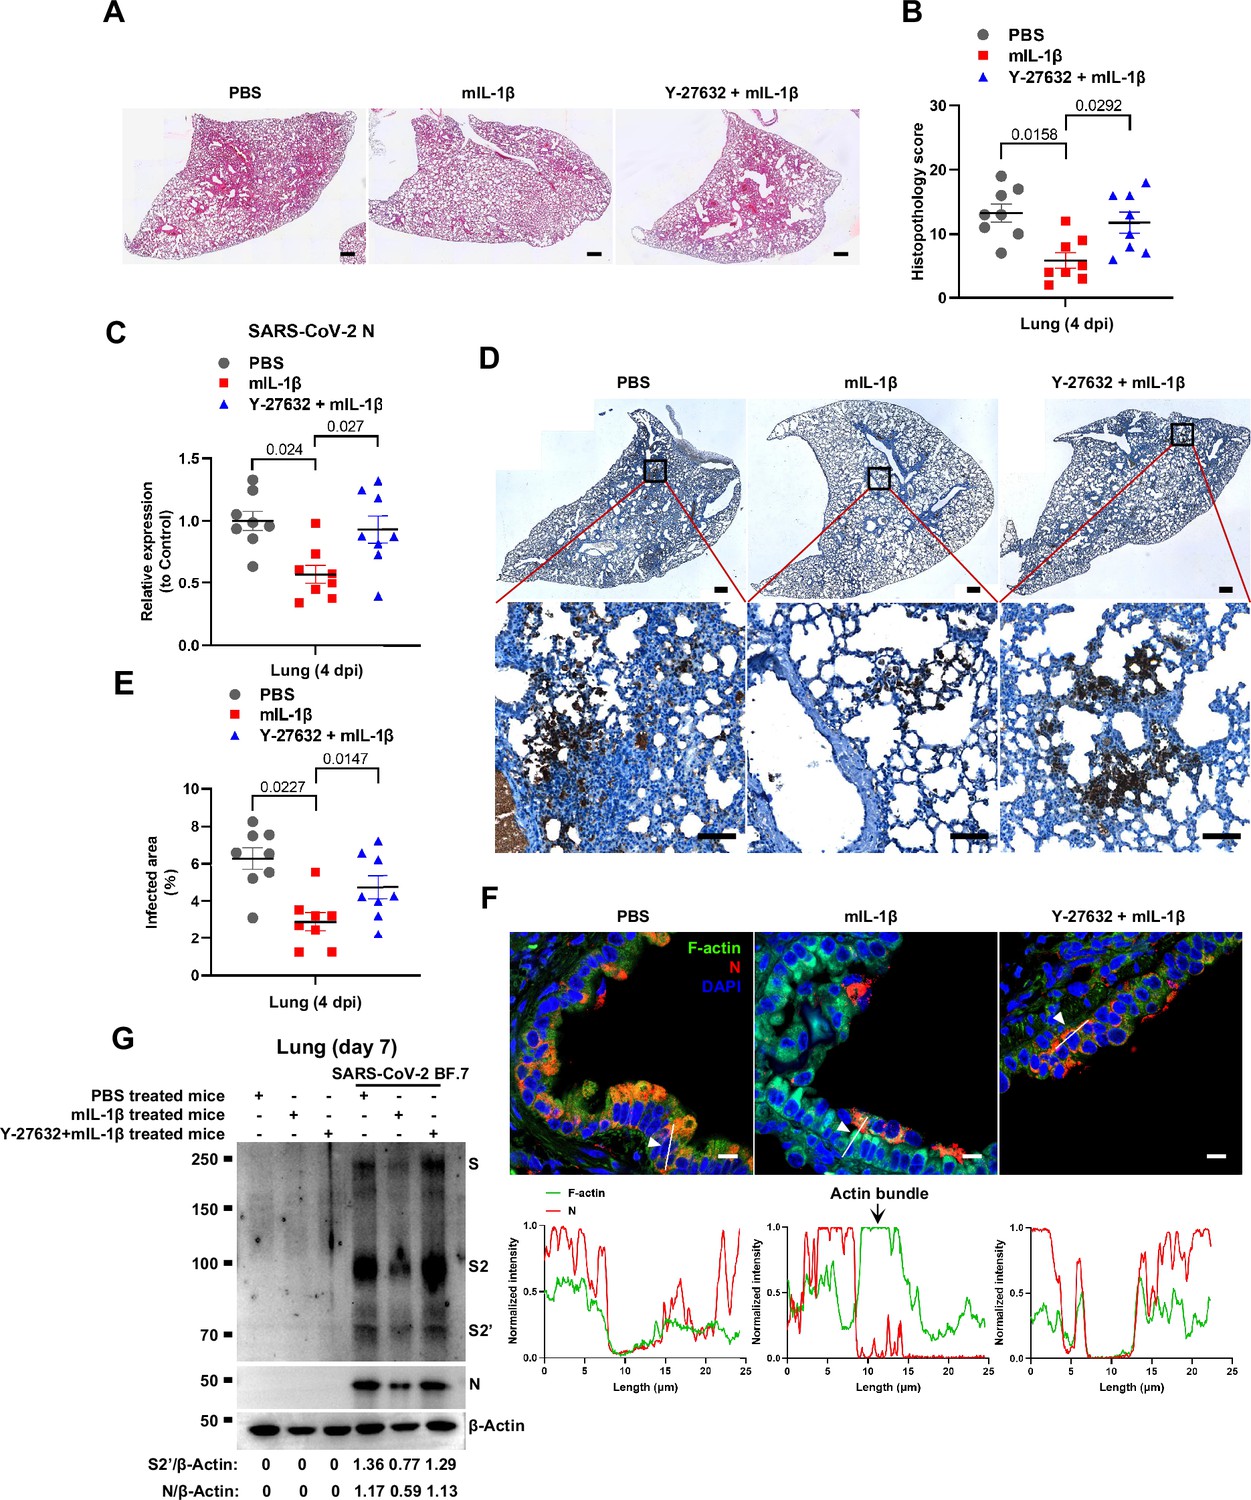
Prevention of interleukin-1β (IL-1β)-induced actin bundles by ROCK inhibitor Y-27632 promotes severe acute respiratory syndrome coronavirus 2 (SARS-CoV-2) transmission in vivo.
(A, B) Representative images of hematoxylin and eosin (H&E)-stained lung sections (A) and histopathology scores (B) from phosphate buffered saline (PBS); 1 μg/kg mIL-1β; 1 mg/kg Y-27632+mIL-1β pre-treated mice infected with SARS-CoV-2 at 4 days post-infection (dpi), scale bars are indicative of 500 μm and images are representative of eight samples. (C) qPCR analysis of SARS-CoV-2 N mRNA collected from infected lung tissues at 4 dpi. (D) Immunohistochemistry analysis of SARS-CoV-2 N staining in the lung tissue slices at 4 dpi, scale bars are indicative of 500 μm (top panel), 50 μm (bottom panel) and images are representative of eight samples. (E) The percentages of SARS-CoV-2-infected area in (D) were quantified. (F) Representative confocal images of F-actin stained with phalloidin-488 and SARS-CoV-2 N in the area 1 of lung tissue at 4 dpi. White arrowheads indicate syncytia formation or infected cells, scale bars are indicative of 10 μm and images are representative of three samples (top). White lines indicate SARS-CoV-2 cell-cell transmission and quantify with fluorescence intensity of F-actin and SARS-CoV-2 N (bottom). (G) Immunoblots of SARS-CoV-2 S, S2, cleaved S2’, and N proteins collected from authentic SARS-CoV-2 BF.7-infected lung tissue cells, which were isolated from BALB/c mice treated with PBS, 1 μg/kg mIL-1β or 1 mg/kg Y-27632+1 μg/kg mIL-1β at day 7. Blots are representative of three individual mouse. Numbers below the blots indicated the intensity of S2’ or N versus β-Actin.
-
Figure 7—source data 1
Annotated, uncropped blots in Figure 7.
- https://cdn.elifesciences.org/articles/98593/elife-98593-fig7-data1-v1.pdf
-
Figure 7—source data 2
Raw, uncropped blots in Figure 7.
- https://cdn.elifesciences.org/articles/98593/elife-98593-fig7-data2-v1.zip
-
Figure 7—source data 3
Source data of the individual points in Figure 7.
- https://cdn.elifesciences.org/articles/98593/elife-98593-fig7-data3-v1.xlsx
Figure 7—figure supplement 1
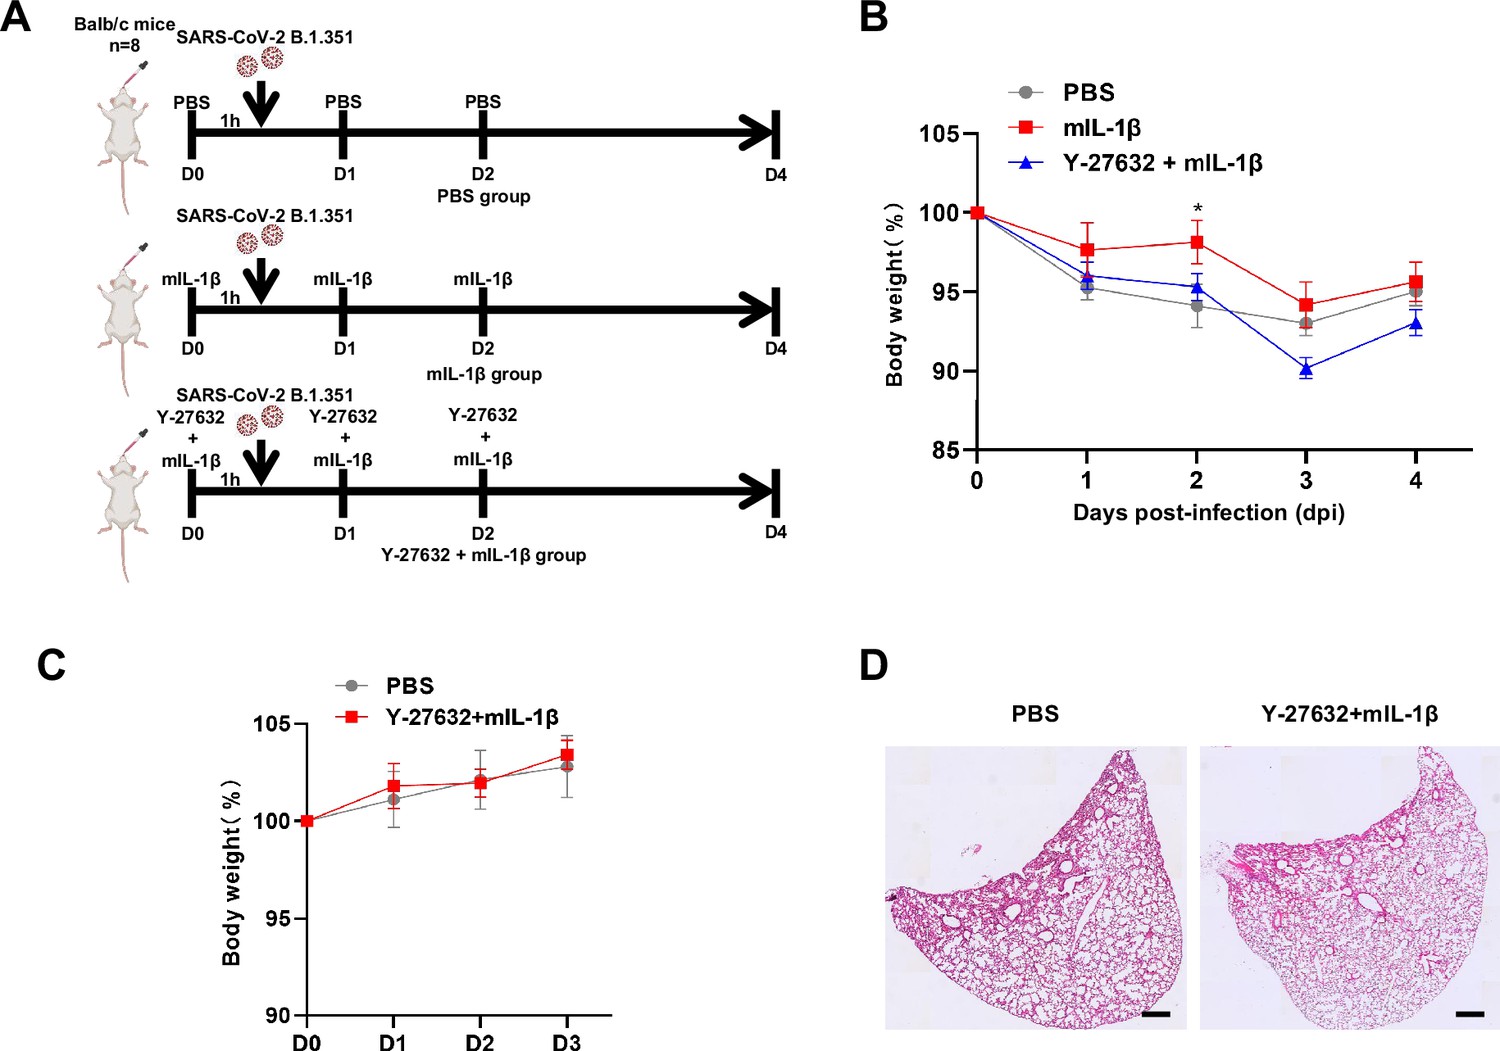
Y-27632+IL-1β do not cause weight loss and lung injury in uninfected BALB/c mice.
(A) Schematic for a murine model of authentic severe acute respiratory syndrome coronavirus 2 (SARS-CoV-2) infection, phosphate buffered saline (PBS) control (n=8); 1 μg/kg mIL-1β (n=8); 1mg/kg Y-27632+1 μg/kg mIL-1β (n=8) were administered 1 hr before intranasal challenge with 5×10⁴ FFU of SARS-CoV-2 B.1.351; mice were then intraperitoneally injected with PBS, mIL-1β, and Y-27632+mIL-1β at 1 and 2 day post-infection (dpi), before sacrificed at 4 dpi. (B) The body weights were assessed daily for weight loss after SARS-CoV-2 infection. (C) The body weights were assessed daily from PBS or Y-27632+mIL-1β-treated uninfected mice. (D) Representative images of hematoxylin and eosin (H&E)-stained lung sections from PBS or Y-27632+mIL-1β-treated uninfected mice at day 7, scale bars are indicative of 500 μm and images are representative of four samples.
-
Figure 7—figure supplement 1—source data 1
Source data of the individual points in Figure 7—figure supplement 1.
- https://cdn.elifesciences.org/articles/98593/elife-98593-fig7-figsupp1-data1-v1.xlsx
Figure 7—figure supplement 2
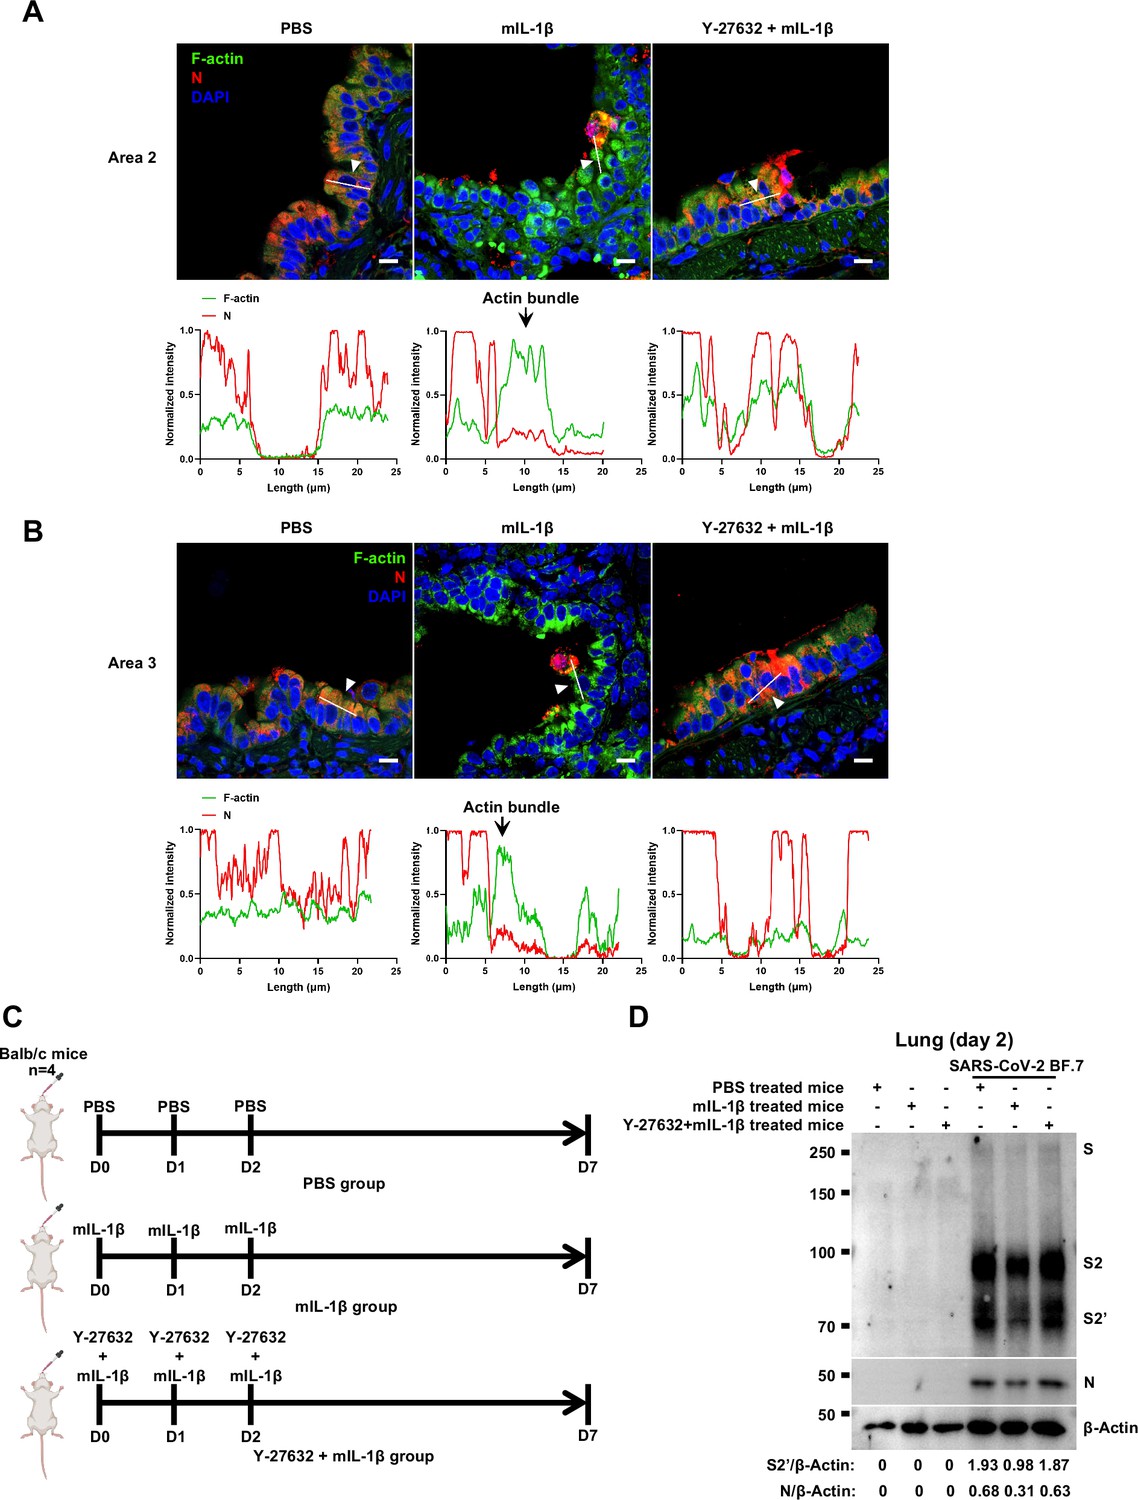
Y-27632 treatment prevents the formation of interleukin-1β (IL-1β)-induced actin bundles at cell-cell junctions in vivo.
(A, B) Representative confocal images of F-actin stained with phalloidin-488 and severe acute respiratory syndrome coronavirus 2 (SARS-CoV-2) N in the area 2 (A) and area 3 (B) of lung tissue at 4 days post-infection (dpi). White arrowheads indicate syncytia formation or infected cells, scale bars are indicative of 10 μm and images are representative of three samples (top). White lines indicate SARS-CoV-2 cell-cell transmission and quantify with fluorescence intensity of F-actin and SARS-CoV-2 N (bottom). (C) Schematic of phosphate buffered saline (PBS) mIL-1β and Y-27632+mIL-1β-treated BALB/c mice. (D) Immunoblots of SARS-CoV-2 S, S2, cleaved S2’, and N proteins collected from authentic SARS-CoV-2 BF.7-infected lung tissue cells, which were isolated from BALB/c mice treated with PBS, 1 μg/kg mIL-1β or 1mg/kg Y-27632+1 μg/kg mIL-1β at day 2. Blots are representative of three individual mouse. Numbers below the blots indicated the intensity of S2’ or N versus β-Actin.
-
Figure 7—figure supplement 2—source data 1
Annotated, uncropped blots in Figure 7—figure supplement 2.
- https://cdn.elifesciences.org/articles/98593/elife-98593-fig7-figsupp2-data1-v1.pdf
-
Figure 7—figure supplement 2—source data 2
Raw, uncropped blots in Figure 7—figure supplement 2.
- https://cdn.elifesciences.org/articles/98593/elife-98593-fig7-figsupp2-data2-v1.zip
-
Figure 7—figure supplement 2—source data 3
Source data of the individual points in Figure 7—figure supplement 2.
- https://cdn.elifesciences.org/articles/98593/elife-98593-fig7-figsupp2-data3-v1.xlsx
Figure 7—figure supplement 3
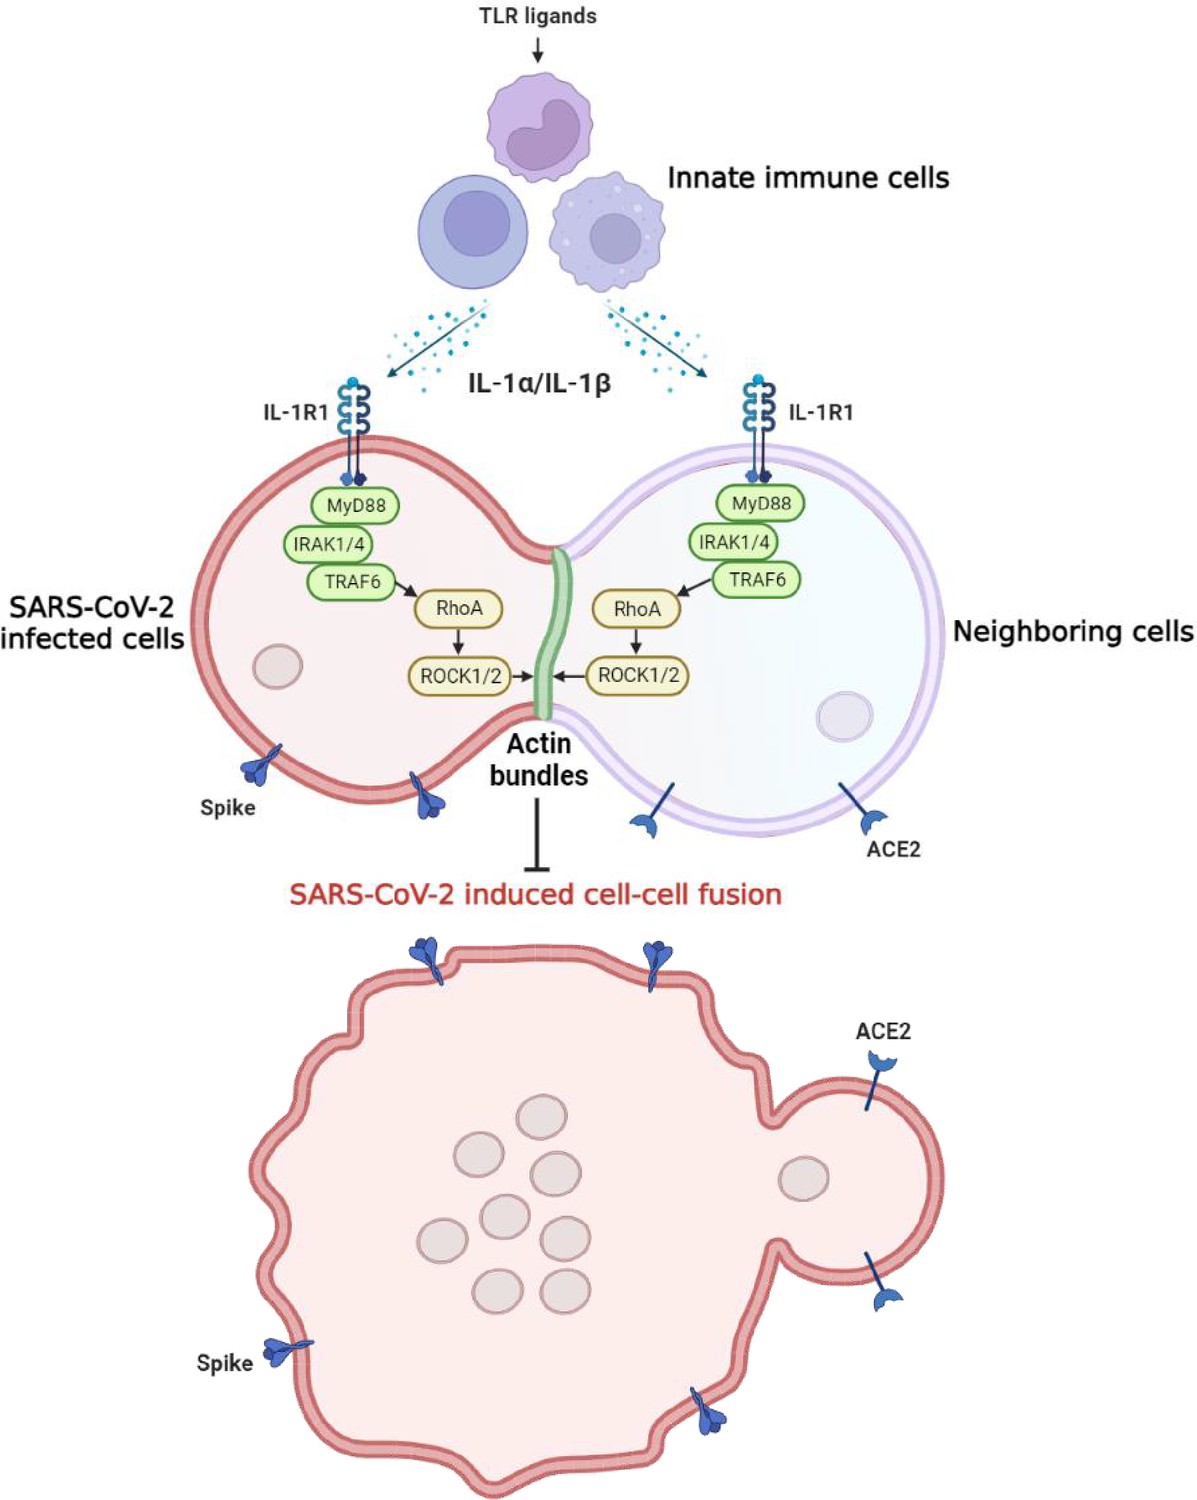
Graphical abstract.
Host factors secreted from innate immune cells upon Toll-like receptor (TLR) ligands stimulation, including interleukin-1β (IL-1β) and IL-1α, act on both severe acute respiratory syndrome coronavirus 2 (SARS-CoV-2)-infected cells expressing spike protein and neighboring cells expressing ACE2 receptor via IL-1R1-MyD88-IRAK-TRAF6 signaling pathway, which leads to strong enrichment of activated RhoA at cell-cell junction, resulting in the formation of ROCK-mediated actin bundle to prevent SARS-CoV-2-induced cell-cell fusion and further viral transmission through syncytia formation.
Author response image 1

Tables
Key resources table
| Reagent type (species) or resource | Designation | Source or reference | Identifiers | Additional information |
|---|---|---|---|---|
| Antibody | Rabbit polyclonal antibody (pAb) to SARS-CoV-2 S2 | Sino Biological | Cat#:40590-T62, RRID:AB_3073714 | WB (1:2000), IF (1:200) |
| Antibody | Mouse monoclonal antibody (mAb) to SARS-CoV-2 Nucleocapsid | Sino Biological | Cat#:40143-MM05, RRID:AB_2827977 | WB (1:1000), IF (1:200) |
| Antibody | Rabbit polyclonal antibody (pAb) to ACE2 | Proteintech | Cat#:21115-1-AP, RRID:AB_10732845 | WB (1:2000), IF (1:200) |
| Antibody | Rabbit polyclonal antibody (pAb) to MERS-CoV S2 antibody | Sino Biological | Cat#:40070-T62 | WB (1:1000) |
| Antibody | Rabbit monoclonal antibody (mAb) to MyD88 | Cell Signaling Technology | Cat#:4283, RRID:AB_10547882 | WB (1:1000) |
| Antibody | Rabbit monoclonal antibody (mAb) to TRAF6 | Abcam | Cat#:ab33915, RRID:AB_778572 | WB (1:1000) |
| Antibody | Rabbit polyclonal antibody (pAb) to TAK1 | Cell Signaling Technology | Cat#:4505, RRID:AB_490858 | WB (1:1000) |
| Antibody | Mouse monoclonal antibody (mAb) to Myc-Tag | Abclonal | Cat#:AE010, RRID:AB_2770408 | WB (1:2000) |
| Antibody | Mouse monoclonal antibody (mAb) to HA-Tag | Abclonal | Cat#:AE008, RRID:AB_2770404 | IF (1:200) |
| Antibody | Mouse monoclonal antibody (mAb) to HRP-conjugated β-tubulin | Abclonal | Cat#:AC030, RRID:AB_2769870 | WB (1:5000) |
| Antibody | Mouse monoclonal antibody (mAb) to β-actin | Proteintech | Cat#:66009-1-Ig, RRID:AB_2687938 | WB (1:5000) |
| Antibody | Goat anti-Mouse IgG (H+L) Highly Cross-Adsorbed Secondary Antibody, Alexa Fluor 555 | Invitrogen | Cat#:A-21424, RRID:AB_141780 | IF (1:400) |
| Antibody | Goat anti-Mouse IgG (H+L) Highly Cross-Adsorbed Secondary Antibody, Alexa Fluor 647 | Invitrogen | Cat#:A-21236, RRID:AB_2535805 | IF (1:400) |
| Chemical compound | Actin-Tracker Green-488 | Beyotime | C2201S | IF (1:100) |
| Chemical compound | DAPI | Abcam | ab228549 | IF (1:2000) |
| Chemical compound | Antifade mounting medium | Vectorlabs | H-1400-10 | N/A |
| Chemical compound | Purified LTA from S. aureus | Invitrogen | tlrl-pslta | 10 μg/mL |
| Chemical compound | Pam3CSK4 | Invitrogen | tlrl-pms | 1 μg/mL |
| Chemical compound | Peptidoglycan from S. aureus | Sigma-Aldrich | 77140 | 2 μg/mL |
| Chemical compound | LPS | Invitrogen | tlrl-eklps | 1 μg/mL |
| Chemical compound, drug | TPCA1 | Selleck | S2824 | 0.5 μM, 1 μM |
| Chemical compound, drug | 5Z-7-Oxozeaenol | Sigma-Aldrich | O9890 | 1 μM |
| Chemical compound, drug | IRAK1/4 inhibitor | Selleck | S6598 | 2 μM |
| Chemical compound, drug | Y-27632 | Selleck | S6390 | In vitro: 1 μM, 10 μM, 50 μM; In vivo: 1 mg/kg |
| Recombinant protein | Recombinant human IL-1α | Peprotech | 200-01A | 10 ng/mL |
| Recombinant protein | Recombinant human IL-1β | Peprotech | 200-01B | 1 ng/mL |
| Recombinant protein | Recombinant mouse IL-1β | Peprotech | 211-11B | In vivo: 1 μg/kg |
| Recombinant protein | Recombinant human IL-1RA | Peprotech | 200-01RA | 1000 ng/mL |
| Recombinant protein | Recombinant human IL-6 | Peprotech | 200-06 | 100 ng/mL |
| Recombinant protein | Recombinant human IL-8 | Peprotech | 200-08M | 100 ng/mL |
| Recombinant protein | Recombinant mouse IL-1RA | BioLegend | 769706 | In vivo: 150 μg/kg |
| Commercial assay or kit | Human IL-1β ELISA kit | R&D Systems | DY201 | N/A |
| Commercial assay or kit | RhoA pull-down activation assay Biochem kit | Cytoskeleton | BK036-S | N/A |
| Recombinant DNA reagent | pVAX1 SARS-CoV-2 spike (Wild type) plasmid | This paper | GenBank: QHD43419.1 | Homo sapiens codon-optimized, HA-tag at the C-terminal |
| Recombinant DNA reagent | pVAX1 SARS-CoV-2 spike (Alpha) plasmid | This paper | N/A | Truncated 19 amino acids at the C-terminal |
| Recombinant DNA reagent | pVAX1 SARS-CoV-2 spike (Beta) plasmid | This paper | N/A | Truncated 19 amino acids at the C-terminal |
| Recombinant DNA reagent | pVAX1 SARS-CoV-2 spike (Delta) plasmid | This paper | N/A | Truncated 19 amino acids at the C-terminal |
| Recombinant DNA reagent | pVAX1 SARS-CoV-2 spike (Omicron) plasmid | GeneScript | N/A | Truncated 19 amino acids at the C-terminal |
| Recombinant DNA reagent | pcDNA4.0 human ACE2 plasmid | This paper | N/A | V5-tag at the C-terminal |
| Recombinant DNA reagent | GFP-AHPH plasmid | Addgene | Cat#:71368, RRID:Addgene_71368 | N/A |
| Recombinant DNA reagent | pRK5myc RhoA L63 plasmid | Addgene | Cat#:15900, RRID:Addgene_15900 | N/A |
| Sequence-based reagent | PCR primers | This paper | PCR primers | See Supplementary file 1 for primers used in this study |
| Sequence-based reagent | sgRNA primers | This paper | sgRNA primers | See Supplementary file 2 for sgRNA primers used in this study |
Additional files
-
Supplementary file 1
Primer sequences for RT-qPCR.
- https://cdn.elifesciences.org/articles/98593/elife-98593-supp1-v1.xlsx
-
Supplementary file 2
Primer sequences for sgRNA.
- https://cdn.elifesciences.org/articles/98593/elife-98593-supp2-v1.xlsx
-
MDAR checklist
- https://cdn.elifesciences.org/articles/98593/elife-98593-mdarchecklist1-v1.pdf
Download links
A two-part list of links to download the article, or parts of the article, in various formats.
Downloads (link to download the article as PDF)
Open citations (links to open the citations from this article in various online reference manager services)
Cite this article (links to download the citations from this article in formats compatible with various reference manager tools)
Interleukin-1 prevents SARS-CoV-2-induced membrane fusion to restrict viral transmission via induction of actin bundles
eLife 13:RP98593.
https://doi.org/10.7554/eLife.98593.3


