Novel autophagy inducers by accelerating lysosomal clustering against Parkinson’s disease
- Department of Biology, Graduate School of Science and Engineering, Chiba University, Inage-ku, Japan
- Department of Neurology, Juntendo University Faculty of Medicine, Japan
- Research Institute for Diseases of Old Age, Juntendo University Graduate School of Medicine, Japan
- Division for Development of Autophagy Modulating Drugs, Juntendo University Faculty of Medicine, Japan
- Division of Gene Regulation, Institute for Advanced Medical Research, School of Medicine, Keio University, Japan
- Division of Gene Regulation, Cancer Center, Fujita Health University, Japan
- Biotechnology Research Institute for Drug Discovery, National Institute of Advanced Industrial Science and Technology (AIST), Japan
- Department of Biology, Graduate School of Science, Chiba University, Inage-ku, Japan
- Neurodegenerative Disorders Collaborative Laboratory, RIKEN Center for Brain Science, Japan
- Department of Neurology, Institute of Medicine, University of Tsukuba, Japan
Figures
Figure 1
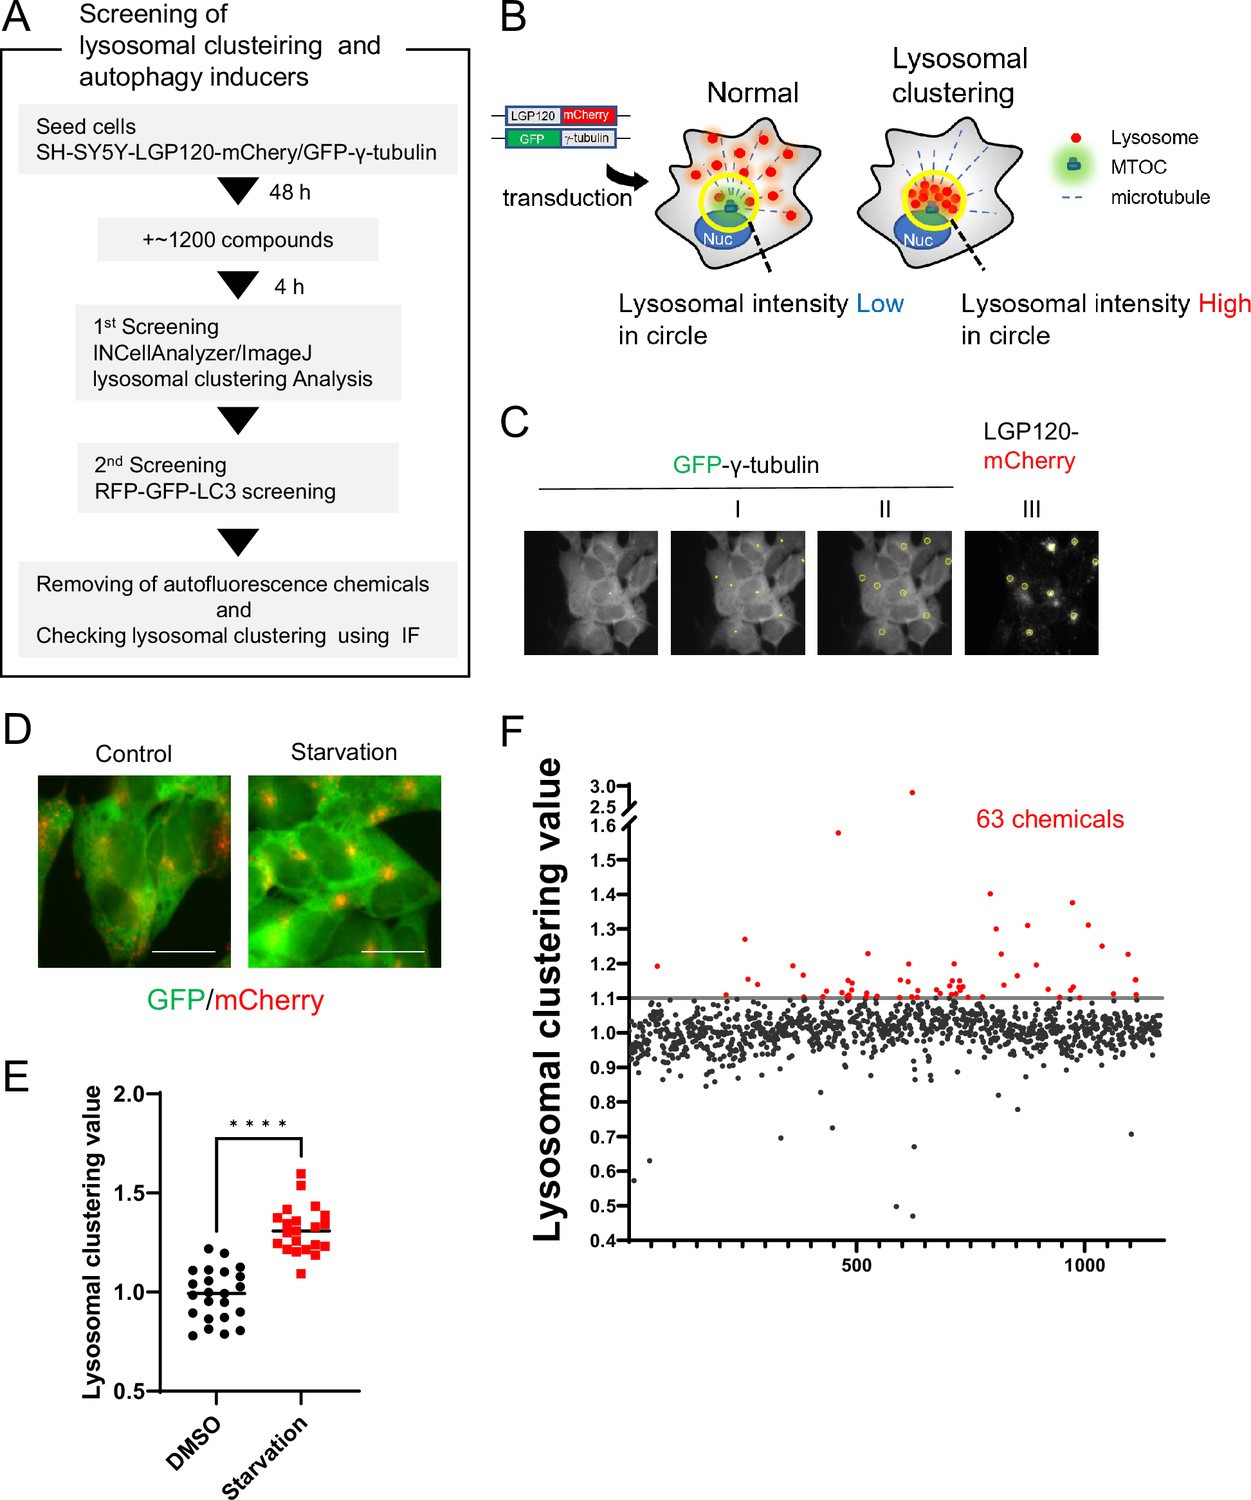
Method for screening lysosomal-clustering compounds.
(A) Scheme for the process of screening for lysosomal-clustering compounds. (B) Strategies for screening lysosomal-clustering compounds. If lysosomes accumulate around the microtubule-organizing center (MTOC), the fluorescent intensity (red) in the circle increases. (C) INCellAnalyzer2200 images of SH-SY5Y cells co-expressing GFP-γ-tubulin and LGP120-mCherry. I–III details the procedure for lysosomal-clustering analysis using ImageJ. (I) Image depicting GFP-γ-tubulin fluorescence. The MTOC position as extracted using ImageJ processing. (II) A circle approximately 7 μm in diameter is placed at the central coordinates of the MTOC position. (III) The circle is reflected onto the LGP120 image to measure the LGP120 fluorescence intensity (lysosomal clustering value) within the circle. (D) SH-SY5Y cell lines co-expressing GFP-γ-tubulin and LGP120-mCherry were treated with either control medium or starvation medium (positive control). The results were analyzed using an INCellAnalyzer2200 and ImageJ. Scale bar: 20 μm. (E) Graph plotting the lysosomal clustering values (n>20). ****p<0.0001, Wilcoxon test. (F) Graph presenting the fold changes in the lysosome-clustering value for 1200 chemicals relative to the control. Chemicals with over a 1.1-fold change in lysosome-clustering value relative to the control were identified as lysosome-clustering compounds.
-
Figure 1—source data 1
Data table of lysosomal clustering chemical screening.
- https://cdn.elifesciences.org/articles/98649/elife-98649-fig1-data1-v2.zip
Figure 2 with 2 supplements
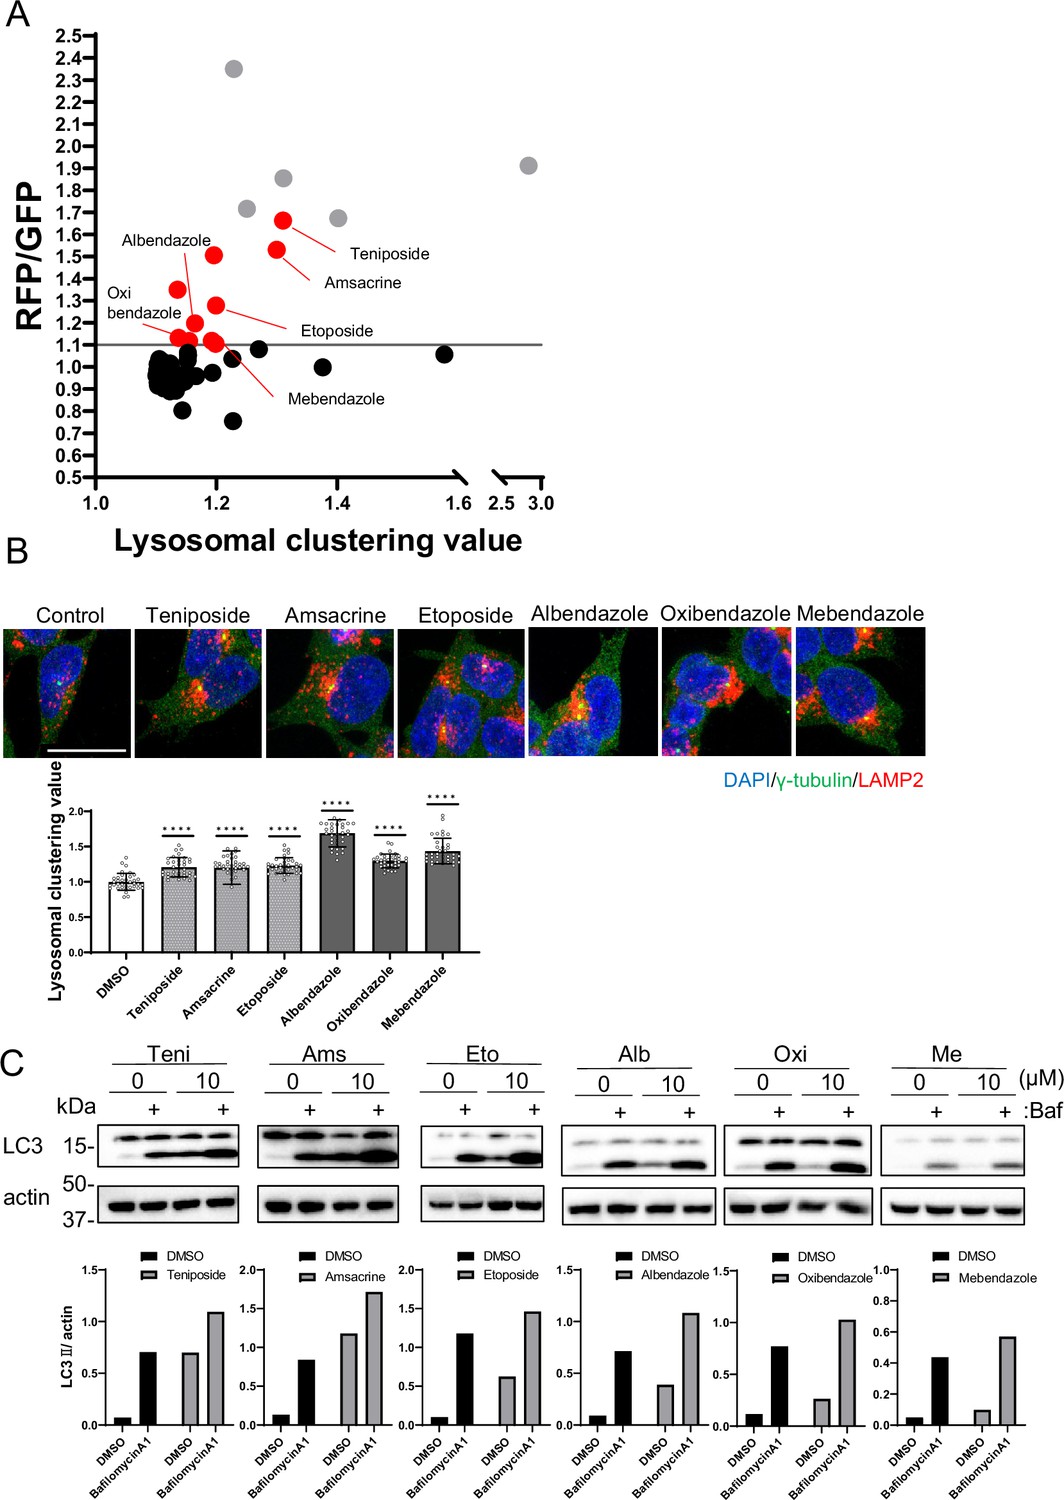
Identification of autophagy inducers via lysosomal clustering.
(A) SH-SY5Y cells expressing red fluorescent protein (RFP)-green fluorescent protein (GFP) tandem fluorescent-tagged LC3 (R–G–LC3) were analyzed by flow cytometer after treatment with 63 lysosomal-clustering compounds for 20 hr. The graph illustrates the fold change in the RFP/GFP ratio for these 63 chemicals relative to the control. Auto-fluorescent chemicals were excluded if they had >1.1 fold change in RFP/GFP ratio relative to the control. After confirming endogenous lysosome accumulation using immunofluorescence, six lysosomal-clustering autophagy inducers were ultimately identified. Gray dots represent autofluorescence chemical data. (B) SH-SY5Y cells were treated with teniposide (10 μM), amsacrine (10 μM), etoposide (10 μM), albendazole (10 μM), oxibendazole (1 μM), and mebendazole (5 μM) for 4 hr. Cells were then fixed and stained with the indicated antibody and DAPI. Images were captured using a confocal microscope. Scale bar: 20 μm. Under similar conditions, these cells were analyzed using an INCellAnalyzer2200 and ImageJ for lysosomal clustering. The graph shows the lysosomal clustering values (n>30, from three biological replicates). Data are expressed as mean ± standard deviation. ****p<0.0001, ***p<0.001, **p<0.01, *p<0.05, two-way analysis of variance and Tukey’s test. N.S., not statistically significant. (C) SH-SY5Y cells underwent treatment with lysosome-clustering compounds for 4 hr. Cell lysates were immunoblotted with the indicated antibodies. The amount of LC3II was estimated using ImageJ software (bottom panel).
-
Figure 2—source data 1
Uncropped blot images of Figure 2C.
- https://cdn.elifesciences.org/articles/98649/elife-98649-fig2-data1-v2.zip
Figure 2—figure supplement 1
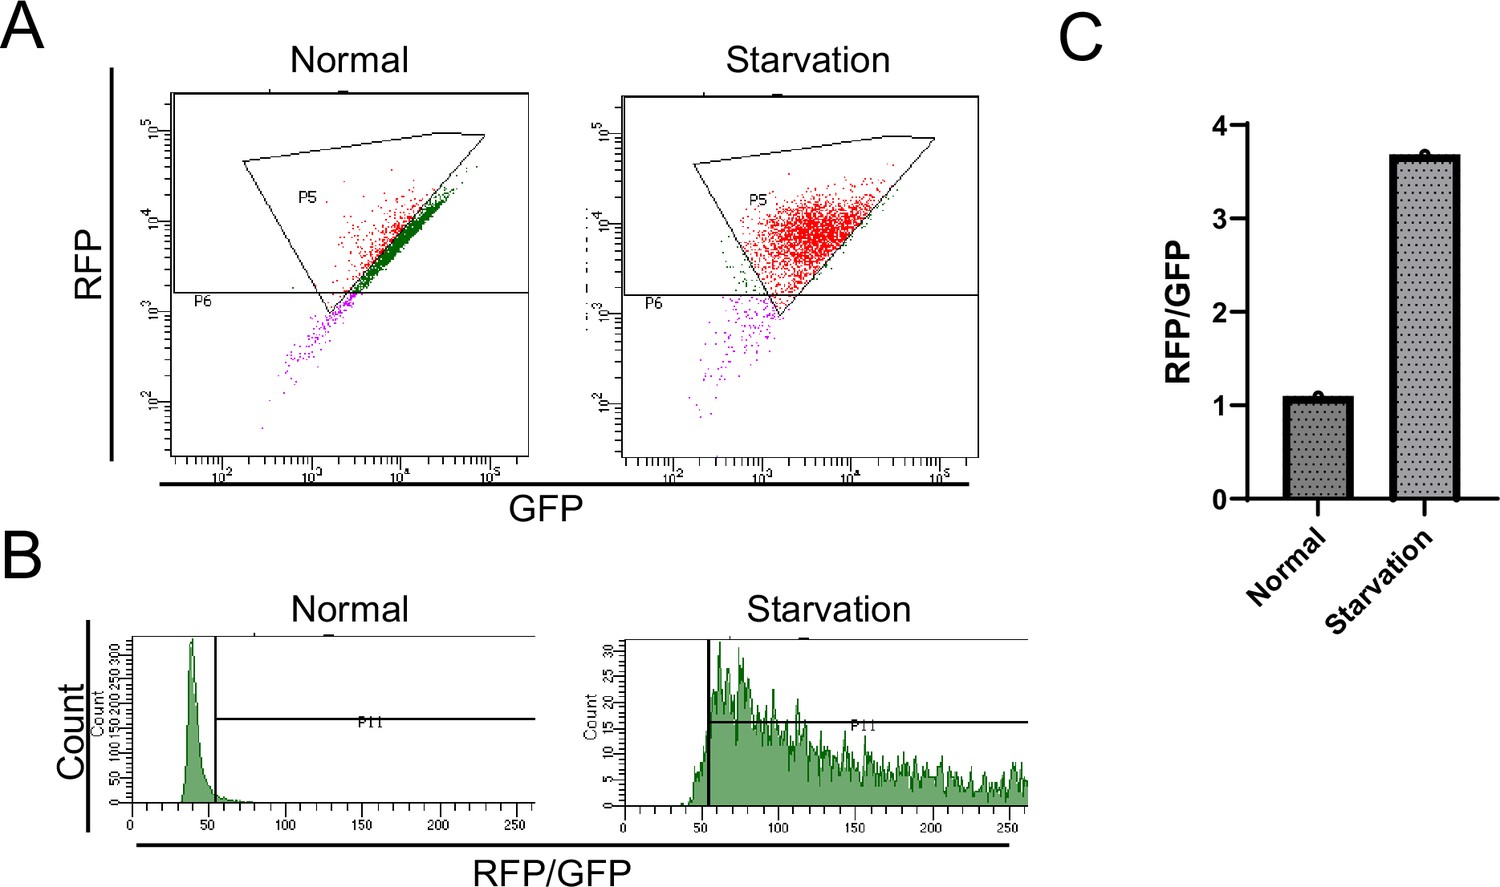
Flow cytometer analysis of red fluorescent protein (RFP)-green fluorescent protein (GFP) tandem fluorescent-tagged LC3 (R–G–LC3) during second screening.
(A) SH-SY5Y tetracycline-on (Tet-on) cells expressing R-G-LC3 were cultured in the presence of doxycycline (Dox). After Dox removal, the cells were treated with either normal medium or subjected to starvation for 20 hr and analyzed by flow cytometry. Dot plots display the gate-positive cell population (autophagy-induced cells: red). (B) The histogram represents the number of cells on the vertical axis and the RFP/GFP ratio on the horizontal axis. (C) The bar graph indicates the RFP/GFP ratio relative to the control.
Figure 2—figure supplement 2
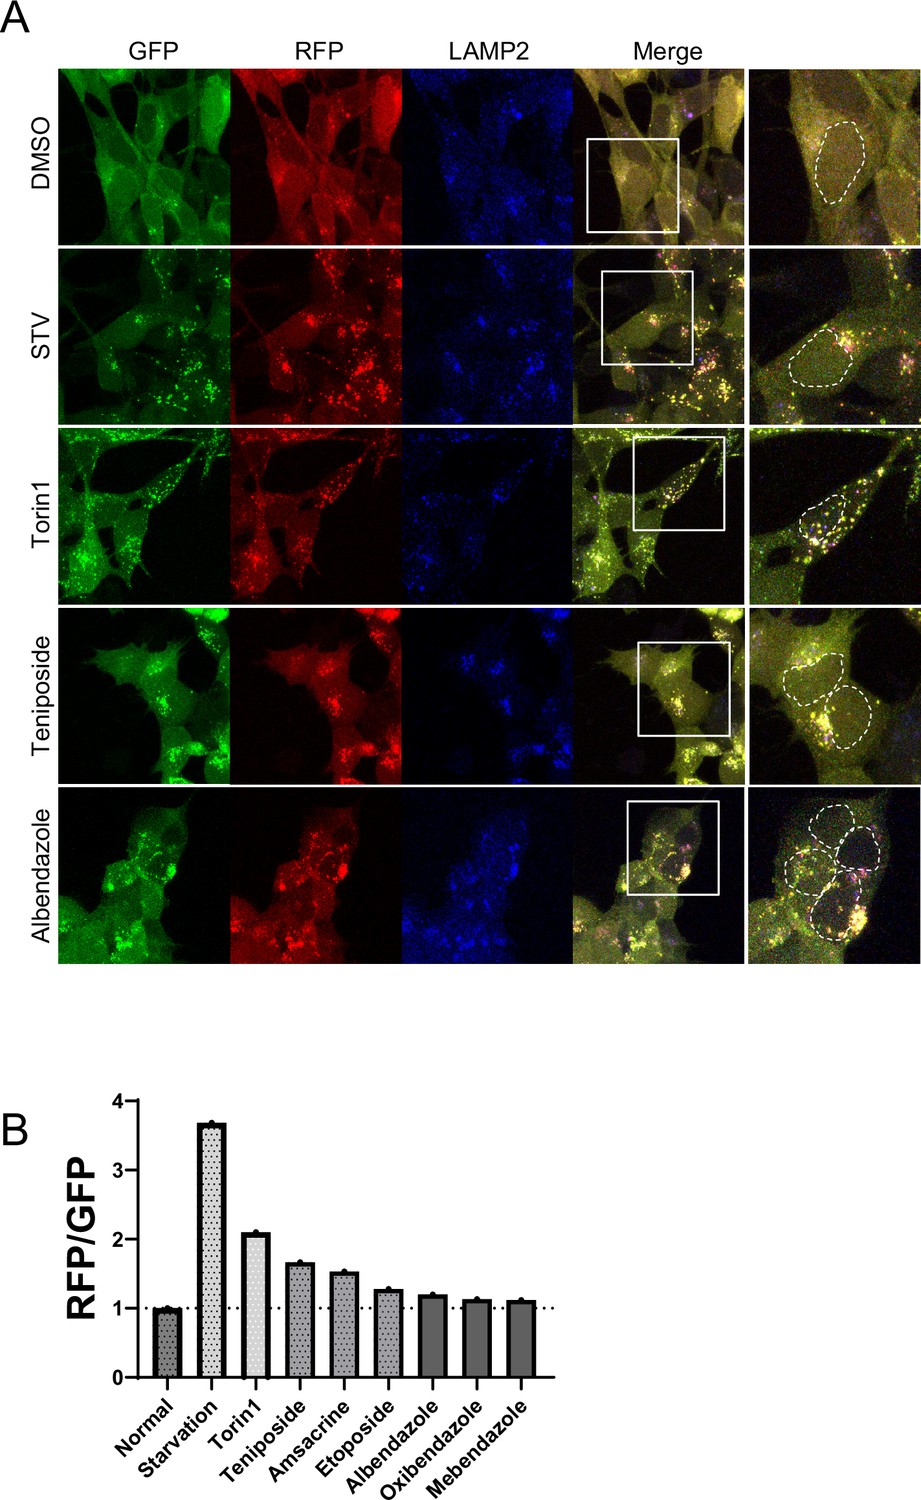
Confocal images of SH-SY5Y expressing red fluorescent protein (RFP)-green fluorescent protein (GFP) tandem fluorescent-tagged LC3 (RFP-GFP-LC3).
(A) SH-SY5Y cells tetracycline-on (Tet-on) expressing RFP-GFP-LC3 were treated with dimethyl sulfoxide, starvation medium, Torin1 (1 μM), teniposide (10 μM), or albendazole (10 μM). Post-treatment, cells were fixed and stained with an anti-LAMP2 antibody (blue: 647 nm) and then imaged using a confocal microscope. Scale bar: 20 μm. (B) Bar graph showing the RFP/GFP ratio relative to the control, as revealed by flow cytometry analysis.
Figure 3
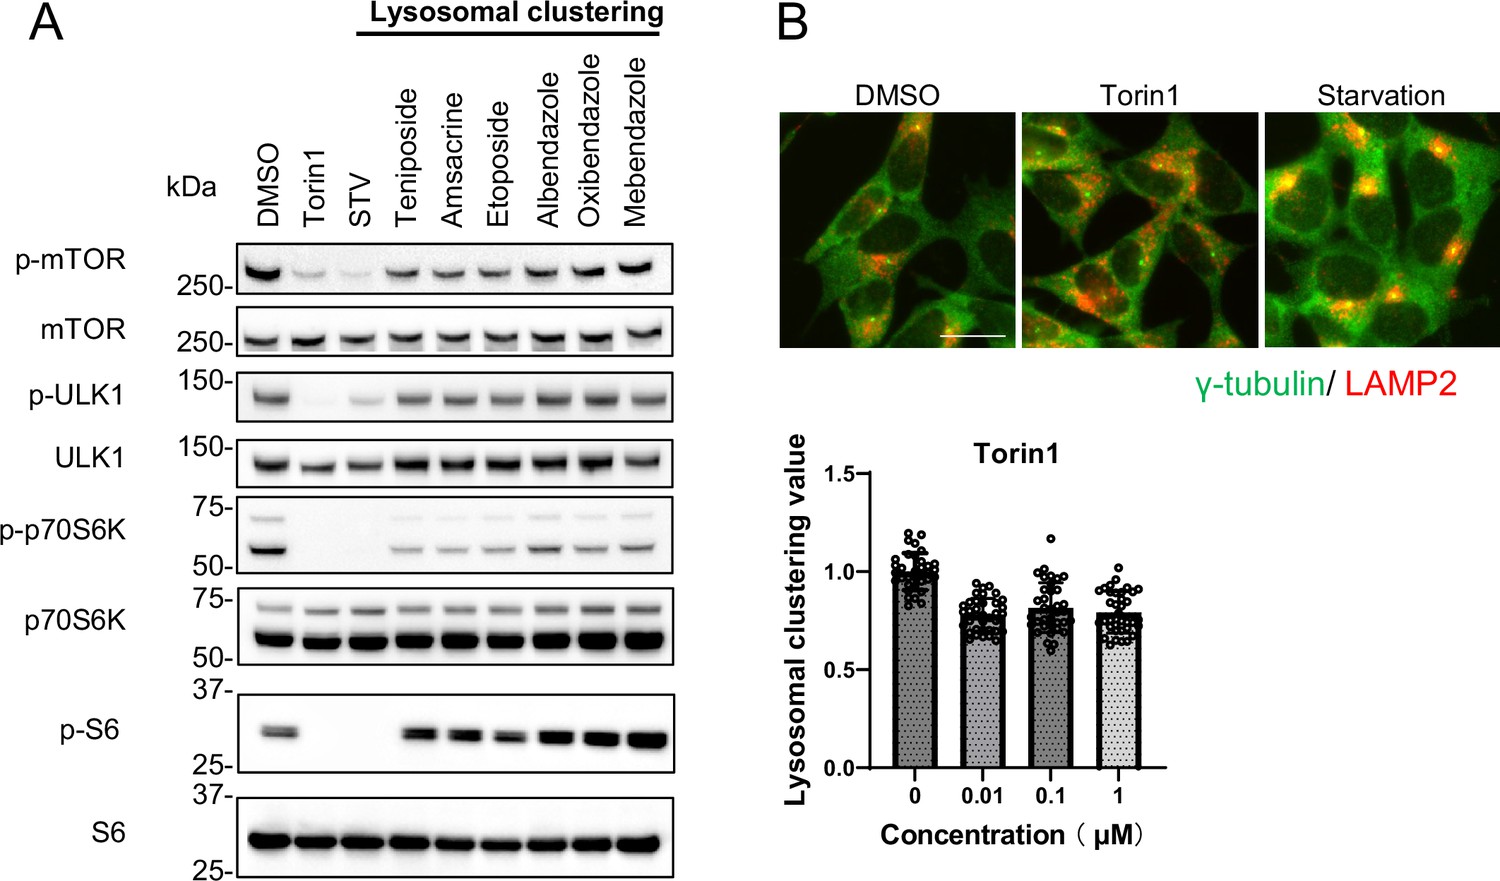
Lysosomal-clustering compounds are not dependent on mTORC1 activity.
(A) SH-SY5Y cells were treated with starvation medium, Torin1 (1 μM), teniposide (10 μM), amsacrine (10 μM), etoposide (10 μM), albendazole (10 μM), oxibendazole (1 μM), or mebendazole (5 μM) for 4 hr. Cell lysates were then immunoblotted with the specified antibody. (B) SH-SY5Y cells treated with Torin1 (1 μM) for 4 hr. These cells were fixed, stained with anti-γ-tubulin (green) and anti-LAMP2 (red) antibodies, and imaged using an INCellAnalyzer2200. Scale bar: 20 μm. INCellAnalyzer2200 images were then analyzed using ImageJ for lysosomal clustering. The graph presents the lysosomal clustering values (n>30). Data are expressed as mean ± standard deviation.
-
Figure 3—source data 1
Uncropped blot images of Figure 3A.
- https://cdn.elifesciences.org/articles/98649/elife-98649-fig3-data1-v2.zip
Figure 4 with 2 supplements
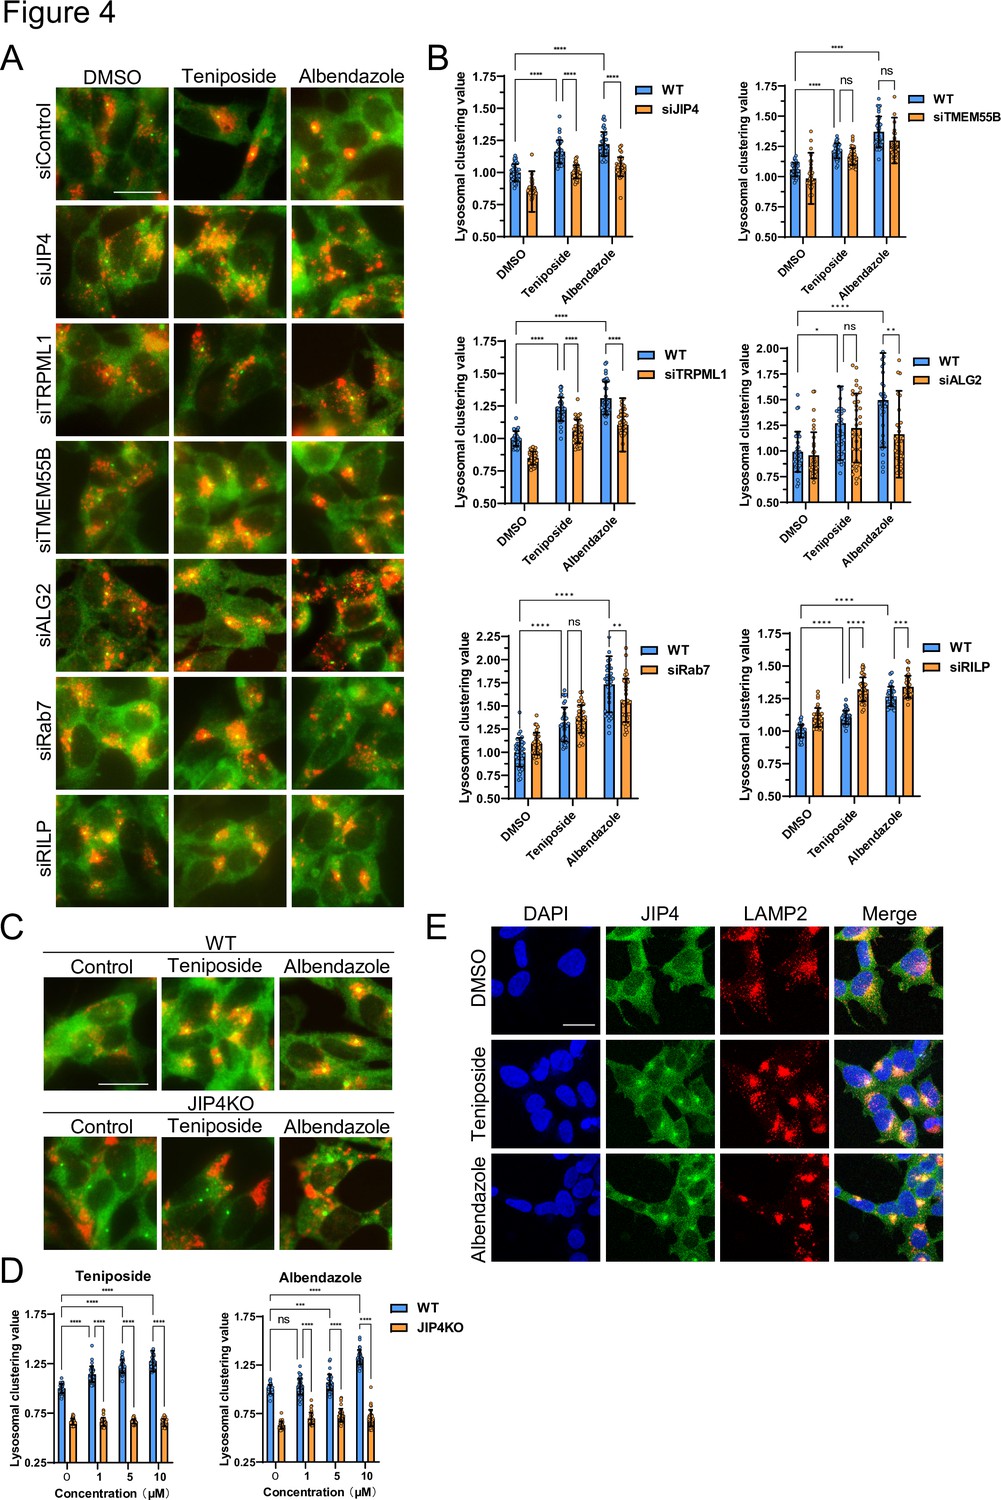
Lysosome-clustering compounds accumulate lysosomes in microtubule-organizing center (MTOC) in a JIP4-dependent manner.
(A) SH-SY5Y cells were transfected with the indicated siRNAs for 48 hr and then treated with teniposide (10 μM) and albendazole (10 μM) for 4 hr. Cells were fixed and stained with anti-γ-tubulin (green) and anti-LAMP2 (red) antibodies. Images were captured using an INCellAnalyzer2200. Scale bar: 20 μm. (B) INCellAnalyzer2200 images were analyzed for lysosomal clustering using ImageJ. The graph presents the lysosomal clustering values (n>30, from three biological replicates). Data are expressed as mean ± standard deviation. ****p<0.0001, ***p<0.001, **p<0.01, *p<0.05, two-way analysis of variance (ANOVA) and Tukey’s test. N.S., not statistically significant. The experiment was technically replicated at least three times. (C) SH-SY5Y WT and JIP4 knockout cells were cultured in 96-well black plates and treated with teniposide (1, 5, or 10 μM) and albendazole (1, 5, or 10 μM). Cells were fixed and stained with anti-γ-tubulin (green) and anti-LAMP2 (red) antibodies. Images were captured using an INCellAnalyzer2200. (D) INCellAnalyzer2200 images were analyzed using ImageJ for lysosomal clustering. The graph presents the lysosomal clustering values for wild-type or JIP4 knockout cells (n>30, from three biological replicates). Data are expressed as mean ± standard deviation. ****p<0.0001, ***p<0.001, **p<0.01, *p<0.05, two-way ANOVA and Tukey’s test. N.S., not statistically significant. The experiment was technically replicated at least three times. (E) SH-SY5Y cells were treated with teniposide (10 μM) and albendazole (10 μM) for 4 hr. Cells were fixed and stained with anti-JIP4 (green) and anti-LAMP2 (red) antibodies and 4′,6-diamidino-2-phenylindole.
Figure 4—figure supplement 1

siRNAs and knockdown efficiency of each lysosomal factor.
(A, B) SH-SY5Y cells were treated with the specified siRNAs, and the knockdown efficiency of each siRNA was validated via reverse-transcription quantitative polymerase chain reaction (n=3 technical replicates) or Western blotting. The graph data are expressed as mean ± standard deviation. ****p<0.0001, ***p<0.001, Student’s t-test.
Figure 4—figure supplement 2
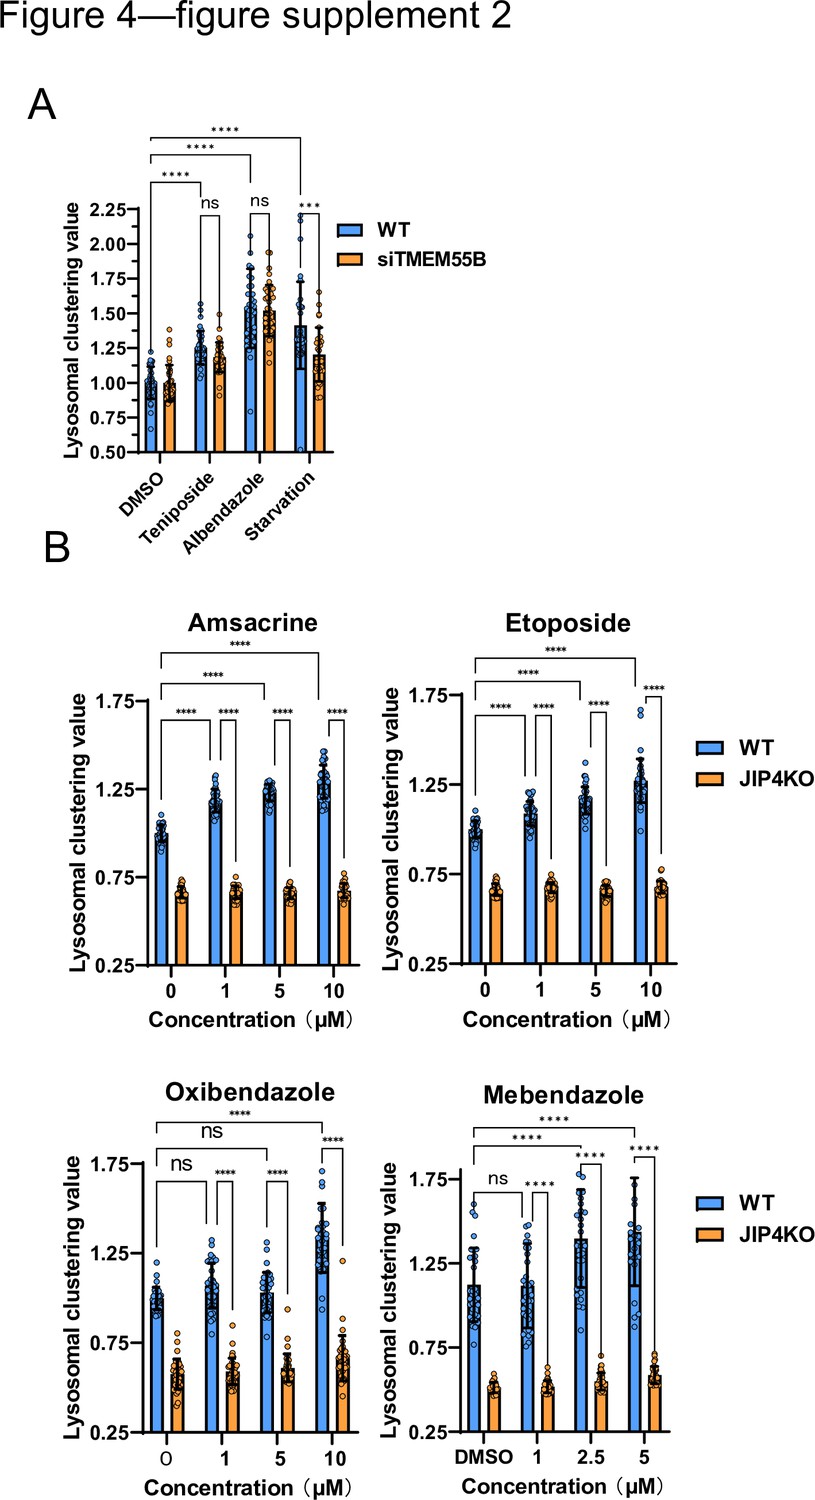
Lysosomal-clustering analysis of other lysosomal-clustering compounds using JIP4KO cells.
(A) SH-SY5Y cells were transfected with TMEM55B siRNA for 48 hr and then treated with teniposide (10 μM), albendazole (10 μM), or starvation medium for 4 hr. Cells were fixed and stained with anti-γ-tubulin (green) and anti-LAMP2 (red) antibodies. Images were captured using an INCellAnalyzer2200. INCellAnalyzer2200 images were analyzed using ImageJ for lysosomal clustering. The graph presents the lysosomal clustering values (n>30, from three biological replicates). Data are expressed as mean ± standard deviation (SD). ****p<0.0001, ***p<0.001, **p<0.01, *p<0.05, two-way analysis of variance (ANOVA) and Tukey’s test. N.S., not statistically significant. The experiment was technically replicated at least three times. (B) SH-SY5Y WT and JIP4 knockout cells were cultured in 96-well black plates and treated with amsacrine, etoposide, oxibendazole, or mebendazole at the specified concentrations. The cells were then fixed and stained with anti-γ-tubulin (green) and anti-LAMP2 (red) antibodies before imaging with an INCellAnalyzer2200. INCellAnalyzer2200 images were processed and analyzed using ImageJ for lysosomal clustering. The graph presents the lysosomal clustering values of either wild-type or JIP4KO cells. (n>30). Data are expressed as mean ± SD. ****p<0.0001, ***p<0.001, **p<0.01, *p<0.05, two-way ANOVA and Tukey’s test. N.S., not statistically significant.
Figure 5 with 1 supplement
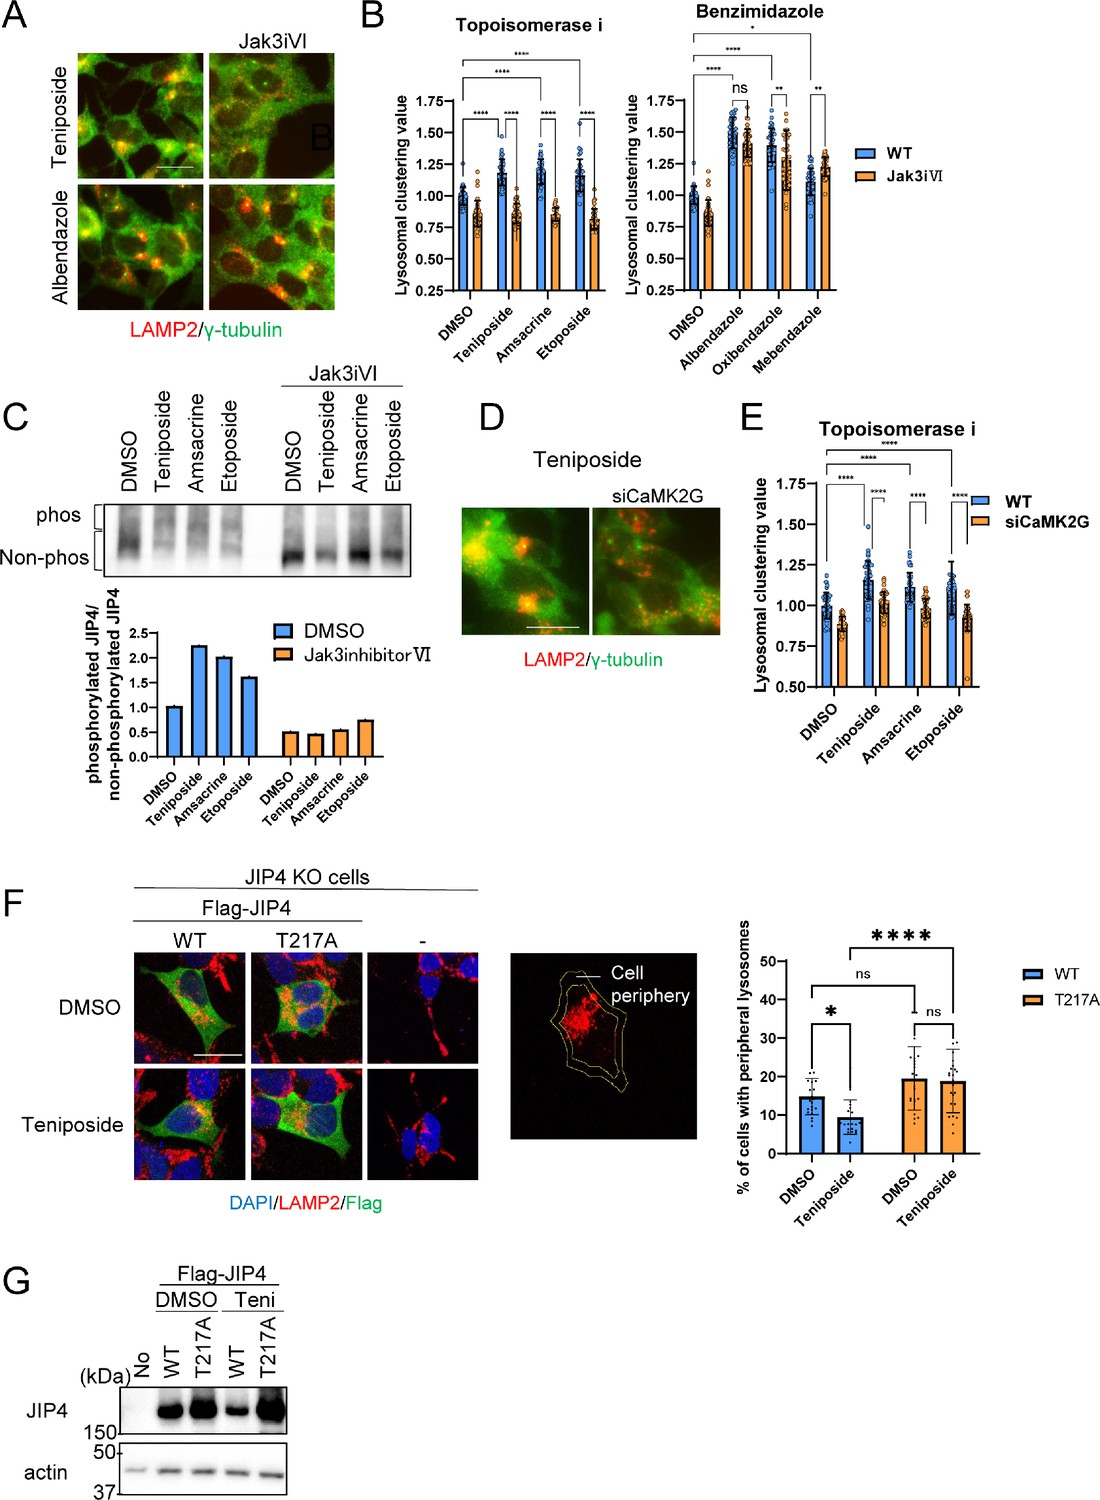
Lysosomal clustering induced by topoisomerase inhibitor requires JIP4 phosphorylation.
(A) SH-SY5Y cells were treated with dimethyl sulfoxide (DMSO), teniposide (10 μM), amsacrine (10 μM), etoposide (10 μM), albendazole (10 μM), oxibendazole (1 μM), or mebendazole (5 μM) with or without Jak3 inhibitor VI for 4 hr. Cells were fixed and stained with anti-γ-tubulin (green) and anti-LAMP2 (red) antibodies. Images were captured using an INCellAnalyzer2200. Scale bar: 20 μm. (B) INCellAnalyzer2200 images were analyzed using ImageJ for lysosomal clustering. The graph presents the lysosomal clustering values for DMSO or Jak3 inhibitor VI (n>30, from 3 biological replicates). Data are expressed as mean ± standard deviation. ****p<0.0001, ***p<0.001, **p<0.01, *p<0.05, two-way analysis of variance (ANOVA) and Tukey’s test. N.S., not statistically significant. The experiment was technically replicated at least three times. (C) SH-SY5Y cells were treated with teniposide (10 μM), amsacrine (10 μM), or etoposide (10 μM) with or without Jak3 inhibitor VI for 4 hr. Cell lysates underwent Phos-tag sodium dodecyl sulfate-polyacrylamide gel electrophoresis (SDS-PAGE) and were immunoblotted with an anti-JIP4 antibody. The graph displays the ratio of non-phosphorylated JIP4 to phosphorylated JIP4. (D) SH-SY5Y cells were transfected with CaMK2G siRNAs for 48 hr and then treated with teniposide (10 μM), amsacrine (10 μM), or etoposide (10 μM) for 4 hr. Cells were fixed and stained with anti-γ-tubulin (green) and anti-LAMP2 (red) antibodies. Images were captured using an INCellAnalyzer2200. Scale bar: 20 μm. (E) INCellAnalyzer2200 images were analyzed using ImageJ for lysosomal clustering. The graph presents the lysosomal clustering values (n>30, from three biological replicates). Data are expressed as mean ± standard deviation. ****p<0.0001, two-way ANOVA, and Tukey’s test. The experiment was technically replicated at least three times. (F) JIP4 KO cells were transfected with flag-tagged JIP4 (wild-type [WT] and T217A) for 24 hr and treated with teniposide (10 μM) for 4 hr. Cells were fixed and stained with the indicated antibodies. Scale bar: 20 μm. Approximately 70% of the cell area toward the cell center was automatically delineated using ImageJ, with the region excluded from this defined as the cellular peripheral region. The graph displays the percentage of cells with peripheral lysosomes. Data are expressed as mean ± standard deviation. *p<0.05, ****p<0.0001, two-way ANOVA and Tukey’s test (n>20, from three biological replicates). (G) JIP4 KO cells were transfected with flag-tagged JIP4 (wild-type and T217A) for 24 hr and treated with teniposide (10 μM) for 4 hr. Cell lysates underwent SDS-PAGE and were immunoblotted with anti-JIP4 and anti-actin antibodies.
-
Figure 5—source data 1
Uncropped blot images of Figure 5C and 5G.
- https://cdn.elifesciences.org/articles/98649/elife-98649-fig5-data1-v2.zip
Figure 5—figure supplement 1

Calcium flux analysis of lysosomal clustering chemicals.
SH-SY5Y cells were treated with teniposide, amsacrine, etoposide, albendazole (1, 5, 10 µM), oxibendazole (0.1, 0.5, and 1 µM), or and mebendazole (0.5,1, and 5 µM) for 4 hr, and stained with Fluo4-AM for 30 min. The fluorescence intensity was measured using a plate reader.
Figure 6 with 1 supplement
Lysosomal clustering dependent on JIP4 is slightly involved in autophagy activity.
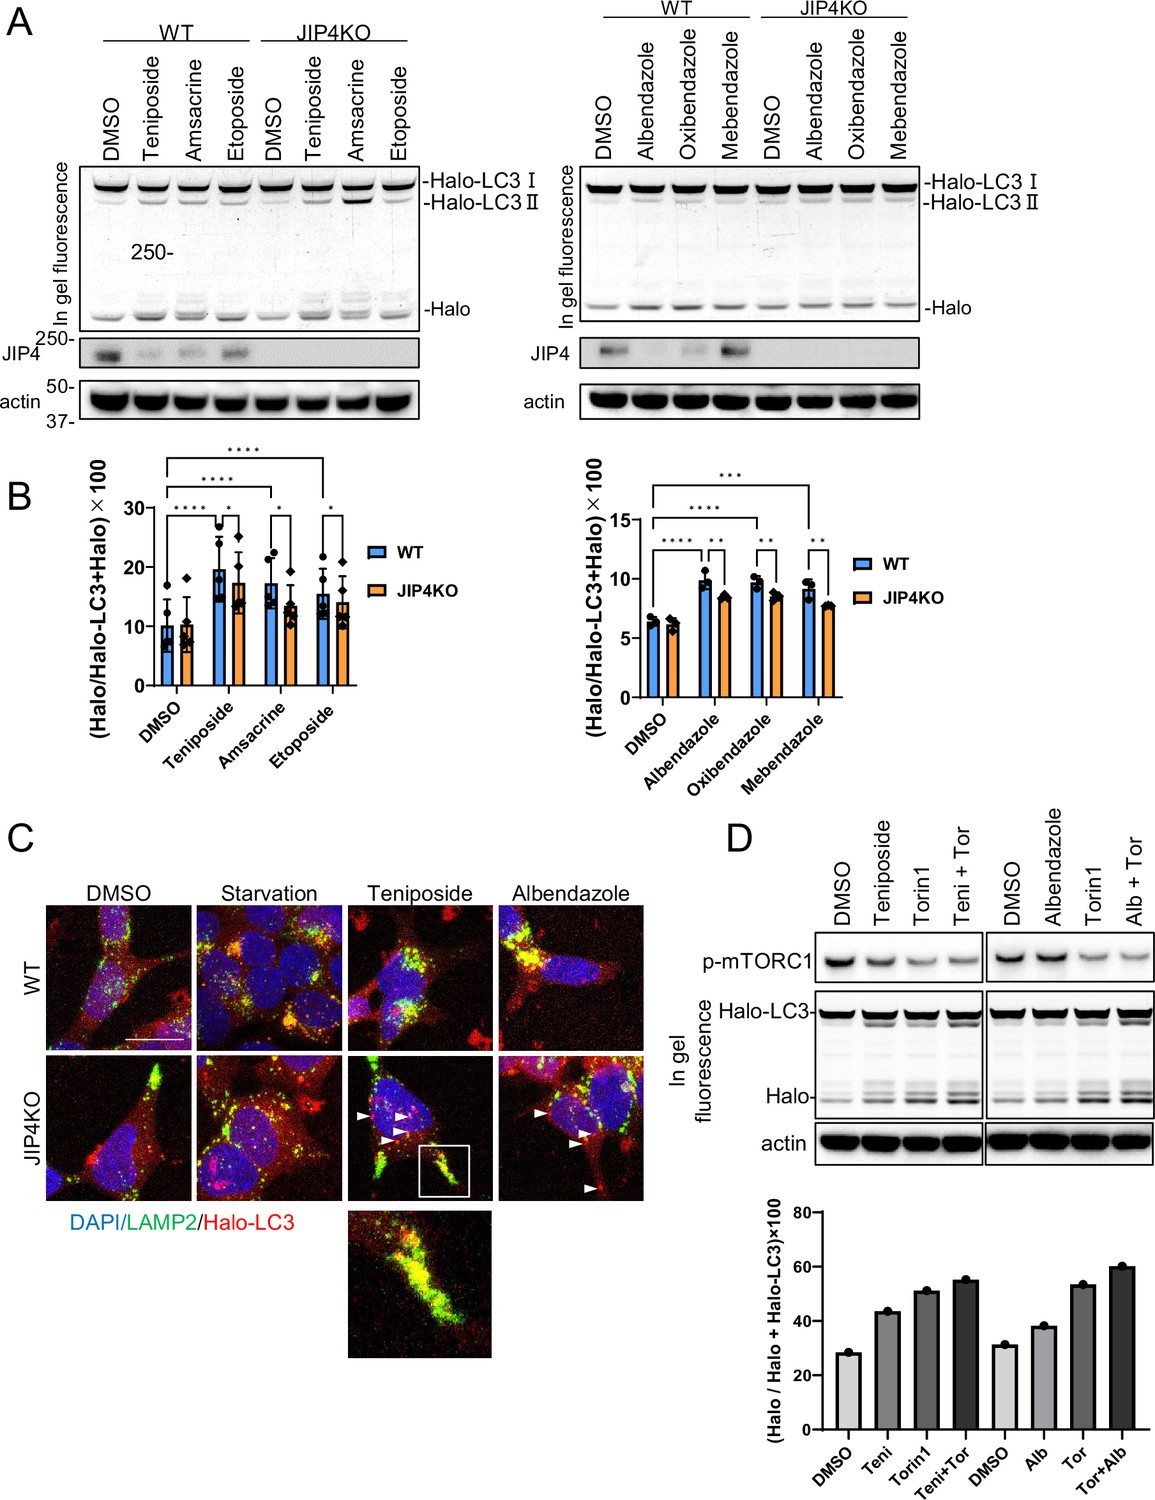
(A) SH-SY5Y cells stably expressing Halo-LC3 were labeled for 20 min with 100 nM tetramethylrhodamine (TMR)-conjugated ligand in a nutrient-rich medium. After washing with phosphate-buffered saline (PBS) and incubating the cells in normal medium for 30 min, cells were treated with dimethyl sulfoxide (DMSO), teniposide (10 μM), amsacrine (10 μM), etoposide (10 μM), albendazole (10 μM), oxibendazole (1 μM), or mebendazole (5 μM) for 4 hr. Cell lysates were immunoblotted with the indicated antibody and analyzed by in-gel fluorescence detection. (B) Quantification of results shown in panel A. The HaloTMR band intensity was normalized by the sum of the band intensities of HaloTMR-LC3B and HaloTMR. The vertical axis of the graph represents the intensity multiplied by 100. Mean values of data from five or three experiments are shown. Data are expressed as mean ± standard deviation. ****p< 0.0001, ***p<0.001, **p<0.01, *p<0.05, two-way analysis of variance and Tukey’s test. (C) Cells treated as in panel A were fixed and stained with an anti-LAMP2 antibody (green). These cells were imaged using a confocal microscope. Scale bar: 20 μm. White arrows indicate Halo-LC3 dots. The magnified image shows LAMP2 (green) and Halo dots (red) accumulating at the cell periphery. (D) SH-SY5Y cells stably expressing Halo-LC3 were labeled for 20 min with 100 nM TMR-conjugated ligand in a nutrient-rich medium. After washing with PBS and incubating the cells in normal medium for 30 min, cells were treated with DMSO, teniposide (10 μM), albendazole (10µM), and/or Torin1 (100 nM) for 8 hr. Cell lysates were immunoblotted with the indicated antibody and analyzed by in-gel fluorescence detection (left). The HaloTMR band intensity was normalized by the sum of the band intensities of HaloTMR-LC3B and HaloTMR (right).
-
Figure 6—source data 1
Uncropped gel fluorescence images of Figure 6A and 6D.
- https://cdn.elifesciences.org/articles/98649/elife-98649-fig6-data1-v2.zip
Figure 6—figure supplement 1

Western blot analysis of JIP4 expression.
SH-SY5Y cells were treated with 10 µM teniposide and with or without 30 nM bafilomycin A1 for 4 hr. Cell lysates were immunoblotted with anti-JIP4 and actin antibodies.
Figure 7
JIP4-dependent lysosomal clustering is involved in aggresome clearance by MG132.
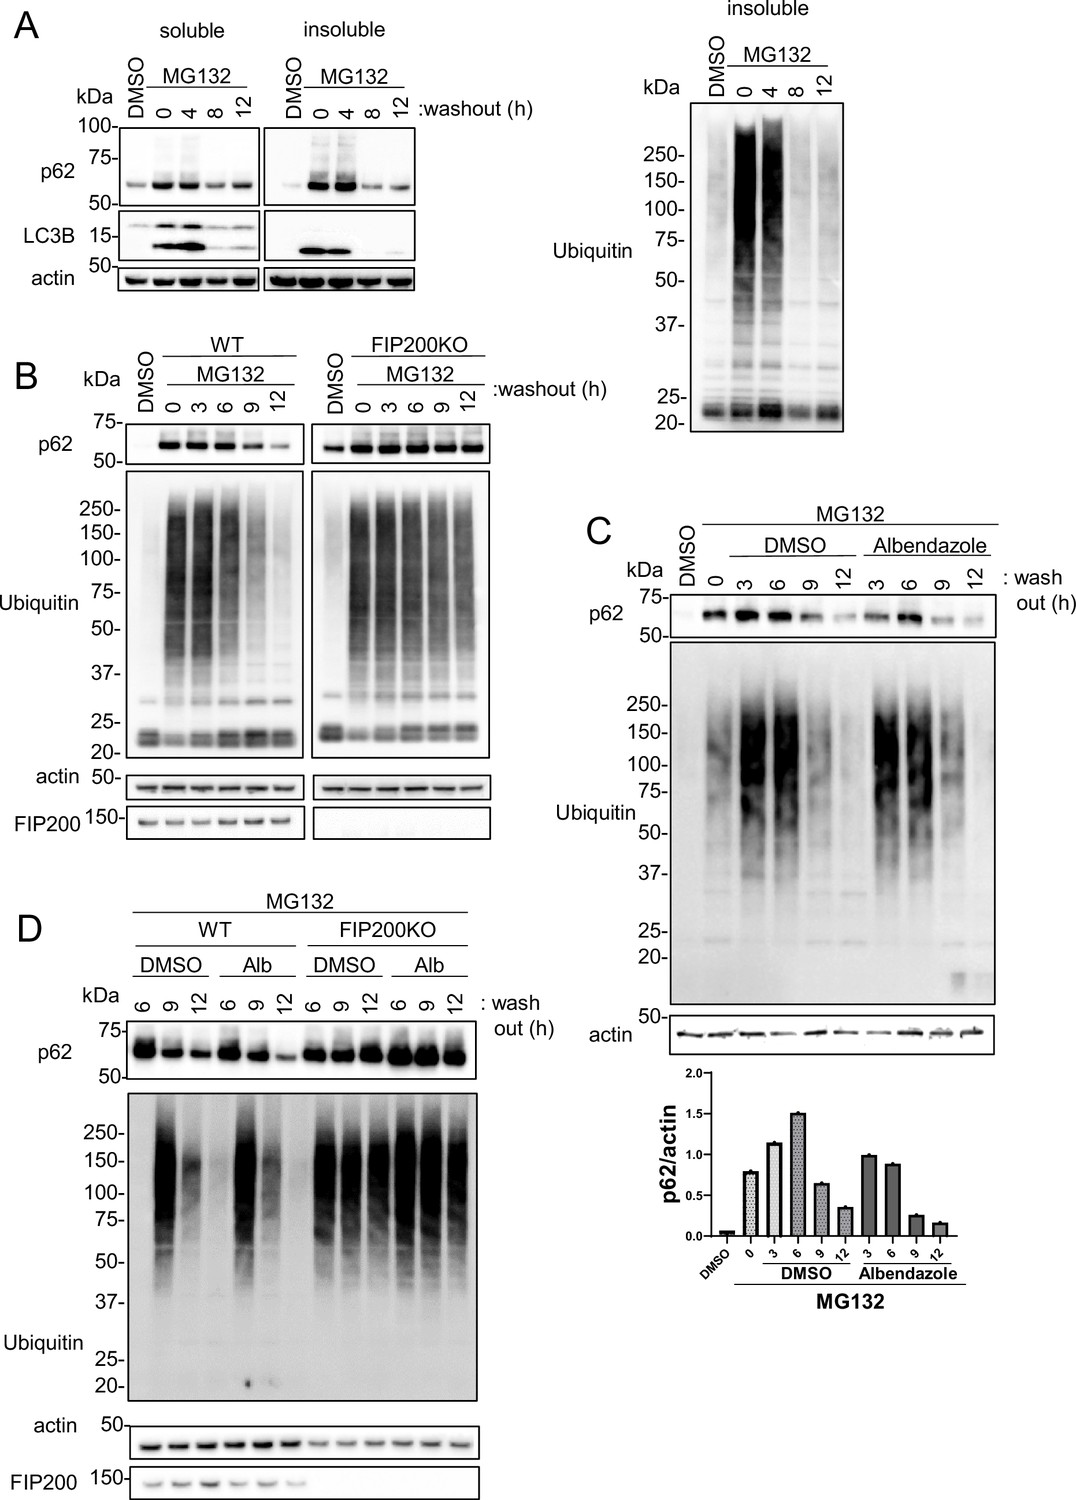
(A) SH-SY5Y cells were treated with MG132 (1 μM) for 16 hr to induce aggresome formation. After washing out MG132 with normal medium at intervals of 4, 8, or 12 hr, cell lysates were separated into Triton-X-100–soluble (soluble) and pellet fractions (insoluble), then subjected to sodium dodecyl sulfate-polyacrylamide gel electrophoresis and immunoblotting with the indicated antibody. (B) Wild-type (WT) or FIP200KO SH-SY5Y cells were treated with MG132 (1 μM) for 16 hr to induce aggresome formation. After washing out MG132 with normal medium at intervals of 3, 6, 9, or 12 hr, the same analysis as in panel A was performed. (C) SH-SY5Y cells were treated with MG132 (1 μM) for 16 hr. After washing out MG132 with either dimethyl sulfoxide (DMSO) or albendazole in normal medium at intervals of 3, 6, 9, or 12 hr, the same analysis as in panel A was performed. Bar graph showing the insoluble p62 ratio from panel C. (D) WT or FIP200KO SH-SY5Y cells were treated with MG132 (1 μM) for 16 hr to induce aggresome formation. After washing out MG132 with DMSO or albendazole in normal medium at intervals of 6, 9, or 12 hr, the same analysis as in panel A was performed.
-
Figure 7—source data 1
Uncropped blot images of Figure 7.
- https://cdn.elifesciences.org/articles/98649/elife-98649-fig7-data1-v2.zip
Figure 8 with 1 supplement
Albendazole reduces α-synuclein (αSyn)-green fluorescent protein (GFP) aggregates in a lysosome-dependent manner.
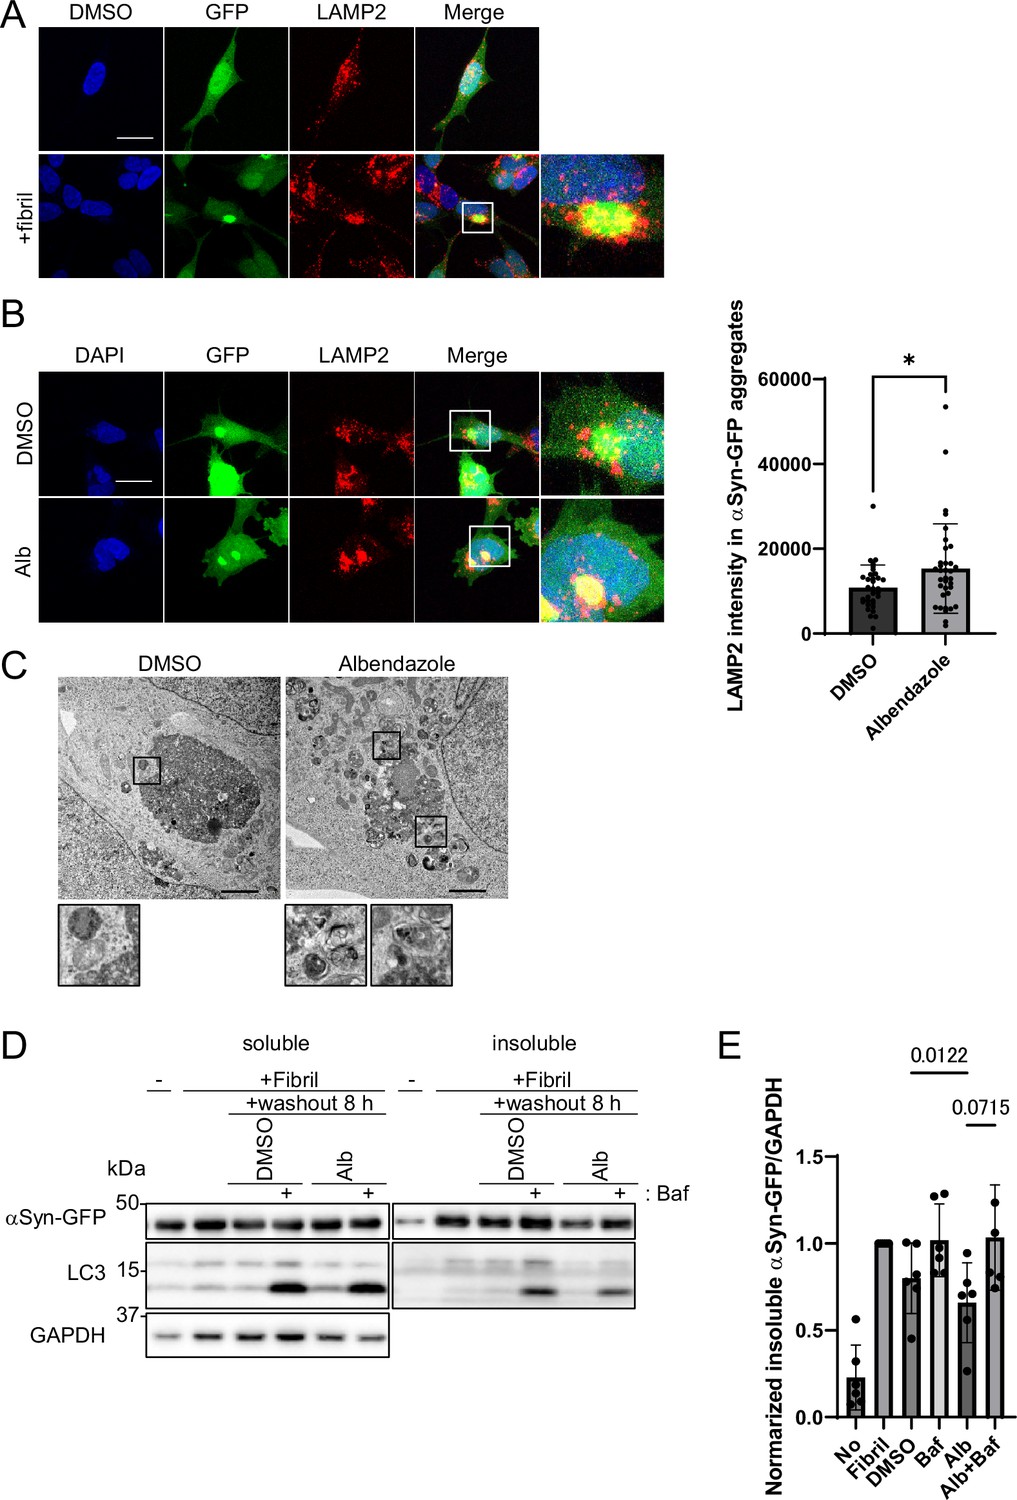
(A) SH-SY5Y cells overexpressing αSyn-GFP were transfected with αSyn fibril (0.2 µg/mL) using Lipofectamine 3000. After 48 hr, the cells were fixed and stained with an anti-LAMP2 antibody (red) and 4′,6-diamidino-2-phenylindole (DAPI; blue). These cells were imaged using a confocal microscope. Scale bar: 20 μm. (B) SH-SY5Y cells overexpressing αSyn-GFP were transfected with αSyn fibril (0.2 µg/mL) using Lipofectamine 3000. After 48 hr, the transfection reagent was washed out, and the SH-SY5Y cells were treated with dimethyl sulfoxide (DMSO) or albendazole (10 μM) with or without bafilomycin A1 (30 nM) for 8 hr. Cells were fixed and stained with an anti-LAMP2 antibody (red) and DAPI (blue). The cells were imaged using a confocal microscope. Scale bar: 20 μm. The colocalization of LAMP2 and αSyn-GFP aggregates was assessed by measuring the fluorescence values of lysosomes in contact within the αSyn-GFP aggregation area using ImageJ (n >30). * p<0.05, Wilcoxon test. (C) SH-SY5Y cells overexpressing αSyn-GFP were transfected with αSyn fibril (0.2 µg/mL) using Lipofectamine 3000. After 48 hr, the transfection reagent was washed out, and the SH-SY5Y cells were treated with DMSO or albendazole (10 μM), followed by electron microscopy analysis. Lysosome-like structures are enlarged at the bottom. Scale bar: 2 μm. (D) SH-SY5Y cells overexpressing αSyn-GFP were transfected with αSyn fibril (0.2 µg/mL) using Lipofectamine 3000. After 48 hr, the transfection reagent was washed out, and the SH-SY5Y cells were treated with DMSO or albendazole (10 μM) with or without bafilomycin A1 (30 nM) for 8 hr. Cell lysates were separated into Triton-X-100–soluble (soluble) and pellet fractions (insoluble), then subjected to sodium dodecyl sulfate polyacrylamide gel electrophoresis and immunoblotting with the indicated antibody. (E) Bar graph showing the insoluble αSyn-GFP ratio from panel D. Data are expressed as mean ± standard deviation. One-way analysis of variance and Dunnett’s test.
-
Figure 8—source data 1
Uncropped blot images of Figure 8D.
- https://cdn.elifesciences.org/articles/98649/elife-98649-fig8-data1-v2.zip
Figure 8—figure supplement 1
Analysis of the degradation of α-synuclein (αSyn) aggregates.
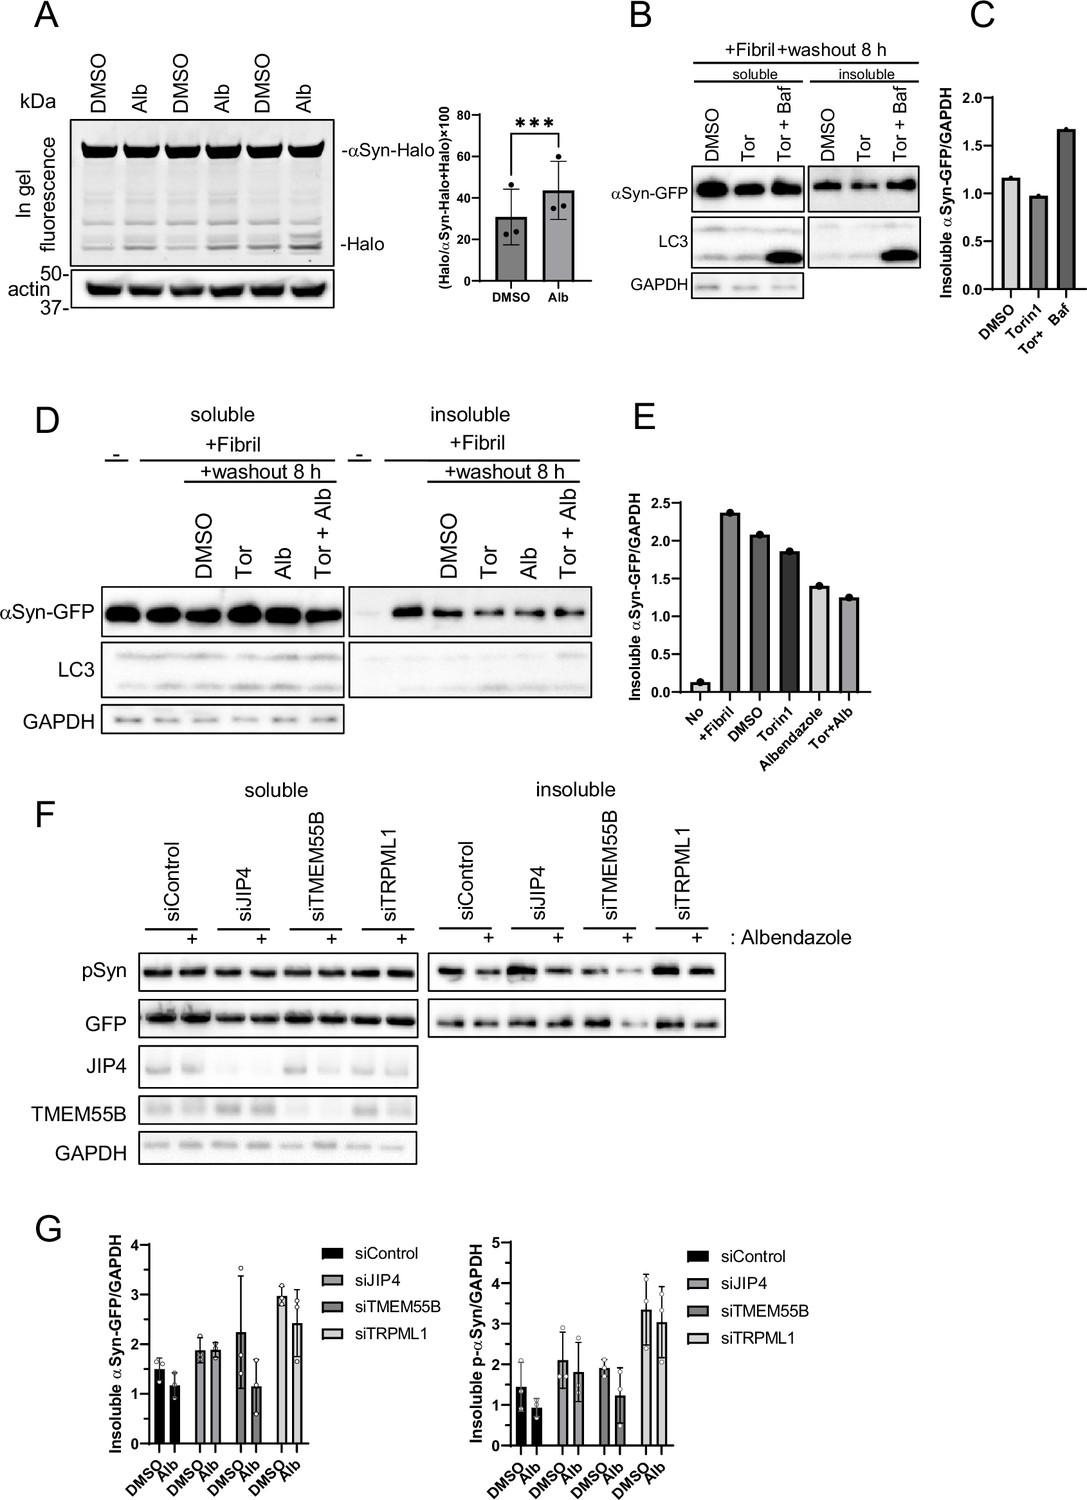
(A) SH-SY5Y cells expressing αSyn-Halo were labeled for 20 min with 100 nM of tetramethylrhodamine-conjugated ligand in a nutrient-rich medium. After washing with phosphate-buffered saline and incubating in normal medium for 30 min, the cells were treated with 10 µM albendazole for 8 hr. The experiments were performed in triplicate. Cell lysates were separated by electrophoresis and analyzed by in-gel fluorescence detection (left). The HaloTMR band intensity was normalized by the sum of the band intensities of HaloTMR-αSyn and HaloTMR. The vertical axis of the graph represents the intensity multiplied by 100. Mean values of data from five or three experiments are shown. The graph data are expressed as mean ± standard deviation. ****p<0.0001, ***p<0.001, Student’s t-test. (B, C) SH-SY5Y cells overexpressing αSyn-GFP were transfected with αSyn fibril (0.2 µg/mL) using Lipofectamine 3000. After 48 hr, the transfection reagent was washed out, and the SH-SY5Y cells were treated with 100 nM Torin1 with or without 100 nM bafilomycin A1 for 8 hr (B). Cell lysates were separated into Triton-X-100–soluble (soluble) and pellet fractions (insoluble), then subjected to sodium dodecyl sulfate-polyacrylamide gel electrophoresis (SDS-PAGE) and immunoblotting with the indicated antibody (left). The amount of insoluble αSyn was quantified using ImageJ software (C). (D, E) SH-SY5Y cells overexpressing αSyn-GFP were transfected with αSyn fibril (0.2 µg/mL) using Lipofectamine 3000. After 48 hr, and washing out the transfection reagent, SH-SY5Y cells were treated with albendazole (10 μM) with or without 100 nM Torin1 for 8 hr (D). Cell lysates were separated into Triton-X-100–soluble (soluble) and pellet fractions (insoluble), then subjected to SDS-PAGE and immunoblotting with the indicated antibody (left). The amount of insoluble αSyn was quantified using ImageJ software (E). (F, G) SH-SY5Y cells overexpressing αSyn-GFP were transfected with the indicated siRNAs for 24 hr and then transfected with αSyn fibril (0.2 µg/mL) using Lipofectamine 3000 for 48 hr. After washing out the transfection reagent, the SH-SY5Y cells were treated with dimethyl sulfoxide or albendazole (10 μM) for 8 hr. Cell lysates were separated into Triton-X-100–soluble (soluble) and pellet fractions (insoluble) and subjected to SDS-PAGE and immunoblotting with the indicated antibody (F). The bar graph presents the ratio of the insolubleαSyn-GFP to the soluble GAPDH or insoluble p-αSyn to the soluble GAPDH of the intensity of the data in panel F (G). Data are expressed as mean ± standard deviation.
Figure 9
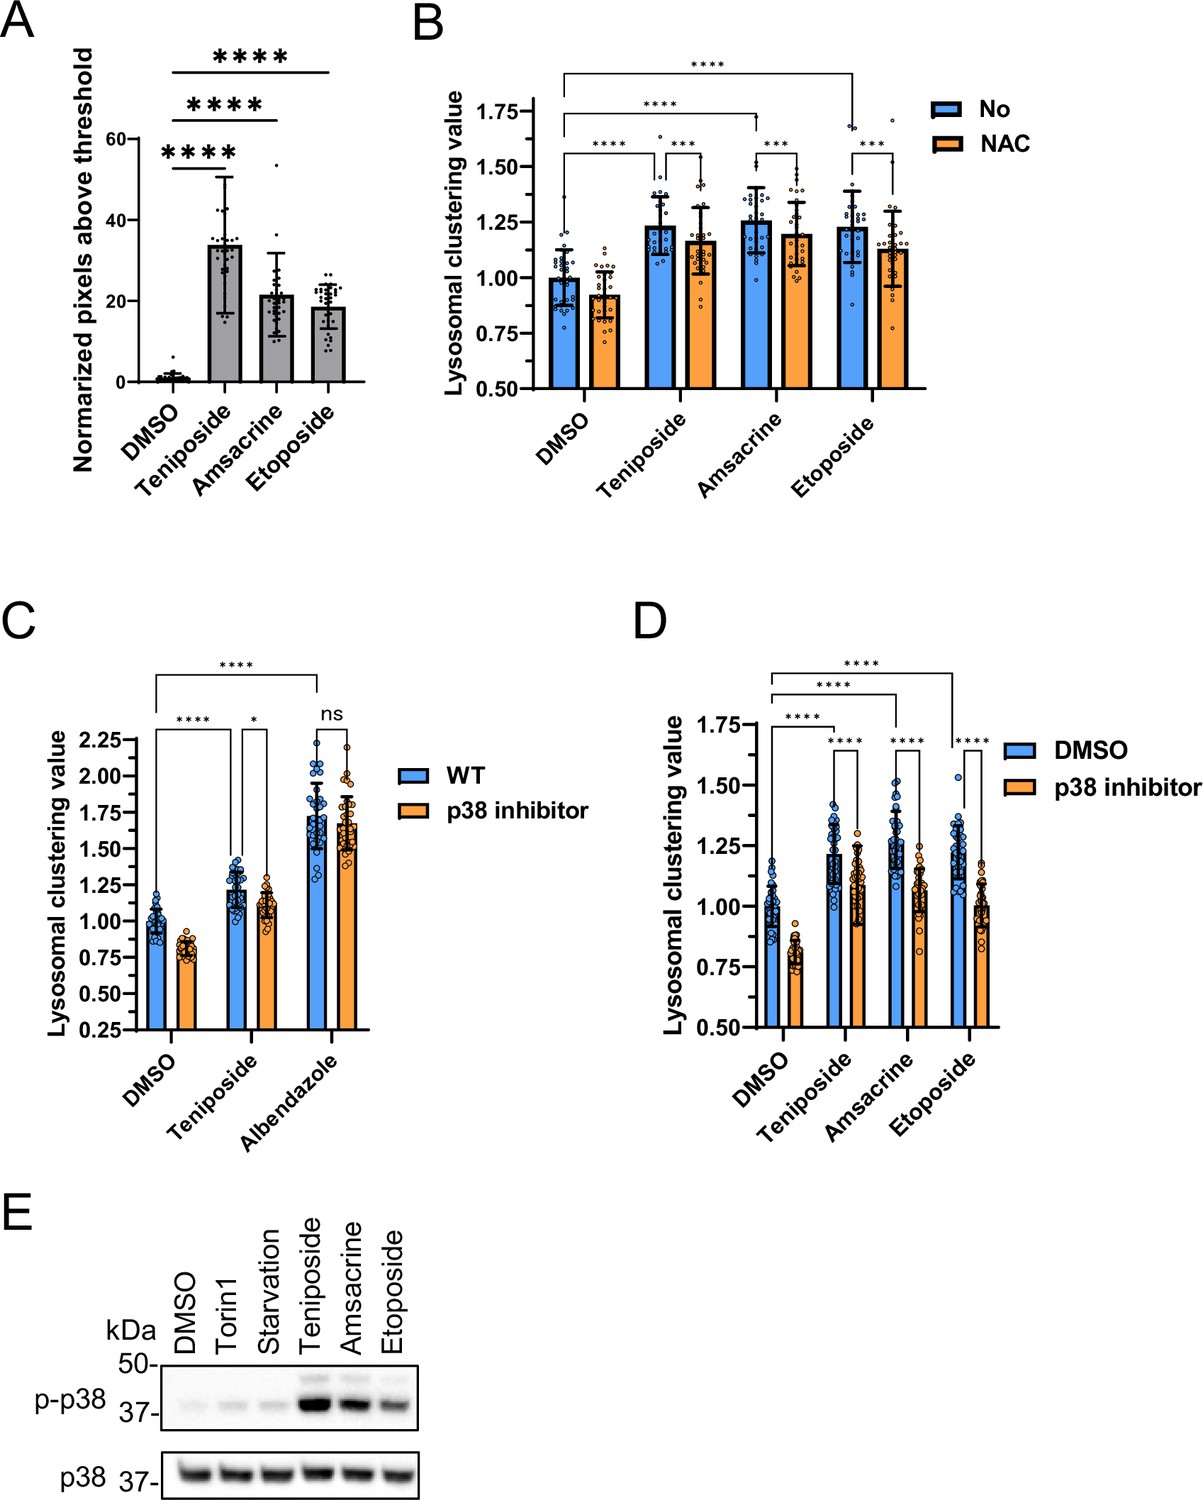
Analysis of lysosomal clustering mechanism of action for topoisomerase inhibitors.
(A) SH-SY5Y cells were treated with the indicated compounds (10 µM) for 4 hr. The amount of intracellular reactive oxygen species (ROS) is examined by ROS Assay Kit -Highly Sensitive DCFH-DA (Dojindo) and the normalized pixels above threshold as measured using an INCellAnalyzer 2200 and ImageJ. (B) SH-SY5Y cell lines were pre-treated with 0.1 mM N-acetyl-L-cysteine for 24 hr and then treated with the indicated compound (10 µM) for an additional 4 hr. Cells were fixed and stained with anti-γ-tubulin (green) and anti-LAMP2 (red) antibodies. Lysosomal distribution was examined using an INCellAnalyzer 2200 and quantified using ImageJ software. (C, D) SH-SY5Y cells were cultured in 96-well black plates and treated with teniposide (10 μM), amsacrine (10 μM), etoposide (10 μM), or albendazole (10 μM) with or without the p38 inhibitor (SB203580). Following treatment, cells were fixed and stained with anti-γ-tubulin (green) and anti-LAMP2 (red) antibodies. They were then imaged using an INCellAnalyzer2200. INCellAnalyzer2200 images were analyzed for lysosomal clustering with ImageJ. The graph presents the lysosomal clustering value for either DMSO or the p38 inhibitor. (n>30, from three biological replicates). Data is shown as the mean ± standard deviation. ****p<0.0001, ***p<0.001, **p<0.01, *p<0.05, two-way analysis of variance and Tukey’s test. N.S., not statistically significant. (E) SH-SY5Y cells were cultured and then treated with starvation medium, Torin1 (1 μM), teniposide (10 μM), amsacrine (10 μM), or etoposide (10 μM). Subsequently, cell lysates were immunoblotted with the indicated antibodies.
-
Figure 9—source data 1
Uncropped blot images of Figure 9D.
- https://cdn.elifesciences.org/articles/98649/elife-98649-fig9-data1-v2.zip
Figure 10
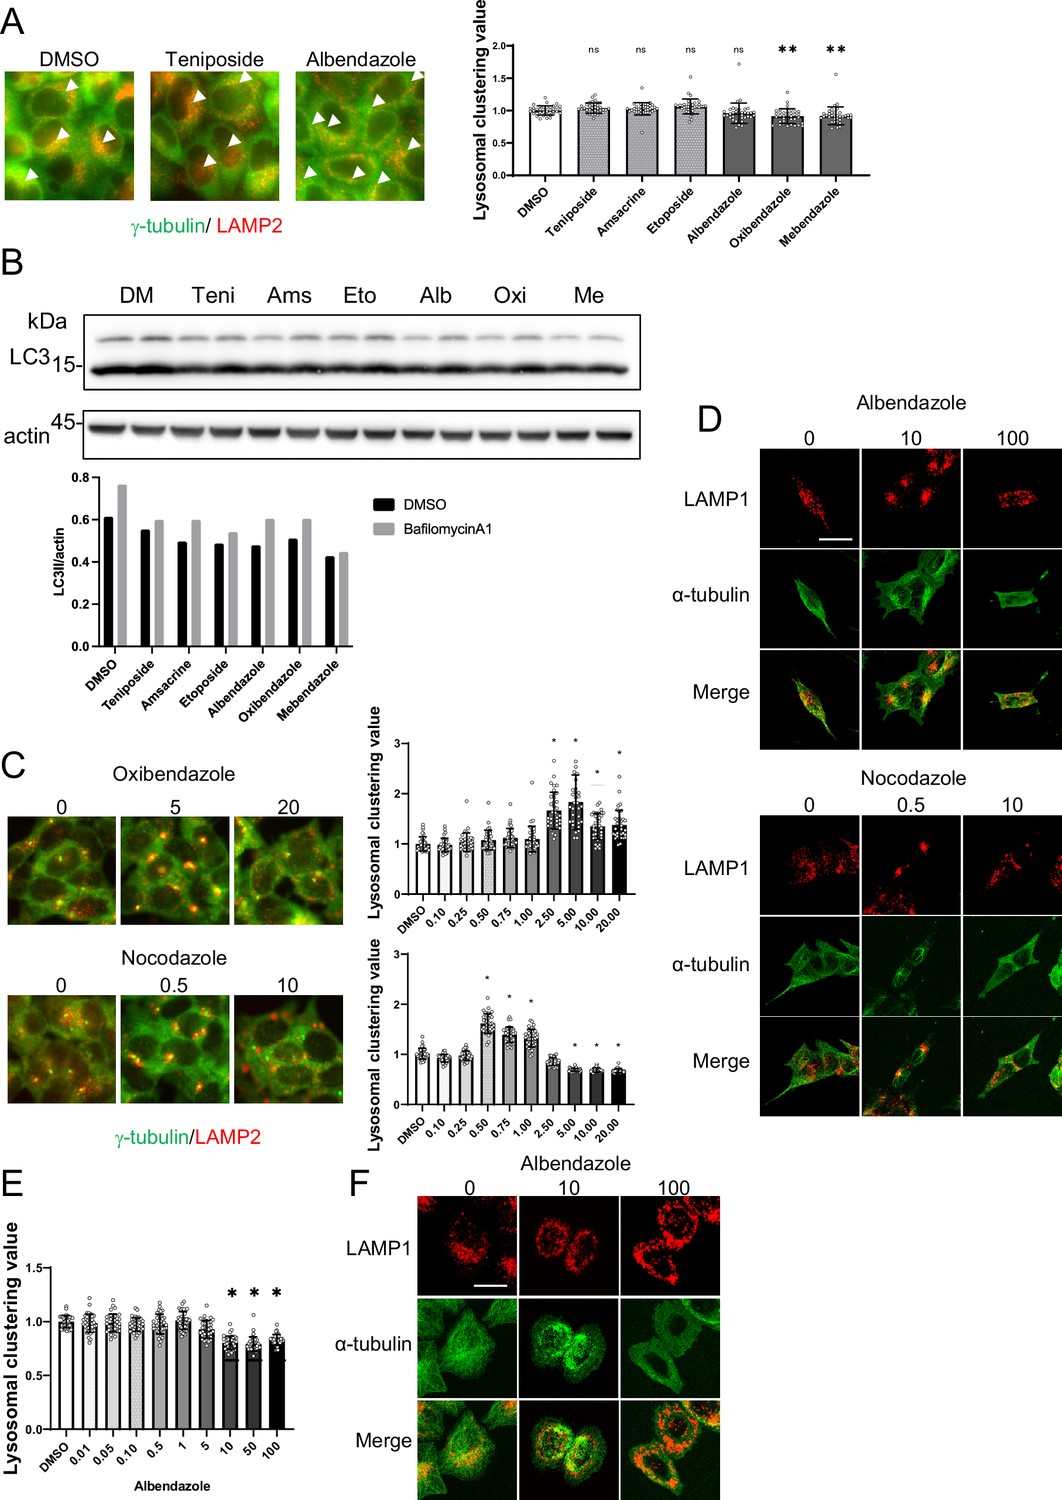
Analysis of lysosomal clustering mechanism of action for benzimidazole mechanism.
(A) HeLa cells were treated with teniposide (10 μM), amsacrine (10 μM), etoposide (10 μM),albendazole (10 μM), oxibendazole (1 μM), or mebendazole (5 μM). Images were captured using an INCellAnalyzer2200. INCellAnalyzer2200 images were analyzed using ImageJ for lysosomal clustering. Scale bar: 20 μm.The graph presents the lysosomal clustering values (n>30, from three biological replicates). Data are expressed as mean ± standard deviation (SD). ****p<0.0001, ***p<0.001, **p<0.01, *p<0.05, two-way analysis of variance (ANOVA) and Tukey’s test. N.S., not statistically significant. The experiment was technically replicated at least three times. (B) HeLa cells were treated with teniposide (10 μM), amsacrine (10 μM), etoposide (10 μM), albendazole (10 μM), oxibendazole (1 μM), or mebendazole (5 μM) for 4 hr. Cell lysates were immunoblotted with the indicated antibodies. The amount of LC3II was estimated using ImageJ software (bottom panel). (C) SH-SY5Y cells were cultured in 96-well black plates and treated with oxibendazole or nocodazole at specified concentrations (in µM). After treatment, cells were fixed and stained with anti-γ-tubulin (green) and anti-LAMP2 (red) antibodies, followed by imaging with an INCellAnalyzer2200. Scale bar: 20 μm. INCellAnalyzer2200 images were processed and analyzed using ImageJ for lysosomal clustering. The graph presents the lysosomal clustering values (n>30). Data are expressed as mean ± SD. *p<0.0001, as determined by one-way ANOVA and Dunnett’s test (vs. dimethyl sulfoxide [DMSO]). (D) SH-SY5Y cells were treated with albendazole (10 and 100 µM) or nocodazole (0.5 and 10 µM) for 4 h. Cells were fixed and stained with LAMP1 (red) and α-tubulin (green) antibodies. Scale bar: 20 μm. (E) HeLa cells were treated with albendazole at specified concentrations (in µM). After treatment, cells were fixed and stained with anti-γ-tubulin (green) and anti-LAMP2 (red) antibodies, followed by imaging with an INCellAnalyzer2200. INCellAnalyzer2200 images were processed and analyzed using ImageJ for lysosomal clustering. The graph presents the lysosomal clustering values (n >30). Data are expressed as mean ± SD. *p<0.0001, as determined by one-way ANOVA and Dunnett’s test (vs. DMSO). (F) HeLa cells were treated with albendazole (10 and 25 µM) for 4 hr. Cells were fixed and stained with LAMP1 (red) and α-tubulin (green) antibodies. Scale bar: 20 μm.
-
Figure 10—source data 1
Uncropped blot images of Figure 10B.
- https://cdn.elifesciences.org/articles/98649/elife-98649-fig10-data1-v2.zip
Additional files
Download links
A two-part list of links to download the article, or parts of the article, in various formats.
Downloads (link to download the article as PDF)
Open citations (links to open the citations from this article in various online reference manager services)
Cite this article (links to download the citations from this article in formats compatible with various reference manager tools)
Novel autophagy inducers by accelerating lysosomal clustering against Parkinson’s disease
eLife 13:e98649.
https://doi.org/10.7554/eLife.98649


