Photoreceptor loss does not recruit neutrophils despite strong microglial activation
- Center for Visual Science, University of Rochester, United States
- Flaum Eye Institute, University of Rochester, United States
- Department of Translational Imaging, Genentech, Inc, United States
- Department of Neuroscience, University of Rochester, United States
Figures
Figure 1 with 1 supplement
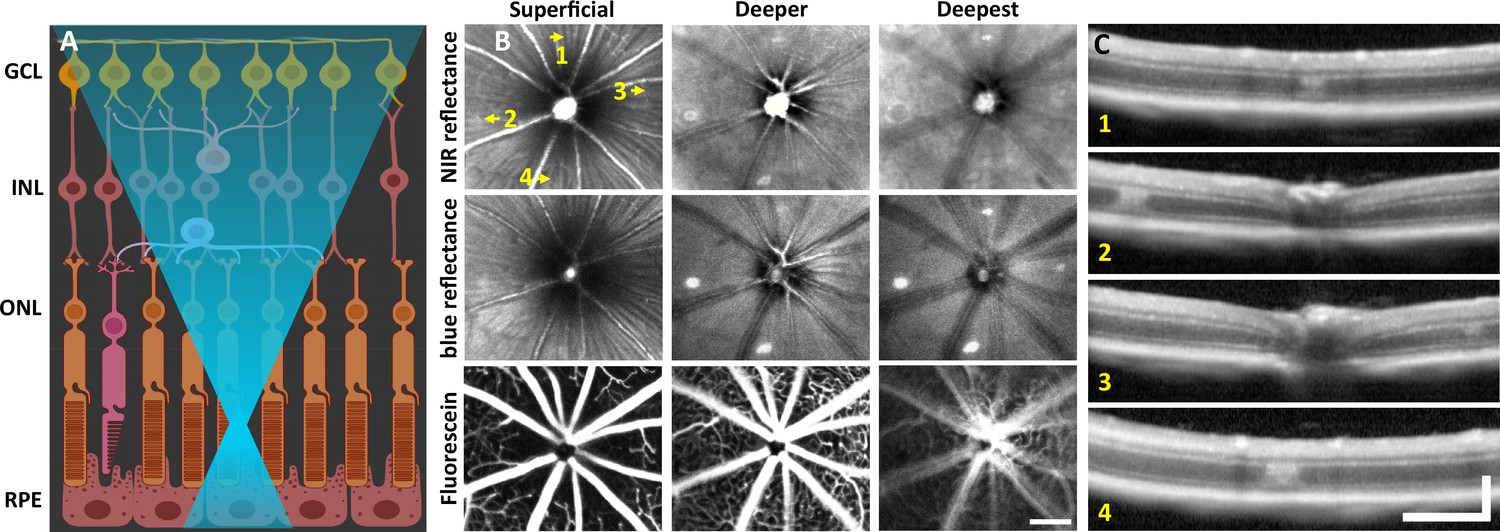
Laser injury assessed with commercial scanning light ophthalmoscopy (SLO) and optical coherence tomography (OCT).
(A) 488 nm light is focused onto the photoreceptor outer segments using adaptive optics scanning light ophthalmoscopy (AOSLO). Created with BioRender.com. (B) 30° SLO images of near-infrared (NIR) reflectance, blue reflectance, and fluorescein angiography of a mouse retina 1 day after laser exposure. Three focal planes are shown. NIR and blue reflectance reveal small hyperreflective regions below the superficial plane. Fluorescein reveals intact vasculature with no sign of leakage. Arrows indicate regions with imparted laser damage (1–4). (C) OCT B-scans passing through laser-exposed regions indicated in (B). Exposures produced a focal hyperreflective band within the outer nuclear layer (ONL) with adjacent retina appearing healthy. OCT images were spatially averaged (~30 µm, three B-scans). Scale bars = 200 µm horizontal, 200 µm vertical.
Figure 1—figure supplement 1

Lesion location tracked from minutes to 1 day with optical coherence tomography (OCT).
After baseline OCT acquisition, OCT was performed every 5–7 minutes for 1 hour after 488 nm light exposure. 6-hour and 1-day time points were subsequently acquired. A band of hyperreflectivity forms near the outer plexiform layer (OPL)/outer nuclear layer (ONL) interface within 30 minutes of 488 nm light exposure. Hyperreflective band spreads deeper into the ONL within ~1 hour. OCT images were spatially averaged (~30 µm, eight B-scans). Scale bar = 40 µm horizontal, 100 µm vertical.
Figure 2
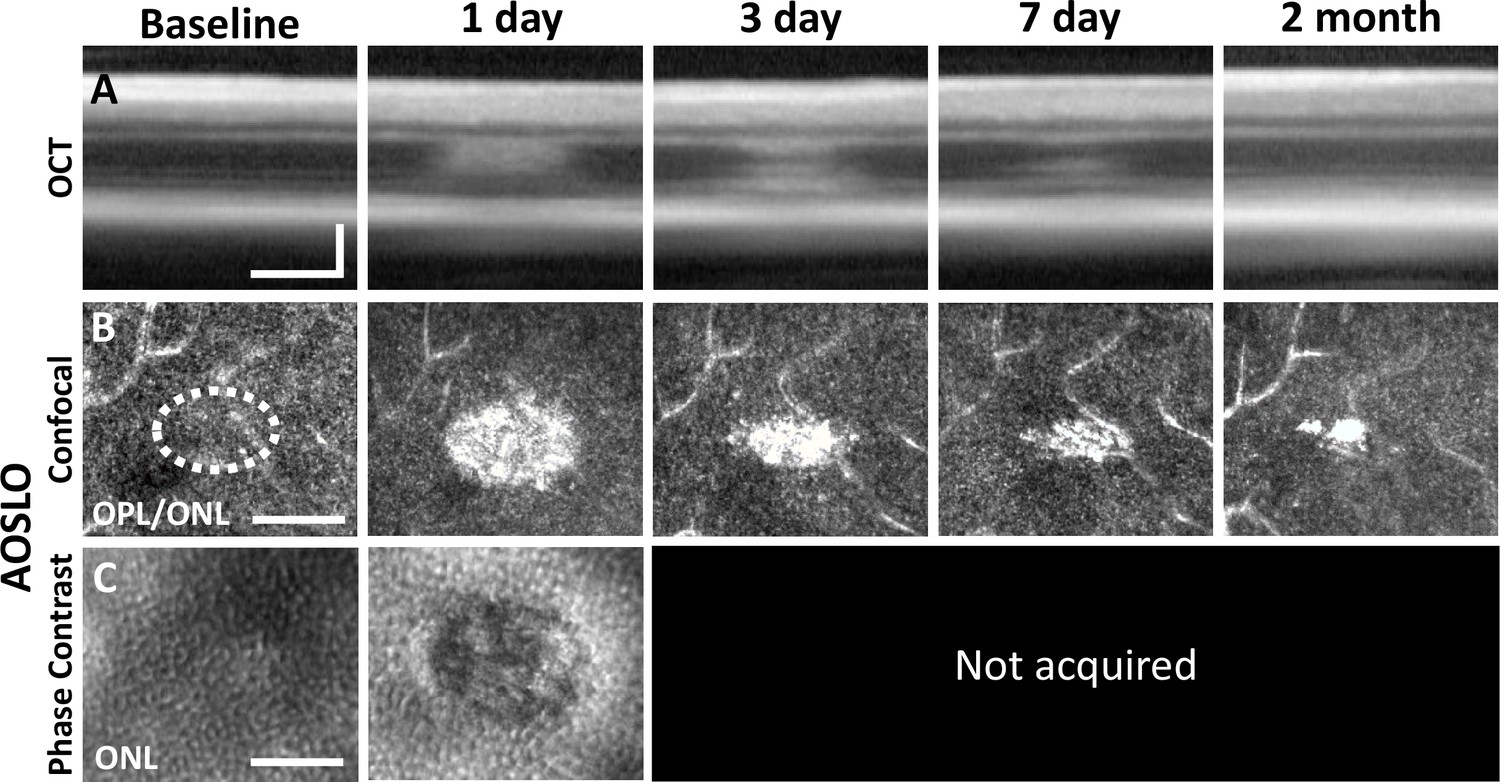
Laser damage temporally tracked with adaptive optics scanning light ophthalmoscopy (AOSLO) and optical coherence tomography (OCT).
Laser-exposed retina was tracked with OCT (A), confocal (B), and phase-contrast (C) AOSLO for baseline, 1-, 3-, 7-day, and 2-month time points. OCT and confocal AOSLO display a hyperreflective phenotype that was largest/brightest at 1 day and became nearly invisible by 2 months. Dashed oval indicates region targeted for laser injury. Phase-contrast AOSLO revealed disrupted photoreceptor soma 1 day after laser injury. Phase-contrast data was not acquired for remaining time points due to the development of cataract, which obscured the phase-contrast signal. OCT images were spatially averaged (~30 µm, eight B-scans). Scale bars = 40 µm horizontal, 100 µm vertical.
Figure 3
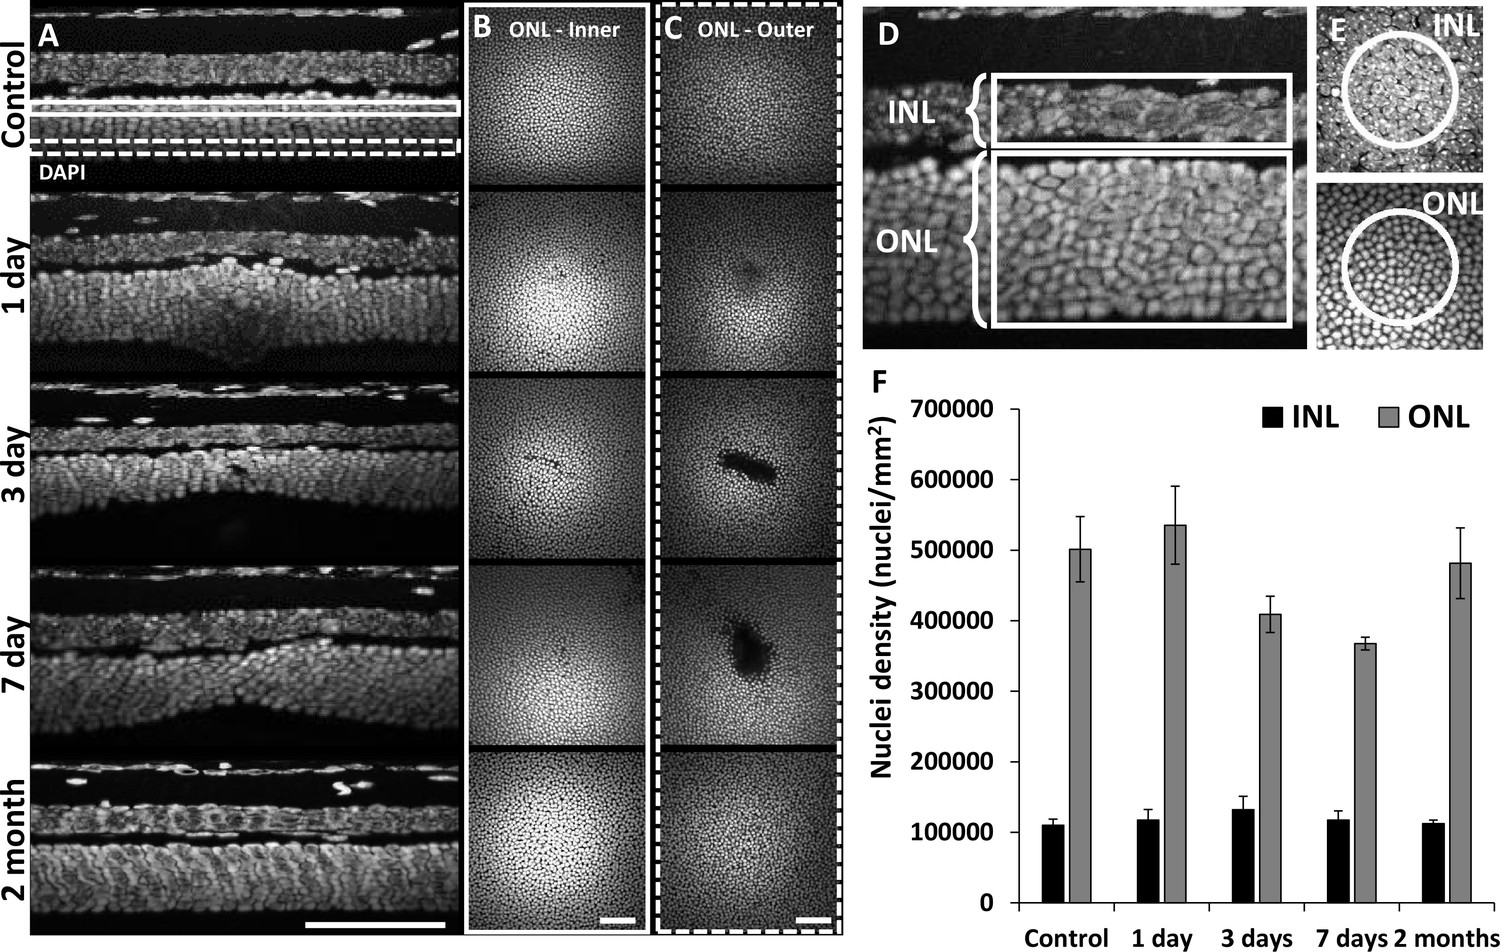
Retinal histology confirms photoreceptor ablation and preservation of inner retinal cells.
Cross-sectional view (A) and en-face (B, C) images of DAPI-stained whole-mount retinas at laser injury locations over time. By 1 day, outer nuclear layer (ONL) becomes thicker at the lesion location, but thinner by 3 and 7 days. By 2 months, the ONL appeared similar to that of control. The inner (B, solid rectangle) and outer (C, dashed rectangle) stratum of ONL show axial differences in ONL loss. Most cell loss was seen in the outer aspect of the ONL (C). Scale bars = 40 µm. (D) Cross-section of DAPI-stained retina displaying inner nuclear layer (INL) and ONL regions for quantification. Each analysis region was 50 µm across and encompassed the entire depth of the INL or ONL. (E) En-face images show 50 µm diameter circles used for analysis. (F) Nuclei density for post-injury time points. ONL nuclei were reduced at 3 and 7 days (p=0.17 and 0.07, respectively) while INL density remained stable (n=10 mice, three unique regions per time point). Error bars display mean ± 1 SD.
Figure 4 with 1 supplement
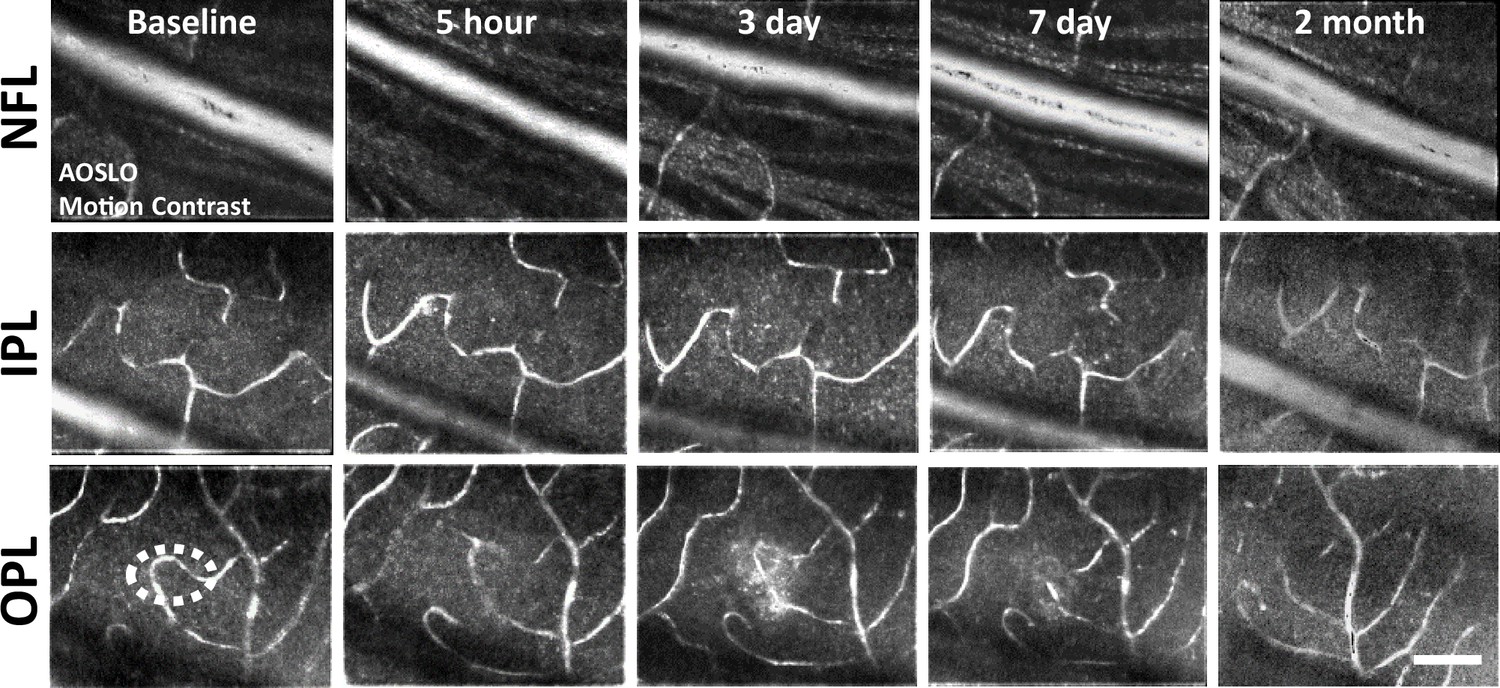
Motion-contrast images reveal vascular perfusion status in response to laser damage.
A single location was tracked over time at three vascular plexuses using adaptive optics scanning light ophthalmoscopy (AOSLO). Retinal vasculature remained perfused for all time points tracked and at all depths. White oval indicates damage location. Scale bar = 40 µm.
Figure 4—figure supplement 1

Measurement of single-cell blood flux after laser damage using phase-contrast adaptive optics scanning light ophthalmoscopy (AOSLO).
Mouse 1: (A) the vascular plexus corresponding to inner plexiform layer (IPL) (cyan) and outer plexiform layers (OPL) (red) was targeted for flux determination. Blood cell flux was measured for two capillaries within the same field, at different depths. Arrows show the location for repeated line scan acquisitions. Created with BioRender.com. (B) RBC flux images acquired up to 7 days post-damage. Scale bars = 10 ms horizontal, 5 µm vertical. (C) Capillary flux quantified over 7 days. Despite the outer capillary displaying higher flux, both inner and outer capillaries changed synchronously for each time point. (D) Correlation of inner and outer capillary flux. Linear regression model displays a weak positive correlation (black dotted line). Mouse 2: (E) Left: representative 55° scanning light ophthalmoscopy (SLO) image showing regions targeted for capillary flux measurement. One region was subject to 488 nm laser damage and the other was left unlasered (Control). Scale bar = 200 µm. Right: capillaries targeted for blood cell flux measurement. Arrows show the location for repeated line scan acquisitions. Scale bar = 40 µm. (F) RBC flux images acquired up to 2 months post-damage. Scale bars = 10 ms horizontal, 5 µm vertical. (G) Capillary flux quantified over 2 months. Flux remained similar at lesion and control locations for all time points assessed. Gray shaded regions indicate the range for normal capillary flux in the healthy C57BL/6J mouse (Dholakia et al., 2022). (H) Correlation of flux in lesion and control locations. Linear regression model displays a positive correlation (black dotted line).
Figure 5 with 1 supplement
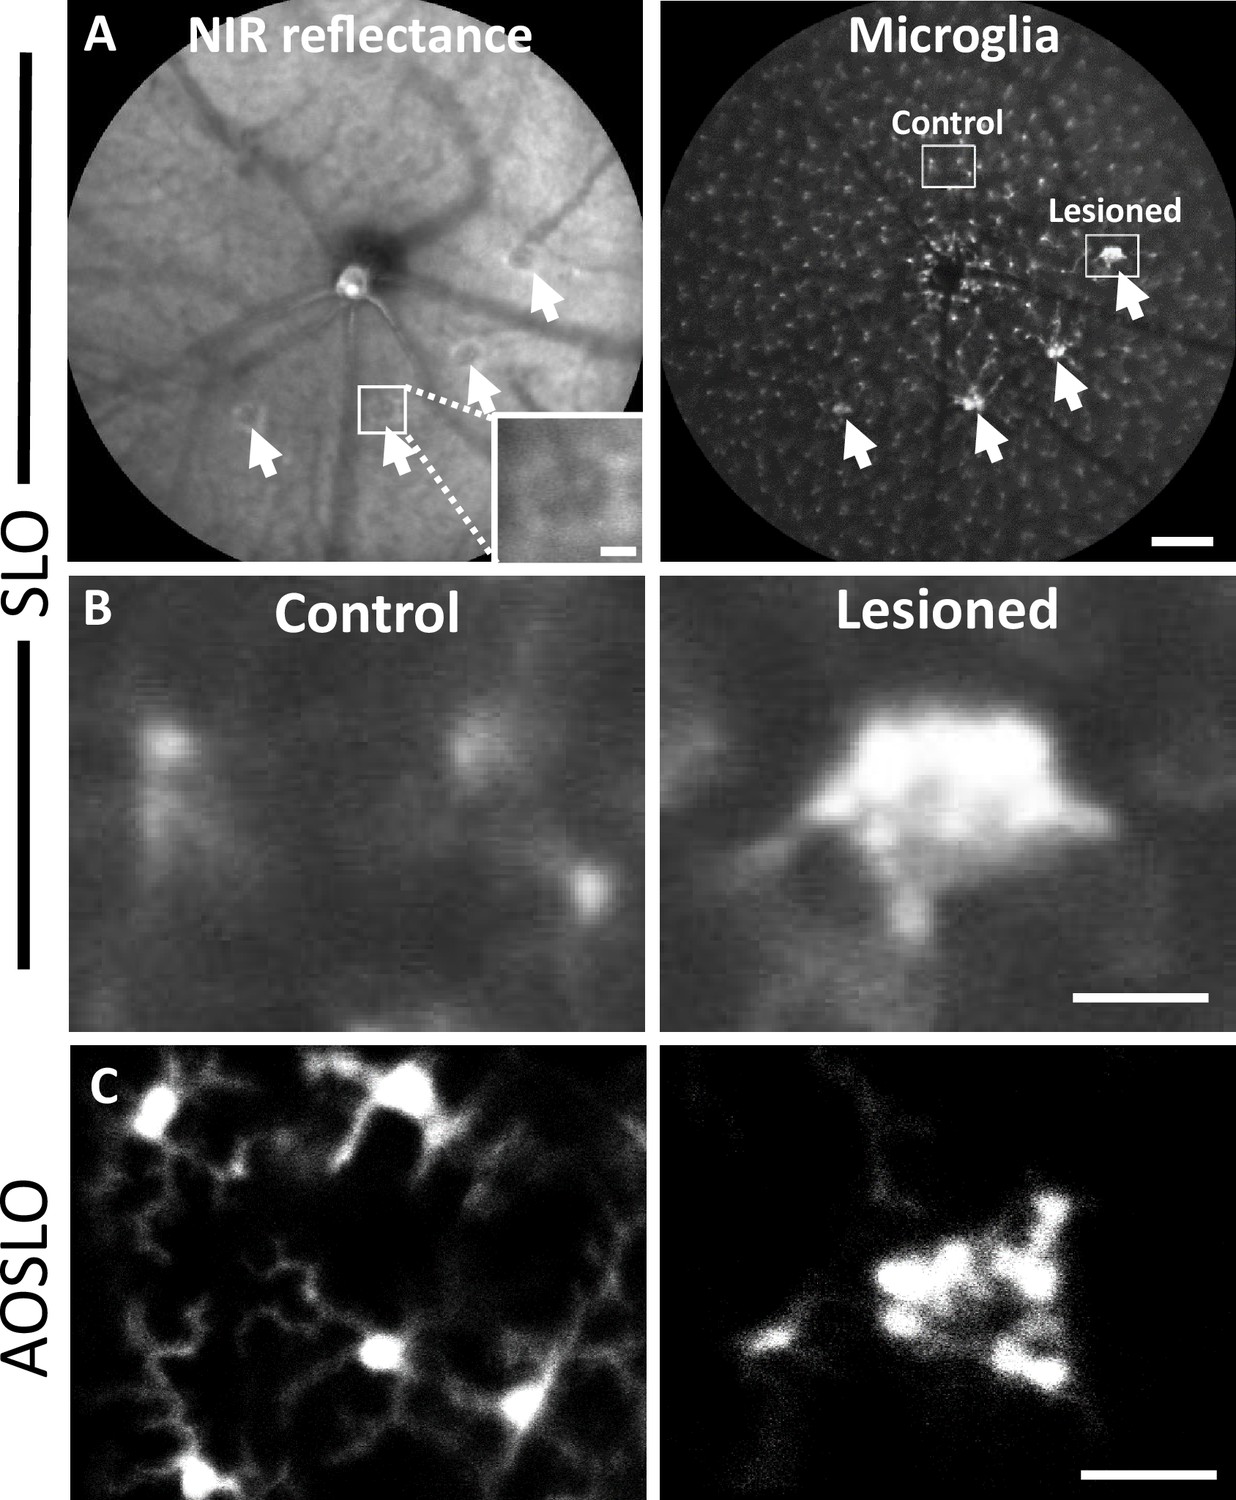
Microglial response 1 day after laser injury imaged in vivo with fluorescence scanning light ophthalmoscopy (SLO) and adaptive optics scanning light ophthalmoscopy (AOSLO).
(A) Left: deep-focus near-infrared (NIR) SLO fundus image (55° FOV) of laser-injured retina. White arrowheads point to damaged locations showing hyperreflective regions. Inset scale bar = 40 µm. Right: fluorescence fundus image from same location. Fluorescent CX3CR1-GFP microglia are distributed across the retina and show congregations at laser-damaged locations. Scale bar = 200 µm. (B) Magnified SLO images of microglia at laser-damaged and control locations (indicated in A, right, white boxes). Control location displays distributed microglial, whereas microglia at the lesion location are bright and focally aggregated. (C) Fluorescence AOSLO images show greater detail of cell morphology at the same scale. In control locations, microglia showed ramified morphology and distributed concentration, whereas damage locations revealed dense aggregation of many microglia that display less ramification. Scale bars = 40 µm.
Figure 5—video 1
Dynamic pseudopodia imaged with phase-contrast adaptive optics scanning light ophthalmoscopy 1 day post-injury.
At the outer plexiform layer/outer nuclear layer border, a putative microglial pseudopod extension was captured among a field of static, disrupted photoreceptor somas. Video is 3 minutes elapsed. Scale bars = 20 µm.
Figure 6 with 1 supplement
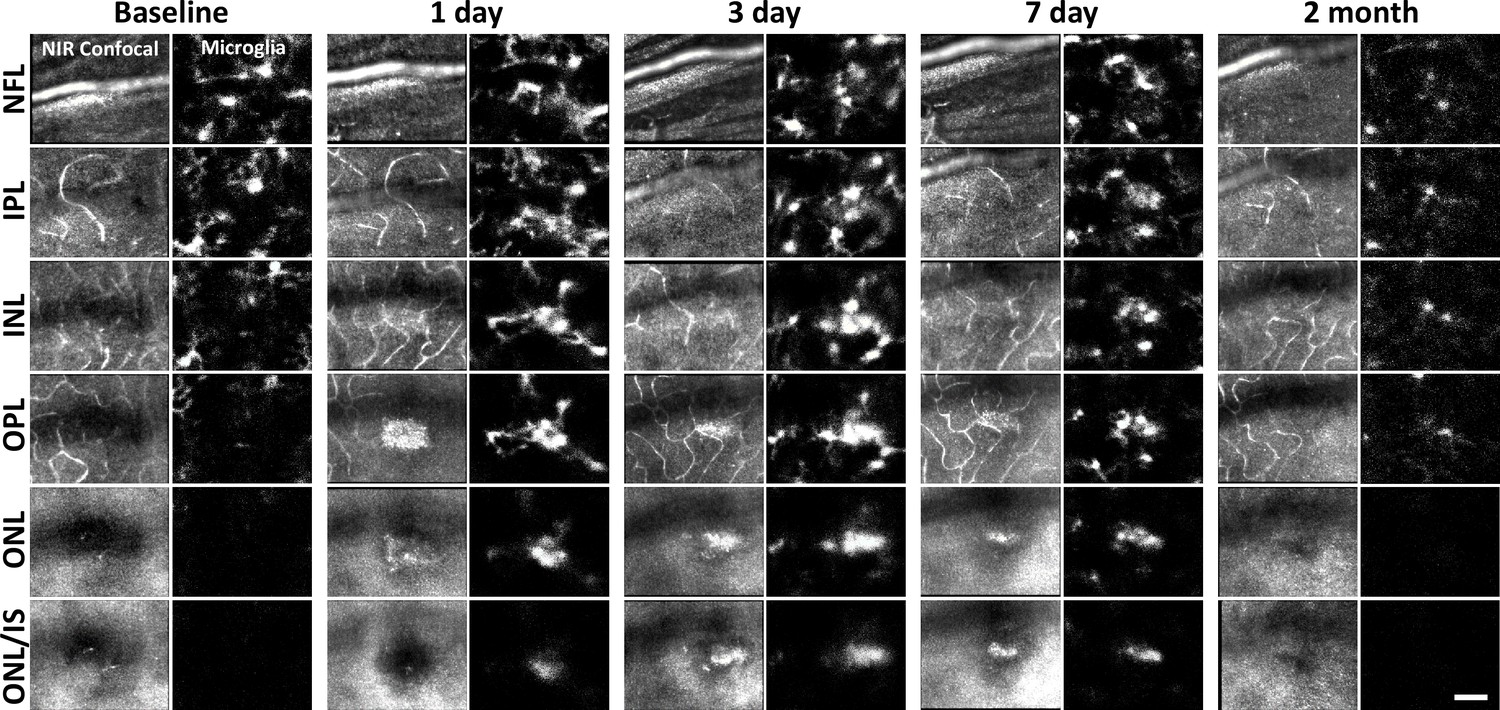
Microglial response to laser injury tracked with adaptive optics scanning light ophthalmoscopy (AOSLO).
Simultaneously acquired near-infrared (NIR) confocal and fluorescence AOSLO images across different retinal depths. Data are from one CX3CR1-GFP mouse tracked for 2 months. Microglia swarm to hyperreflective locations within 1 day. Microglia maintain an aggregated density for days and resolve by 2 months after damage. Scale bar = 40 µm.
Figure 6—figure supplement 1

Hyperreflective appearance emerges before microglia swarm to damage location.
Adaptive optics scanning light ophthalmoscopy (AOSLO) confocal and fluorescence images were acquired for baseline, 30, 90 minutes and 1 day post-laser exposure. The hyperreflective phenotype appeared within 30 minutes but microglia were not found to aggregate until 1 day post-damage. Scale bar = 40 µm.
Figure 7 with 4 supplements
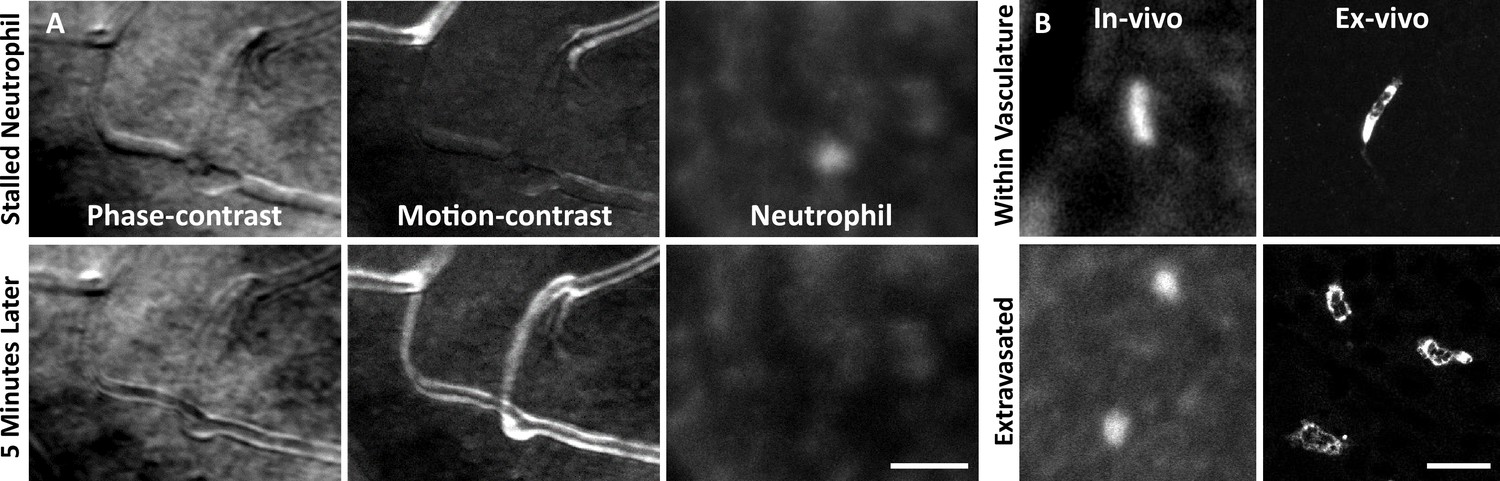
Neutrophil morphology imaged in vivo using adaptive optics scanning light ophthalmoscopy (AOSLO).
(A) Phase-contrast, motion-contrast, and fluorescence AOSLO reveal the impact of passing neutrophils on single capillaries. A rare and exemplary event shows a neutrophil transiently impeding capillary blood flow for minutes in healthy retina. Scale bar = 40 µm. (B) In vivo AOSLO and ex vivo fluorescence microscopy show neutrophils in two states. Neutrophils within capillaries displayed elongated, tubular morphology. Extravasated neutrophils were more spherical. Bottom images show extravasated neutrophils in response to an endotoxin-induced uveitis (EIU) model for comparison (not laser damage model). Scale bar = 20 µm.
Figure 7—figure supplement 1

Positive control endotoxin-induced uveitis (EIU) model: wide-field image of ex-vivo neutrophils 1 day post-lipopolysaccharide (LPS) injection.
Retinal whole mount (C57BL/6J mouse) stained for DAPI (left), Ly-6G-647 (middle), and merged (right) shows a large neutrophil response, many of which have extravasated into the retinal parenchyma. White box indicates the region cropped and displayed in Figure 7B. Scale bar = 40 µm.
Figure 7—video 1
Neutrophil dynamics within a primary retinal vessel in a healthy Catchup mouse.
Confocal (left) and fluorescence (right) adaptive optics scanning light ophthalmoscopy were acquired from a large primary retinal vessel simultaneously. Several quickly flowing neutrophils are seen as streaks within the lumen of the large retinal vessel. Video plays in real time (25 FPS, 20 seconds). Scale bar = 20 µm.
Figure 7—video 2
Neutrophils imaged in capillaries of a healthy Catchup mouse.
Motion-contrast (left) and fluorescence (right) adaptive optics scanning light ophthalmoscopy show a single neutrophil moving through a branch of the outer plexiform layer capillary network. Red circles/arrows indicate neutrophil path within the vascular perfusion map. Rare neutrophils were found to move slowly through capillaries. Video is 0.4 seconds elapsed. Scale bar = 20 µm.
Figure 7—video 3
Positive control endotoxin-induced uveitis (EIU) model: neutrophils imaged 1 day post-lipopolysaccharide injection.
Phase-contrast and fluorescence adaptive optics scanning light ophthalmoscopy reveal many extravasated neutrophils adjacent to a large inner retinal vessel in a Catchup mouse, some displaying movement. Video is 1 minute compressed into 1 second, repeated five times. Scale bar = 40 µm.
Figure 8 with 4 supplements
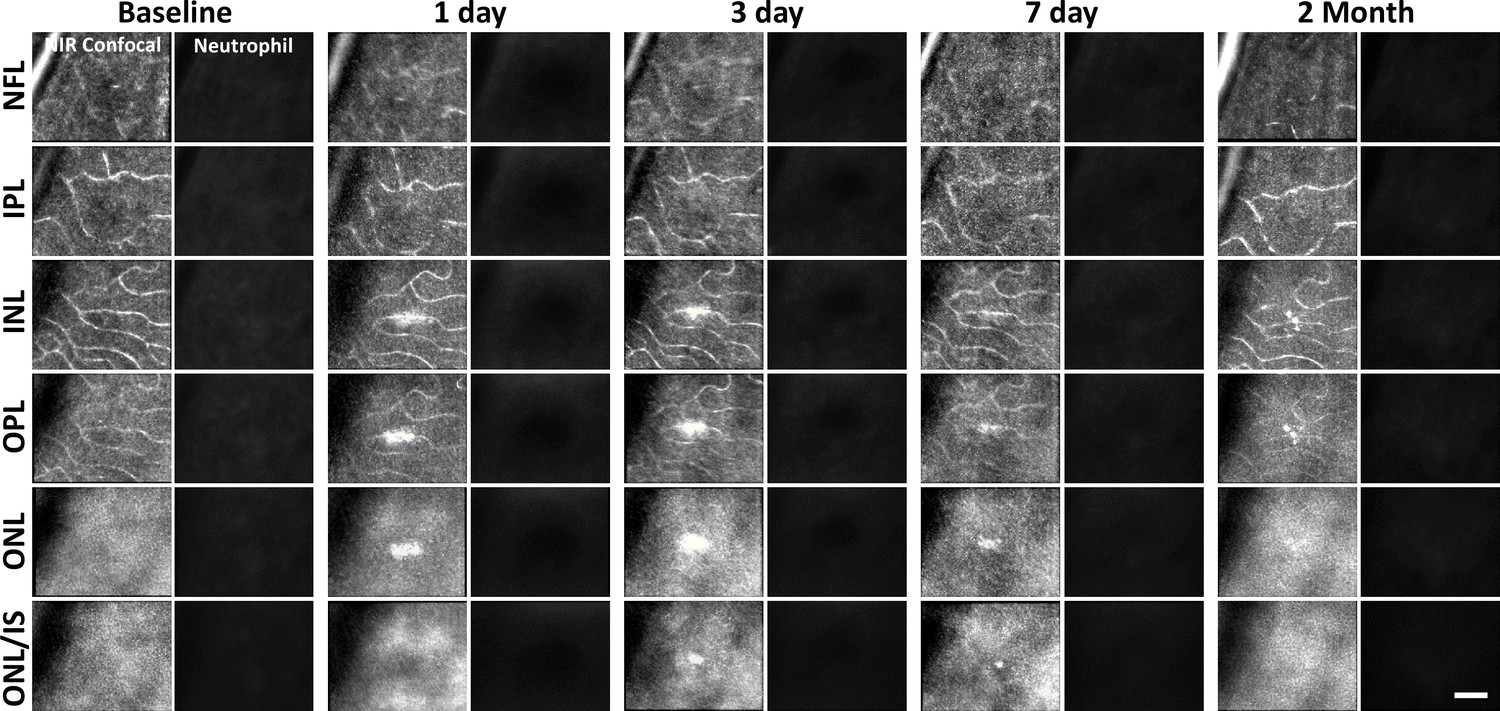
Neutrophil response to laser injury tracked with adaptive optics scanning light ophthalmoscopy (AOSLO).
A single retinal location was tracked in a Catchup mouse from baseline to 2 months after lesion. Location of the lesion is apparent at 1 and 3 days post-injury with diminishing visibility after 1 week. We did not observe stalled, aggregated, or an accumulation of neutrophils at any time point. This evaluation was confirmed at multiple depths ranging from the nerve fiber layer (NFL) to the outer nuclear layer (ONL). Scale bar = 40 µm.
Figure 8—figure supplement 1

Acute neutrophil response to laser injury tracked with adaptive optics scanning light ophthalmoscopy (AOSLO).
A single mouse was tracked for 0.5–3.5 hours after a deep retinal lesion was placed at the center of the imaged field, adjacent to a large venule. Neutrophils did not extravasate within this early post-lesion window (*also see Figure 8—video 3).
Figure 8—video 1
Neutrophil dynamics within a primary retinal vessel in a Catchup mouse 1 day after a deep retinal laser lesion is placed nearby.
Confocal (left) and fluorescence (right) adaptive optics scanning light ophthalmoscopy images were acquired simultaneously. Quickly flowing neutrophils are seen as streaks within the lumen of this large retinal vessel and despite the adjacent deep retinal lesion (within 100 µm), there is no indication of rolling or crawling neutrophils. Video plays in real time (25 FPS, 20 seconds). Scale bar = 20 µm.
Figure 8—video 2
Neutrophil dynamics within an outer plexiform layer capillary in a Catchup mouse 1 day after deep laser injury.
Motion-contrast (left) and fluorescence (right) adaptive optics scanning light ophthalmoscopy are displayed in tandem. At 1 day post-laser injury, a single neutrophil is seen moving through a capillary that runs directly through the injury site (yellow oval). Despite injury, the neutrophil does not slow or stall at the lesion location. Video is 0.68 seconds elapsed. Scale bar = 20 µm.
Figure 8—video 3
Neutrophil dynamics 2.5 hours post-lesion.
Neutrophil movement indicates they are within outer plexiform layer capillaries and did not extravasate into the retinal parenchyma at this early time point. Video is 30 seconds elapsed playing at 5× speed. Scale bar = 40 µm.
Figure 9 with 2 supplements
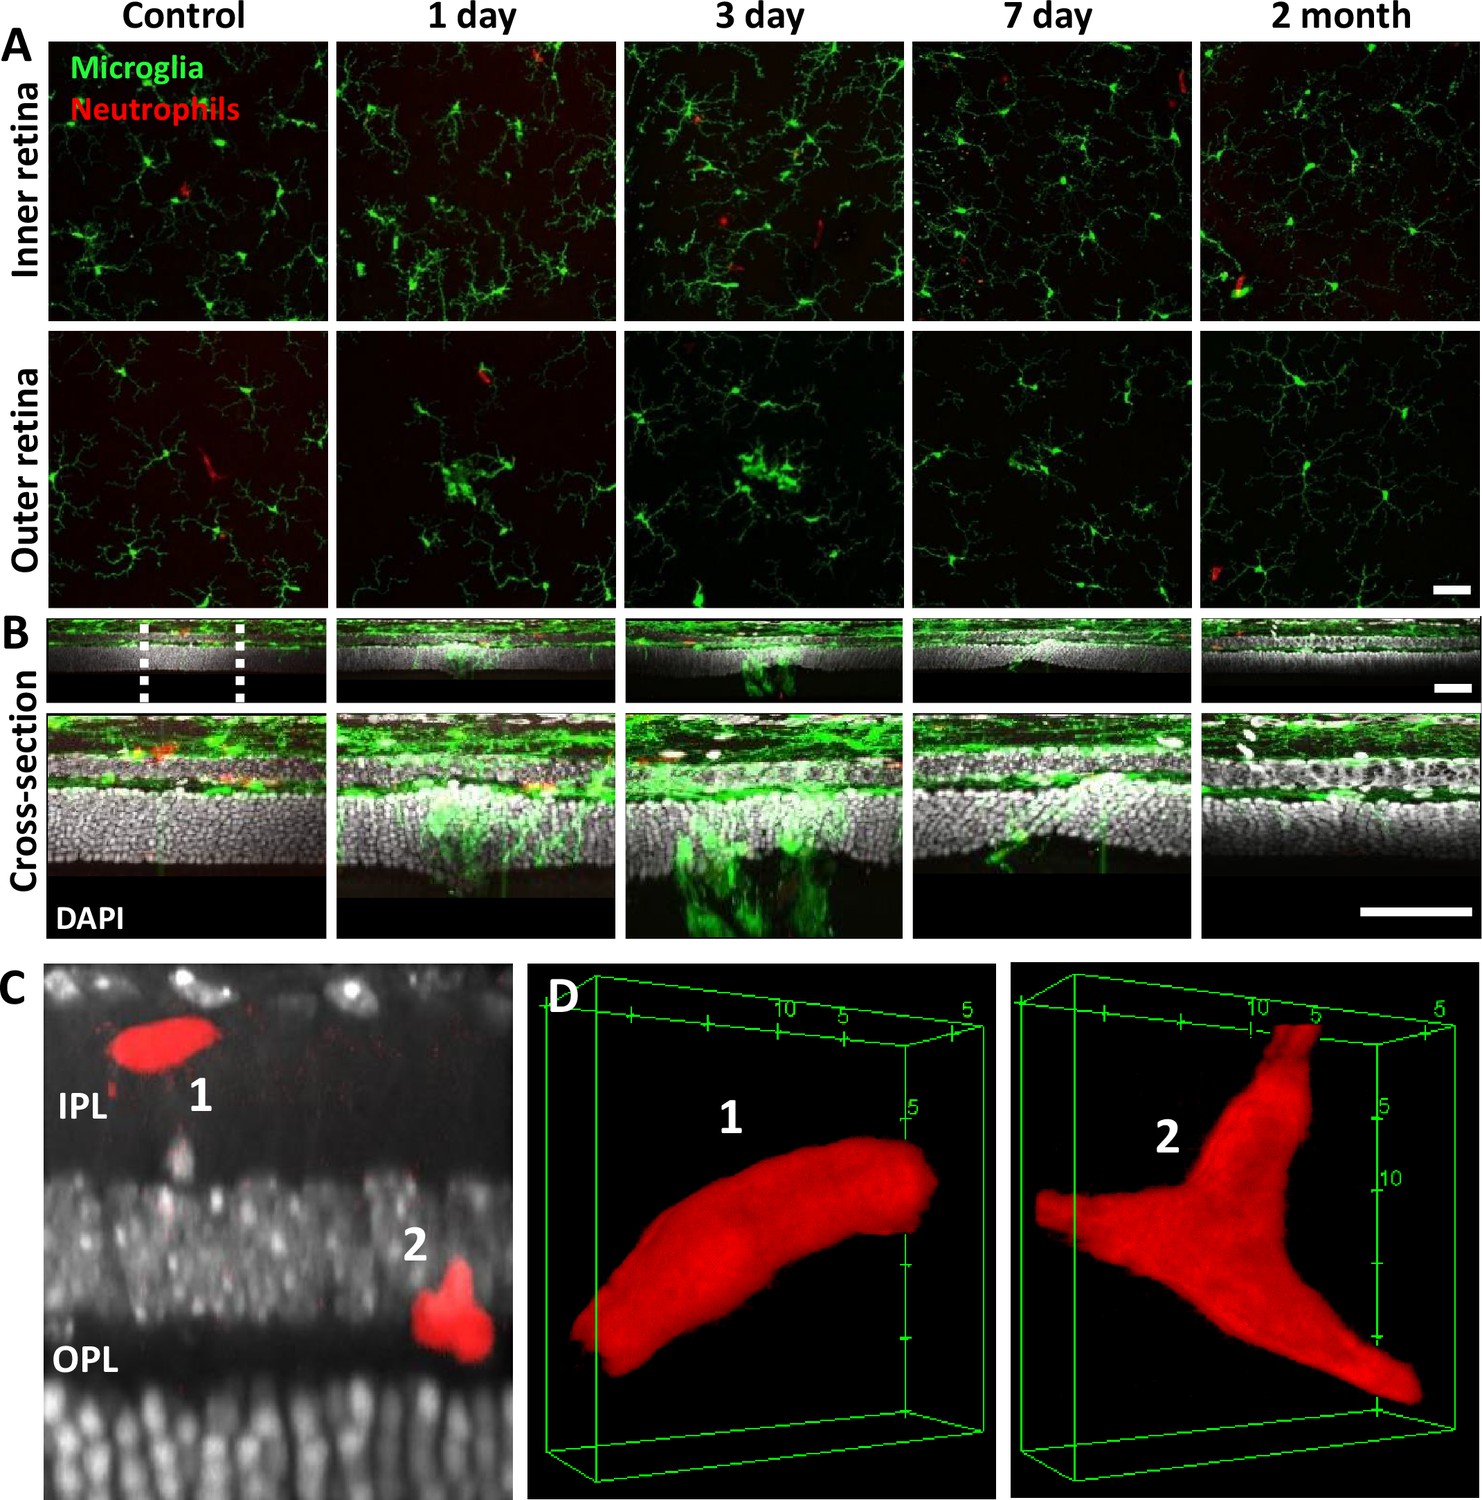
Neutrophil and microglial behavior after laser injury, as observed through ex vivo confocal microscopy.
(A) En-face max intensity projection images of inner and outer (separated by approximate inner nuclear layer [INL] center) retinal microglia/neutrophils in Ly-6G-647-stained CX3CR1-GFP retinas. Microglia display focal aggregation in the outer retina for 1-, 3-, and 7-day time points that is resolved by 2 months. Neutrophils do not aggregate or colocalize to the injury location at any time point. Z-stacks were collected from five mice for the indicated time points. (B) Cross-sectional views of en-face z-stacks presented in (A), including DAPI nuclear label. White dotted line indicates 100 µm region expanded below. Microglia migrate into the outer nuclear layer (ONL) by 1, 3, and 7 days post-laser injury and return to an axial distribution similar to that of control by 2 months. The few neutrophils detected remained within the inner retina. Scale bars = 40 µm. (C) Orthogonal view of DAPI-stained retina with Ly-6G-647-labeled overlay 1 day post-laser-injury. In a rare example, two neutrophils are found within the inner plexiform layer (IPL)/outer plexiform layer (OPL) layers despite a nearby outer retinal laser lesion. Scale bar = 20 µm. (D) Magnified 3D cubes representing cells 1 and 2 in (C). Cell 1 displays pill-shaped morphology, and cell 2 is localized to a putative capillary branch point. Each is confined within vessels suggesting they do not extravasate in response to laser injury.
Figure 9—figure supplement 1

Neutrophil/microglial response to laser injury tracked with ex vivo confocal microscopy.
Simultaneously acquired GFP-positive microglia and Ly-6G-647-positive neutrophils were imaged with confocal microscopy in five CX3CR1-GFP mice. En-face images for several retinal depths are displayed. By 1, 3, and 7 days post-lesion, microglia have migrated into the outer retina, many appearing amoeboid and displaying fewer laterally branching projections. Despite the deep microglial response, neutrophils stay within the inner retina and are not found in the avascular outer retinal layers. Scale bar = 40 µm.
Figure 9—figure supplement 2

Microglial photoreceptor (PR) phagosomes in the outer retina assessed with ex vivo confocal imaging.
(A) En-face images of outer stratum of outer nuclear layer (ONL) in a DAPI-stained CX3CR1-GFP mouse 3 days post-laser-injury (top row). Microglia have infiltrated deep into the ONL and several PR phagosomes were identified. White arrows indicate locations for a single microglia (i), PR (ii), and PR phagosome (iii). These locations were expanded and displayed below. Microglia exhibited a heterogeneous nuclear staining pattern while PR nuclei exhibited homogenous DAPI fluorescence pattern. PRs displayed this pattern regardless of whether they were within a microglial phagosome or not. Top scale bar = 20 µm, bottom scale bar = 2 µm. (B) A finely sliced (0.1 µm step size) outer retinal z-stack of DAPI-stained CX3CR1-GFP retina was used to quantify the average nuclear volume for infiltrated microglia (n=14 nuclei) and PRs (n=20 nuclei) for the same lesion site presented in (A). On average, microglia had a statistically significant (p<0.001, student’s paired two-tailed t-test) nuclear volume that was >3× that of PRs. These measurements allowed us to discriminate microglial somas from PR phagosomes. Error bars display mean ± 1 SD. (C) Cross-sections of DAPI-stained outer retina in CX3CR1-GFP mice for 1, 3, and 7 days post-laser injury (n=3 mice). Three representative planes (X–Z) through the lesion are displayed for each time point. Microglia form PR phagosomes within the ONL, and microglial processes were seen extended into the PR inner/outer segment layer. Arrows label various morphological features seen at lesion sites: microglial somas (yellow), diving microglial process (violet), PR phagosome (red), and microglial inner/outer segment process (cyan). Scale bar = 20 µm.
Figure 10
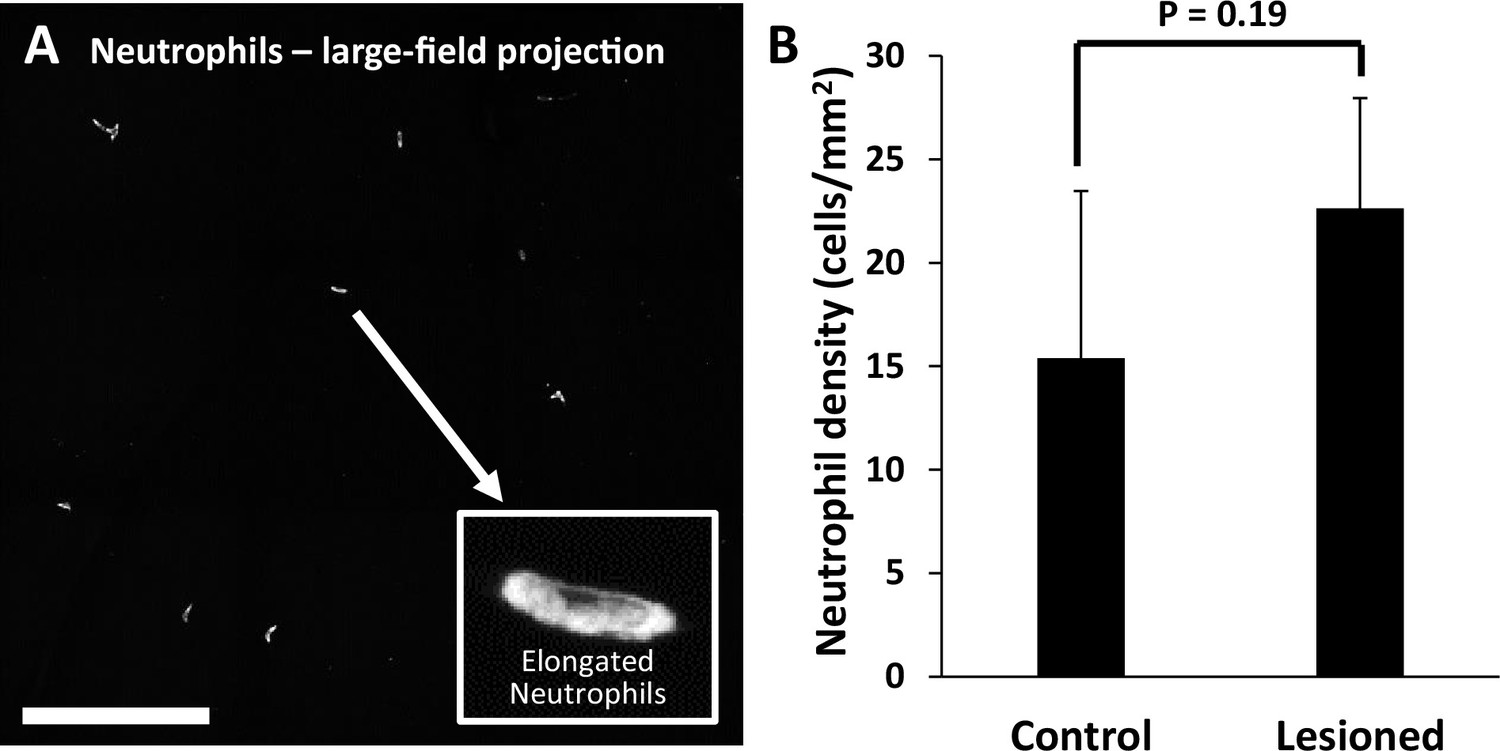
Quantification of neutrophils in laser-damaged retinas assessed with ex vivo confocal microscopy over a wide field.
(A) Representative image (maximum intensity projection) displays neutrophils quantified using large-field (796×796 µm) z-stacks for control or 1 day after injury time points. In both control and laser-injured retinas, neutrophils were sparse and confined to locations within capillaries, suggesting they were the native fraction of circulating neutrophils at time of death. Inset displays an expanded image of a single neutrophil. Scale bar = 200 µm. (B) Neutrophils quantified and displayed as the number of neutrophils per retinal area. The difference in the number of neutrophils in control (n=4 locations, 2 mice) vs lesioned (n=4 locations, 2 mice) retinas was not statistically significant (p=0.19, student’s paired two-tailed t-test). Error bars display mean ± 1 SD.
Videos
Video 1
Rotating 3D cubes of outer retinal nuclei and microglia after focal laser injury.
Outer retinal Z-stacks of DAPI-stained whole-mount CX3CR1-GFP retinal tissue were imaged for control, 1-, 3-, 7-day and 2-month time points (n=5 mice). DAPI+ microglia composite cubes are displayed above and microglia-only cubes are displayed below. By 1 day, microglia send projections into the outer nuclear layer (ONL); by 3 and 7 days, microglial somas have migrated into the ONL. Microglia within the ONL are less ramified compared to the baseline condition. By 2 months, microglia are found back within the outer plexiform layer, exhibiting lateral projections, similar to baseline. Scale bar = 40 µm.
Video 2
Rotating 3D cubes of single neutrophils after laser injury or EIU.
Ex vivo confocal z-stacks (0.1 µm steps) allowed detailed visualization of single neutrophils 1 day after laser injury or 1 day after intravitreal lipopolysaccharide (LPS) injection. After laser injury, neutrophils maintain a tubular, pill-shaped morphology (left). Occasionally, they would come to rest at capillary branch points (middle). In the EIU model, neutrophils extravasate into the retinal parenchyma and exhibit more spheroid morphology (right). We did not observe neutrophils to exhibit the extravasated morphology in response to laser injury.
Tables
Key resources table
| Reagent type (species) or resource | Designation | Source or reference | Identifiers | Additional information |
|---|---|---|---|---|
| Strain, strain background (Mus musculus) | C57BL/6J | The Jackson Laboratory | Strain #: 000664 RRID:IMSR_JAX:000664 | |
| Strain, strain background (M. musculus) | CX3CR1-GFP | The Jackson Laboratory | Strain #: 005582 RRID:IMSR_JAX:005582 | |
| Strain, strain background (M. musculus) | Catchup | Laboratory of M. Gunzer | C57BL/6-Ly6g(tm2621CretdTomato)Arte | Hasenberg et al., 2015 |
| Antibody | Ly-6G-647 | BioLegend | Cat#: 127610; RRID:AB_1134159 | IF (1:200) |
| Other | DAPI stain | Cell Signaling Technology | Cat#: 4083 | 1:500 of 10 mg/ml stock |
| Chemical compound, drug | Lipopolysaccharide (LPS) | Sigma-Aldrich | Cat#: L4391 | 1 ng (1 µl) delivered intravitreally |
| Software, algorithm | Cell Counter plugin | ImageJ FIJI | Cell Counter plugin | Author: Kurt De Vos, ImageJ version 1.53q |
| Other | AK-FLUOR Fluorescein Sodium 10% | McKesson | Cat#: 1120803 | ~100 µl injection of 10mg/ml stock |
Additional files
Download links
A two-part list of links to download the article, or parts of the article, in various formats.
Downloads (link to download the article as PDF)
Open citations (links to open the citations from this article in various online reference manager services)
Cite this article (links to download the citations from this article in formats compatible with various reference manager tools)
Photoreceptor loss does not recruit neutrophils despite strong microglial activation
eLife 13:RP98662.
https://doi.org/10.7554/eLife.98662.4


