Long non-coding RNA Malat1 fine-tunes bone homeostasis and repair by orchestrating cellular crosstalk and β-catenin-OPG/Jagged1 pathway
- Arthritis and Tissue Degeneration Program and David Z. Rosensweig Genomics Research Center, Hospital for Special Surgery, United States
- Department of Medicine, Weill Cornell Medical College, United States
- Research Institute, Hospital for Special Surgery, United States
- Department of Orthopaedic Surgery, Weill Cornell Medicine, United States
- Department of Cell and Developmental Biology, Cancer center at Illinois, University of Illinois at Urbana-Champaign, United States
- Institute for Tumor Biology and Experimental Therapy, Germany
- RNA Biology Laboratory, Faculty of Pharmaceutical Sciences, Hokkaido University, Japan
- Orthopaedic Trauma Service, Hospital for Special Surgery & NewYork-Presbyterian Hospital, United States
- Graduate Program in Cell and Development Biology, Weill Cornell Graduate School of Medical Sciences, United States
Figures
Figure 1 with 1 supplement
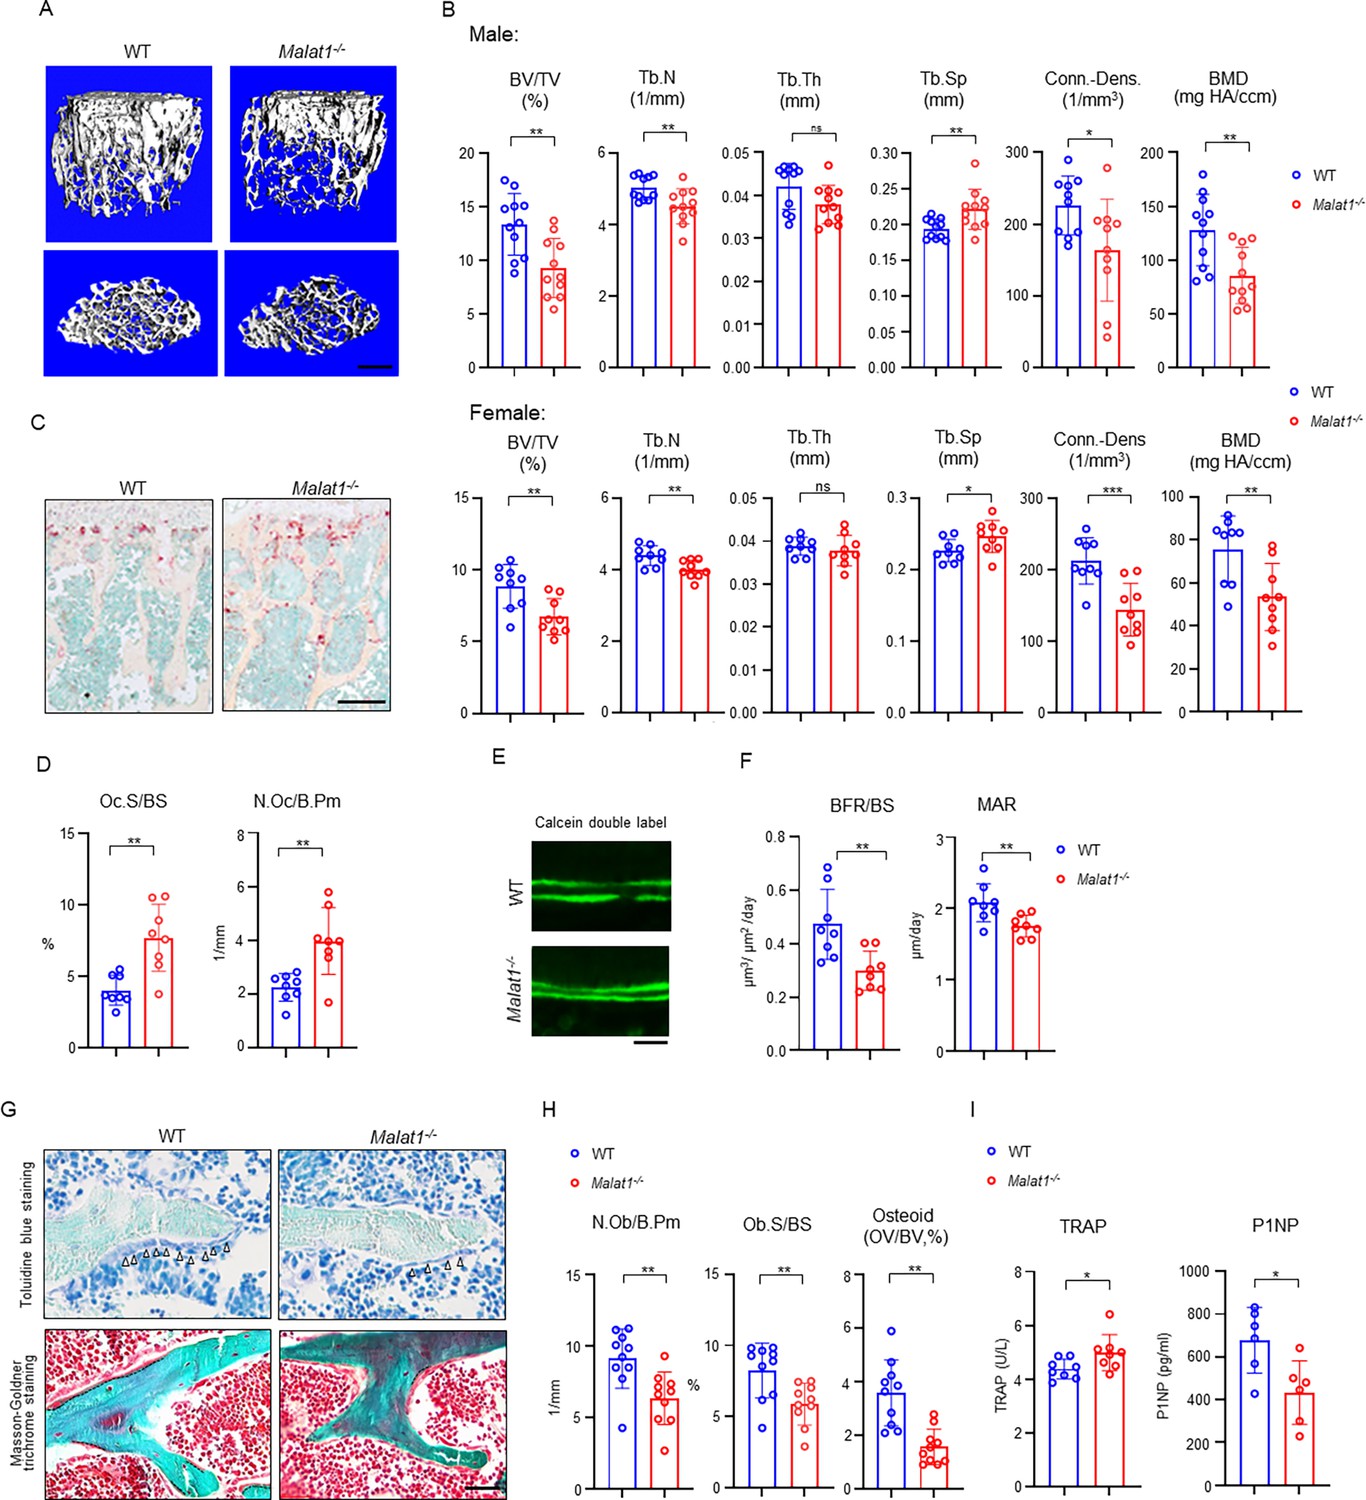
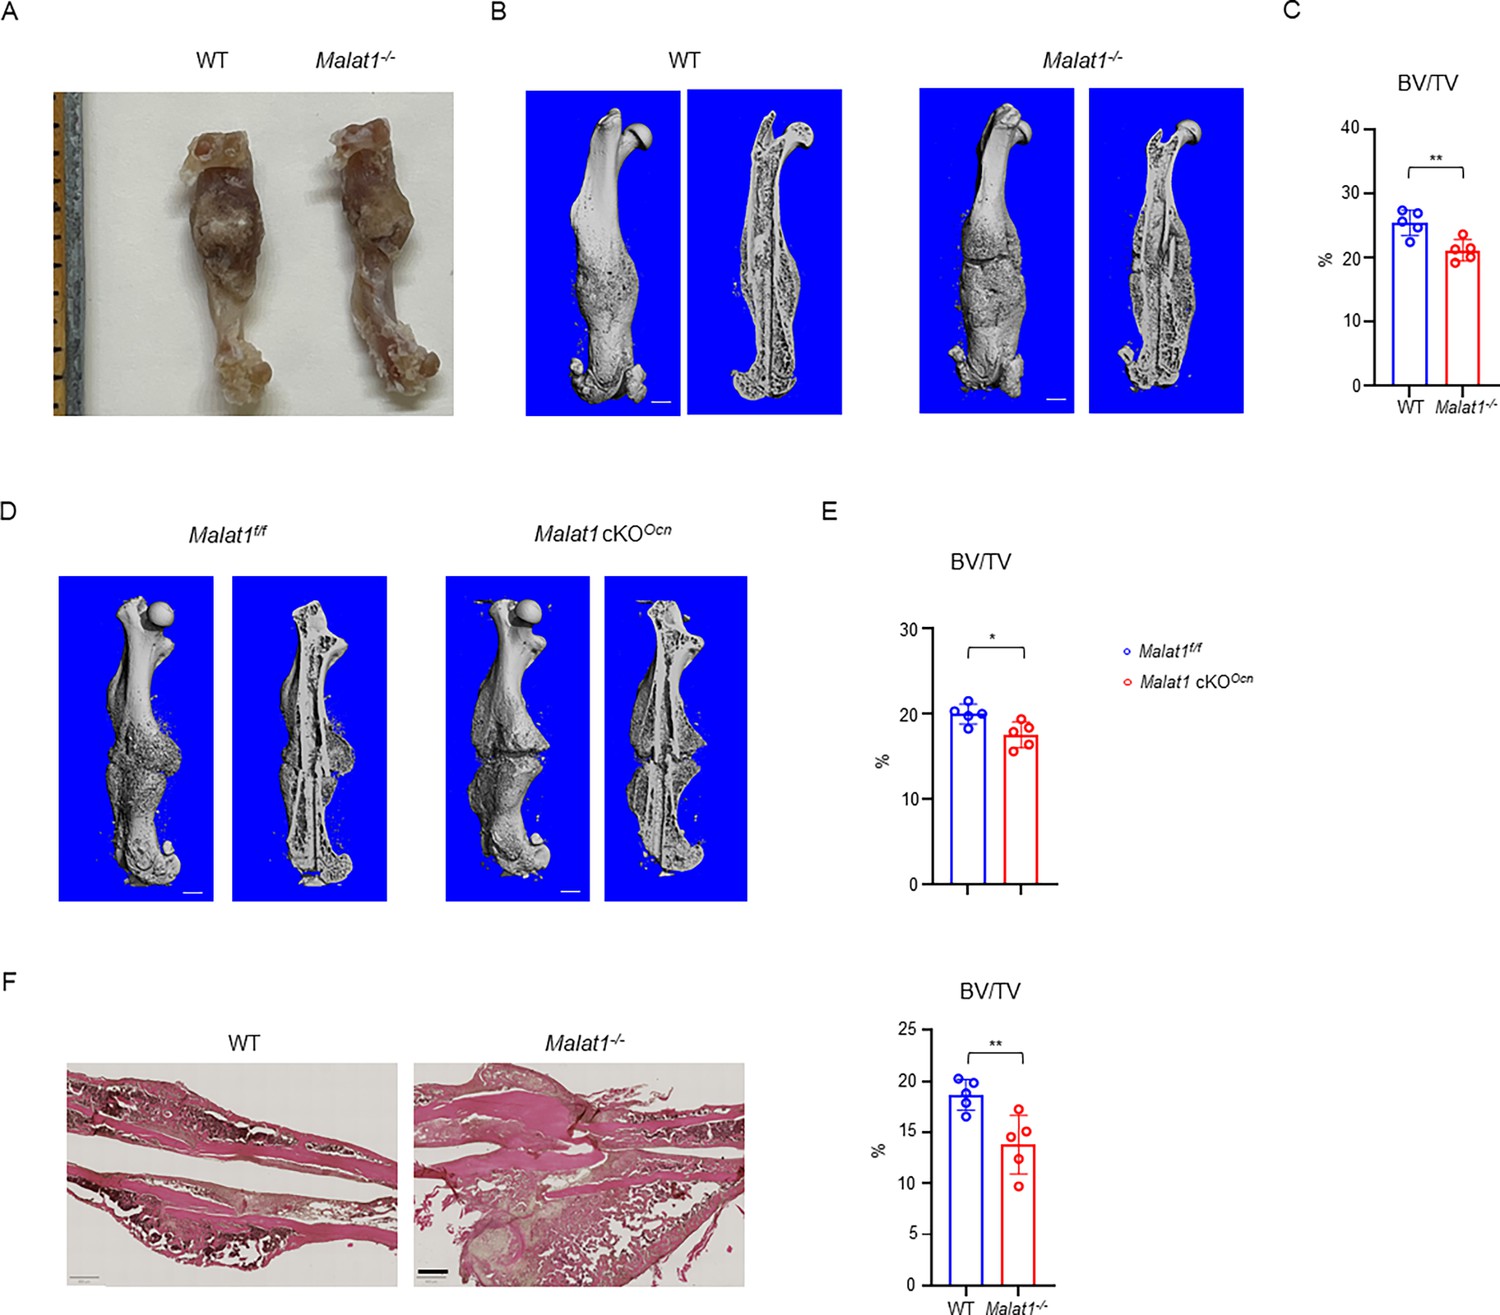
Malat1 deficiency disrupts bone remodeling and results in osteoporosis through reduced osteoblastic bone formation and increased osteoclastic bone resorption.
(A) μCT images and (B) bone morphometric analysis of trabecular bone of the distal femurs isolated from the 12-week-old-male (n=11, upper panel) and female (n=9, lower panel) WT and Malat1-/- littermate mice. BV/TV, bone volume per tissue volume; BMD, bone mineral density; Conn-Dens., connectivity density; Tb.N, trabecular number; Tb.Th, trabecular thickness; Tb.Sp, trabecular separation. (C) TRAP staining and (D) histomorphometric analysis of histological sections obtained from of 12-week-old male WT and Malat1-/- littermate mice (n = 8/group). Oc.S/BS, osteoclast surface per bone surface; N.Oc/B.Pm, number of osteoclasts per bone perimeter. (E) Images of calcein double labelling of the tibia of 12-week-old male WT and Malat1-/- littermate mice. (F) Dynamic histomorphometric analysis of mineral apposition rate (MAR) and bone formation rate per bone surface (BFR/BS) after calcein double labeling of the tibiae of WT and Malat1-/- littermate male mice (n = 8/group). (G) Representative images of Toluidine blue staining (top) and Masson-Goldner staining (bottom) of femur from 12-week-old-male WT and Malat1-/- littermate mice. For Toluidine blue staining, the bones show green and osteoblasts are indicated by arrow heads. For Masson-Goldner staining, osteoid matrix appears dark orange on the surface of the bone beneath the osteoblasts (indicated by dash lines), osteoblasts are stained orange lining on the bone surface, and bone marrow cells appear red in the photograph. (H) Bone morphometric analysis of osteoblast surface per bone surface (Ob.S/BS), osteoblast number per bone perimeter (N.Ob/B.Pm) and osteoid matrix volume per bone volume (OV/BV) of the femur of WT and Malat1-/- littermate male mice (n = 10/group). (I) Serum TRAP and P1NP levels of 12-week-old male mice. (B, D, F, H, I) *p < 0.05; **p < 0.01; ns, not statistically significant by Student’s t test. Data are mean ± SD. Scale bars: A 400 µm; C 200 µm; E, G 50 µm.
-
Figure 1—source data 1
Malat1 deficiency disrupts bone remodeling and results in osteoporosis through reduced osteoblastic bone formation and increased osteoclastic bone resorption.
- https://cdn.elifesciences.org/articles/98900/elife-98900-fig1-data1-v1.xlsx
Figure 1—figure supplement 1
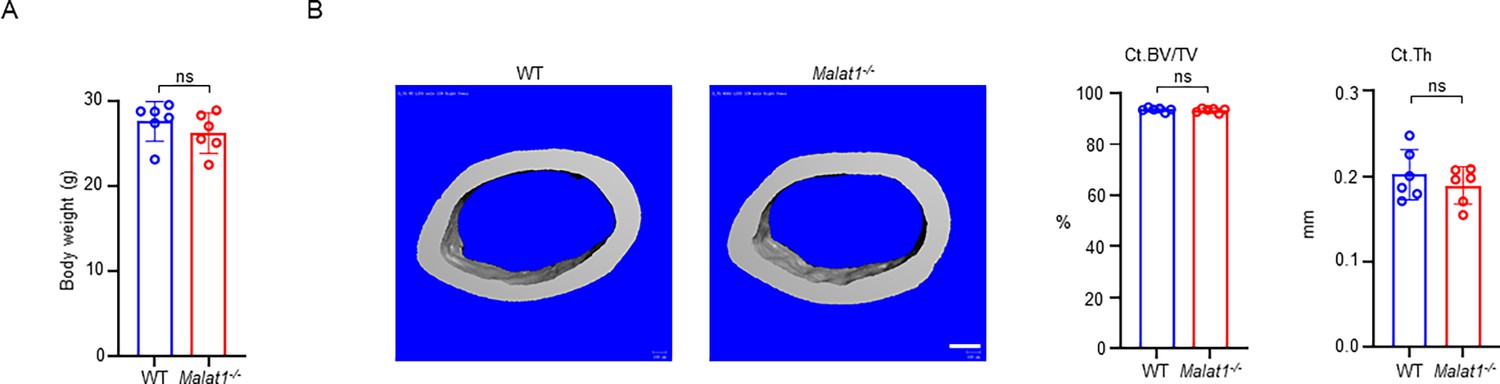
Malat1 deficiency does not affect mouse body weight and cortical bone.
(A) Body weight of 12-week-old male WT and Malat1-/- littermates. n=6 / group. (B) μCT images and bone morphometric analysis of cortical bone of the mid-shaft femurs isolated from 12-week-old male WT and Malat1-/- littermates. n = 6/group.
-
Figure 1—figure supplement 1—source data 1
Malat1 deficiency does not affect mouse body weight and cortical bone.
- https://cdn.elifesciences.org/articles/98900/elife-98900-fig1-figsupp1-data1-v1.xlsx
Figure 2 with 1 supplement
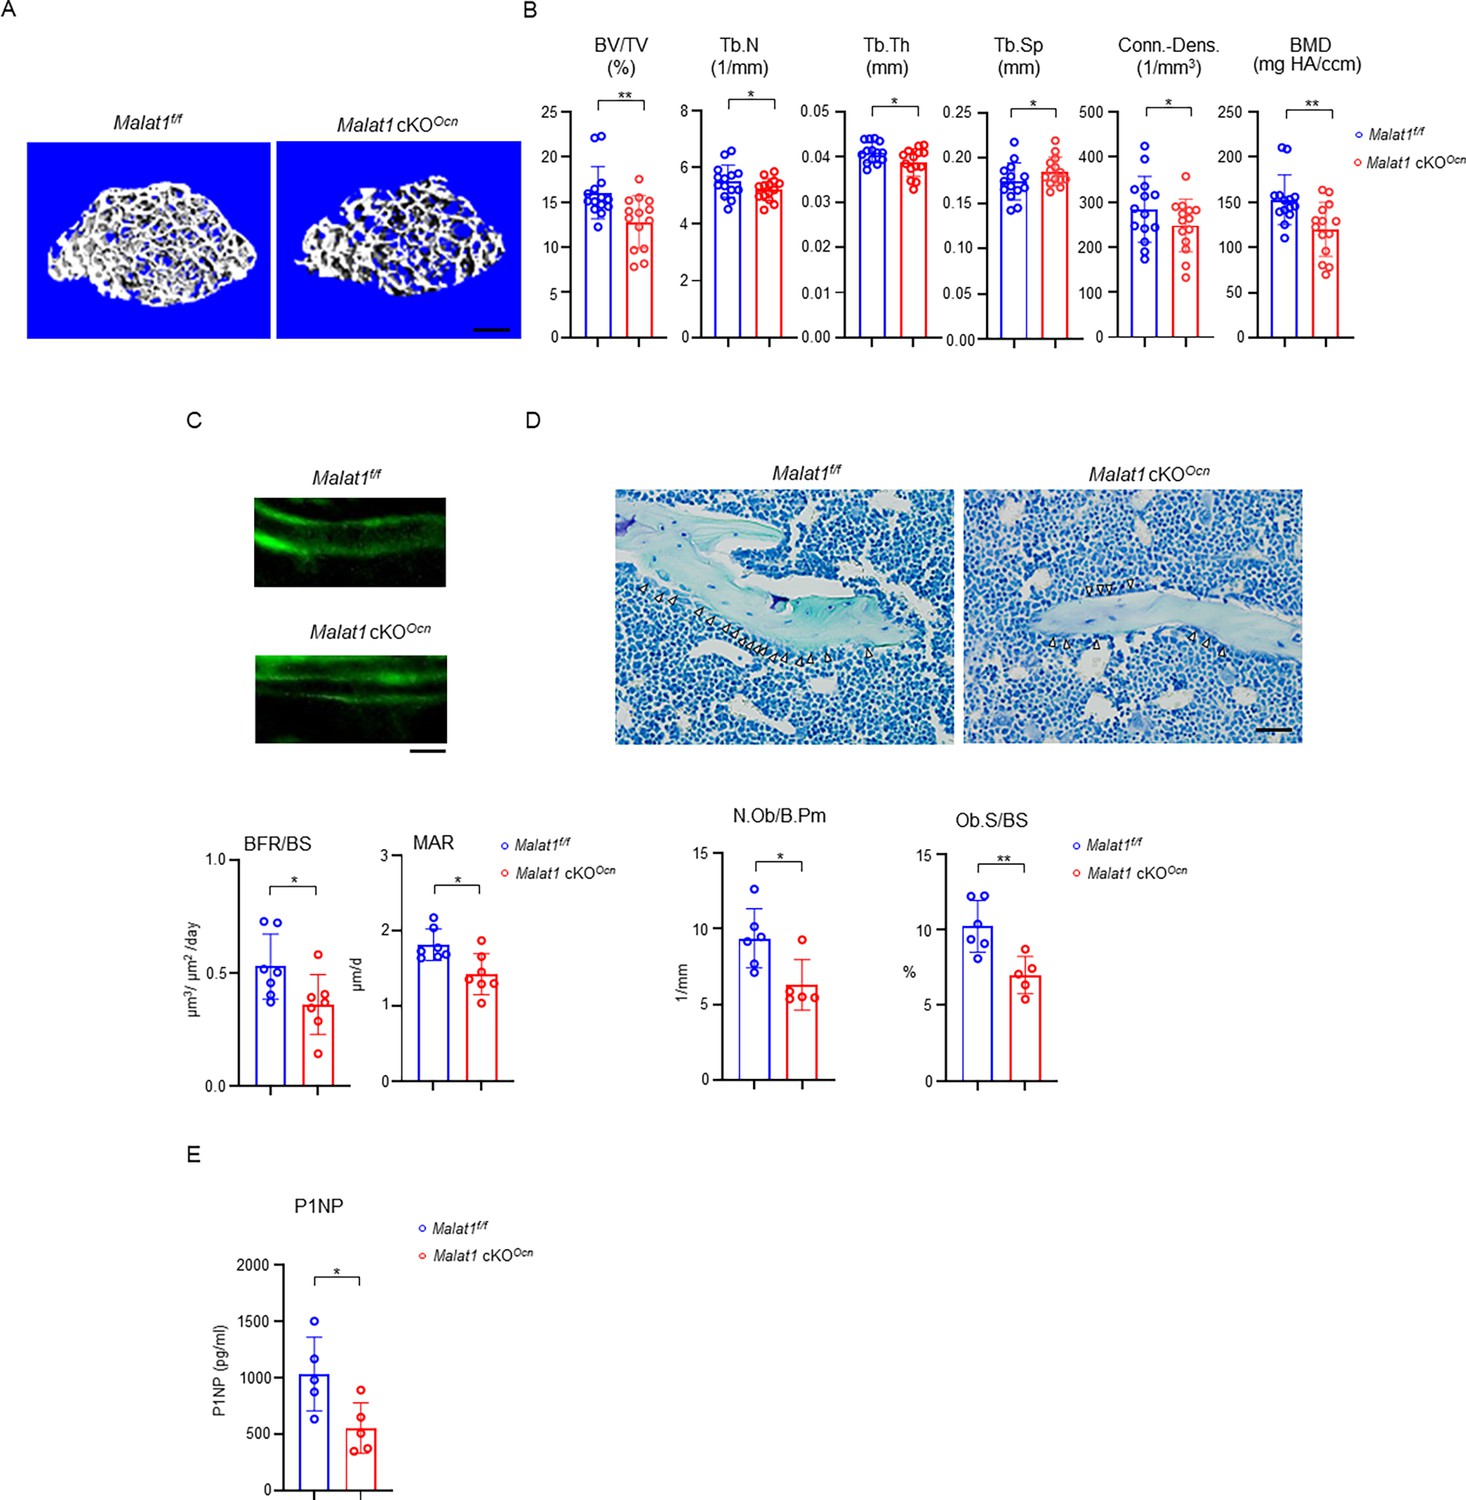
Specific deletion of Malat1 in osteoblasts leads to reduced bone mass and defects in bone formation.
(A) μCT images and (B) bone morphometric analysis of trabecular bone of the distal femurs isolated from the 12-week-old male Malat1f/f and Malat1 cKOOcn littermate mice (n = 14/group). (C) Images of calcein double labelling (top) of the tibia of 12-week-old male Malat1f/f and Malat1 cKOOcn littermate mice. Dynamic histomorphometric analysis (bottom) of mineral apposition rate (MAR) and bone formation rate per bone surface (BFR/BS) after calcein double labeling of the tibiae of Malat1f/f and Malat1 cKOOcn littermate male mice (n = 7/group). (D) Representative images of Toluidine blue staining (top) of femur from 12-week-old male Malat1f/f and Malat1 cKOOcn littermate mice. For Toluidine blue staining, the bones show green and osteoblasts are indicated by arrow heads. Bone morphometric analysis (bottom) of osteoblast surface per bone surface (Ob.S/BS) and osteoblast number per bone perimeter (N.Ob/B.Pm) of the femur of 12-week-old male Malat1f/f and Malat1 cKOOcn littermate mice. (E) Serum P1NP levels of 12-week-old male mice. (B, C, D, E) *p < 0.05; **p < 0.01 by Student’s t test; ns, not statistically significant. Data are mean ± SD. Scale bars: A 200 µm; C, D 50 µm.
-
Figure 2—source data 1
Specific deletion of Malat1 in osteoblasts leads to reduced bone mass and defects in bone formation.
- https://cdn.elifesciences.org/articles/98900/elife-98900-fig2-data1-v1.xlsx
Figure 2—figure supplement 1
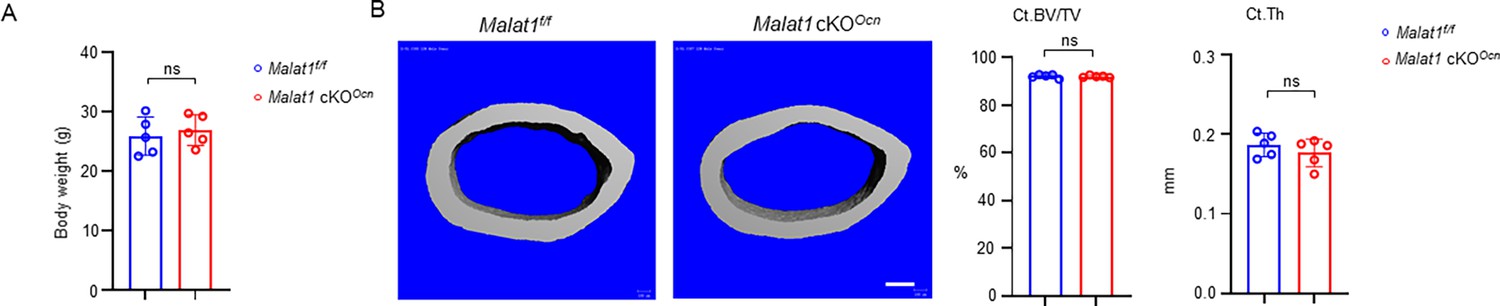
Malat1 deficiency in Malat1ΔOcn mice does not affect body weight and cortical bone.
(A) Body weight of 12-week-old male Malat1f/f and Malat1 cKOOcn littermate mice. n=5/group. (B) μCT images and bone morphometric analysis of cortical bone of the mid-shaft femurs isolated from 12-week-old male Malat1f/f and Malat1 cKOOcn littermates. n = 5/group.
-
Figure 2—figure supplement 1—source data 1
Malat1 deficiency in Malat1 cKOOcn mice does not affect body weight and cortical bone.
- https://cdn.elifesciences.org/articles/98900/elife-98900-fig2-figsupp1-data1-v1.xlsx
Figure 3 with 2 supplements
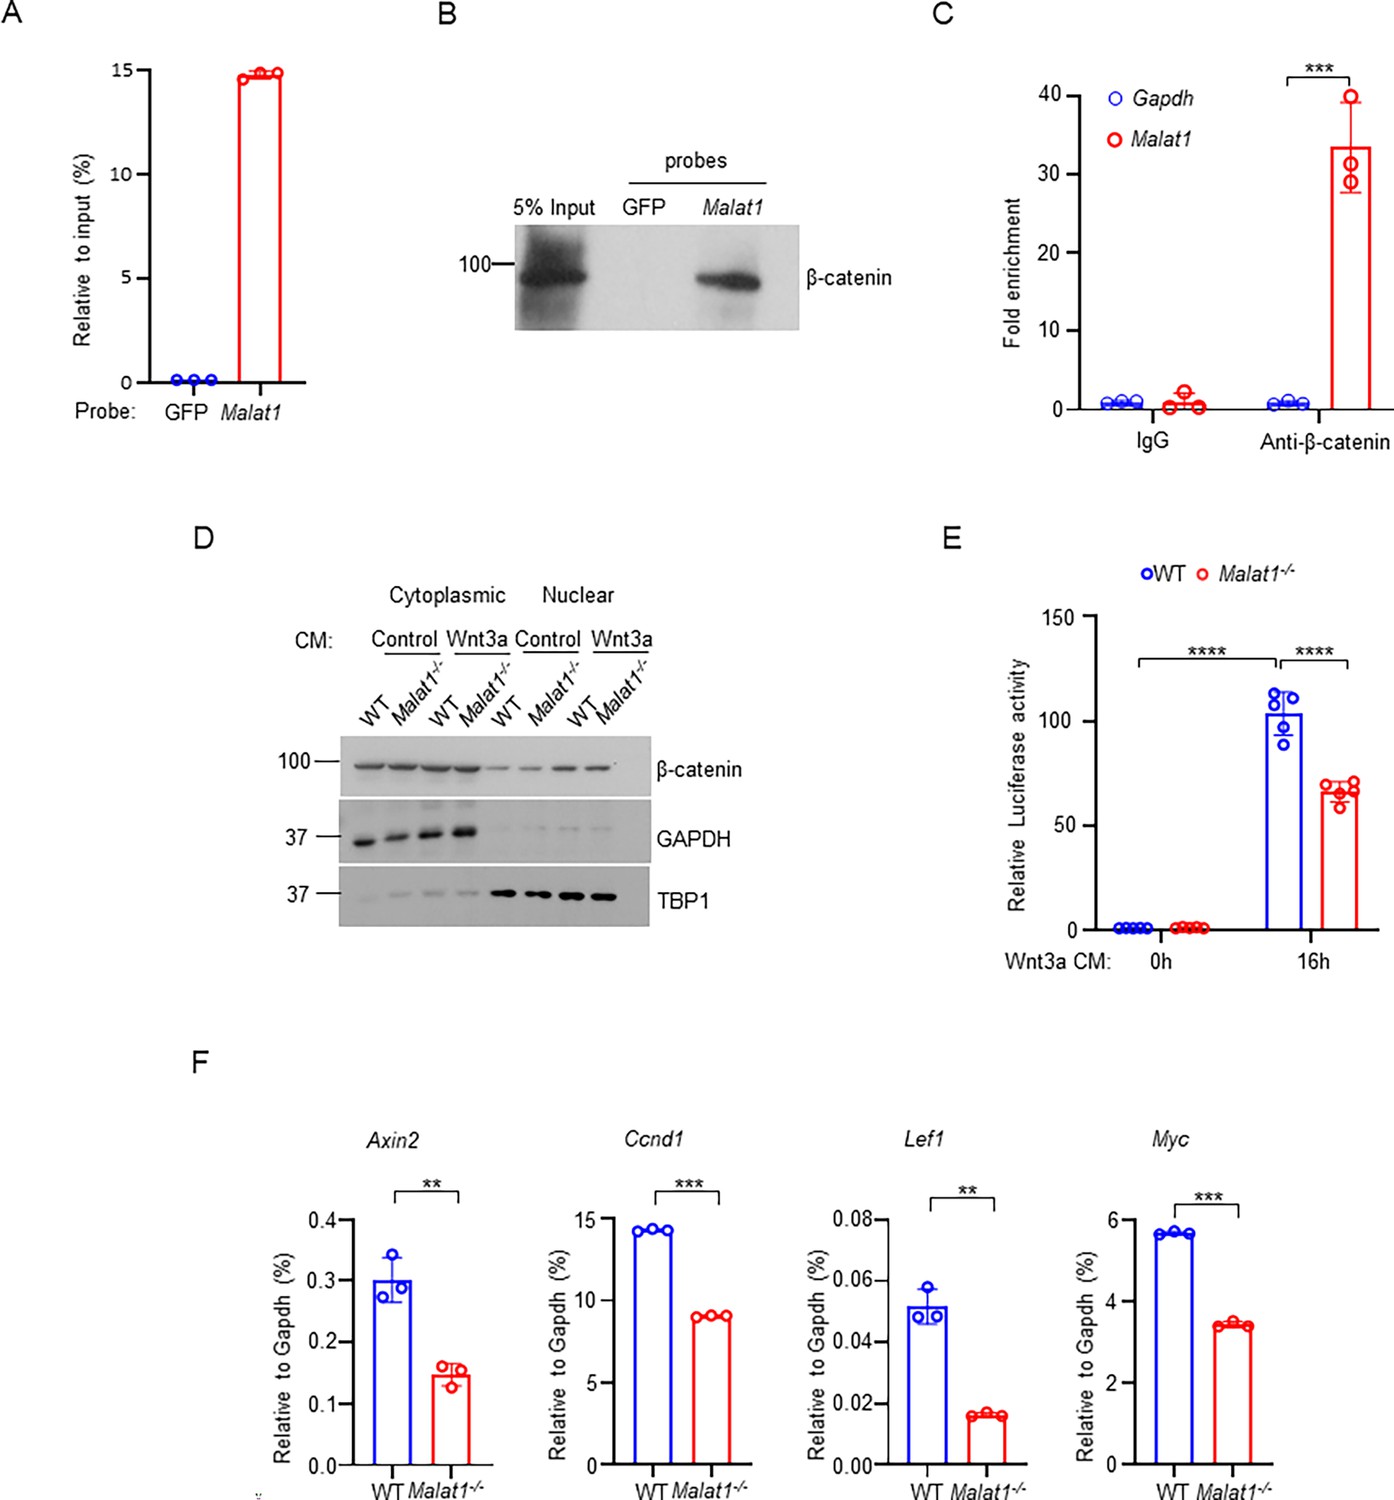
Malat1 binds to β-catenin to positively regulate canonical Wnt/ β-catenin signaling pathway.
(A) ChIRP analysis of the specificity and efficiency of the Malat1 probe. Mouse Malat1 or the control GFP probes were used to pull down endogenous Malat1 from MC3T3-E1 cells, followed by qPCR quantification of Malat1. (B) ChIRP analysis of the Malat1 binding to β-catenin. Mouse Malat1-specific probes were used to pull down the endogenous Malat1 in the MC3T3-E1 cells, followed by immunoblotting with anti-β-catenin antibody. (C) RIP assay of β-catenin binding to Malat1. Endogenous β-catenin was immunoprecipitated from MC3T3-E1 cells, and the β-catenin-bound Malat1 was quantitated by qPCR. Rabbit IgG was used as a negative control IP antibody. (D) Immunoblot analysis of the nuclear and cytoplasmic localization of β-catenin in calvarial osteoblasts that were serum starved for 16 hr, followed by treatment with 50% Wnt3a- or the control L- conditional medium for 1 hr. TBP1 and GAPDH were measured as loading controls for nuclear and cytoplasmic fractions, respectively. Experiments in a-d were replicated three times. (E) Luciferase reporter assay of the Wnt/β-catenin signaling activity measured from the indicated calvarial osteoblasts transfected with the M50 Super 8 x TOPFlash reporter plasmid and pRL-Tk control plasmid for 48 hr, followed by treatment with or without 20% Wnt3a conditional medium for 16 hr (n = 5). (F) qPCR analysis of mRNA expression of β-catenin target genes in calvarial osteoblasts in the osteogenic medium (α-MEM with 10% FBS supplemented with 10 mM β-glycerophosphate and 100 ug/ml ascorbic acid) for 7 days (n=3). Data are mean ± SD. (C, E) ***p < 0.001; ****p < 0.0001 by two-way ANOVA with Bonferroni’s multiple comparisons test. (F), **p < 0.01; ***p < 0.001 by Student’s t test.
-
Figure 3—source data 1
Malat1 binds to β-catenin to positively regulate canonical Wnt/ β-catenin signaling pathway.
- https://cdn.elifesciences.org/articles/98900/elife-98900-fig3-data1-v1.xlsx
-
Figure 3—source data 2
PDF file containing original western blots for Figure 3B and D, indicating the relevant bands.
- https://cdn.elifesciences.org/articles/98900/elife-98900-fig3-data2-v1.pdf
-
Figure 3—source data 3
Original files for western blot analysis displayed in Figure 3B and D.
- https://cdn.elifesciences.org/articles/98900/elife-98900-fig3-data3-v1.zip
Figure 3—figure supplement 1
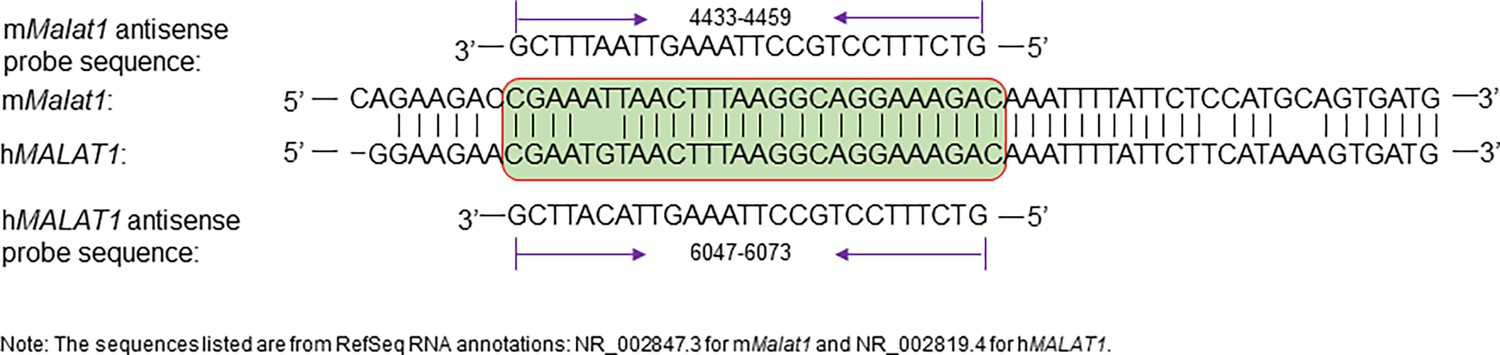
Murine and human Malat1 probe sequences and their complementary Malat1 sequences.
Figure 3—figure supplement 2
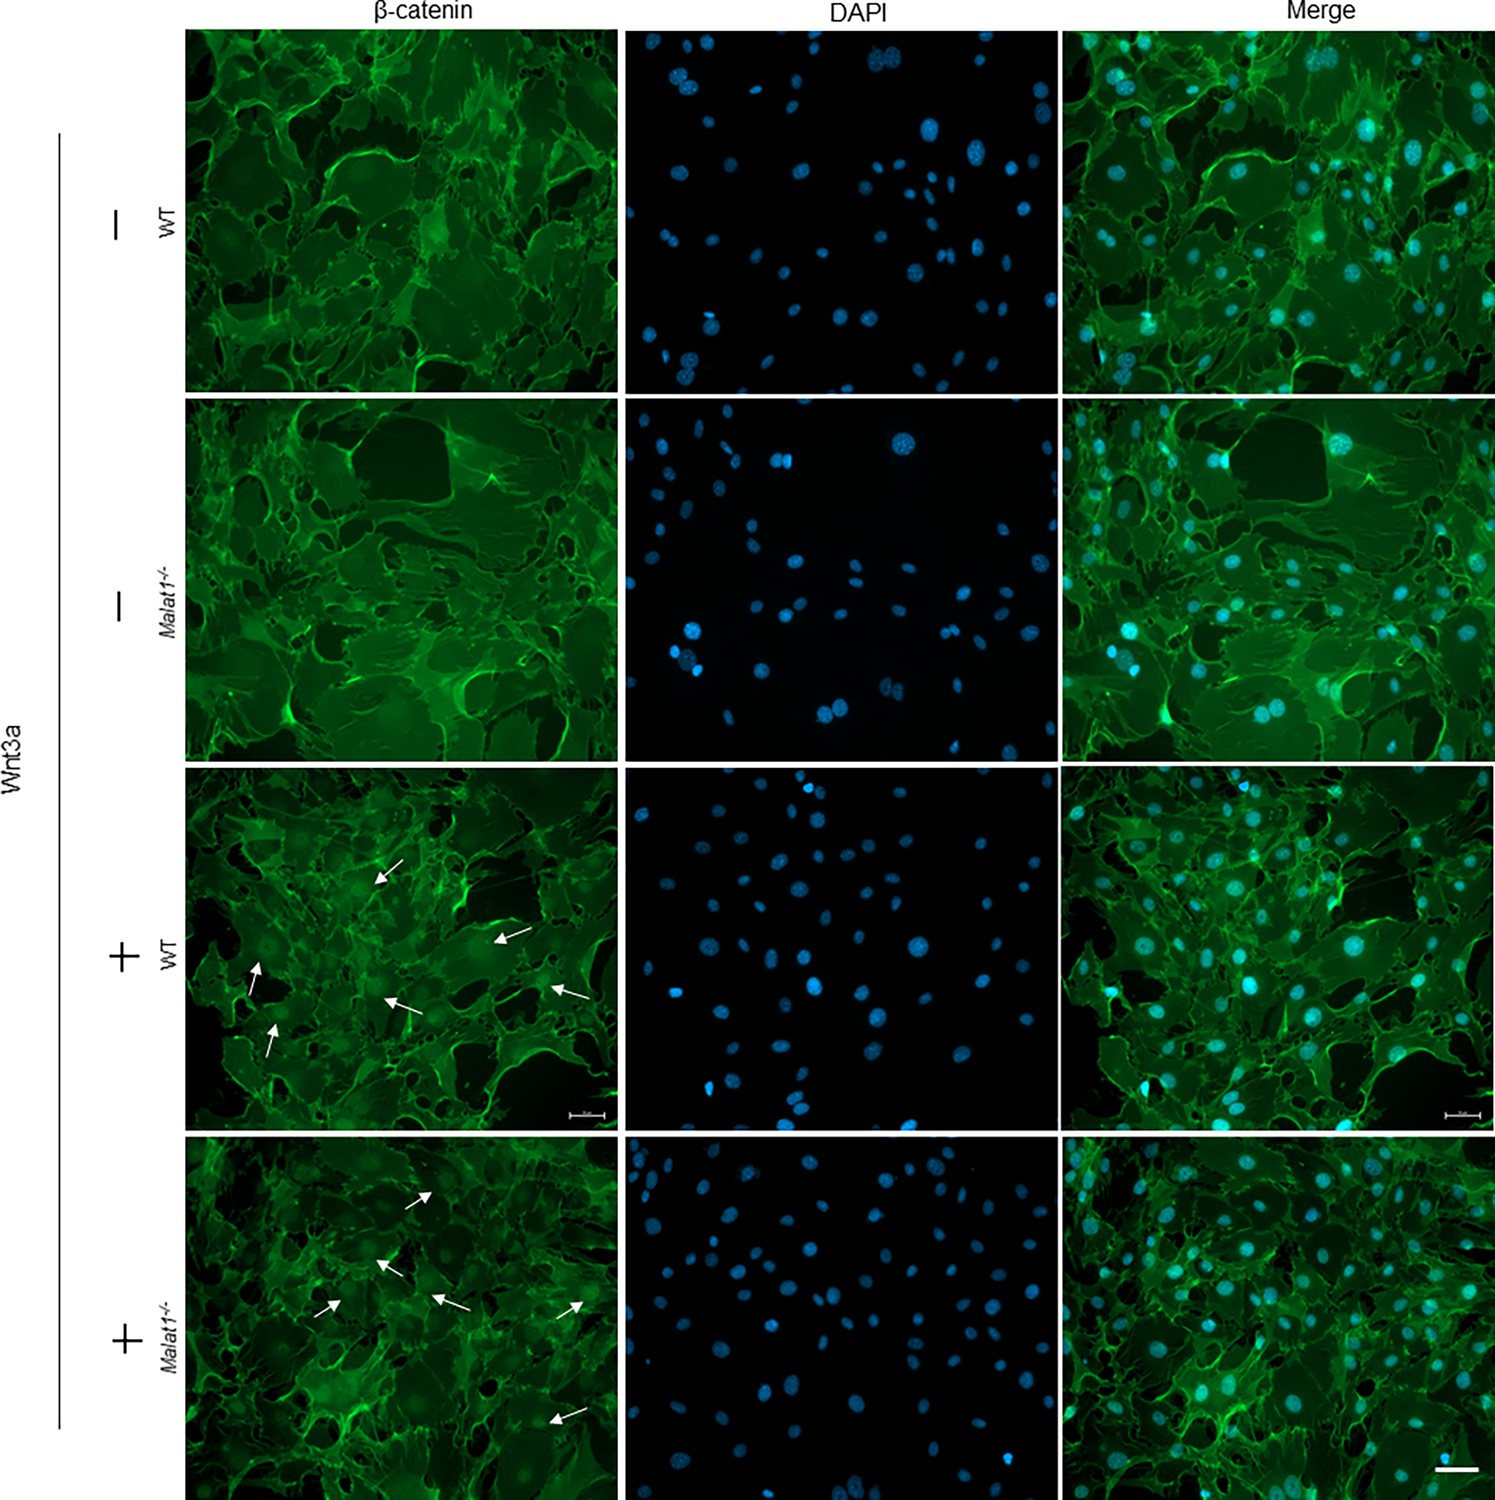
Immunofluorescence staining of β-catenin.
Immunofluorescence staining of β-catenin (green) translocation into nuclei with or without Wnt3a treatment for 1 hr in calvarial osteoblasts isolated from the WT and Malat1-/- mice. Arrows: nuclear β-catenin. Scale bar: 50 µm.
Figure 4
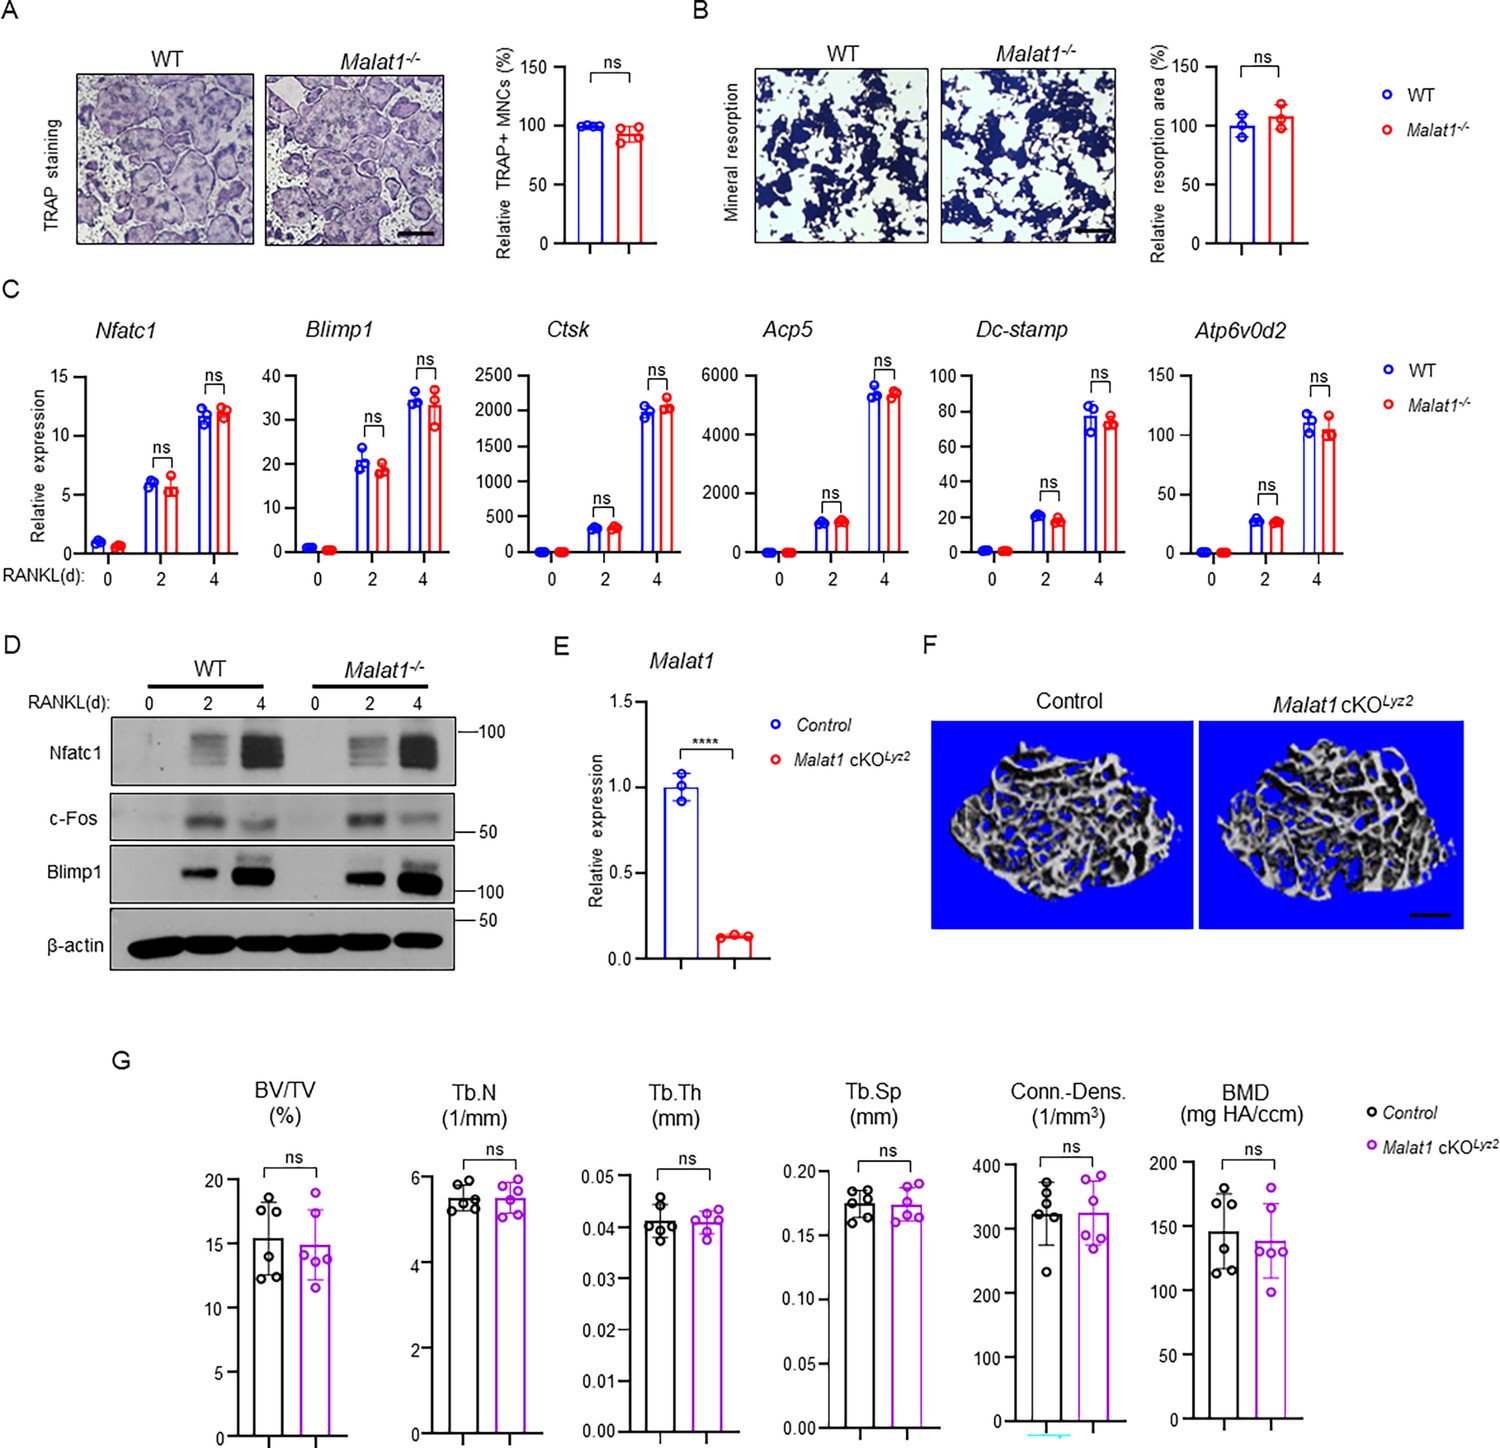
Malat1 is not an intrinsic regulator of osteoclast differentiation.
(A) Osteoclast differentiation using BMMs obtained from WT and Malat1-/- mice stimulated with RANKL for 3 days. TRAP staining (left panel) was performed and the area of TRAP-positive MNCs (≥3 nuclei/cell) per well relative to the WT control was calculated (right panel). (n =4/group). (B) Von Kossa staining (left) and the resorption area (%) (right) of the osteoclast cultures of WT and Malat1-/- BMMs stimulated with RANKL for 4 days. (n = 3/group). Mineralized area: black; resorption area: white. (C) qPCR analysis of mRNA expression of the indicated genes during osteoclastogenesis with or without RANKL for 2 days and 4 days. (D) Immunoblot analysis of Nfatc1, Blimp1 and c-Fos expression during osteoclastogenesis with or without RANKL for 2 days and 4 days. β-actin was used as a loading control. (E–G) Malat1 deletion efficiency (E) and μCT images (F) and bone morphometric analysis (G) of trabecular bone of the distal femurs isolated from the indicated 12-week-old male Control and Malat1 cKOLyz2 littermate mice (n = 6/group). Data are mean ± SD. A, B, F ns, not statistically significant by Student’s t test; C, by two-way ANOVA with Bonferroni’s multiple comparisons test. Scale bars: A,B 100 µm; E 400 µm.
-
Figure 4—source data 1
Malat1 is not an intrinsic regulator of osteoclast differentiation.
- https://cdn.elifesciences.org/articles/98900/elife-98900-fig4-data1-v1.xlsx
-
Figure 4—source data 2
PDF file containing original western blots for Figure 4D, indicating the relevant bands.
- https://cdn.elifesciences.org/articles/98900/elife-98900-fig4-data2-v1.pdf
-
Figure 4—source data 3
Original files for western blot analysis displayed in Figure 4D.
- https://cdn.elifesciences.org/articles/98900/elife-98900-fig4-data3-v1.zip
Figure 5
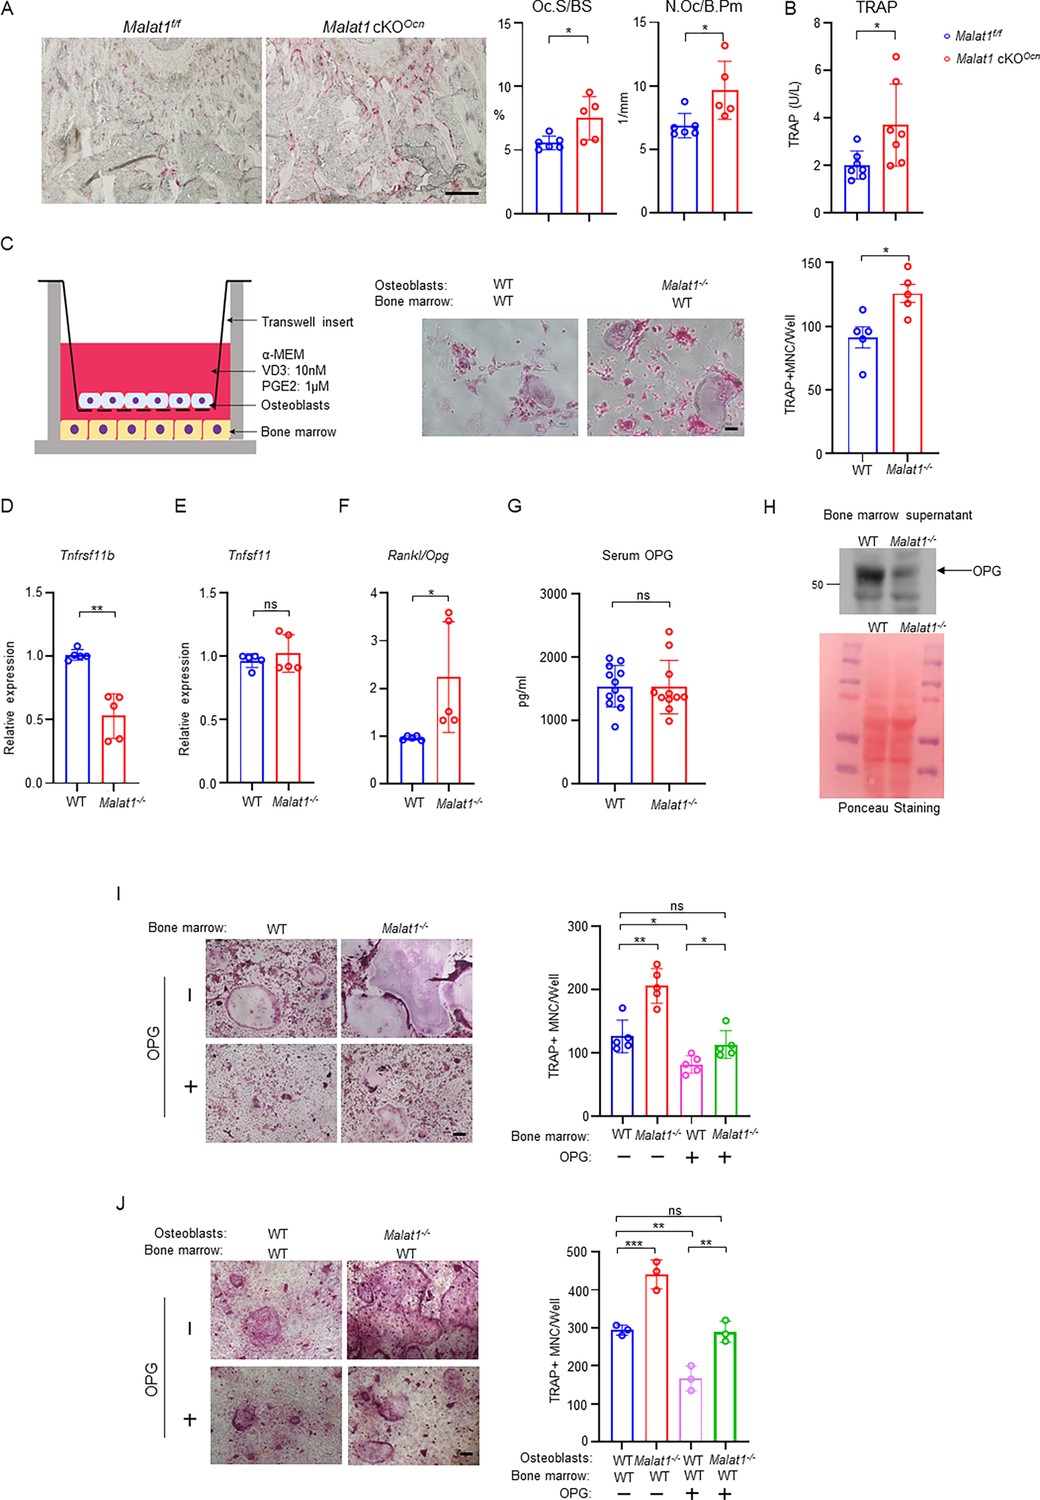
Malat1 promotes OPG expression in osteoblasts to suppress osteoclastogenesis.
(A) TRAP staining (left) and histomorphometric analysis (right) of histological sections obtained from the metaphysis region of distal femurs from the 12-week-old male Malat1f/f and Malat1 cKOOcn littermate mice. n = 5–6/group. Oc.S/BS, osteoclast surface per bone surface; N.Oc/B.Pm, number of osteoclasts per bone perimeter. (B) Serum TRAP levels of 12-week-old male mice. (C) A schematic diagram (left) of the co-culture system with primary osteoblasts and bone marrow cells in trans-wells. TRAP staining (middle) was performed and the number of TRAP-positive MNCs (≥3 nuclei/cell) per well was calculated (right panel). (n =5 replicates from two experiments). (D–E) qPCR analysis of mRNA expression of Tnfrsf11b (encoding OPG) (D) and Tnfsf11 (encoding RANKL) (E) in calvarial osteoblasts (n =5/group). (F) The expression ratio of Rankl/Opg in calvarial osteoblasts. (G) ELISA analysis of OPG levels in the serum from the 12-week-old male WT and Malat1-/- mice (n = 11–12/group). (H) Immunoblot analysis of OPG expression in the bone marrow supernatant from the 12-week-old male WT and Malat1-/- mice. Bottom: Ponceau Staining of the gels showing an equivalent amount of total proteins loaded between samples. (I) Osteoclast differentiation of WT and Malat1-/- bone marrows stimulated with RANKL (40 ng/ml) and M-CSF C.M. (1:20) with or without OPG (2.5 ng/ml) for five days. TRAP staining (left panel) was performed and the number of TRAP-positive MNCs (≥3 nuclei/cell) per well was calculated (right panel). TRAP-positive cells appear red in the photographs. n = 5 replicates. (J) Osteoclast differentiation of the cocultures of the indicated calvarial osteoblasts and WT bone marrow cells treated with 10 nM of VitD3 and 1 μM of prostaglandinE2 for 6 days in the presence or absence of OPG (1 ng/ml). TRAP staining (left) was performed and the number of TRAP-positive MNCs (≥3 nuclei/cell) per well was calculated (right panel). n = 3 replicates. Data are mean ± SD. A-G, *p < 0.05; **p < 0.01 by Student’s t test; I,J *p < 0.05, **p < 0.01, ***p < 0.001 by two-way ANOVA with Bonferroni’s multiple comparisons test. ns, not statistically significant. Scale bars: A 200 µm; C,I,J 100 µm.
-
Figure 5—source data 1
Malat1 promotes OPG expression in osteoblasts to suppress osteoclastogenesis.
- https://cdn.elifesciences.org/articles/98900/elife-98900-fig5-data1-v1.xlsx
-
Figure 5—source data 2
PDF file containing original western blots for Figure 5H, indicating the relevant bands.
- https://cdn.elifesciences.org/articles/98900/elife-98900-fig5-data2-v1.pdf
-
Figure 5—source data 3
Original files for western blot analysis displayed in Figure 5H.
- https://cdn.elifesciences.org/articles/98900/elife-98900-fig5-data3-v1.zip
Figure 6 with 2 supplements
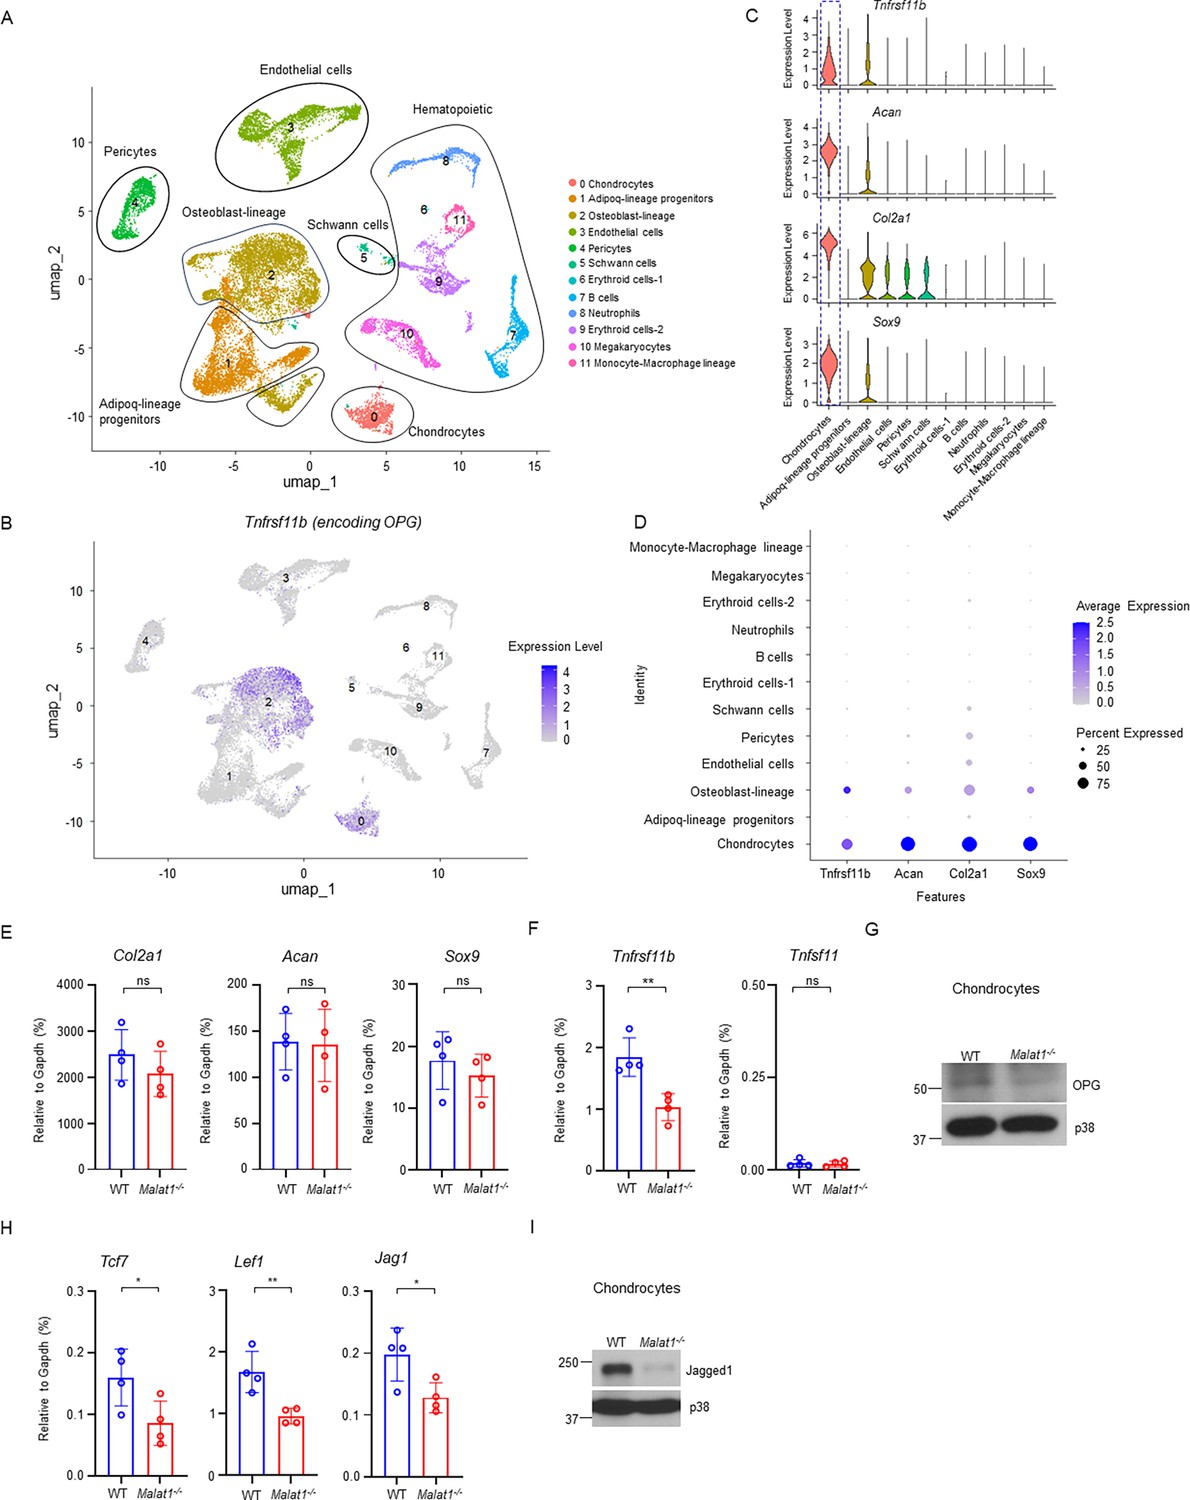
Malat1 enhances OPG and Jagged1 expression in chondrocytes.
(A) UMAP plot analysis of the bone and bone marrow datasets of scRNAseq based on GSE128423. (B) UMAP plot of the expression of Tnfrsf11b (encoding OPG) in bone and bone marrow cells. (C) Violin plots of the expression of Tnfrsf11b, Acan, Col2a1 and Sox9. (D) Dot plot of the expression of Tnfrsf11b, Acan, Col2a1 and Sox9 across the listed scRNAseq clusters. Cell clusters are listed on y-axis. Features are listed along the x-axis. Dot size reflects the percentage of cells in a cluster expressing each gene. Dot color reflects the scaled average gene expression level as indicated by the legend. (E, F, H) qPCR analysis of the indicated genes in primary chondrocytes. n = 4/group. (G, I) Immunoblot analysis of OPG and Jagged1 in the chondrocytes isolated from the WT and Malat1-/- mice. Data are mean ± SD. E,F,H, *p < 0.05; **p < 0.01 by Student’s t test; ns, not statistically significant.
-
Figure 6—source data 1
Malat1 enhances OPG and Jagged1 expression in chondrocytes.
- https://cdn.elifesciences.org/articles/98900/elife-98900-fig6-data1-v1.xlsx
-
Figure 6—source data 2
PDF file containing original western blots for Figure 6G and I, indicating the relevant bands.
- https://cdn.elifesciences.org/articles/98900/elife-98900-fig6-data2-v1.pdf
-
Figure 6—source data 3
Original files for western blot analysis displayed in Figure 6G and I.
- https://cdn.elifesciences.org/articles/98900/elife-98900-fig6-data3-v1.zip
Figure 6—figure supplement 1
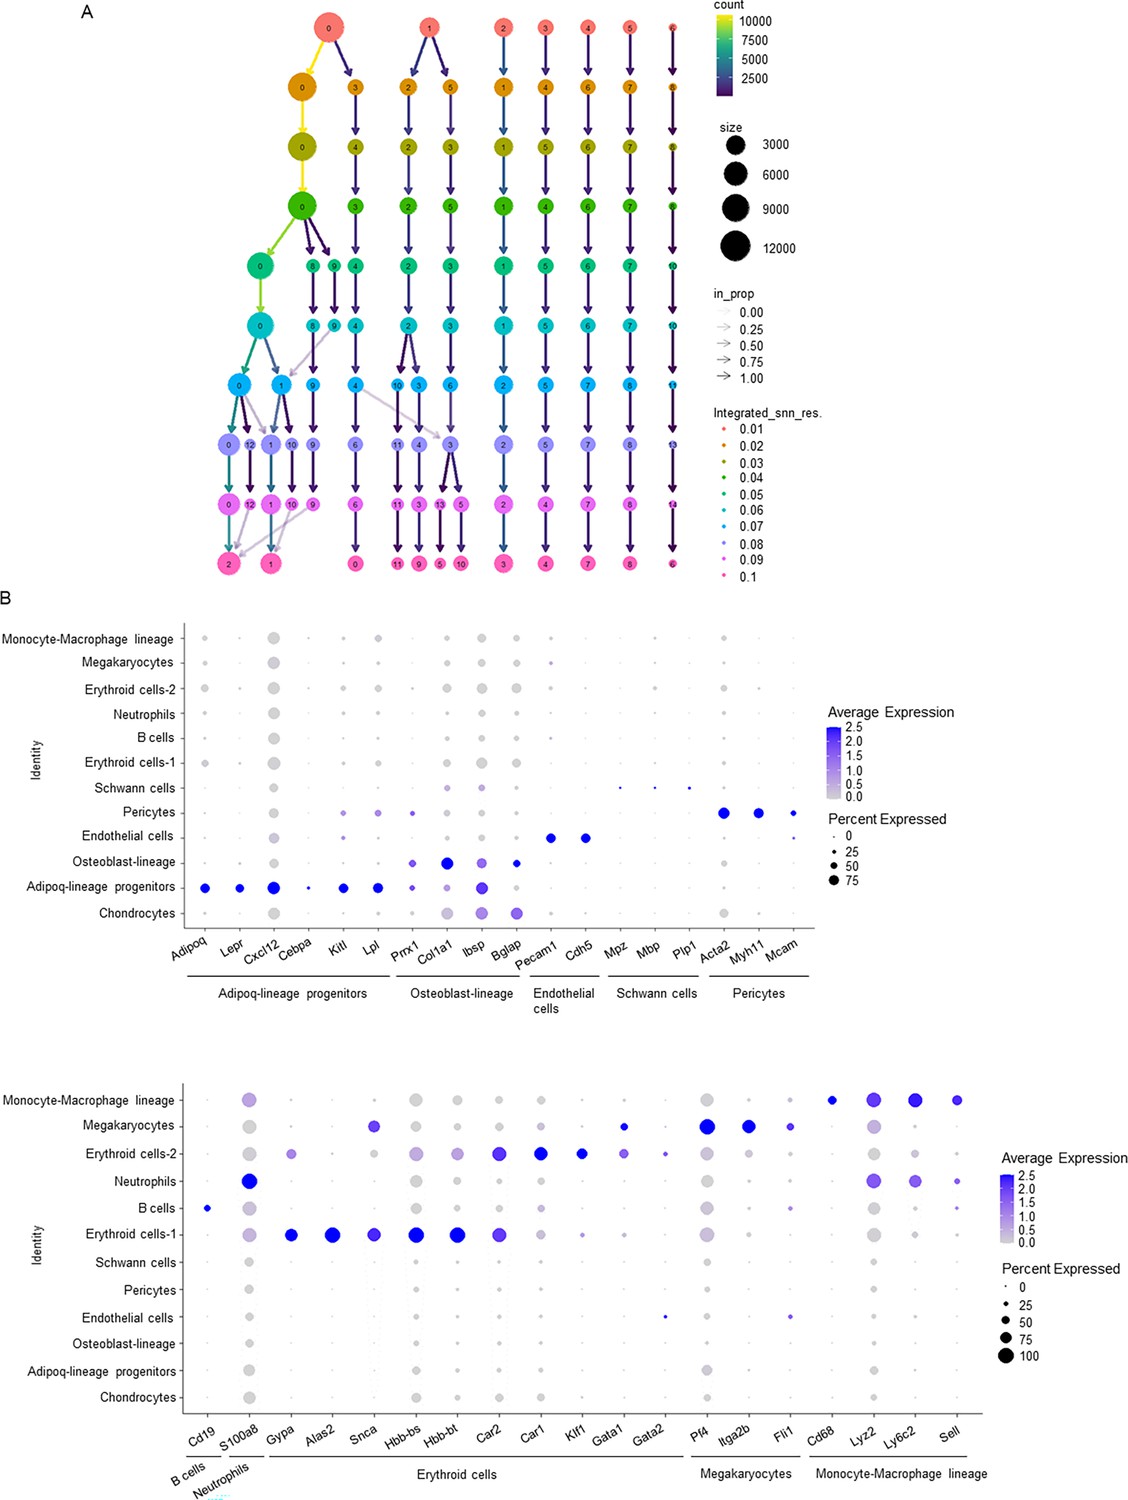
Bioinformatic analysis of the scRNAseq dataset GSE128423.
(A) A clustering tree of the scRNAseq dataset (GSE128423) across resolutions. (B) Dot plots of several typical marker gene expression for each cell type across the listed scRNAseq clusters. Cell clusters are listed on the y-axis. Features are listed along the x-axis. Dot size reflects the percentage of cells in a cluster expressing each gene. Dot color reflects scaled average gene expression level as indicated by the legend.
Figure 6—figure supplement 2
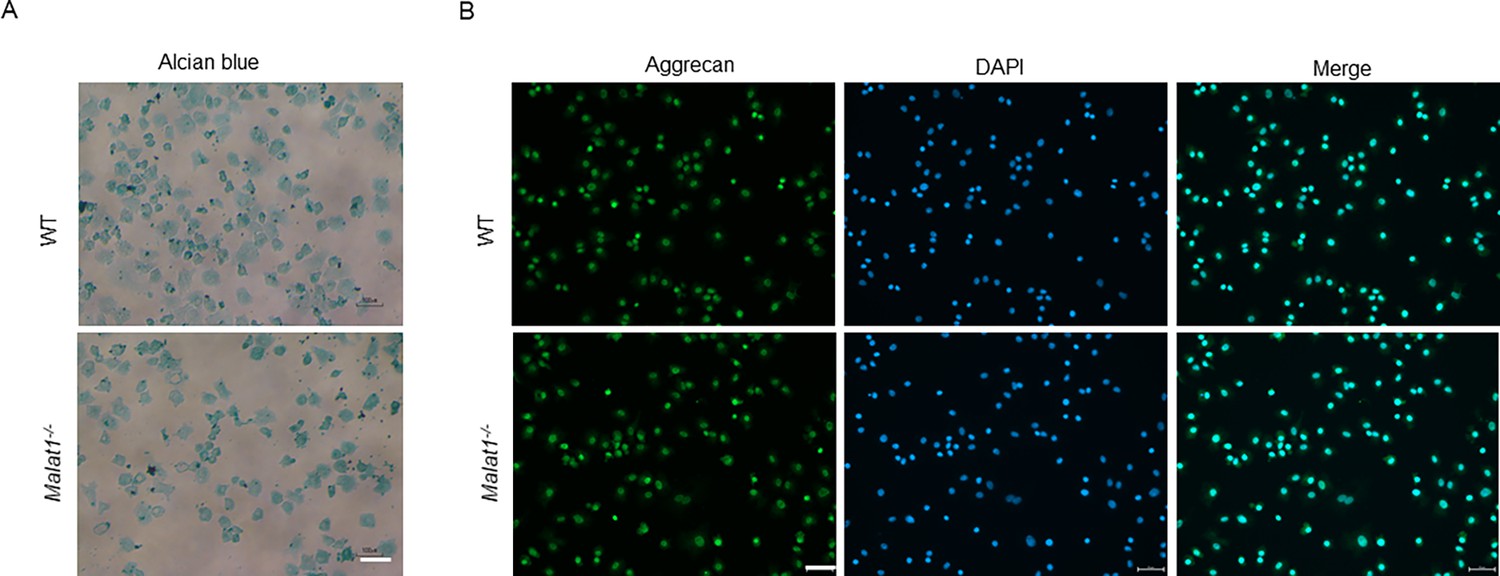
Verification of the cellular characteristics of the primary chondrocytes isolated from mouse knees.
(A) Alcian blue staining of primary chondrocytes isolated from the WT and Malat1-/- littermate mice. (B) Immunofluorescence staining of aggrecan (green) of primary chondrocytes derived from WT and Malat1-/- mice. Nuclei were counterstained with DAPI (blue). Scale bar: A 100 µm, B 50 µm.
Figure 7
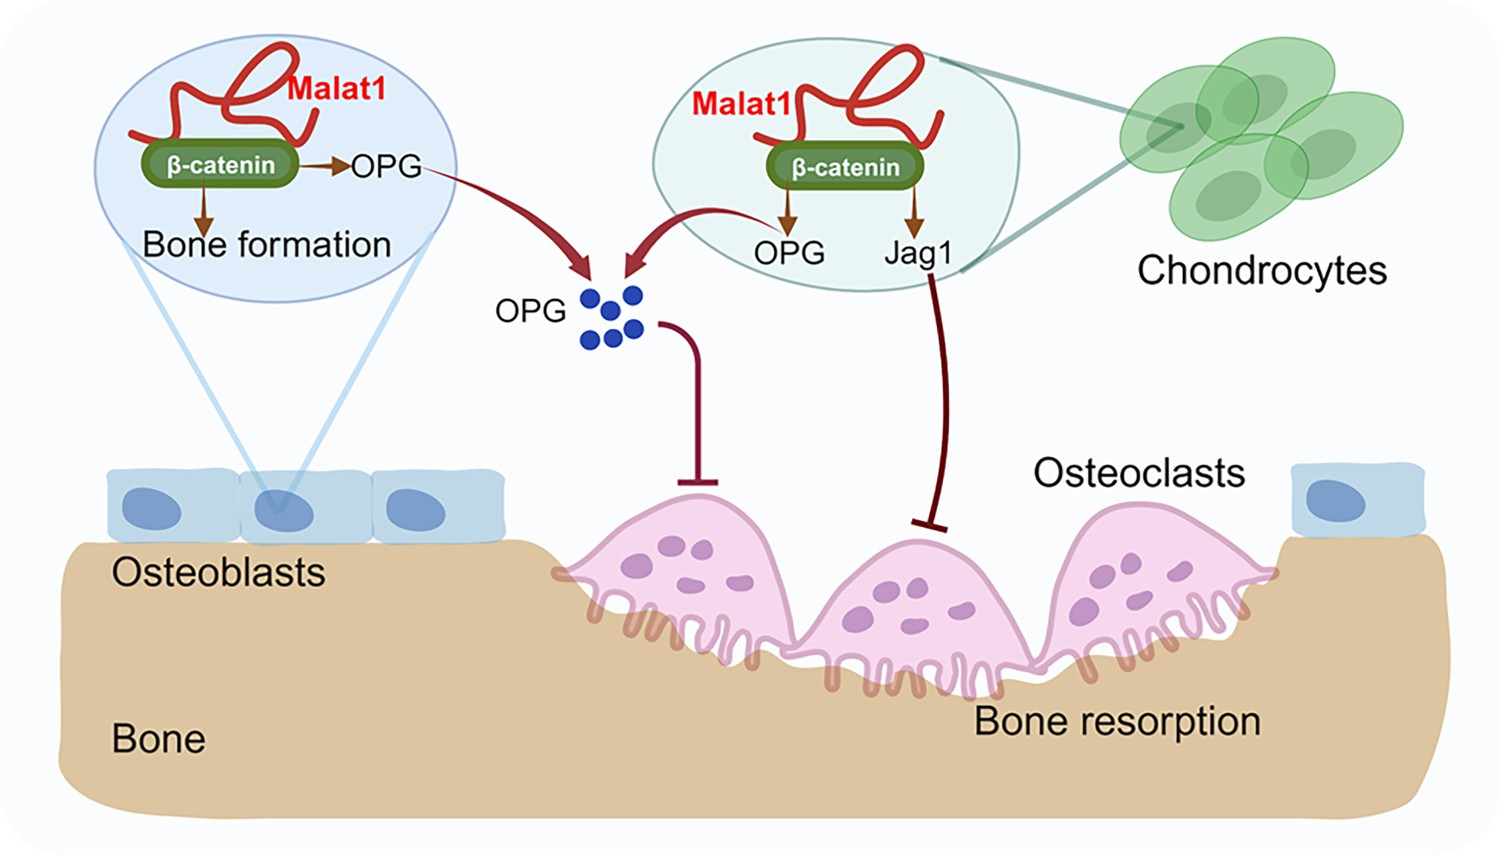
A model illustrating a Malat1-centered molecular and cellular network in bone remodeling.
Malat1 binds to β-catenin, regulating its transcriptional activity on downstream target genes, such as Tnfrsf11b (encoding OPG) and Jag1 (encoding Jagged1), both of which are osteoclastogenic inhibitors. Malat1 orchestrates β-catenin to promote intrinsic osteoblastic bone formation while suppressing osteoclastogenesis in a non-autonomous manner through β-catenin target genes OPG and Jagged1, expressed by osteoblasts and chondrocytes.
Figure 8
Malat1 enhances bone regeneration in fracture healing.
(A) Representative photograph of femur fracture callus. (B, D) representative μCT images of femurs isolated from the indicated mice at day 21 post-fracture. (C, E) μCT analysis of BV/TV in callus area of femurs of the indicated mice at day 21 post-fracture. (F) HE staining and histological analysis of the callus areas. n=5/group. Data are mean ± SD. (C, E, F) *p < 0.05; **p < 0.01 by Student’s t test. Scale bars, B, D 1 mm; F 400 µm.
-
Figure 8—source data 1
Malat1 enhances bone regeneration in fracture healing.
- https://cdn.elifesciences.org/articles/98900/elife-98900-fig8-data1-v1.xlsx
Tables
Key resources table
| Reagent type (species) or resource | Designation | Source or reference | Identifiers | Additional information |
|---|---|---|---|---|
| Genetic reagent (M. musculus) | Malat1-/- | PMID:22718948 | ||
| Genetic reagent (M. musculus) | Malat1flox/flox | PMID:22858678 | ||
| Genetic reagent (M. musculus) | Osteocalcin cre | PMID:12215457 | RRID:IMSR_JAX:019509 | |
| Genetic reagent (M. musculus) | Lyz2 cre | PMID:10621974 | RRID:IMSR_JAX:004781 | |
| Antibody | β-catenin rabbit polyclonal | Cell Signalling Technology | Cat# 9562 RRID:AB_331149 | WB (1:1000) |
| Antibody | Jag1 Rabbit monoclonal | Cell Signalling Technology | Cat# 70109 RRID:AB_331149 | WB (1:1000) |
| Antibody | Nfatc1 Mouse monoclonal | BD Biosciences | Cat# 556602 RRID:AB_331149 | WB (1:1000) |
| Antibody | Blimp1 Rat monoclonal | Santa Cruz Biotechnology | Cat# sc-47732 RRID:AB_628168 | WB (1:1000) |
| Antibody | c-Fos Rabbit polyclonal | Santa Cruz Biotechnology | Cat# sc-52 RRID:AB_2106783 | WB (1:1000) |
| Antibody | OPG/Osteoprotegerin Mouse monoclonal | Santa Cruz Biotechnology | Cat# sc-390518 RRID:AB_2891104 | WB (1:1000) |
| Antibody | p38α Rabbit polyclonal | Santa Cruz Biotechnology | Cat# sc-535 RRID:AB_632138 | WB (1:1000) |
| Antibody | Aggrecan Rabbit polyclonal | ABclonal | Cat# A8536 RRID:AB_632138 | IF (1:100) |
| Antibody | goat anti-Rabbit Alexa Fluor 488 | ThermoFisher Scientific | Cat# A-11008 RRID:AB_143165 | IF (1:500) |
| Antibody | ProLong Gold Antifade Mountant with DAPI | ThermoFisher Scientific | Cat# P36941 | |
| Peptide, recombinant protein | Recombinant Human sRANK Ligand | PeproTech | Cat# 310–01 | 40 ng/mL |
| Peptide, recombinant protein | Murine M-CSF | PeproTech | Cat# 315–02 | 20 ng/ml |
| Peptide, recombinant protein | Recombinant human OPG | PeproTech | Cat# 450–14 | Refer to Figure legends |
| Chemical compound, drug | prostaglandin E2 | MilliporeSigma | Cat# P0409 | 1 μM |
| Chemical compound, drug | 1α,25-Dihydroxyvitamin D3 | MilliporeSigma | Cat# D1530 | 10 nM |
| Chemical compound, drug | Collagenase | Worthington | Cat#LS004177 | 1 mg/ml |
| Chemical compound, drug | Dispase | Thermo Fisher Scientific | Cat#17105041 | 2 mg/ml |
| Commercial assay or kit | Mouse Tartrate Resistant Acid Phosphatase (TRAP) ELISA Kit | MyBioSource.com | MBS1601167 | |
| Commercial assay or kit | Mouse Osteoprotegerin ELISA Kit | MilliporeSigma | RAB0493 | |
| Commercial assay or kit | Mouse PINP ELISA Kit | MyBioSource.com | MBS2500076 | |
| Commercial assay or kit | Dual-Luciferase Reporter Assay system | Promega | E1910 | |
| Software, algorithm | Seurat | PMID:29608179 | RRID:SCR_016341 | https://satijalab.org/seurat/get_started.html |
| Software, algorithm | GraphPad Prism 8 | GraphPad Software | RRID:SCR_002798 | |
| Software, algorithm | ZEN (blue edition) version 3.4 | ZEN (blue edition) | RRID:SCR_013672 | https://www.zeiss.com/microscopy/en/products/software/zeiss-zen.html |
Additional files
Download links
A two-part list of links to download the article, or parts of the article, in various formats.
Downloads (link to download the article as PDF)
Open citations (links to open the citations from this article in various online reference manager services)
Cite this article (links to download the citations from this article in formats compatible with various reference manager tools)
Long non-coding RNA Malat1 fine-tunes bone homeostasis and repair by orchestrating cellular crosstalk and β-catenin-OPG/Jagged1 pathway
eLife 13:RP98900.
https://doi.org/10.7554/eLife.98900.3


