Template switching during DNA replication is a prevalent source of adaptive gene amplification
- Department of Biology, Center for Genomics and Systems Biology, New York University, United States
- School of Zoology, Faculty of Life Sciences, Tel Aviv University, Israel
- Edmond J. Safra Center for Bioinformatics, Tel Aviv University, Israel
- Department of Natural Sciences, Baruch College CUNY, United States
- Department of Ecology and Evolutionary Biology, Yale University, United States
- Microbial Sciences Institute, Yale University, United States
- Department of Biological Sciences, North Carolina State University, United States
Figures
Figure 1
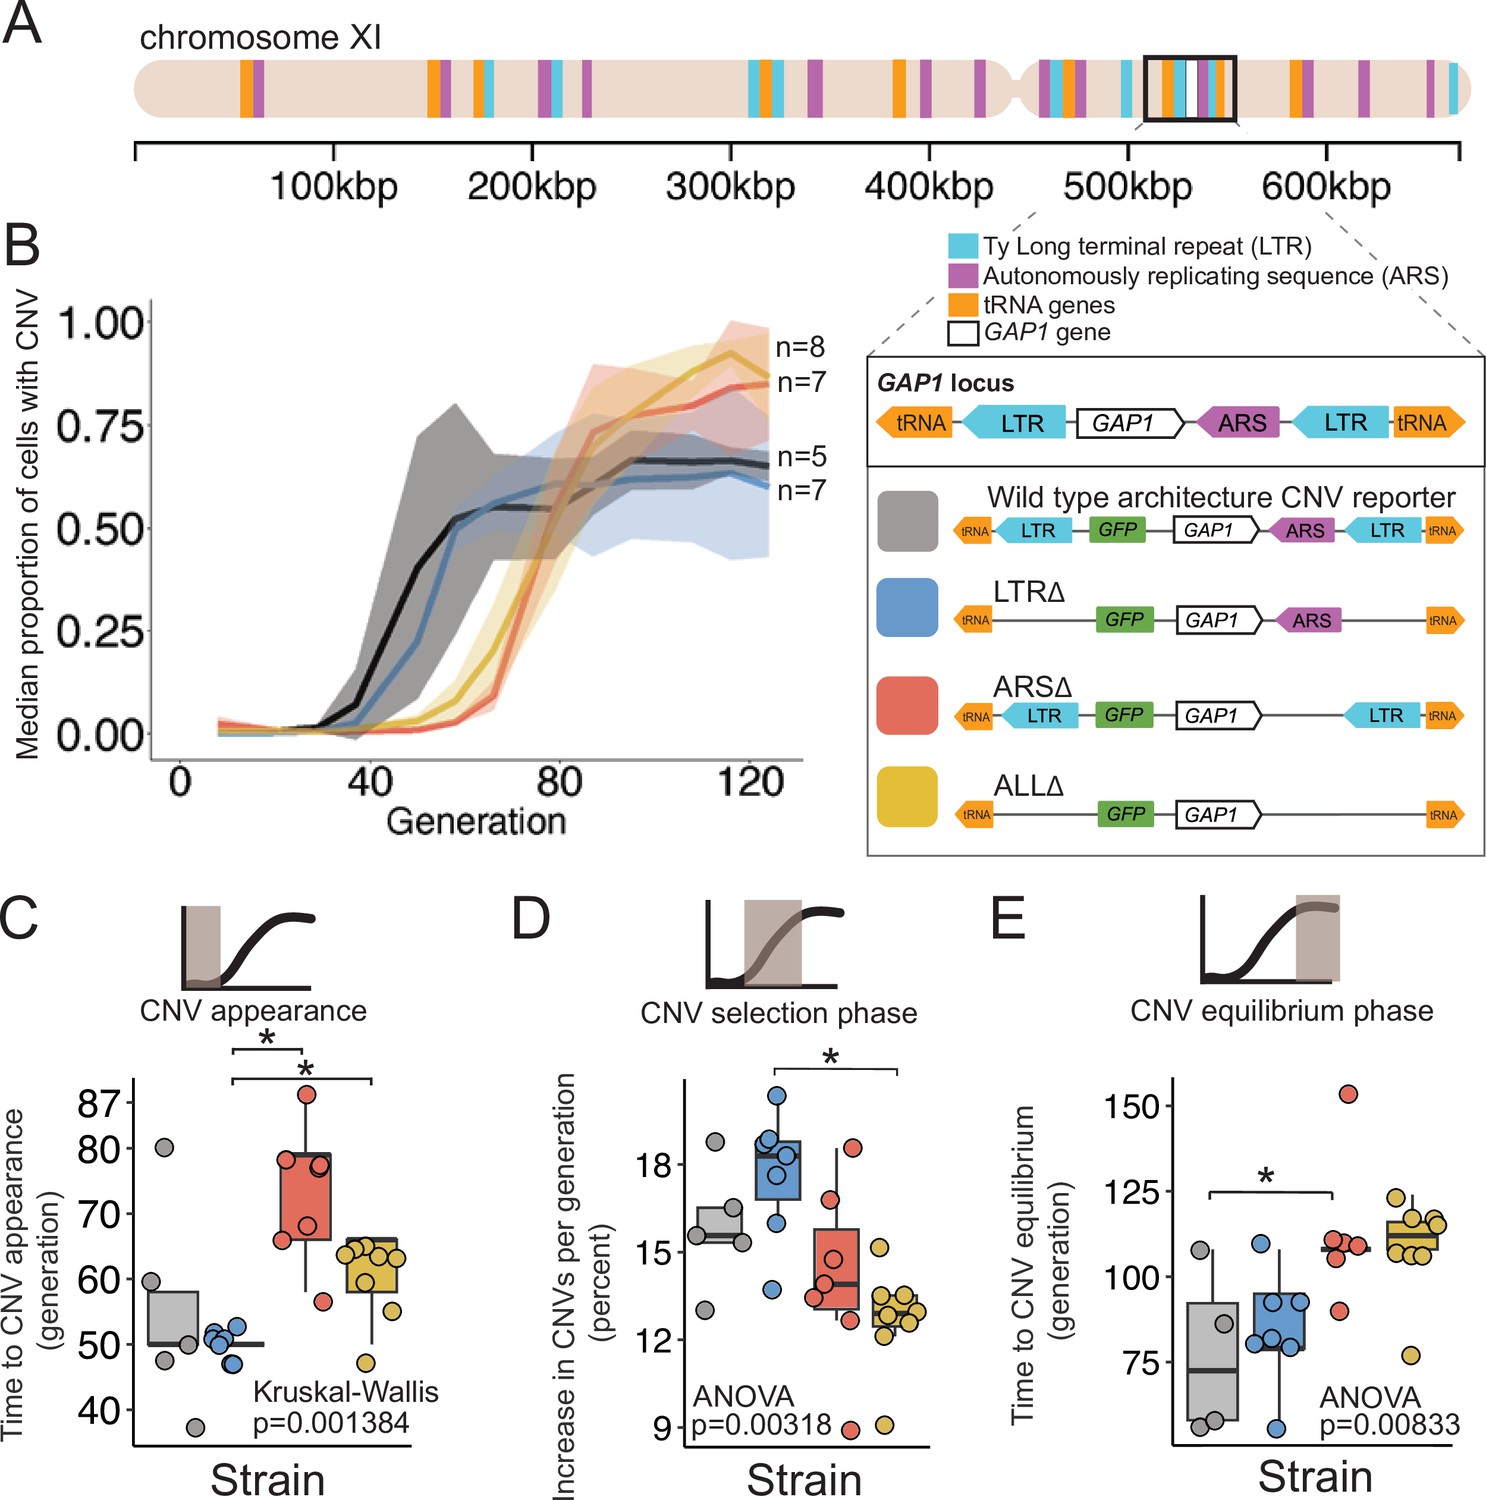
A local DNA replication origin contributes to CNV dynamics during adaptive evolution.
(A) The Saccharomyces cerevisiae GAP1 gene is located on the short arm of chromosome XI (beige rectangle). Light blue rectangle - Ty Long terminal repeats (LTR). Purple rectangle - Autonomously replicating sequences (ARS). Orange rectangles - tRNA genes. GAP1 ORF - white rectangle. The GAP1 gene (white rectangle) is flanked by Ty1 LTRs (YKRCδ11, YKRCδ12), which are remnants of retrotransposon events, and is directly upstream of an autonomously replicating sequence (ARS1116). Variants of the GAP1 locus were engineered to remove either both LTRs, the single ARS, or all three elements. All engineered genomes contain a CNV reporter. (B) We evolved the four different strains in 5–8 replicate populations, for a total of 27 populations, in glutamine-limited chemostats and monitored the formation and selection of de novo GAP1 CNVs for 137 generations using flow cytometry. Population samples were taken every 8–10 generations and 100,000 cells were assayed using a flow cytometer. Colored lines show the median proportion of cells in a population with GAP1 amplifications across 5–8 replicate populations of the labeled strain. The shaded regions represent the median absolute deviation across the replicates. (C) We summarized CNV dynamics and found that strain has a significant effect on time to CNV appearance (Kruskal-Wallis, p=0.001384). There are significant differences in time to CNV appearance between LTR∆ (blue) and ARS∆ (red), and LTR∆ (blue) and ALL∆ (yellow) (pairwise wilcoxon test with Bonferroni correction, p=0.0059 and p=0.0124, respectively). (D) Strain has a significant effect on the per generation increase in proportion of cells with CNV (ANOVA, p=0.00318) calculated as the slope during CNV selection phase. There is a significant difference between LTR∆ (blue) and ALL∆ (yellow) (pairwise t-test with Bonferroni correction, p=0.0026). (E) Strain has a significant effect on time to CNV equilibrium (ANOVA, p=0.00833). There is a significant difference in time to CNV equilibrium between WT and ARS∆ (pairwise t-tests with bonferroni correction, p=0.050).
Figure 2 with 1 supplement
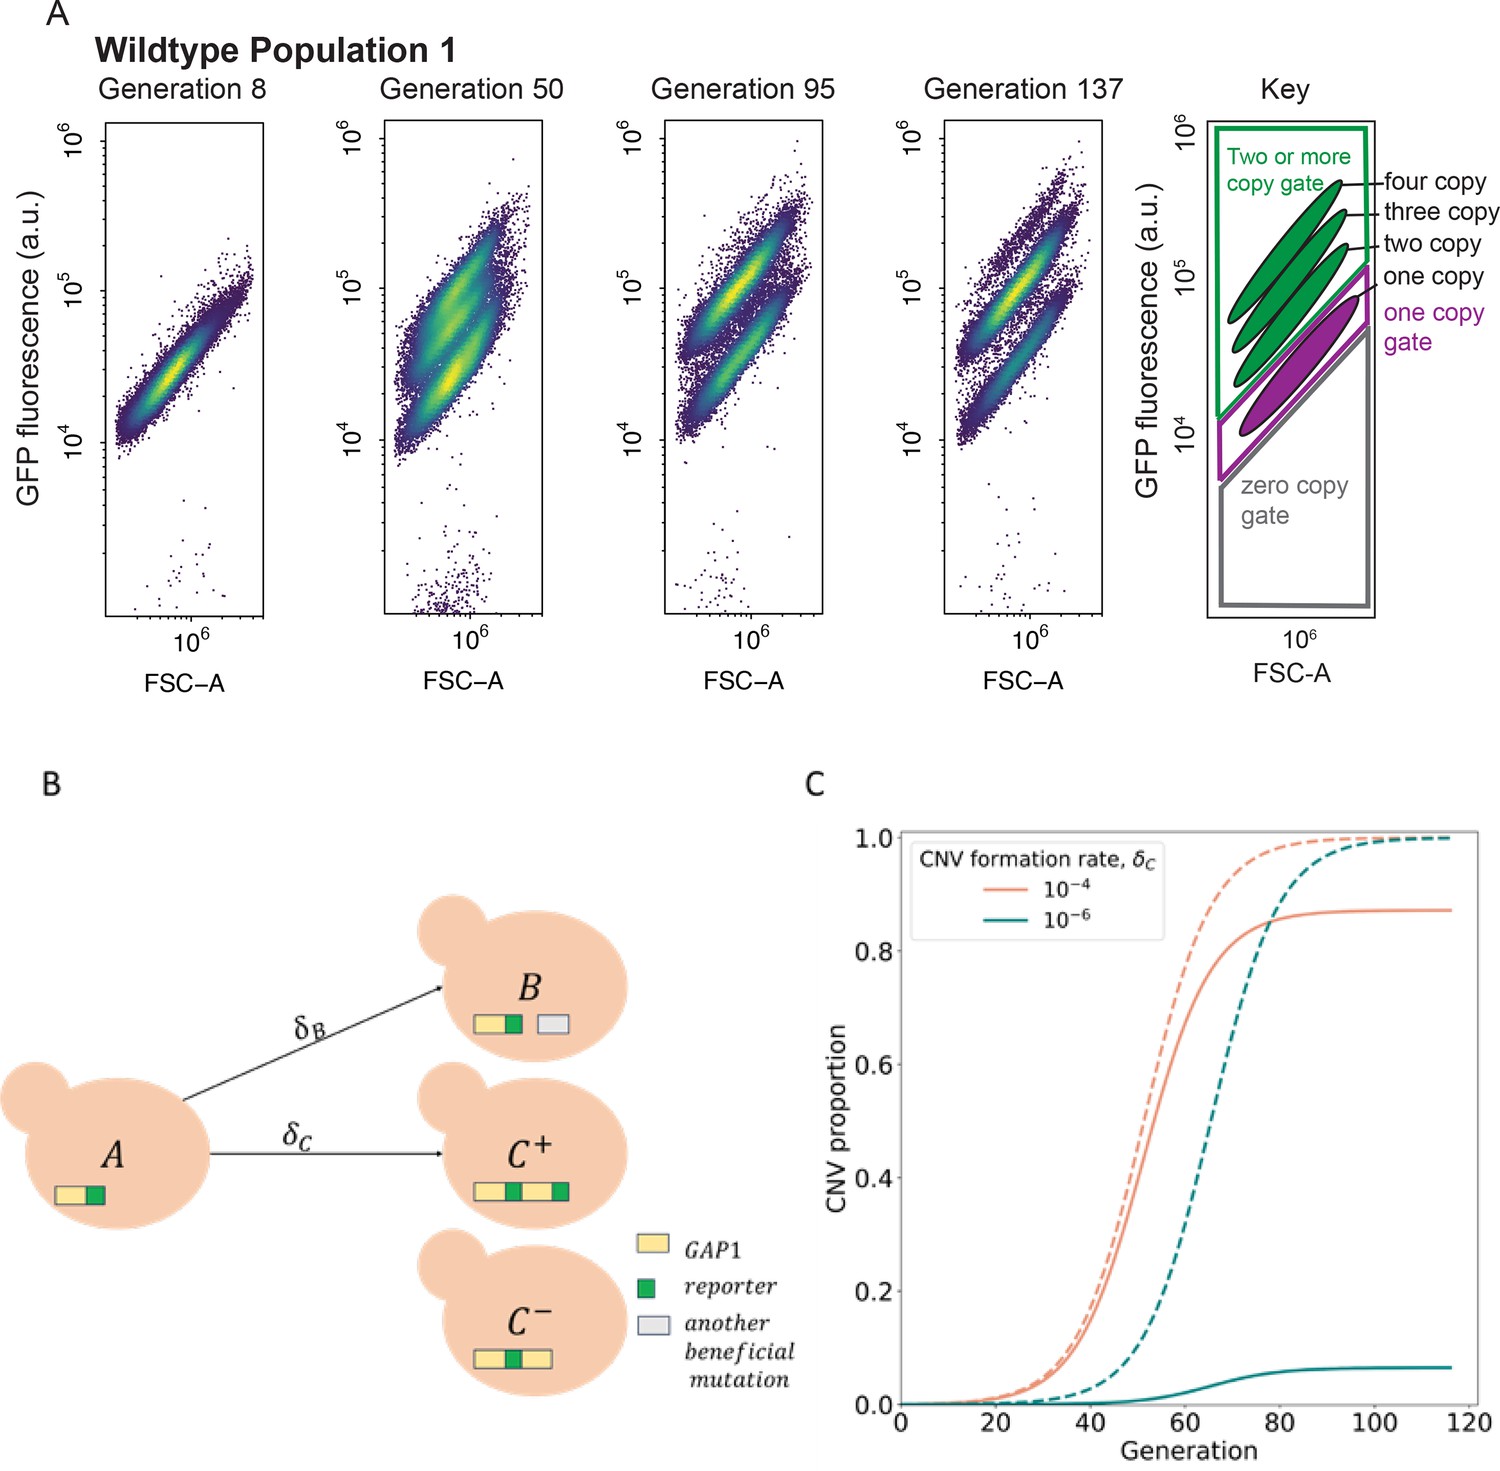
CNV reporter failure does not impact parameter inference.
(A) Flow cytometry of a representative WT population with a persistent one-copy GFP subpopulation, bottom in each panel. FSC-A is forward scatter-area which is a proxy for cell size (x-axis). GFP fluorescence was measured in arbitrary units (a.u.) (y-axis). Hierarchical gating was performed to define the one-copy GFP and two-or-more copy subpopulations (see Methods). (B) Model illustration. is the frequency of ancestor cells in the chemostat; are the frequencies of cells with GAP1 duplications with two or one reporters, respectively, and a selection coefficient ; is the frequency of cells with other beneficial mutations and a selection coefficient . GAP1 duplications form with a rate , other beneficial mutations occur with rate . At generation 0, only genotypes and are present, with frequencies of and . (C) Examples of total CNV proportions (dashed) and reported CNV proportions (solid) for two parameter combinations, both with .
-
Figure 2—source data 1
Raw flow cytometry plots over the long term experimental evolution.
FSC-A is forward scatter-area which is a proxy for cell size. GFP fluorescence was measured using the B2-A channel in arbitrary units. Hierarchical gating was performed to identify zero-, one-, and two-or-more-copy populations. Within the two-or-more copy gate, distinct subpopulations formed consistent with having a two-, three-, four- copies of GFP.
- https://cdn.elifesciences.org/articles/98934/elife-98934-fig2-data1-v1.pdf
-
Figure 2—source data 2
Population GFP Ridgeplots.
Density plots of cell-size normalized GFP fluorescence in arbitrary units (a.u.) for every population and timepoint over the course of long-term experimental evolution in glutamine-limited chemostats.
- https://cdn.elifesciences.org/articles/98934/elife-98934-fig2-data2-v1.pdf
Figure 2—figure supplement 1
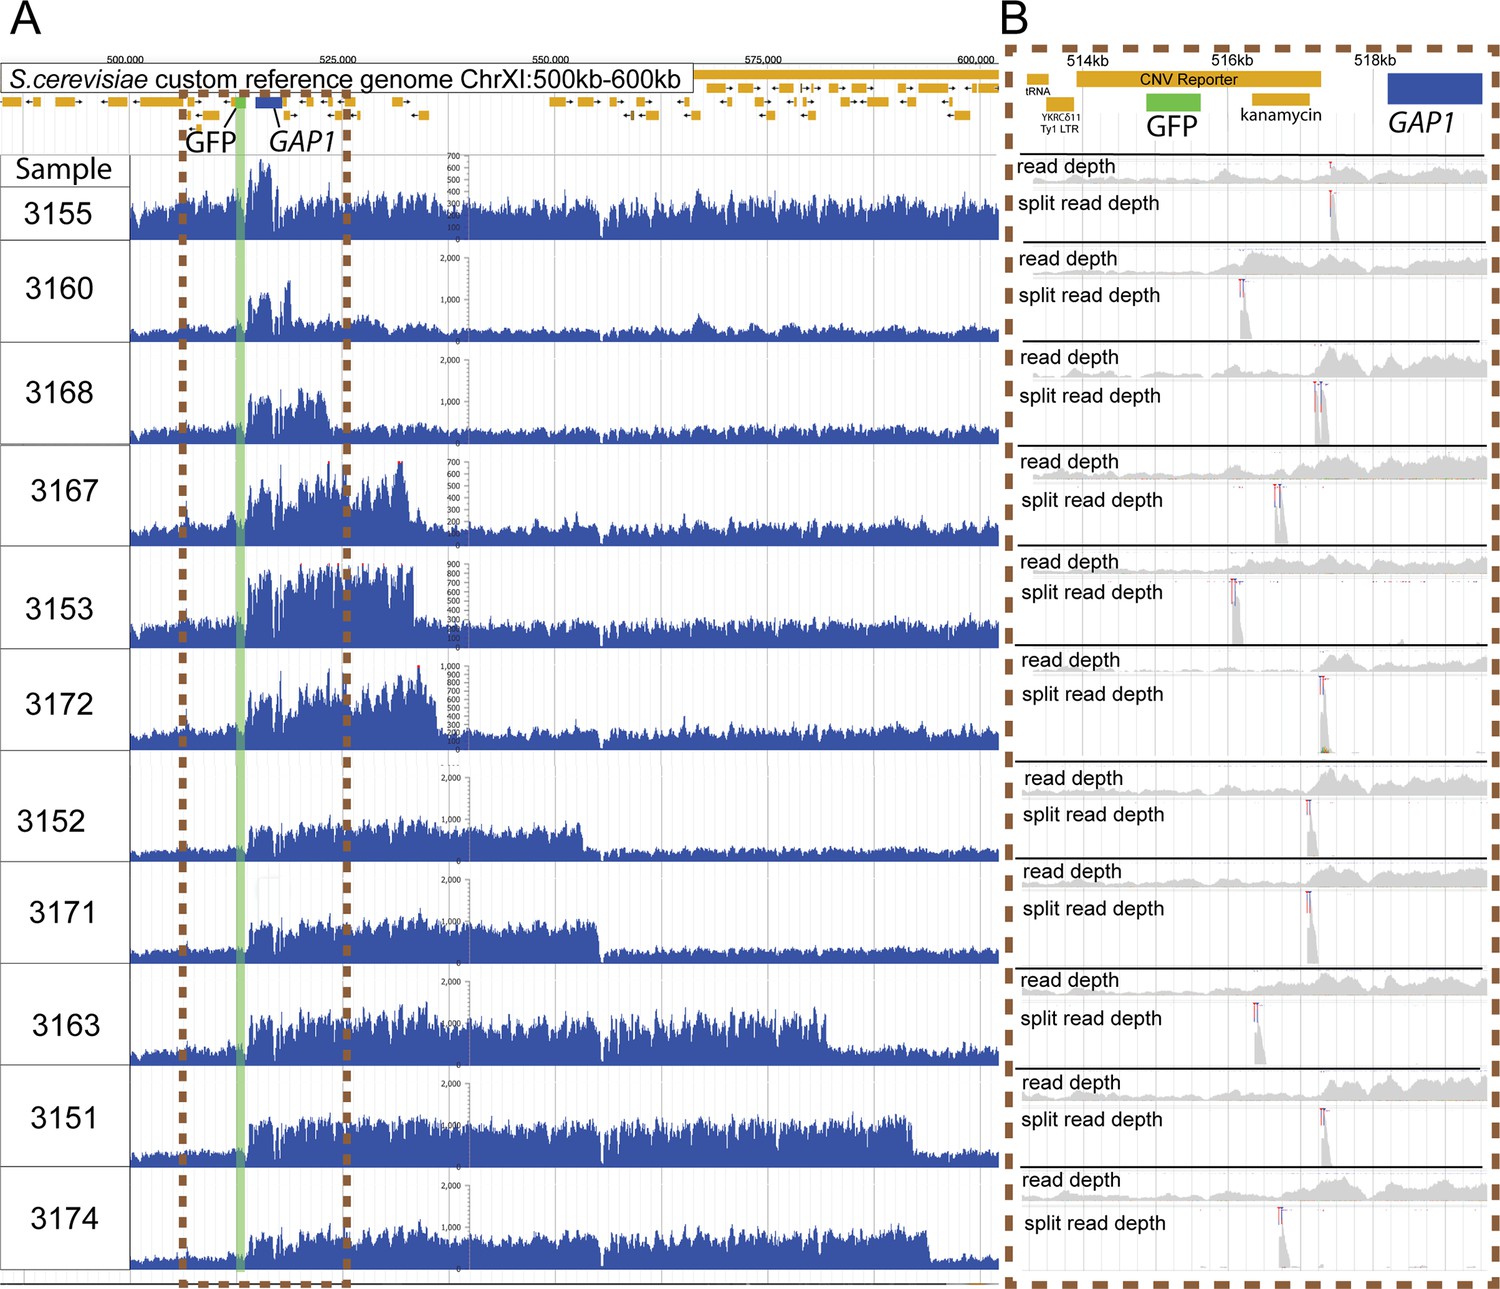
Independent GAP1 amplifications lacking CNV reporter amplification.
(A) Read depth plots of the GAP1 CNV reporter locus, ChrXI:500–600 kb, of sequenced clones from 1-copy-GFP subpopulations isolated across five chemostats. Identification of eleven distinct CNVs, shown above, indicate the occurrence of at least eleven independent amplifications of GAP1 without GFP co-amplification. Sequences were aligned to a custom reference genome containing the CNV reporter upstream of the GAP1 gene. The CNV reporter comprises a GFP gene and kanamycin resistance gene. GFP reference gene - green rectangle, GAP1 reference gene - blue rectangle. (B) Inset of the left-most CNV junction at the GFP, kanamycin, and GAP1 region, ChrXI: 513193–519171 with genome read depth and split read depth tracks for each sample. The location of the split reads pileup (blue and red clipping marks) show the precise CNV breakpoint which is downstream of the GFP gene and upstream of the GAP1 coding sequence for every clone indicating each lack an amplification of the inserted GFP gene.
Figure 3 with 8 supplements
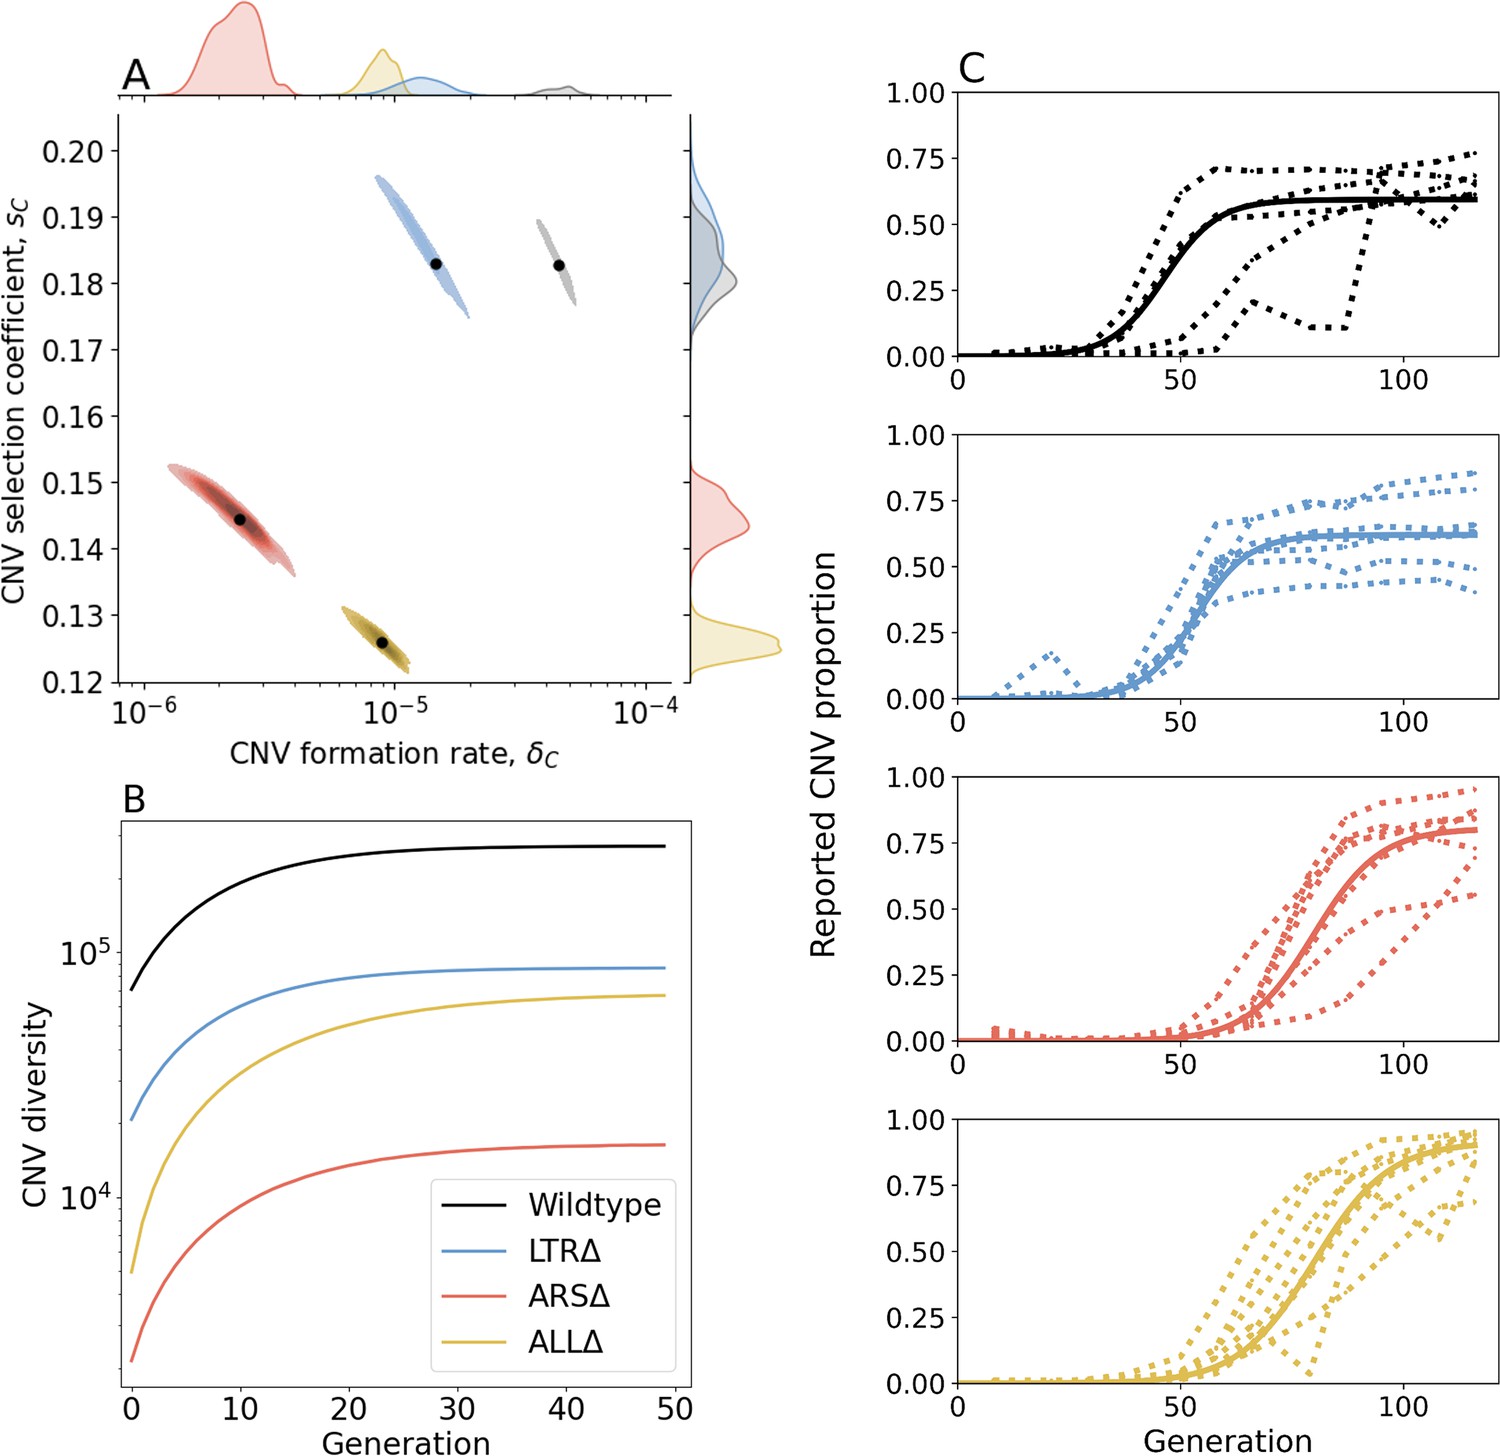
Inference of CNV formation rate and selection coefficient from experimental evolutionary data.
(A) Collective MAP estimate (black markers) and 50% HDR (colored areas) of GAP1 CNV formation rate, , and selection coefficient, . Marginal posterior distributions are shown on the top and right axes. (B) Collective posterior prediction of Shannon diversity of CNV lineages (, Jost, 2006). Line and shaded area show mean and 50% HDI. (C) CNV reported frequency () prediction using collective MAP (solid line) compared to empirical observations (dotted lines).
Figure 3—figure supplement 1
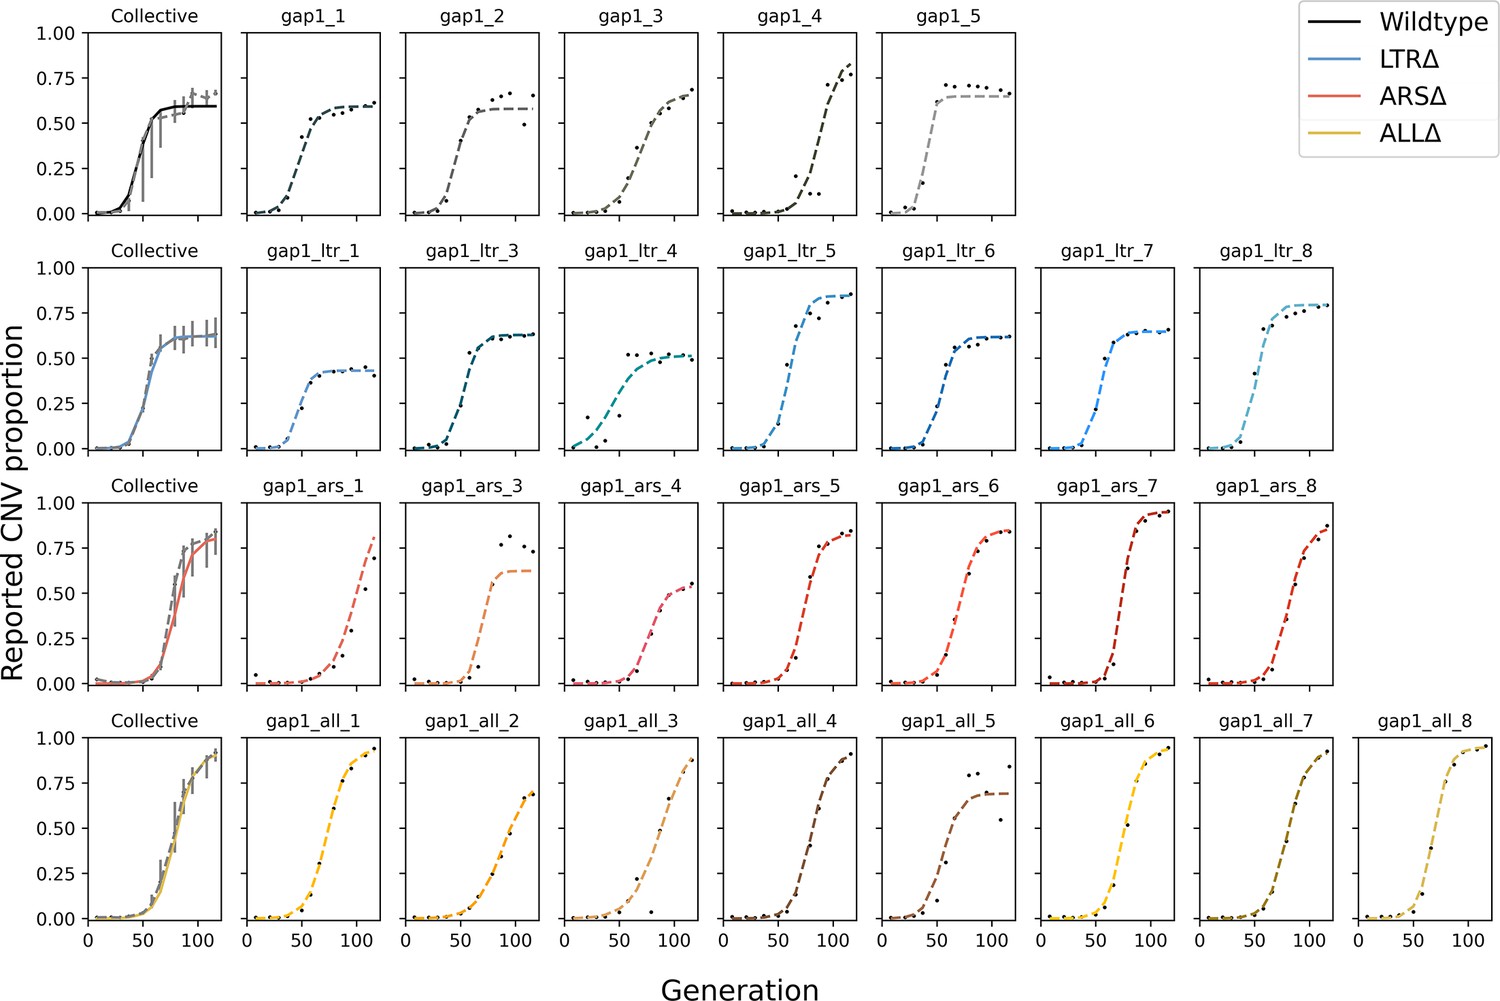
Posterior predictive checks for all replicates.
Black markers are the empirical observations from the experimental evolution, dashed line shows MAP prediction. The leftmost plot of each row shows the collective MAP prediction with empirical data’s interquartile range (gray bars).
Figure 3—figure supplement 2
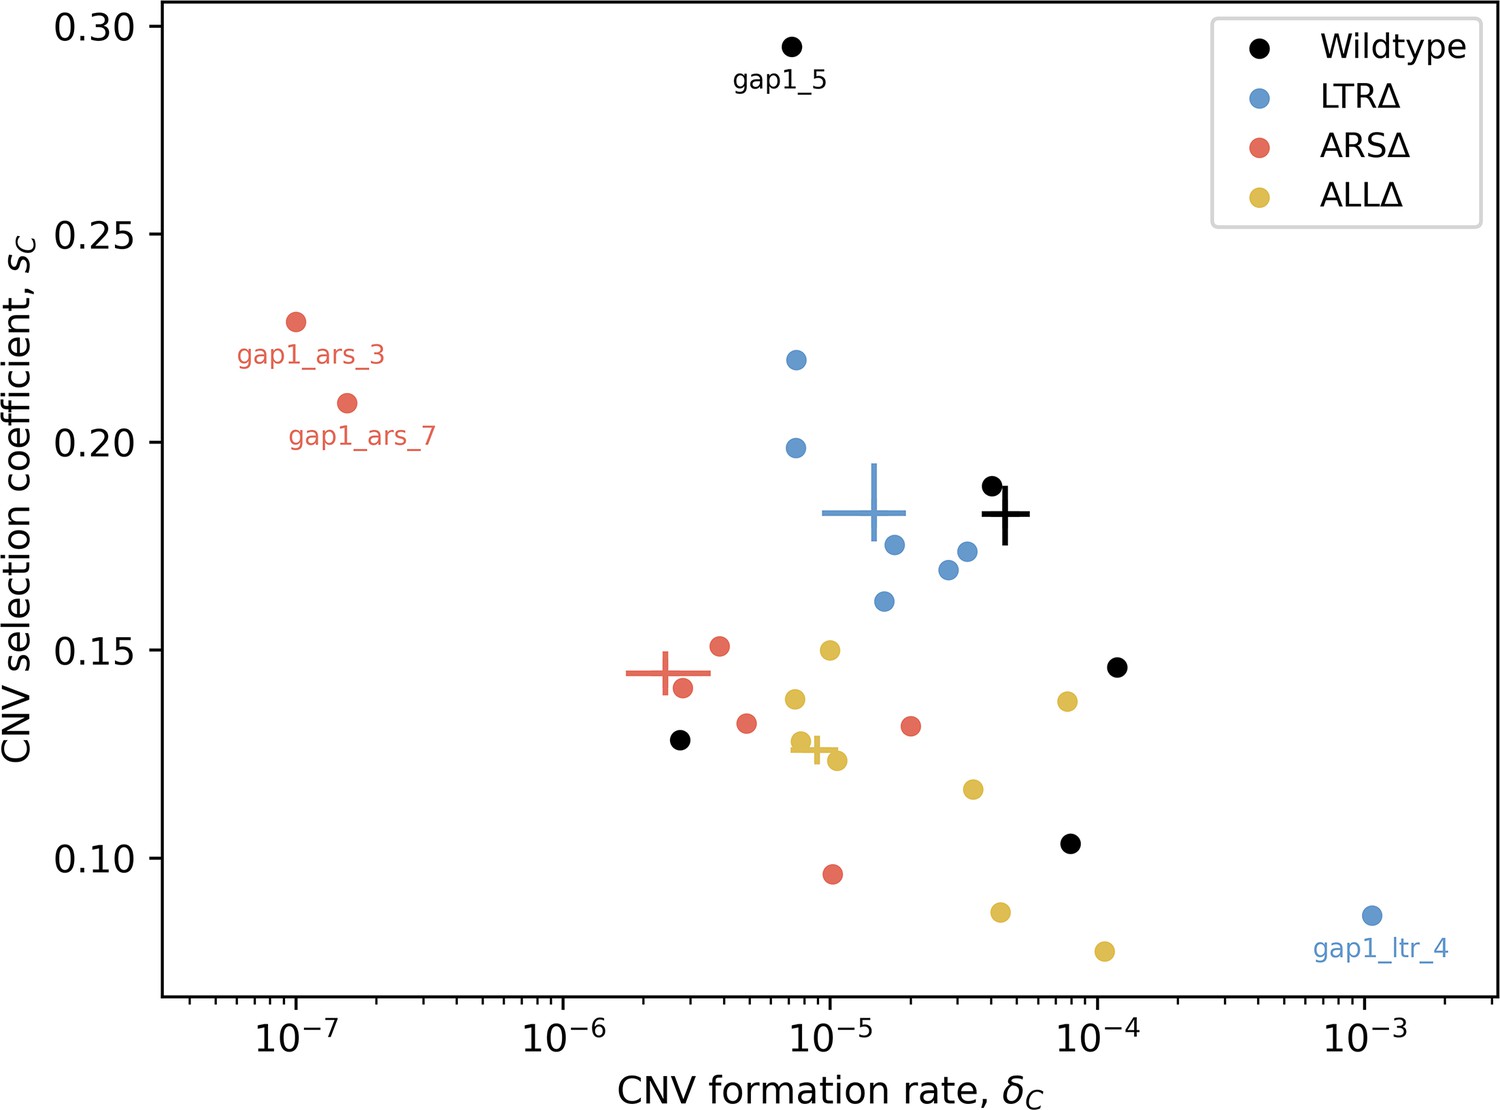
MAP estimates of GAP1 CNV formation rates () and selection coefficients () for all replicate populations.
Markers show MAP estimates from individual replicates, crosses show 50% HDI of collective posteriors. Extreme points are marked for comparison to data and posterior prediction, see Figure 3—figure supplement 1 for posterior predictive checks.
Figure 3—figure supplement 3
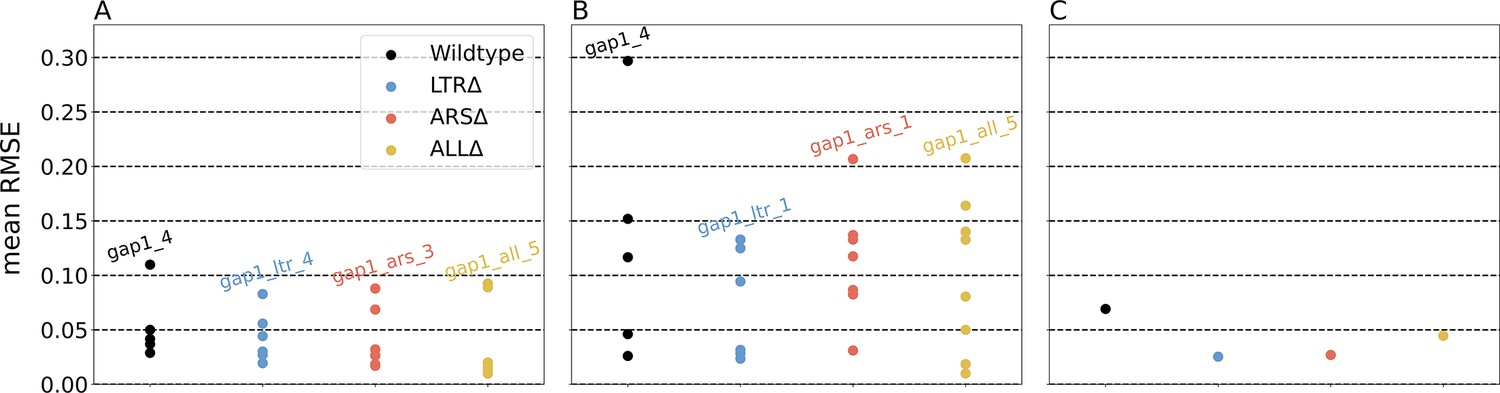
Error estimation of parameter inference.
Average root mean square errors (RMSE) of 50 posterior samples against the observed data. (A) Individual posteriors and individual replicates. (B) Collective posterior and individual replicates. (C) Collective posterior and empirical mean.
Figure 3—figure supplement 4

Pairwise and marginal collective posteriors for all estimated model parameters.
Diagonals show marginal collective posteriors per parameter per strain. Below-diagonal plots show pairwise KDEs for all pairs of model parameters. Collective joint MAPs (which may differ from collective marginal MAPs, as the marginal distribution integrates over all other parameters), are marked by a red vertical line. Panels are separated by strain: (A) WT, (B) ARSΔ, (C) LTRΔ, (D) ALLΔ.
Figure 3—figure supplement 5
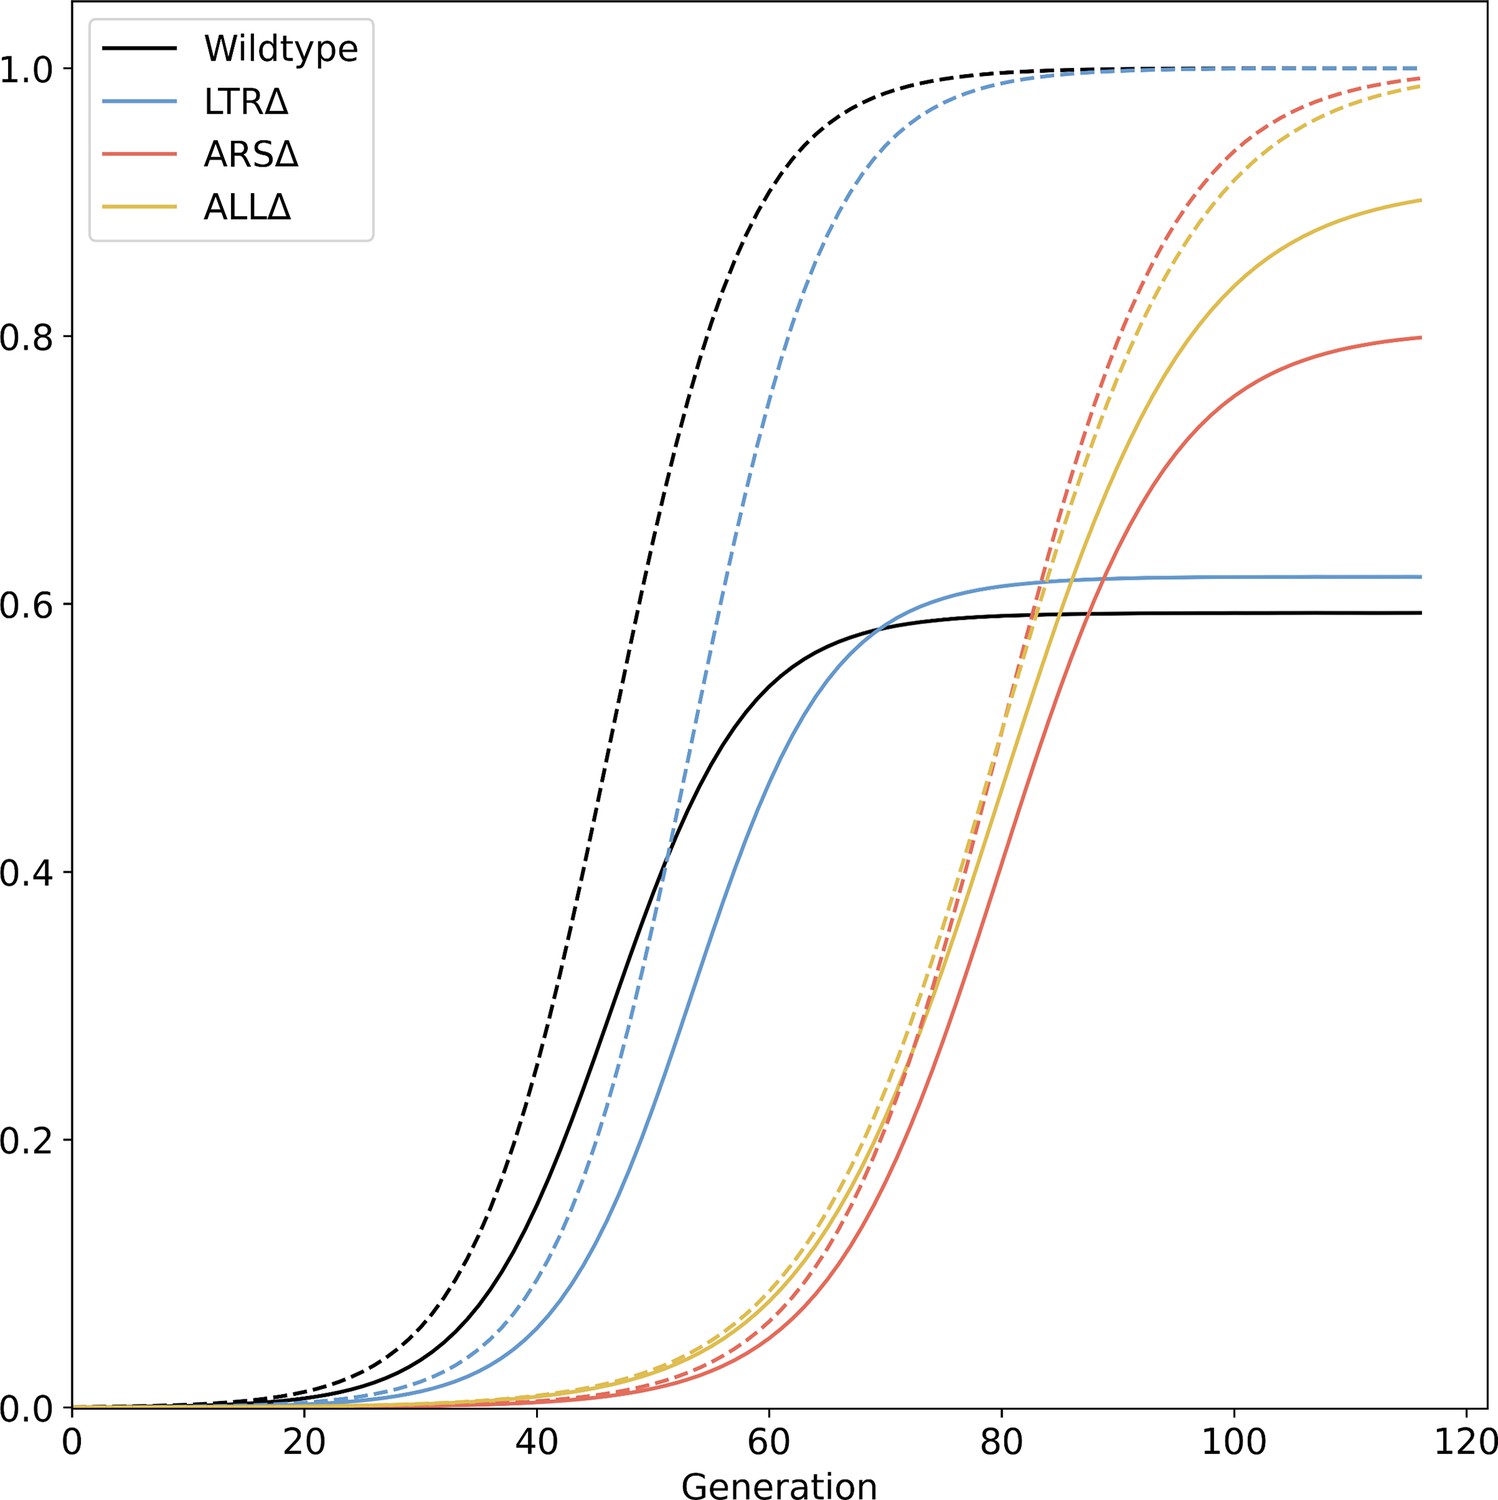
Total GAP1 CNV frequency.
Solid lines show collective MAP predictions, dashed lines show the total proportion of GAP1 CNVs, comprising unreported CNVs and reported CNVs generated during the experiment, as predicted by the evolutionary model.
Figure 3—figure supplement 6
Pairwise evolutionary competition predictions.
We simulated evolutionary competitions in the experimental conditions of WT vs. genomic architecture mutants, starting from equal frequencies. The proportion at generation 116 of WT was predicted using 10,000 combinations of collective posterior samples for each pairwise competition. Overall, WT outcompetes all mutants because it adapts faster (due to faster CNV formation rate), but its advantage over ARSΔ and ALLΔ is much higher than its advantage over LTRΔ. (A) Histograms for three pairwise competitions. Note that ARSΔ and ALLΔ values overlap at this scale and are all in the rightmost bar. (B) High-resolution histograms for ARSΔ and ALLΔ.
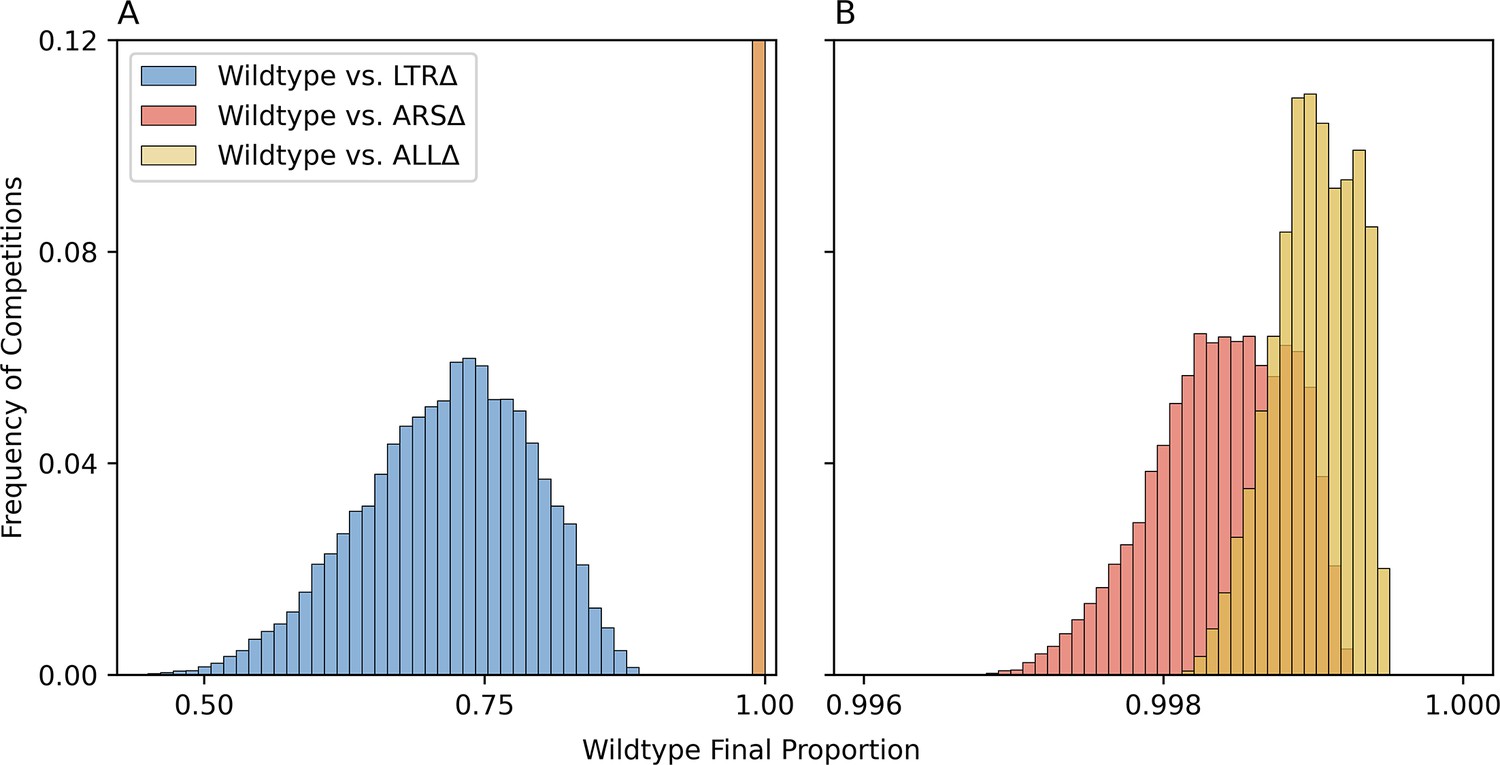
Figure 3—figure supplement 7
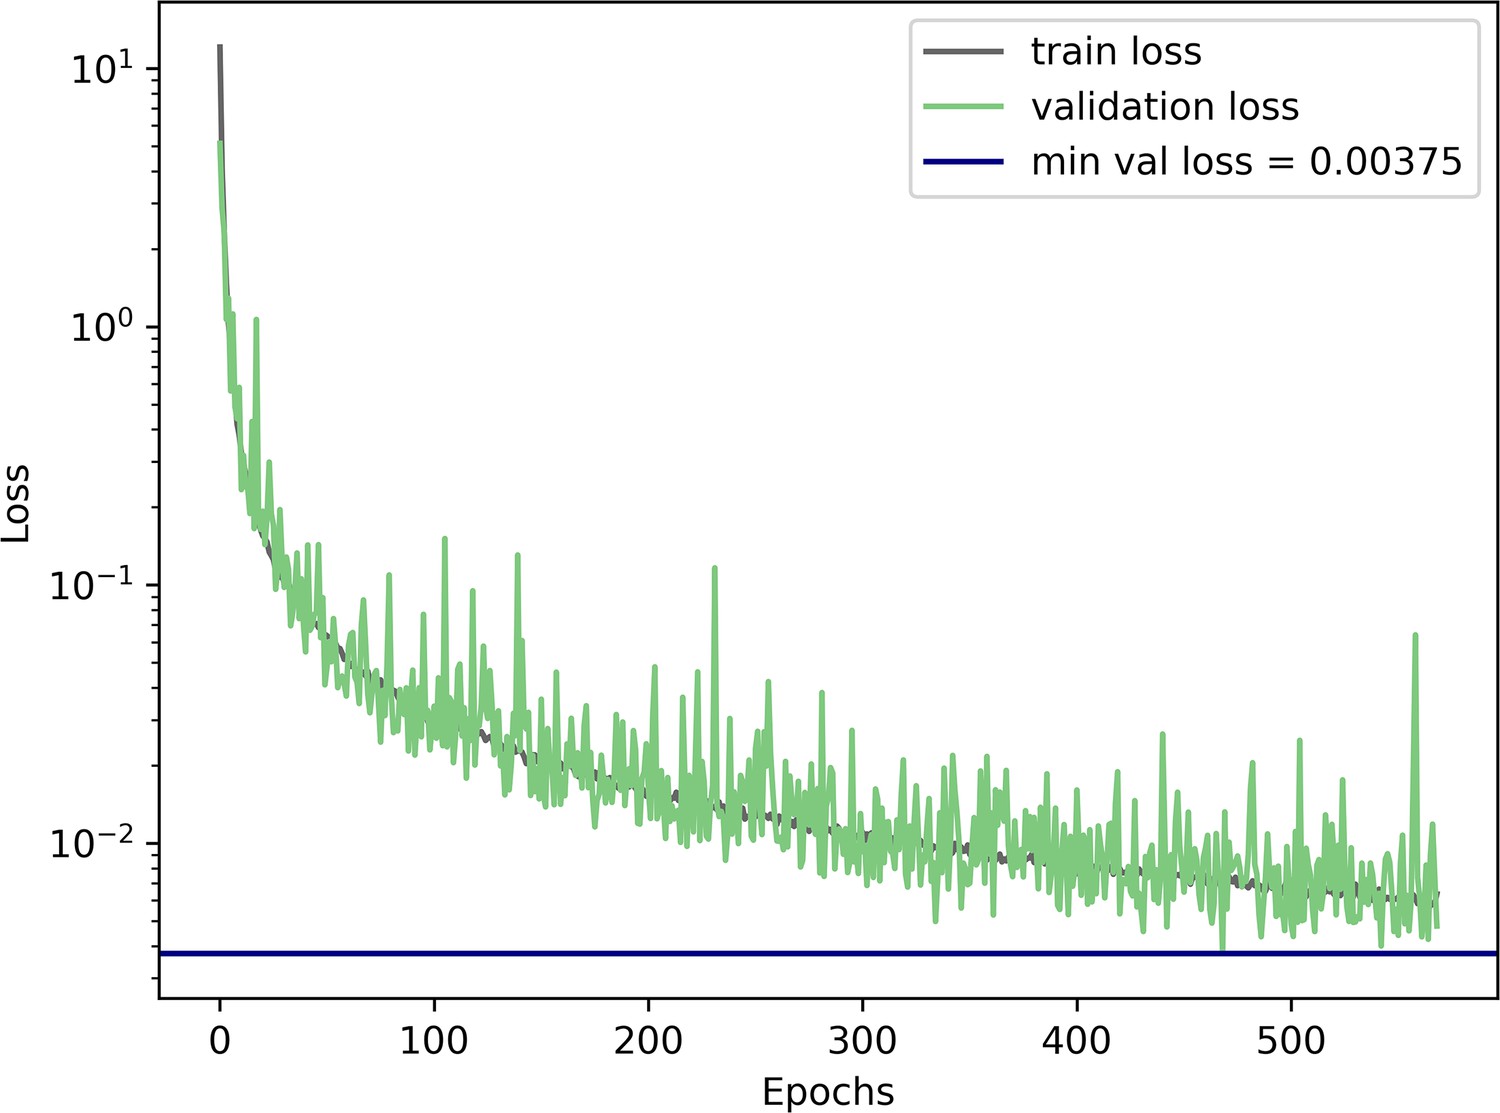
Neural density estimator training and validation loss during training.
Convergence threshold of 100 unimproved epochs (no decrease in minimal validation loss) was reached after 569 epochs.
Figure 3—figure supplement 8
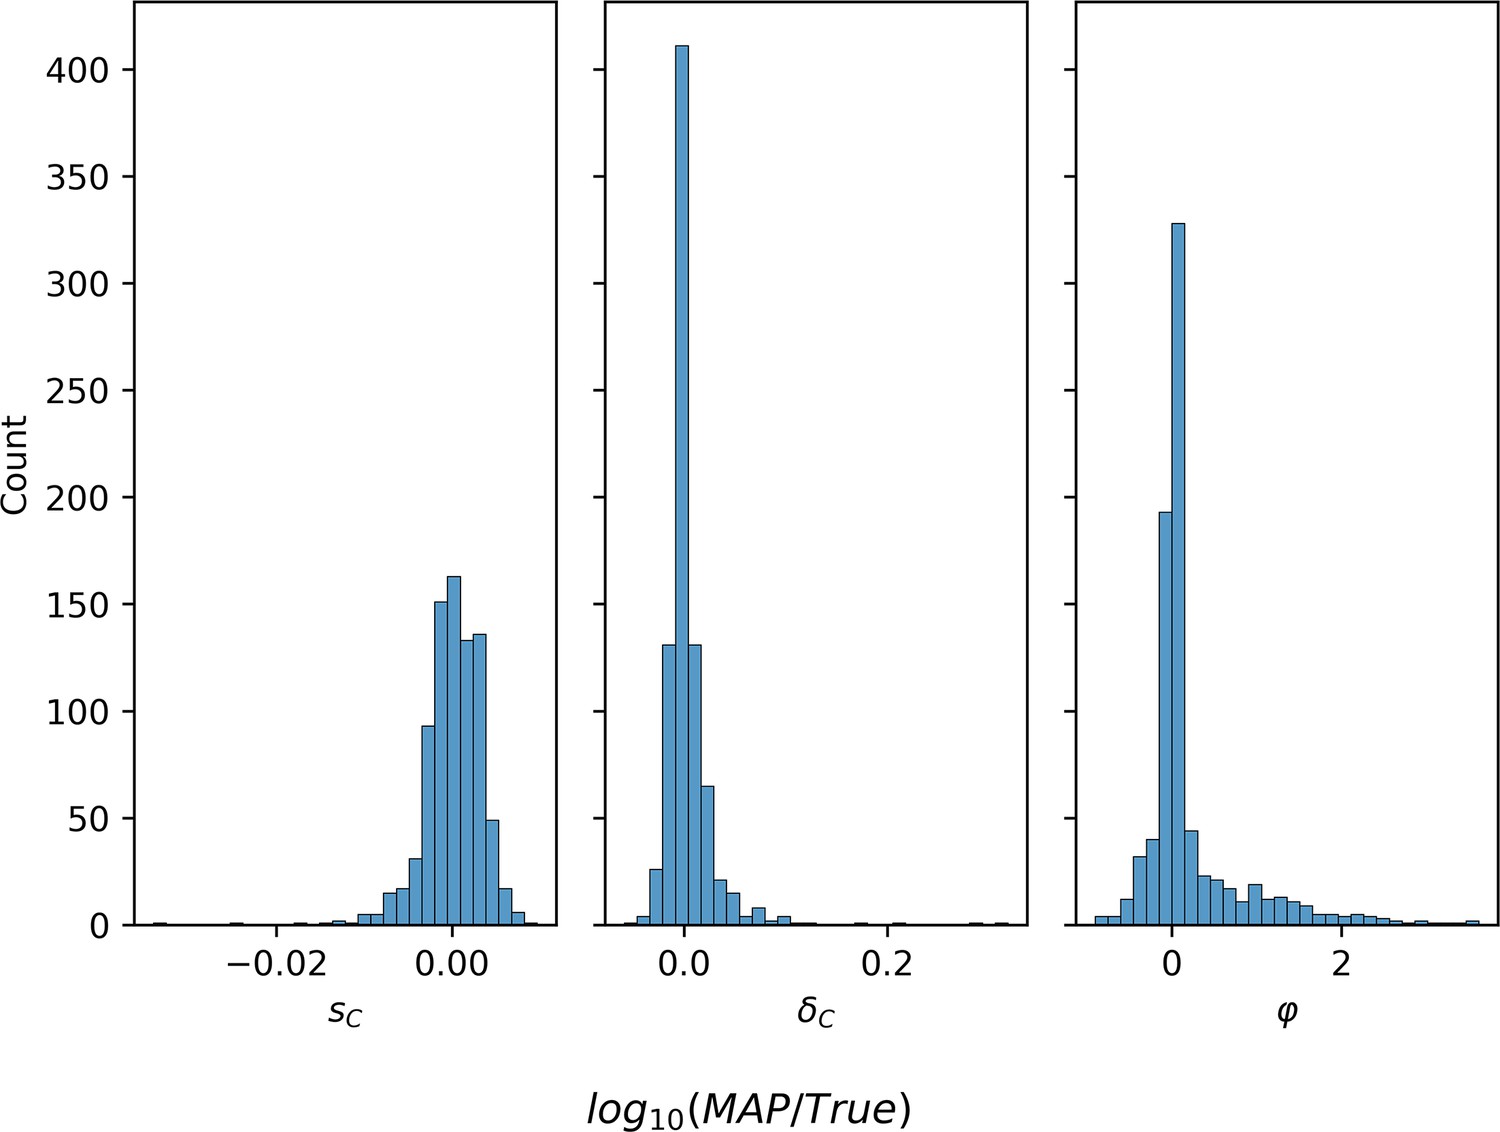
Parameter estimation accuracy on synthetic data.
Log-ratio of MAP estimate and true parameter value for 829 synthetic simulations in which the final reported GAP1 CNV proportion is at least 0.3.
Figure 4 with 3 supplements
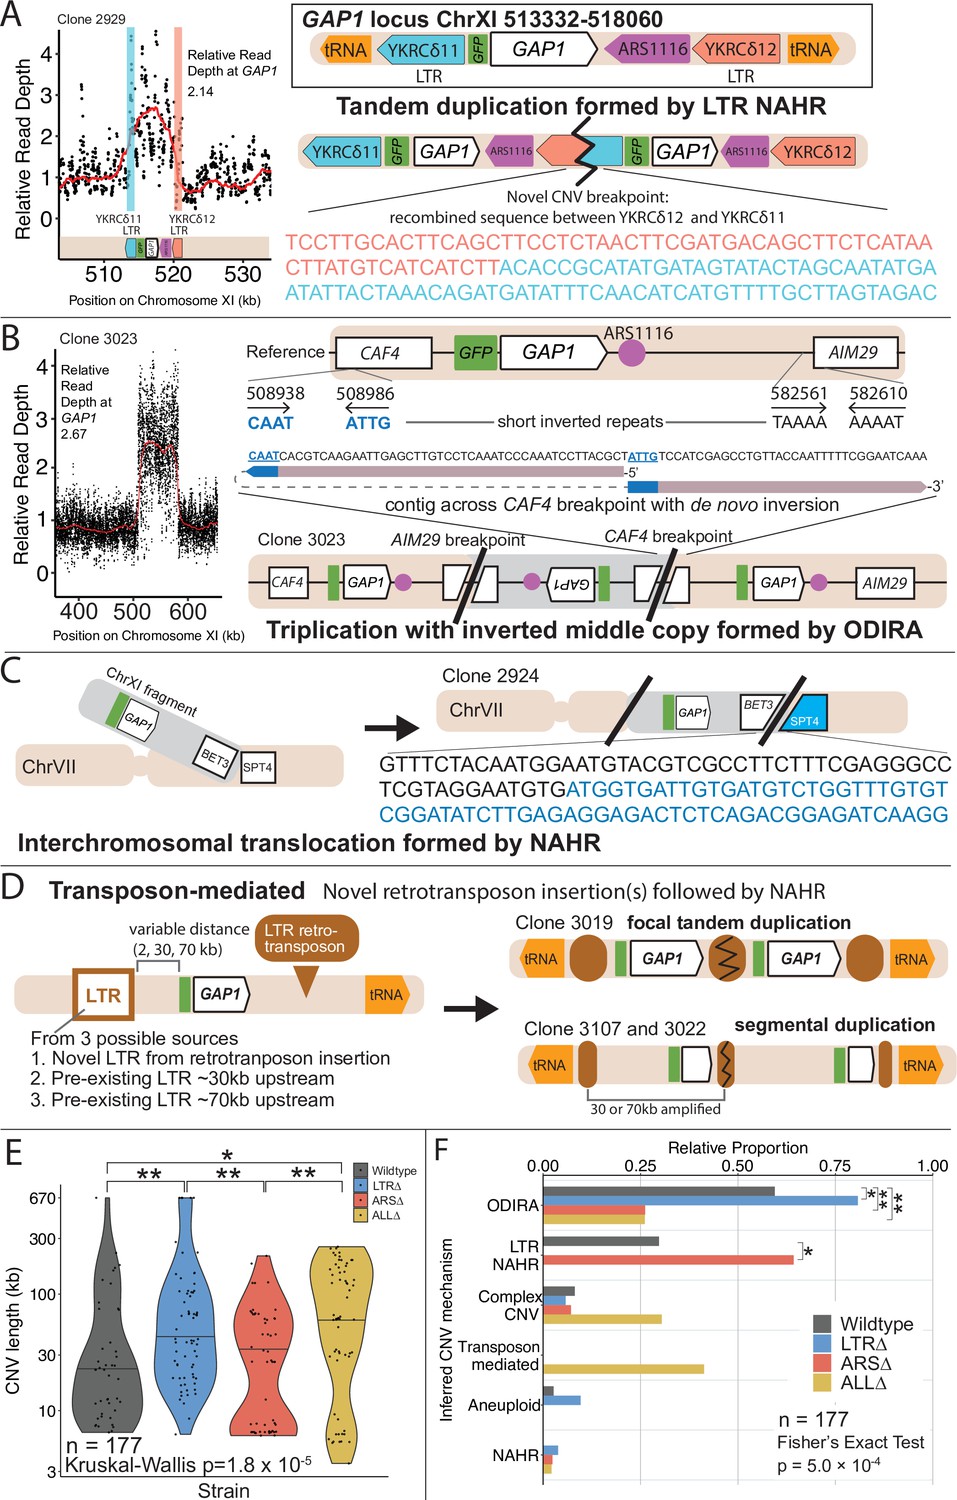
GAP1 CNV alleles can be formed through a variety of mechanisms.
(A) Schematic of Saccharomyces cerevisiae GAP1 locus on Chromosome XI: 513332–518060 with LTR, ARS elements and tRNA genes labeled. Long terminal repeat non-allelic homologous recombination (LTR NAHR) is defined on the basis of both CNV breakpoints occuring at LTR sites as revealed by read depth plots (left, pink and blue vertical lines) and increased read depth relative to the genome-wide read depth (left). In some cases we detect a hybrid sequence between two LTR sequences, a result of recombination between the two LTRs (right). LTR NAHR typically forms tandem duplications. (B) ODIRA is a DNA replication-error based CNV mechanism generated by template switching of the leading and lagging strand template at short inverted repeats. In the clone 3023 example, the relative read depth estimate of 2.67 copies of GAP1 is rounded to 3 copies (left) and has apparent breakpoints in the CAF4 and AIM29 genes. We classify a clone as being formed by ODIRA if it has a de novo inverted sequence in at least one breakpoint. In the clone 3023 example, the short inverted repeat pairs are CAAT, ATTG (ChrXI:508938, ChrXI: 508986) in CAF4 and TAAAA, AAAAT (ChrXI:582561, ChrXI582610) in AIM29. The contig sequence at the breakpoint (rectangle) is aligned to a reference CAF4 coding sequence fragment. The 5’ and 3’ ends of the contig are labeled and a dashed line indicates contiguity (no gaps). The contig spans the CAF4 breakpoint junction and contains a de novo inversion, i.e. two fragments of the CAF4 gene are in opposite orientations with the mediating short inverted repeats shown in blue and underlined. The contig was generated using CVish (Methods) and supported by split reads at the breakpoint junction (not shown, see JBrowse alignments in Data availability). The contig containing a de novo inversion across the AIM29 breakpoint is not shown. ODIRA typically forms tandem triplications with an inverted middle copy and contains an ARS (bottom). (C) Non-allelic homologous recombination (NAHR) is defined by having at least one CNV breakpoint not at the proximate LTR sites, that is other homologous sequences in the genome. In the clone 2924 example, we detect a hybrid sequence between the two homologous sequences in BET3 (ChrXI) and SPT4 (ChrVI). Because these two sequences are on different chromosomes we infer that an interchromosomal translocation occurred. The other breakpoint is unresolved. A read depth plot supports an amplified segment containing the GAP1 gene. NAHR is able to produce supernumerary chromosomes as is the case in Clone 2968 (Figure 5A). (D) Transposon-mediated mechanism is defined by an inference of at least one intermediate novel LTR retrotransposon insertion followed by LTR NAHR. In the ALL∆ strains which have the flanking LTRs deleted, we find novel LTR retrotransposon insertions near previously deleted LTR sites. The newly deposited LTR sequence (downstream of GAP1) (brown oval) recombines with another LTR sequence (upstream of GAP1). The upstream LTR (white and brown rectangle) is either pre-existing or introduced by a second de novo retrotransposition. Depending on the relative position of the upstream LTR to the GAP1 gene, focal or segmental amplifications form. In the case of clone 3019, a focal amplification formed after two novel LTR transposition events flanking the GAP1 gene and subsequent LTR NAHR. In the case of clones 3107 and 3022, segmental amplification formed after recombination between the downstream LTR and a pre-existing LTR sequence 30 and 70 kb upstream, respectively. Read depth estimation (not shown) supports CNV breakpoints at pre-existing or inferred newly deposited LTRs. (E) Violin plot of CNV length in each genome-sequenced clone, n=177. Strain has a significant effect on CNV length, Kruskal-Wallis test, p=1.008 x 10⁻⁵. Pairwise wilcoxon rank sum test with bonferroni correction show significant CNV length differences between WT and LTR∆ (p=0.00490), WT and ALL∆ (p=0.01230), LTR∆ and ARS∆ (p=0.00056), ARS∆ and ALL∆ (p=0.002). (F) Barplot of inferred CNV mechanisms, described in A-D, for each CNV clone isolated from glutamine-limited evolving populations. Complex CNV is defined by a clone having more than two breakpoints in chromosome XI, indicative of having more than one amplification event. Inference came from a combination of read depth, split read, and discordant read analysis and the output of CVish (see Methods). Strain is significantly associated with CNV mechanism, Fisher’s Exact Test, p=5.0 x 10⁻⁴, n = 177. There is a significant increase in ODIRA prevalence between WT and LTR∆, chi-sq, p=0.02469. There is a significant decrease in ODIRA prevalence from WT to ARS∆ and ALL∆, chi-sq, p=0.002861 and 0.002196, respectively. There is a significant decrease of LTR NAHR from WT to LTR∆, chi-sq, p=0.03083.
Figure 4—figure supplement 1
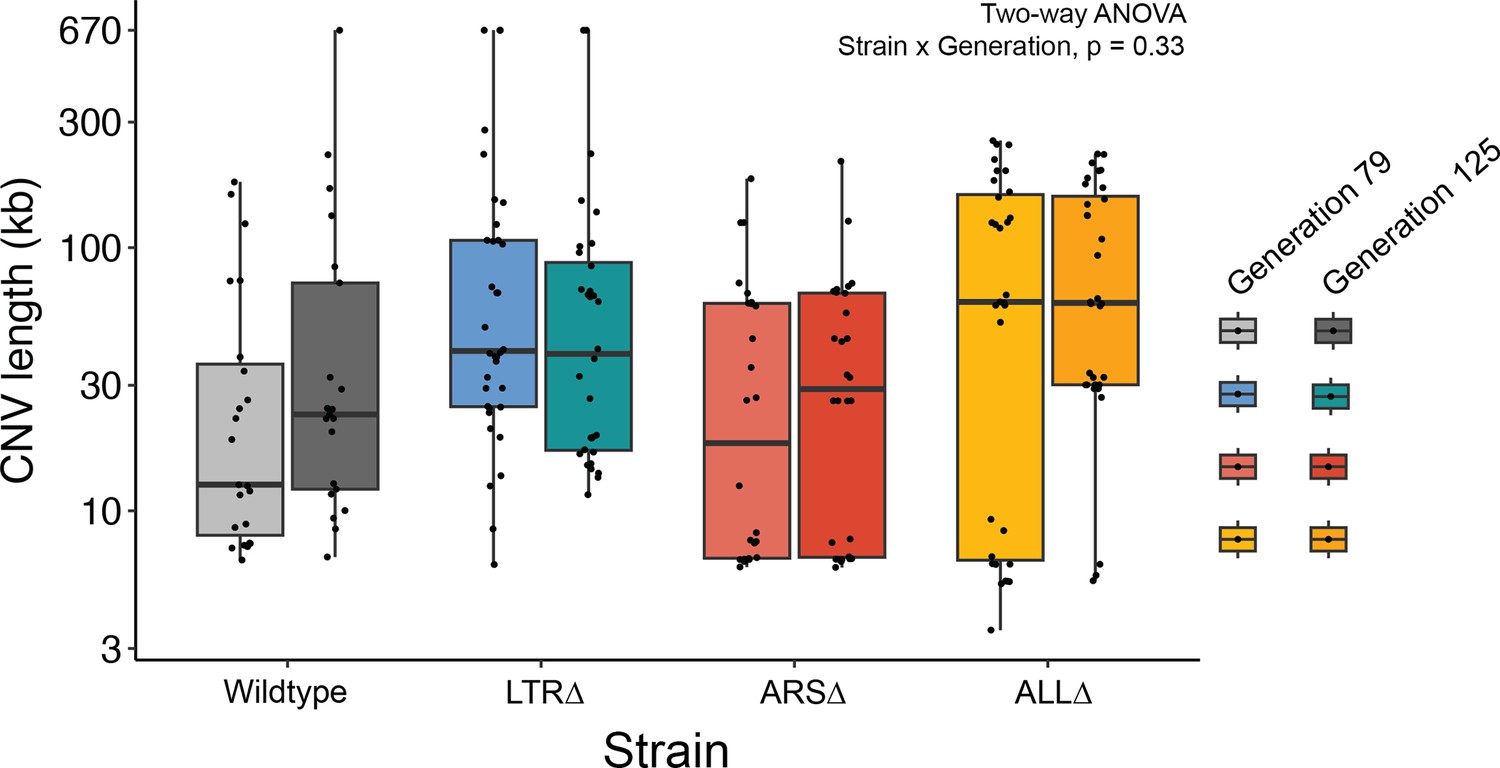
No significant interaction between strain and generation on CNV length.
Boxplot of CNV length of clones by strain and generation of isolation. There is no significant interaction between strain and generation of isolated clone, and no significant effect of generation on CNV length (Two-way ANOVA, Strain x Generation, p=0.33).
Figure 4—figure supplement 2
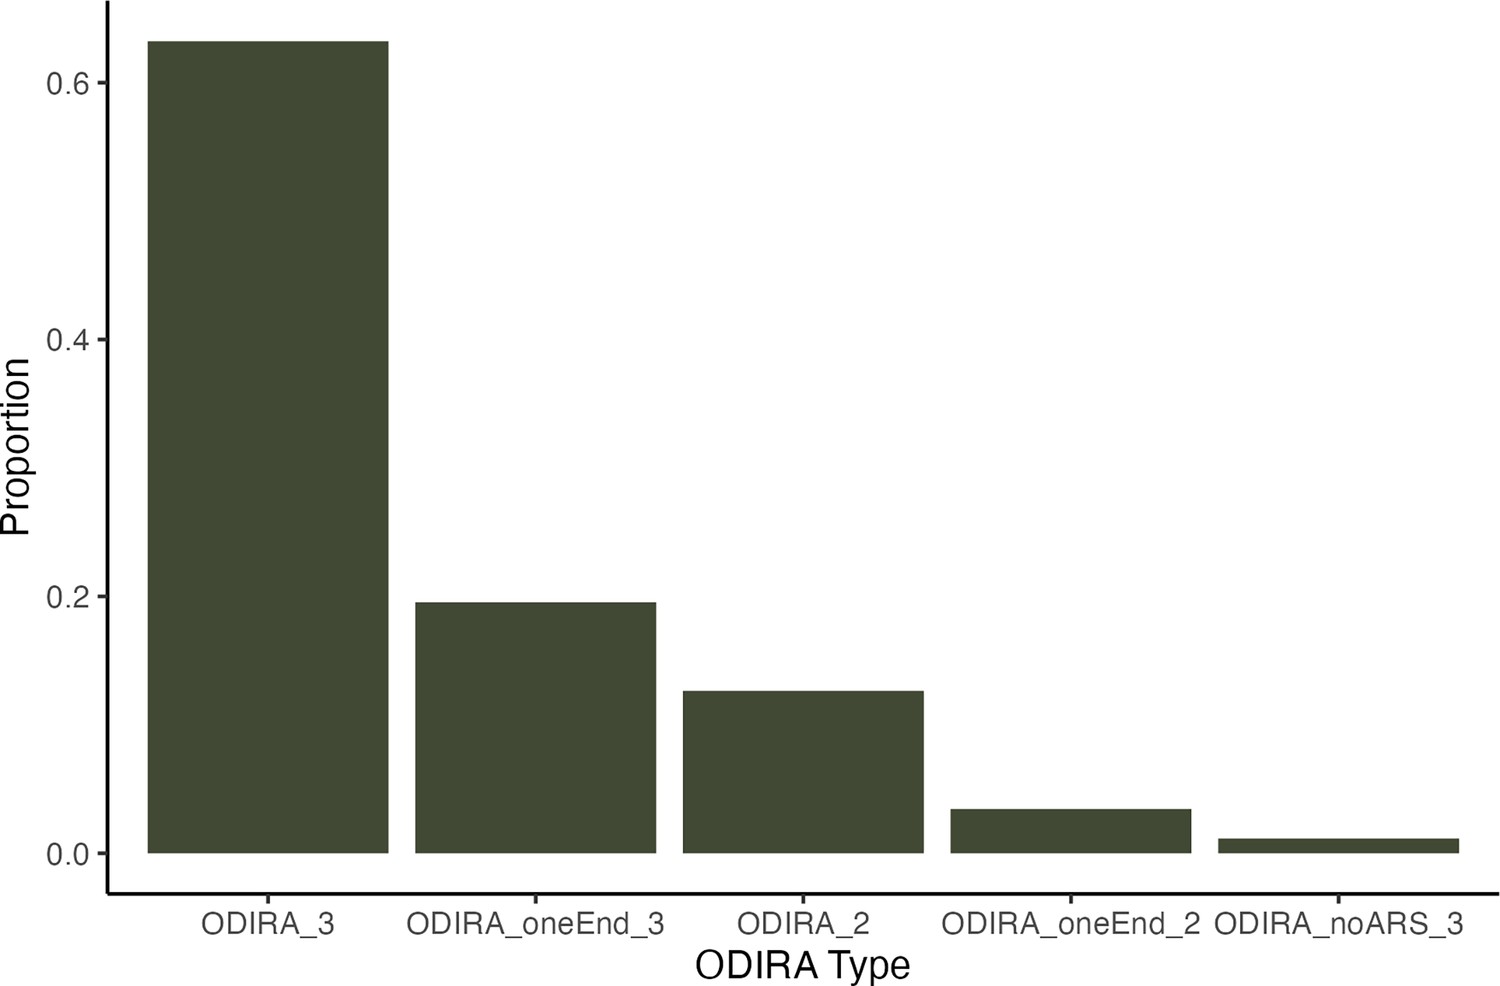
Types of ODIRA detected.
We found 87 ODIRA clones total regardless of strain. The majority of ODIRA clones fit the canonical definition of having two inverted junctions and 3 copies, 55/87 clones (63%) (ODIRA_3). We found four non-canonical types. We found 17 clones (20%) with only one inverted junction detected and 3 copies (ODIRA_oneEnd_3). We found 11 clones (13%) with two inverted junctions but only 2 copies (ODIRA_2) which may result from hairpin-capped double strand break repair. We found 3 clones (3.4%) with only one inverted junction detected and 2 copies (ODIRA_oneEnd_2). We found 1 clone (1.1%) with two inverted junctions but the amplified region did not contain an ARS.
Figure 4—figure supplement 3
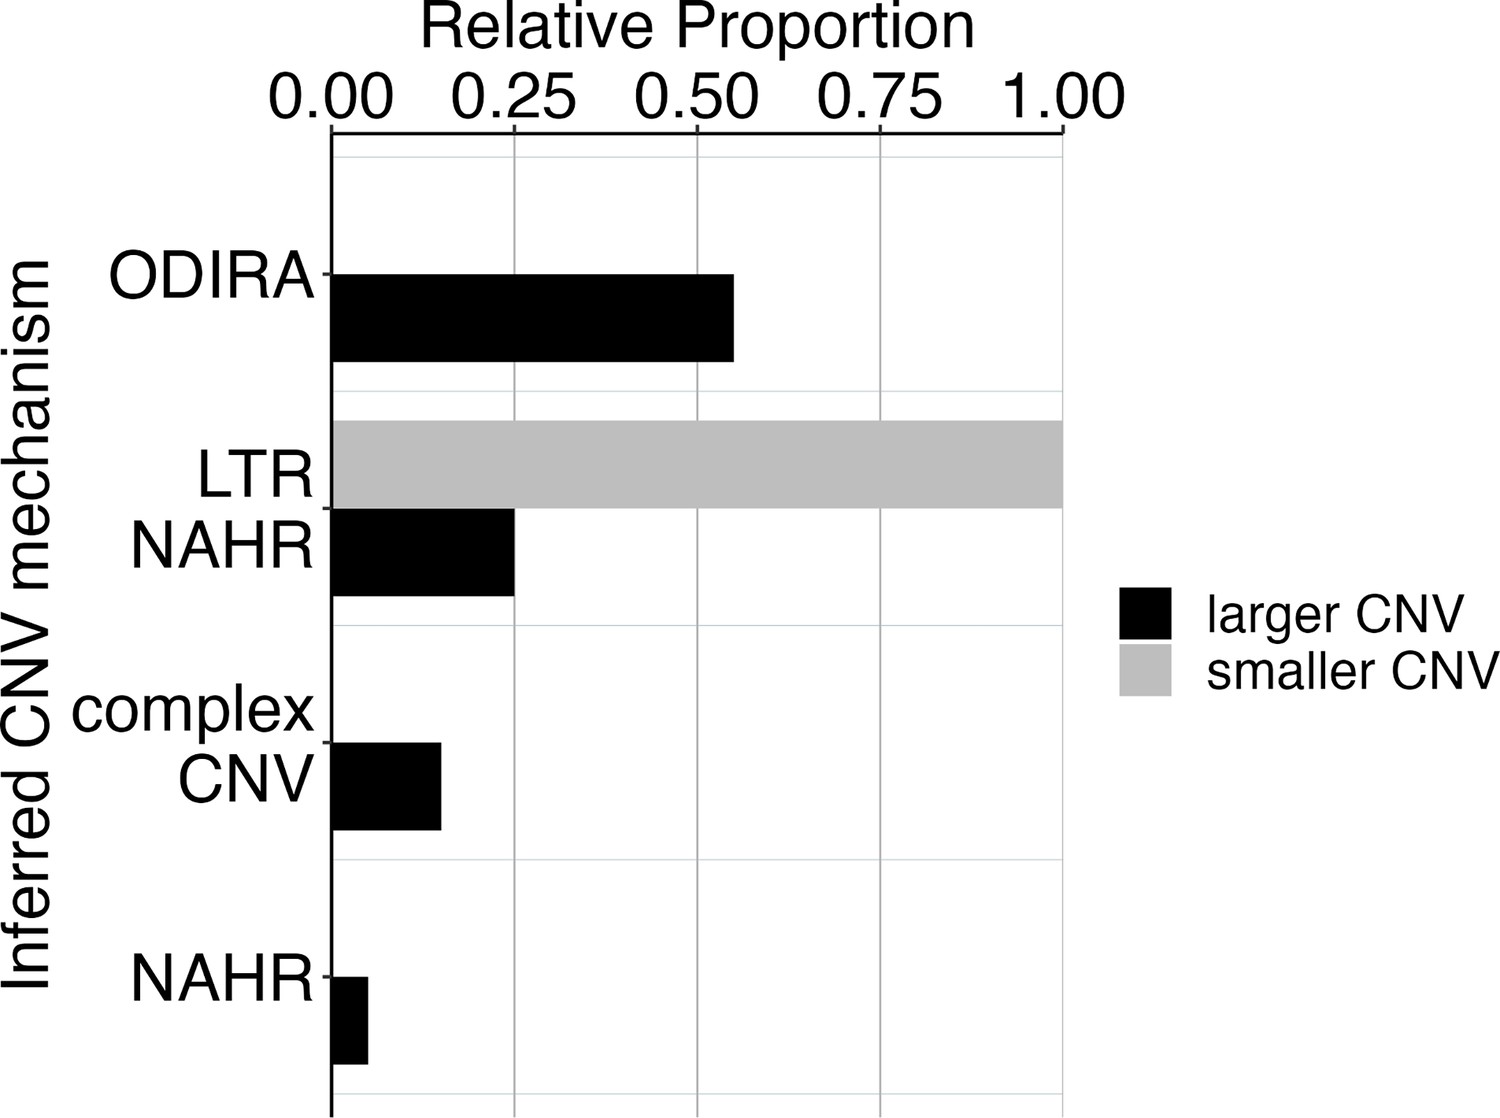
CNV mechanisms in ARS∆ clones.
Two CNV sizes in ARS∆ clones correspond to different CNV mechanisms. We found two different groups of CNV lengths in the ARS∆ clones. 100% of smaller CNVs (6–8 kb) correspond with a mechanism of NAHR between LTRs flanking the GAP1 gene. Larger CNVs (8 kb-200kb) correspond with other mechanisms that tend to produce larger CNVs, including ODIRA and NAHR between distal LTR elements. The smaller CNVs are indeed focal amplifications of GAP1 that are 8 kb or less.
Figure 5

Local and distal elements contribute to the formation of GAP1 CNV alleles.
(A) Top: Schematic of S. cerevisiae chromosome XI, with LTR, ARS elements, tRNA genes annotated. LTR-blue, ARS-purple, tRNA-orange, GAP1 ORF-white rectangle. Using a combination of read depth, split read, and discordant read analysis, we defined the extent of the amplified region, CNV breakpoints, and GAP1 copy number. GAP1 copy numbers were estimated using read depth relative to the average read depth of chromosome XI. Bottom: Dumbbell plots represent the amplified region (>1 copy) relative to the WT reference genome. The ends of the dumbbells mark the approximate CNV breakpoints shown relative to the start codon of the GAP1 ORF (vertical dotted line). Select clones were chosen as representative of the observed diversity of amplifications in this study. (B) Scatterplots of CNV length for all genome-sequenced clones, n = 177. We defined the upstream and downstream breakpoints as kilobases away from the start codon of the GAP1 ORF (vertical dashed line in A and this scatterplot). CNV mechanisms are defined in Figure 4A-D and Methods. Select clones from A are annotated with their clone ID number. Note the focal amplications resulting from LTR NAHR in WT clones and ARS∆ clones, respectively. In ARS∆, additionally note NAHR between one local and one distal LTR ~60 kb upstream. Note in ALL∆, focal amplications were likely mediated by two newly deposited LTR sequences from two transposon insertions. Additionally, note in ALL∆ amplifications formed between one newly inserted LTR and one distal pre-existing LTR sequence, ~30 kb or ~70 kb upstream.
Tables
Table 1
Model parameters and priors.
Fixed parameters from Avecilla et al., 2022; Hall et al., 2008; Joseph and Hall, 2004; Venkataram et al., 2016.
| Parameter | Description | Prior / Fixed value |
|---|---|---|
| GAP1 CNV selection coefficient | ||
| GAP1 CNV formation rate | ||
| Proportion of pre-existing cells with GAP1 CNV | ||
| Beneficial SNV selection coefficient | ||
| Beneficial SNV formation rate |
Additional files
-
Supplementary file 1
Summary of genome sequence analysis of clones containing a single copy of the GAP1 CNV reporter.
Estimated copy number of the GAP1 gene and inserted GFP gene of sequenced clones from five 1-copy-GFP minor subpopulations of the WT genome architecture strain. Copy number estimation is defined as the read depth of the target gene relative to the average read depth of the chromosome XI. Populations 1, 2, 4, 5 contain clones harboring GAP1 CNVs but only 1 copy of GFP. Clones from population 3 and 5 harbor 1 copy each of GAP1 and GFP suggesting these lineages have beneficial mutations elsewhere in the genome, allowing coexistence with the GAP1 CNV major subpopulation. CN, copy number, CNV = copy number variant, GAP1=general amino acid permease gene.
- https://cdn.elifesciences.org/articles/98934/elife-98934-supp1-v1.zip
-
Supplementary file 2
Estimation of network confidence.
The coverage, defining the probability that the true parameter falls within the 95% highest density interval (HDI) of the posterior distribution, for 829 synthetic simulations in which the final reported GAP1 CNV proportion is at least 0.3. 95% HDI was calculated for each simulation using 200 posterior samples. Our neural density estimator is slightly over-confident for (coverage of 0.934), and under-confident for GAP1 CNV selection coefficient and formation rate (coverage of 0.992 for and 0.995 for ). Despite this under-confidence, the posterior distributions are narrow in biological terms: the 95% HDI represents less than an order of magnitude for both and . Thus, we did not apply post-training adjustments to the neural density estimator, such as calibration (Cook et al., 2006) or ensembles (Caspi et al., 2023; Hermans et al., 2022).
- https://cdn.elifesciences.org/articles/98934/elife-98934-supp2-v1.xlsx
-
Supplementary file 3
Information and equations for the evolutionary model, simulated competitions, collective posterior distribution, and genetic diversity estimations.
- https://cdn.elifesciences.org/articles/98934/elife-98934-supp3-v1.docx
-
Supplementary file 4
Inferred CNV mechanisms by strain.
Counts of inferred CNV mechanisms for each sequenced clone, n=177, separated by strain
- https://cdn.elifesciences.org/articles/98934/elife-98934-supp4-v1.xlsx
-
Supplementary file 5
Ty-associated clones and locations of novel Ty insertions.
- https://cdn.elifesciences.org/articles/98934/elife-98934-supp5-v1.xlsx
-
Supplementary file 6
CNV Clone Sequencing Analysis.
- https://cdn.elifesciences.org/articles/98934/elife-98934-supp6-v1.zip
-
Supplementary file 7
Strains used in this study.
- https://cdn.elifesciences.org/articles/98934/elife-98934-supp7-v1.xlsx
-
MDAR checklist
- https://cdn.elifesciences.org/articles/98934/elife-98934-mdarchecklist1-v1.pdf
Download links
A two-part list of links to download the article, or parts of the article, in various formats.
Downloads (link to download the article as PDF)
Open citations (links to open the citations from this article in various online reference manager services)
Cite this article (links to download the citations from this article in formats compatible with various reference manager tools)
Template switching during DNA replication is a prevalent source of adaptive gene amplification
eLife 13:RP98934.
https://doi.org/10.7554/eLife.98934.3


