Transcriptional responses in a mouse model of silicone wire embolization induced acute retinal artery ischemia and reperfusion
- Department of Ophthalmology, Renmin Hospital of Wuhan University, China
- Department of Clinical Laboratory, Institute of Translational Medicine, Renmin Hospital of Wuhan University, China
Figures
Figure 1
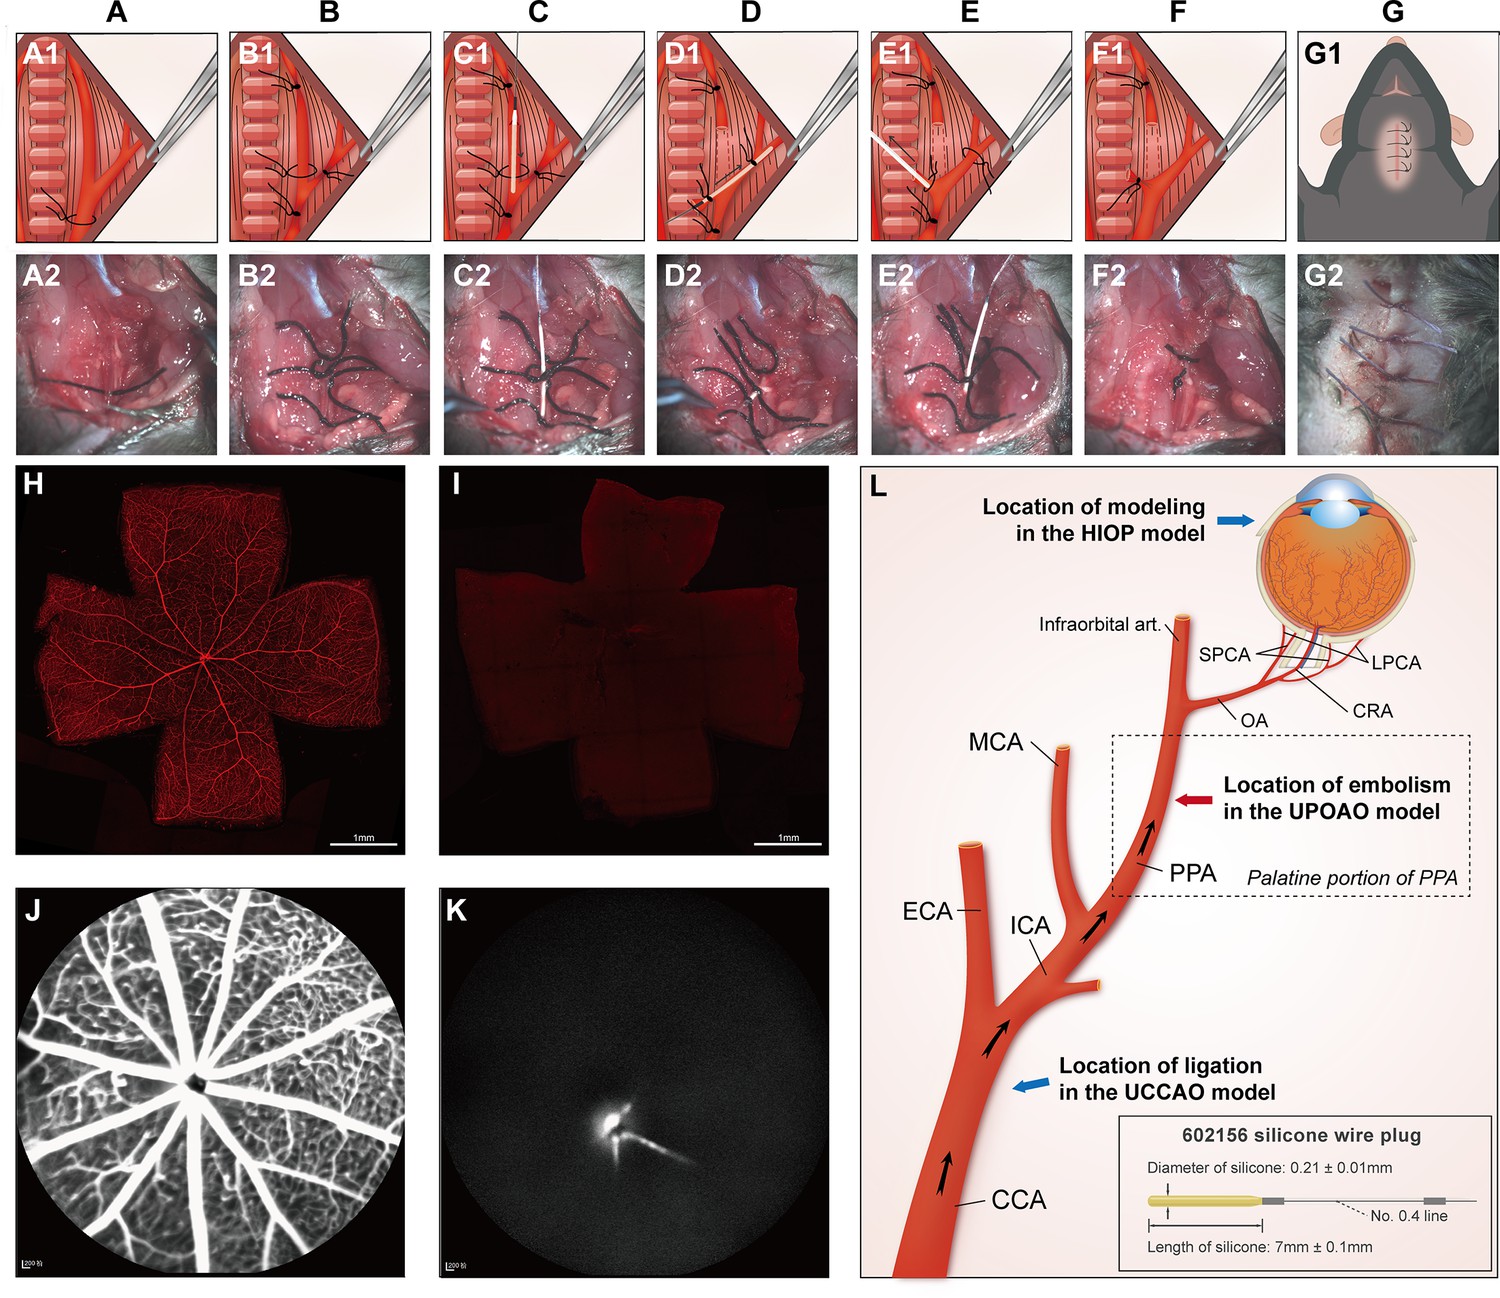
Modeling procedure, validation, and cervical artery anatomy.
(A1–G1) Schematic illustration of unilateral pterygopalatine ophthalmic artery occlusion (UPOAO). (A2–G2) Practical operation of UPOAO. (A1, A2) Blunt separation and exposure of the left cervical arteries. (B1, B2) Arterial suture ligation. (C1, C2) Insertion of the silicone wire embolus. The artery was incised to create a hole, and the silicone wire embolus was inserted. (D1, D2) Artery disconnection and movement of the silicone wire embolus. The artery was cut along the incision, and the silicone wire embolus was retracted and reinserted. (E1, E2) Removal of the silicone wire embolus and reperfusion. (F1, F2) Suture removal. The sutures at both ends of the disconnected vessel were knotted, and the other two sutures were removed. (G1, G2) Anatomic reduction and suturing of the skin. (H, I) Canavalin A label vasculature of the UPOAO mouse retina. The silicone wire embolus was inserted into the artery before perfusing rhodamine-labeled canavalin A into the heart of the UPOAO mouse. The sham eye served as an unpracticed control eye, while the UPOAO lateral eye represented the experimental eye. Retinal vessels in the sham eye (H) exhibited fluorescence filling, while retinal vessels in the UPOAO lateral eye (I) remained unfilled. Scale bar = 1 mm. (J and K) Fluorescein fundus angiography (FFA) was performed before removing the silicone wire embolus from the UPOAO mouse. The vessels in the sham lateral retina (J) were perfused, while the lateral retinal perfusion in UPOAO (K) was delayed. (L) Schematic illustration of cervical artery anatomy and ocular blood supply. Embolization of the pterygopalatine artery (PPA) resulted in ocular ischemia. The red arrow indicates the site of the silicone wire embolus occlusion. The silicone wire embolus used a type 602156 wire, extended to 7 mm with a diameter of 0.21 mm. The blue arrows indicate the modeling locations of the high intraocular pressure (HIOP) model and the unilateral common carotid artery occlusion (UCCAO) model, respectively. CCA: common carotid artery; ICA: internal carotid artery; ECA: external carotid artery; PPA: pterygopalatine artery; MCA: middle cerebral artery; Infraorbital art.: infraorbital artery; OA: ophthalmic artery; SPCA: short posterior ciliary artery; LPCA: long posterior ciliary artery; CRA: central retinal artery.
Figure 2
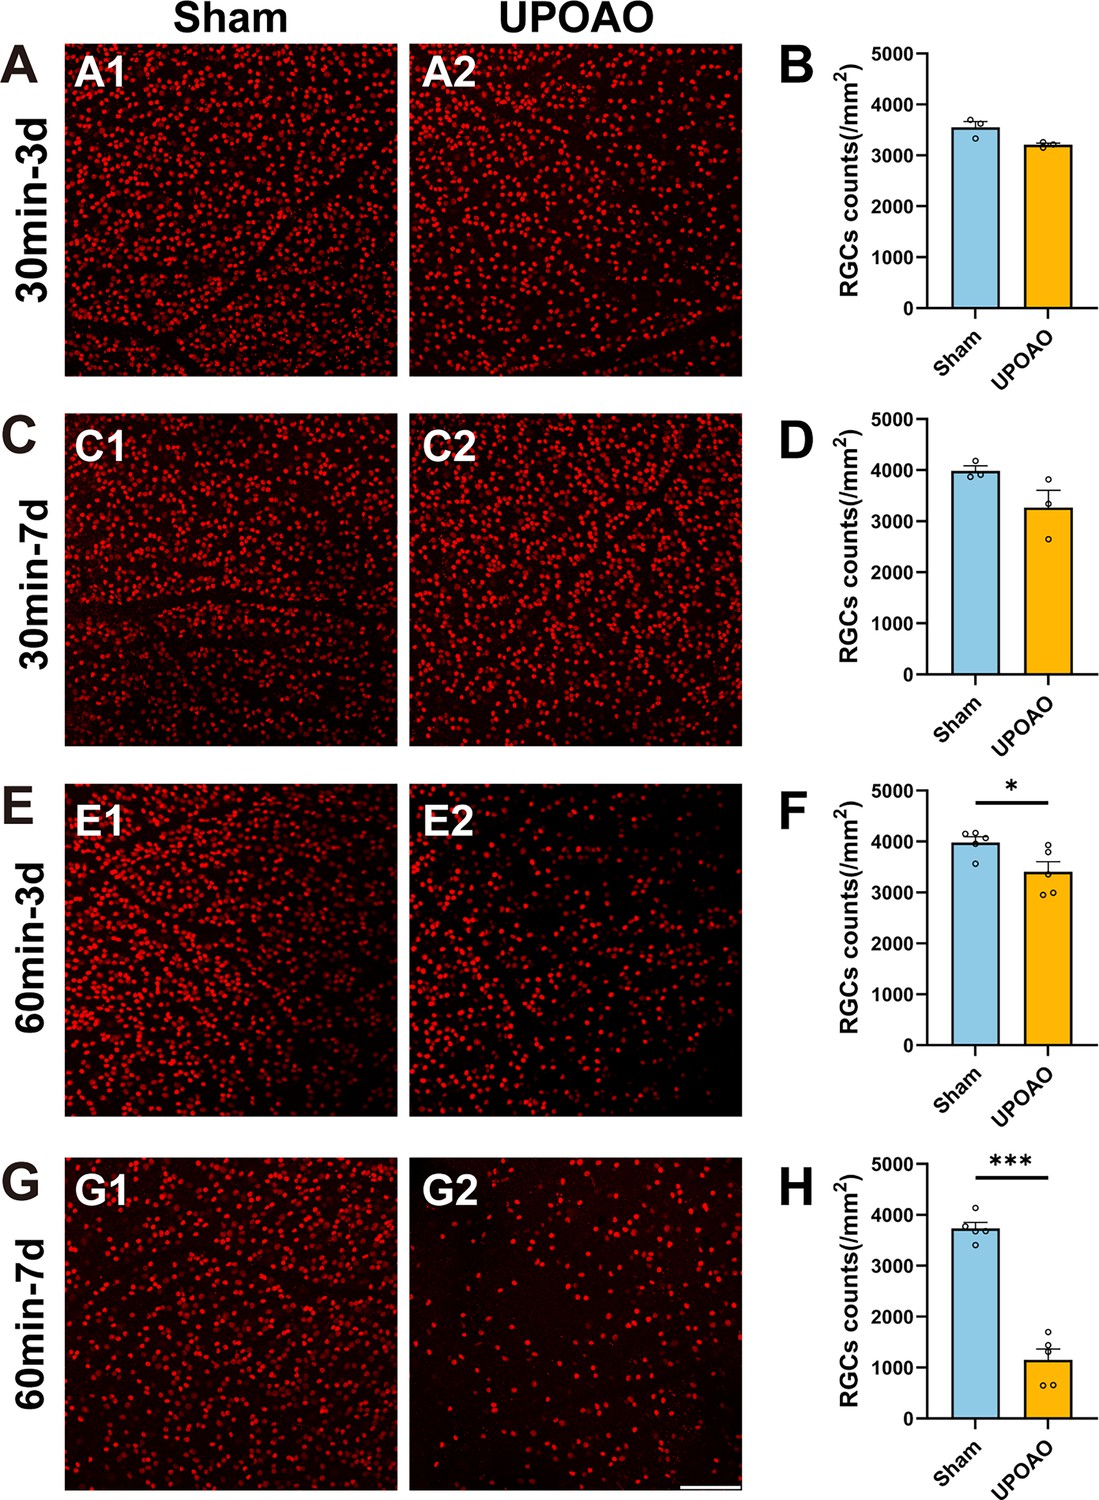
Staining and quantification of retinal ganglion cells (RGCs) at different ischemia and reperfusion times.
Flat-mounted retina RGCs were labeled with Brn3a staining. (A, B) Representative pictures of the peripheral field (A), and quantification of surviving RGCs in all fields (B) in the 30 min ischemia and 3 days reperfusion group. n=3. (C, D) Representative pictures of the peripheral field (C), and quantification of surviving RGCs in all fields (D) in the 30 min ischemia and 7 days reperfusion group. n=3. (E, F) Representative pictures of the peripheral field (E), and quantification of surviving RGCs in all fields (F) in the 60 min ischemia and 3 days reperfusion group. n=5. (G, H) Representative pictures of the peripheral field (G), and quantification of surviving RGCs in all fields (H) in the 60 min ischemia and 7 days reperfusion group. n=5. The results showed a significant loss of RGCs after 60 min of ischemia. Data were presented as means ± s.e.m, *p<0.05, **p<0.01, ***p<0.001, ****p<0.0001, t-test. Scale bar = 100 μm.
Figure 3 with 1 supplement
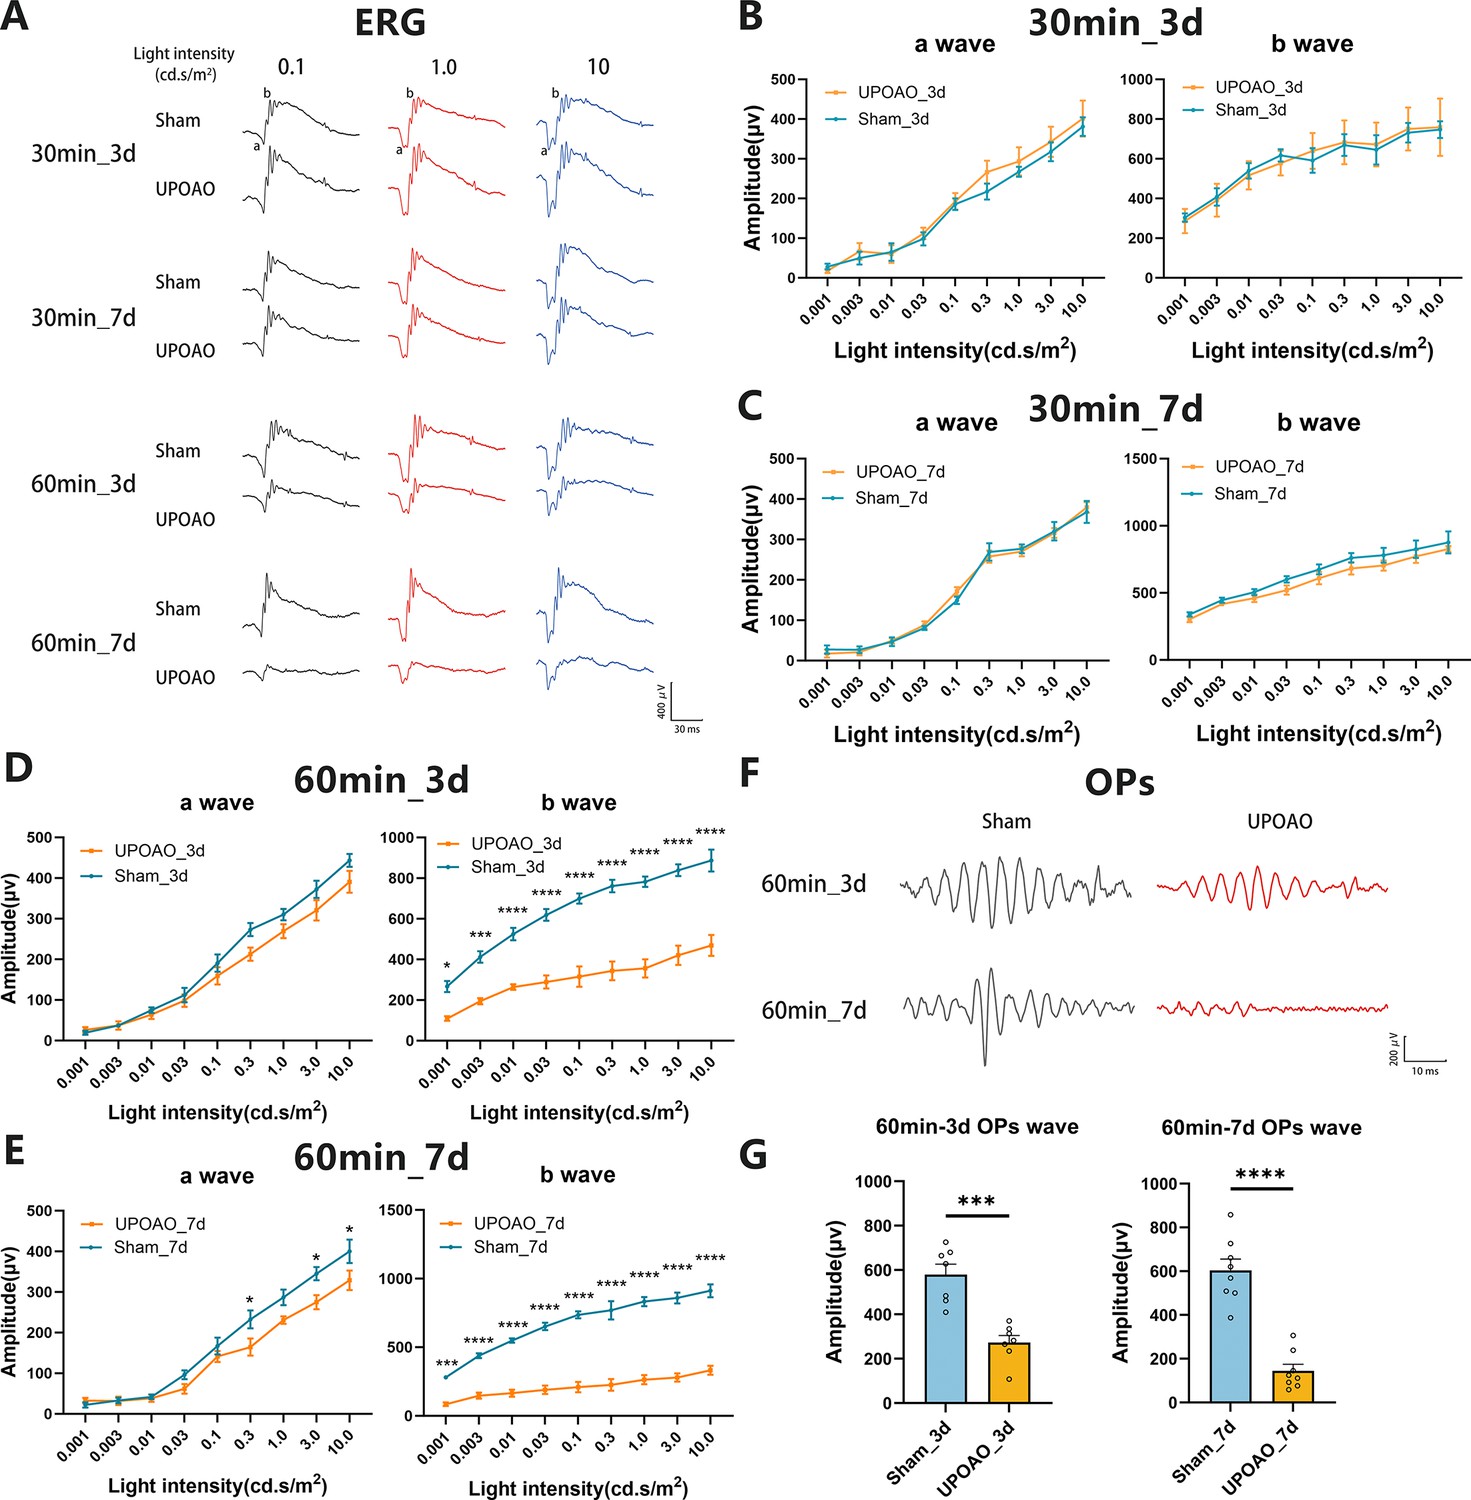
Comparison of electroretinographic (ERG) dark-adapted responses at different ischemia and reperfusion times.
Following the evaluation of surviving retinal ganglion cells (RGCs), visual function in sham and unilateral pterygopalatine ophthalmic artery occlusion (UPOAO) experimental eyes at various ischemia and reperfusion times was assessed using ERG. (A) Representative waveforms in the four groups at the stimulus light intensities of 0.1, 1.0, and 10.0 cd.s/m2, respectively. (B) Quantification of a-wave and b-wave amplitudes in the 30 min ischemia and 3 days reperfusion group. n=5. (C) Quantification of a-wave and b-wave amplitudes in the 30 min ischemia and 7 days reperfusion group. n=5. (D) Quantification of a-wave and b-wave amplitudes in the 60 min ischemia and 3 days reperfusion group. n=7. (E) Quantification of a-wave and b-wave amplitudes in the 60 min ischemia and 7 days reperfusion group. n=8. Dark-adapted responses showed almost similar a-wave amplitudes but significantly decreased b-wave amplitudes in the 60 min ischemia groups. The amplitudes of b-waves declined at 3 days and even more prominently at 7 days. (F, G) Representative oscillatory potentials (OPs) and quantification of amplitudes in the 60 min ischemic groups. n=7 in the 3 days reperfusion group; n=8 in the 7 days reperfusion group. The amplitudes of OPs decreased significantly at 7 days reperfusion. The decline in b-waves and OPs along with the loss of RGCs, supports the selection of a 60 min ischemic duration as an appropriate choice. Data were presented as means ± SEM, *p<0.05, **p<0.01, ***p<0.001, ****p<0.0001, two-way ANOVA test for a-waves and b-waves; paired t-test for OPs.
Figure 3—figure supplement 1
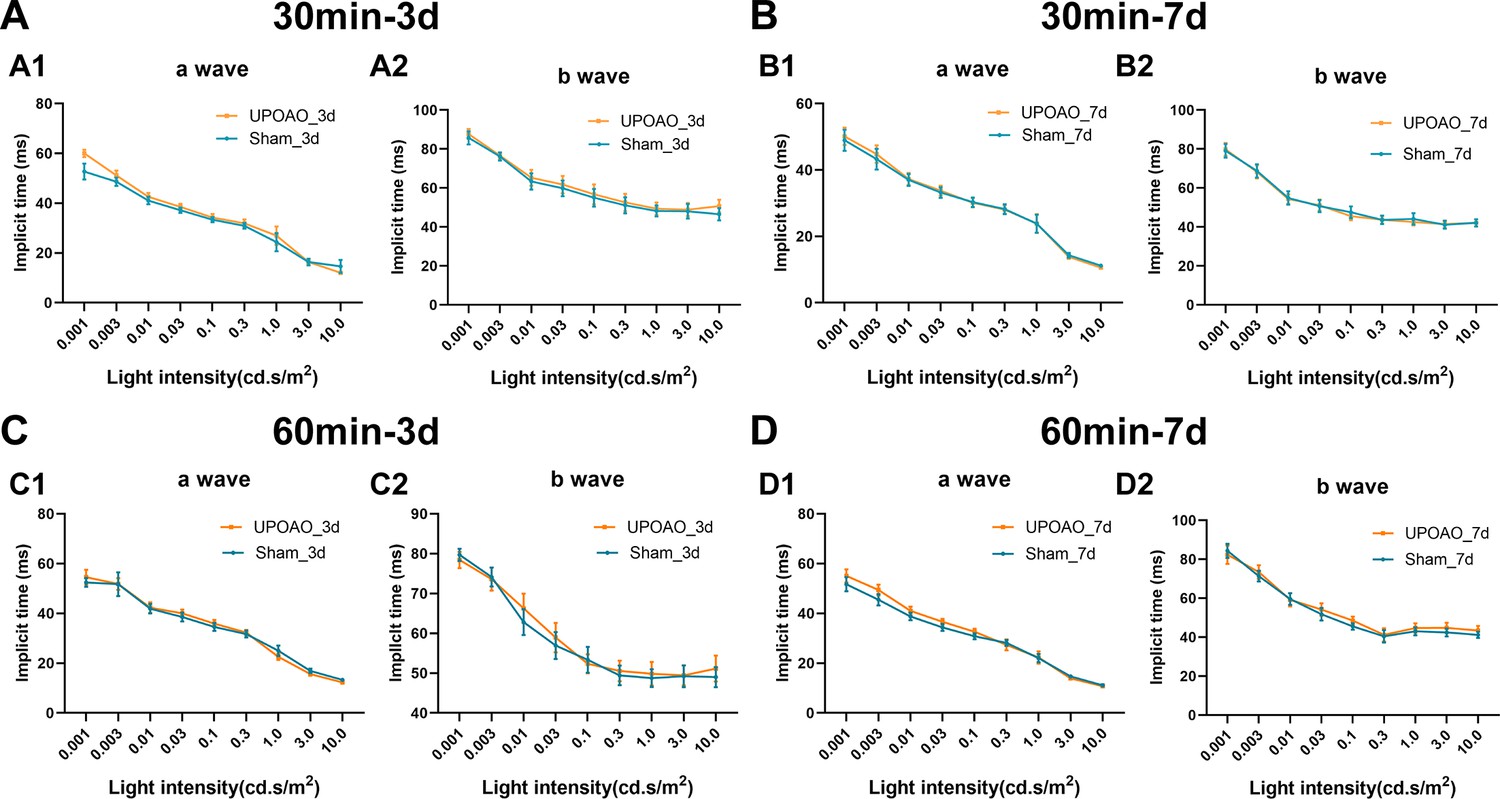
Response times of a-waves and b-waves in electroretinographic (ERG) at different light intensities.
(A, B) Response times of a-waves and b-waves were measured under different light intensities at 3 days and 7 days post-unilateral pterygopalatine ophthalmic artery occlusion (UPOAO) in the 30 min ischemia group. n=5. (C, D) Response times of a-waves and b-waves were measured under different light intensities at 3 days and 7 days post-UPOAO in the 60 min ischemia group. n=7 at 3 days; n=8 at 7 days. Data were presented as means ± SEM, *p<0.05, **p<0.01, ***p<0.001, ****p<0.0001, two-way ANOVA test.
Figure 4 with 1 supplement
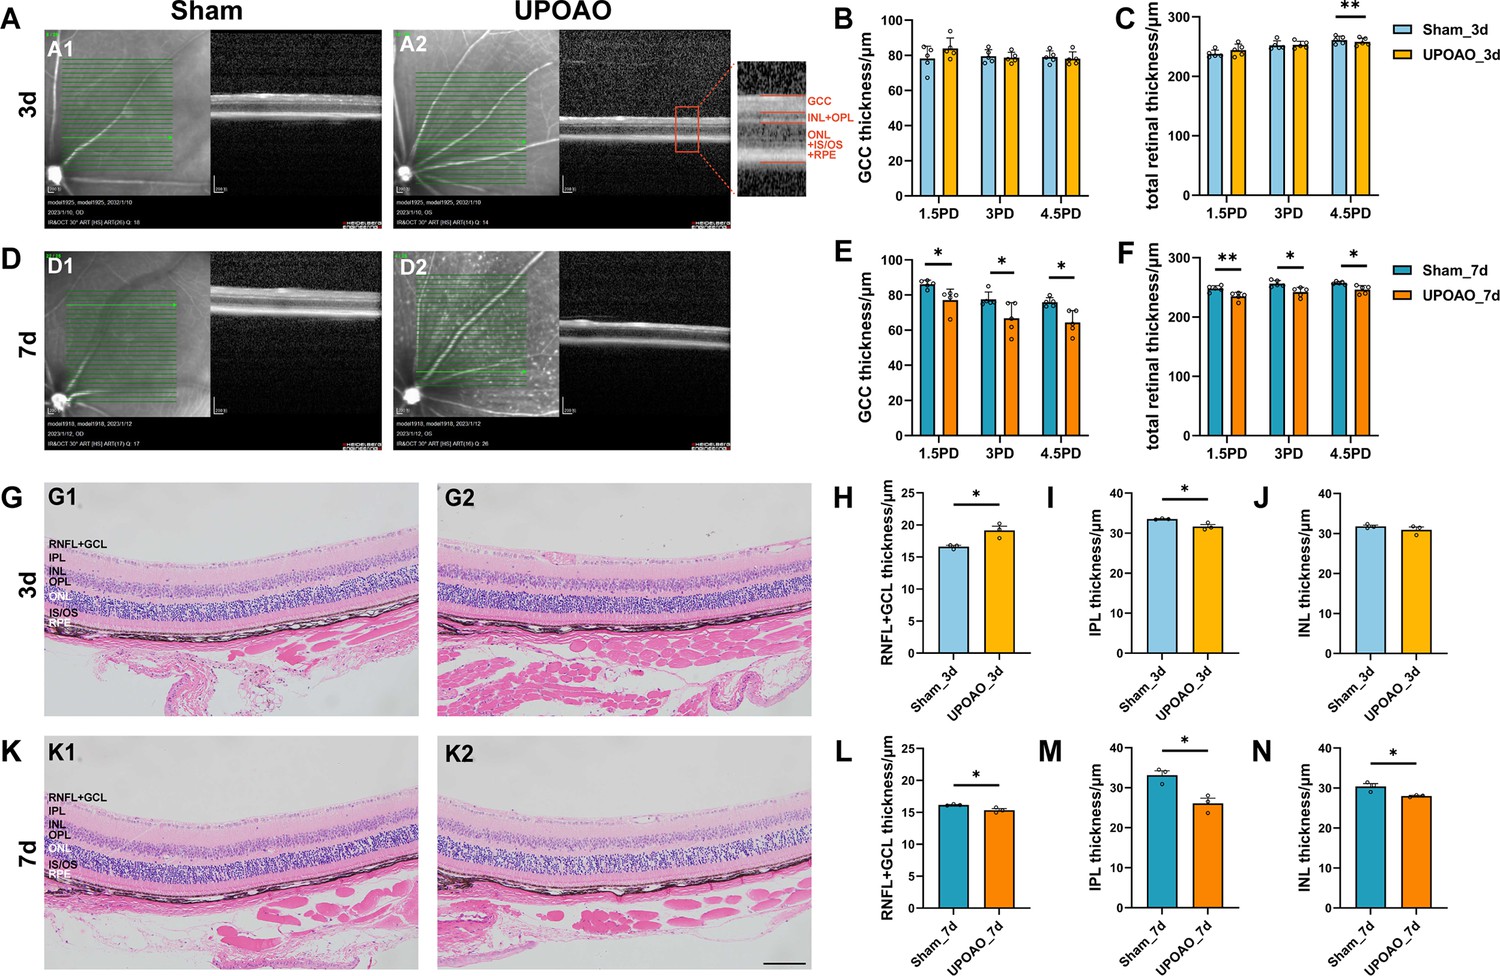
Changes in retina morphology in the unilateral pterygopalatine ophthalmic artery occlusion (UPOAO) model.
(A) Representative optical coherence tomography (OCT) images of the mouse retina at 3 days. The Green lines indicate the OCT scan area starting from the optic disc. Local magnification and layering are annotated. ganglion cell complex (GCC): ganglion cell complex, including RNFL, GCL, and IPL layers. (B and C) Quantification of GCC and total retinal thickness at 3 days. The thickness of the GCC and the entire retina in OCT was measured and compared at distances of 1.5 PD, 3.0 PD, and 4.5 PD from the optic disc, respectively. n=5. (D) Representative OCT images of the mouse retina at 7 days. (E and F) Quantification of GCC and total retinal thickness at 7 days. n=5. (G) Representative hematoxylin and eosin (HE) images of the mouse retina at 3 days. (H, I and J) Quantification of nerve fibre layer (NFL) + GCL, IPL, and INL thickness at 3 days. Retinal thickness in HE was measured near the optic nerve head and compared. n=3. (K) Representative HE images of the mouse retina at 7 days. (L, M and N) Quantification of NFL + GCL, IPL, and INL thickness at 7 days. n=3. Data were presented as means ± s.e.m, *p<0.05, **p<0.01, ***p<0.001, ****p<0.0001, two-way analysis of variance (ANOVA) test in OCT and paired t-test in HE. PD: papillary diameters; RNFL: retinal nerve fiber layer; GCL: ganglion cell layer; IPL: inner plexiform layer; INL: inner nuclear layer; OPL: outer plexiform layer; ONL: outer nuclear layer; IS: inner segment; OS outer segment; RPE: retinal pigment epithelium. Scale bar = 100 μm.
Figure 4—figure supplement 1
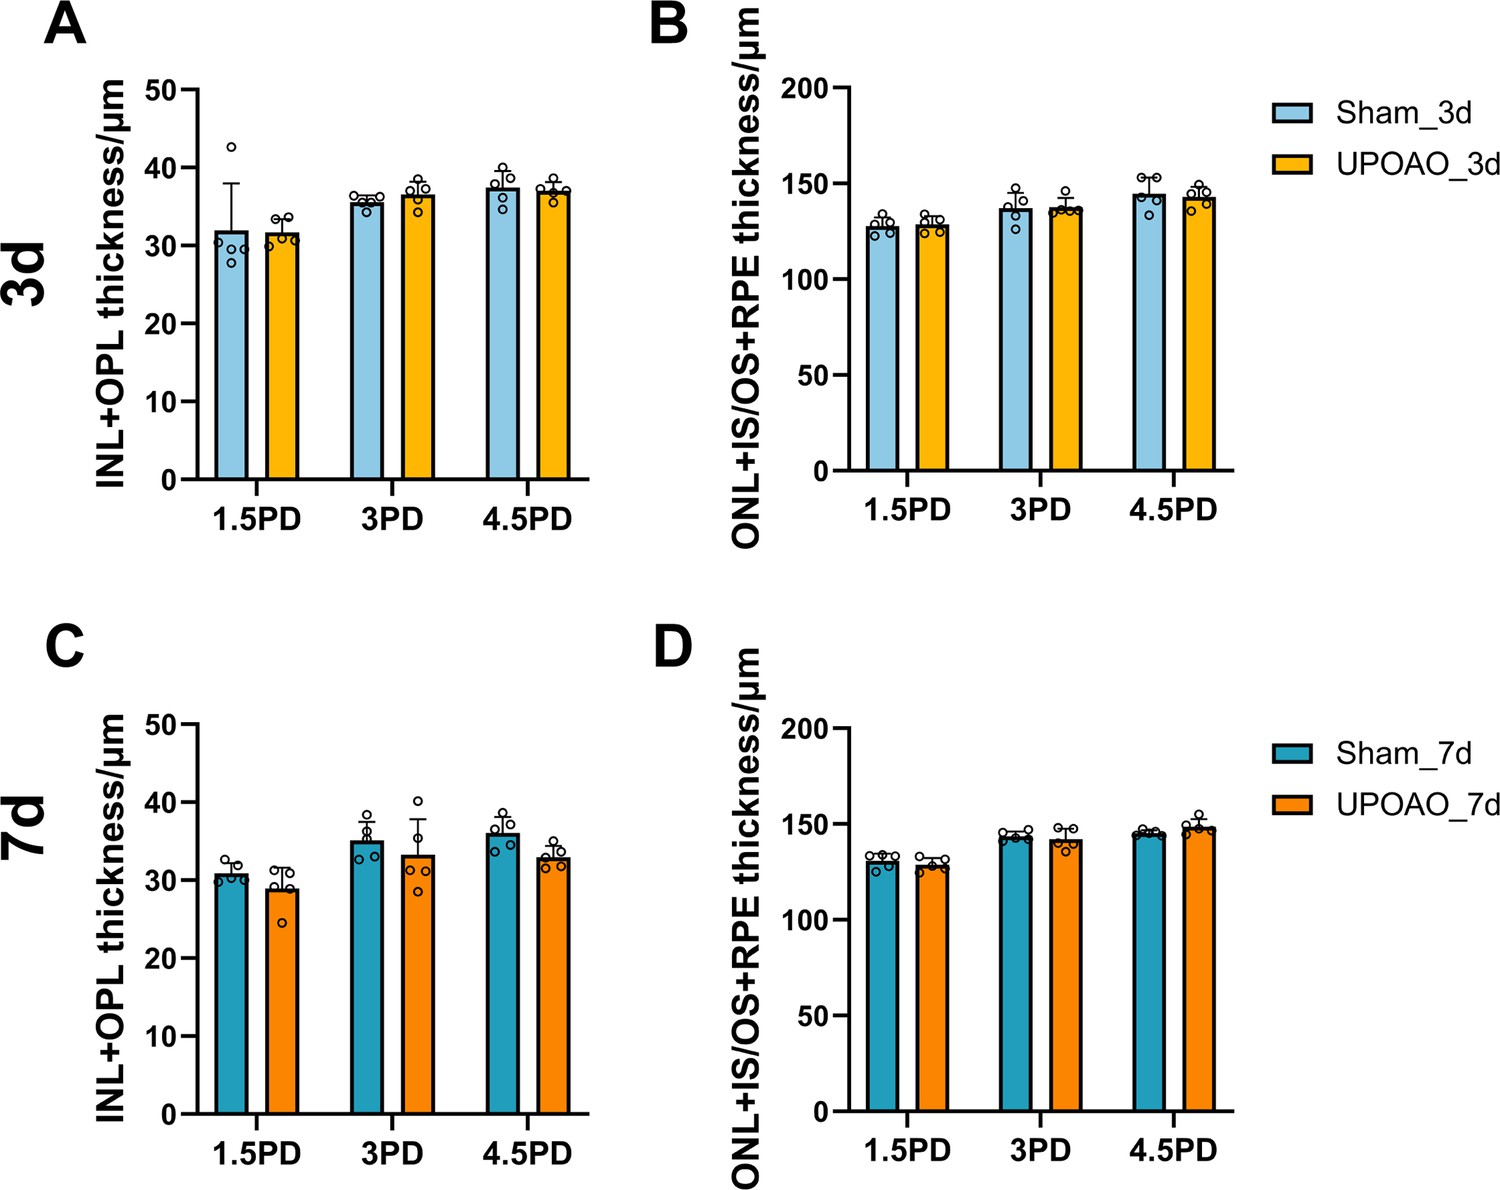
Quantification of inner nuclear layer (INL) + outer plexiform layer (OPL) thickness and outer nuclear layer (ONL) + inner segment/outer segment (IS/OS) + retinal pigment epithelium (RPE) thickness in optical coherence tomography (OCT) during 3 days and 7 days Reperfusion of unilateral pterygopalatine ophthalmic artery occlusion (UPOAO) Animals.
The INL + OPL thickness and the ONL + IS/OS + RPE thickness were measured and compared at distances of 1.5 papillary diameters (PD), 3.0 PD, and 4.5 PD from the optic disc using OCT. (A, B) Quantification of INL + OPL layer thickness (A) and ONL + IS/OS + RPE layer thickness (B) at 3 days. n=5. No significant differences were observed. (C, D) Quantification of INL + OPL layer thickness (C) and ONL + IS/OS + RPE layer thickness (D) at 7 days. n=5. No significant differences were observed. Data were presented as means ± SEM, *p<0.05, **p<0.01, ***p<0.001, ****p<0.0001, two-way analysis of variance (ANOVA) test.
Figure 5 with 1 supplement
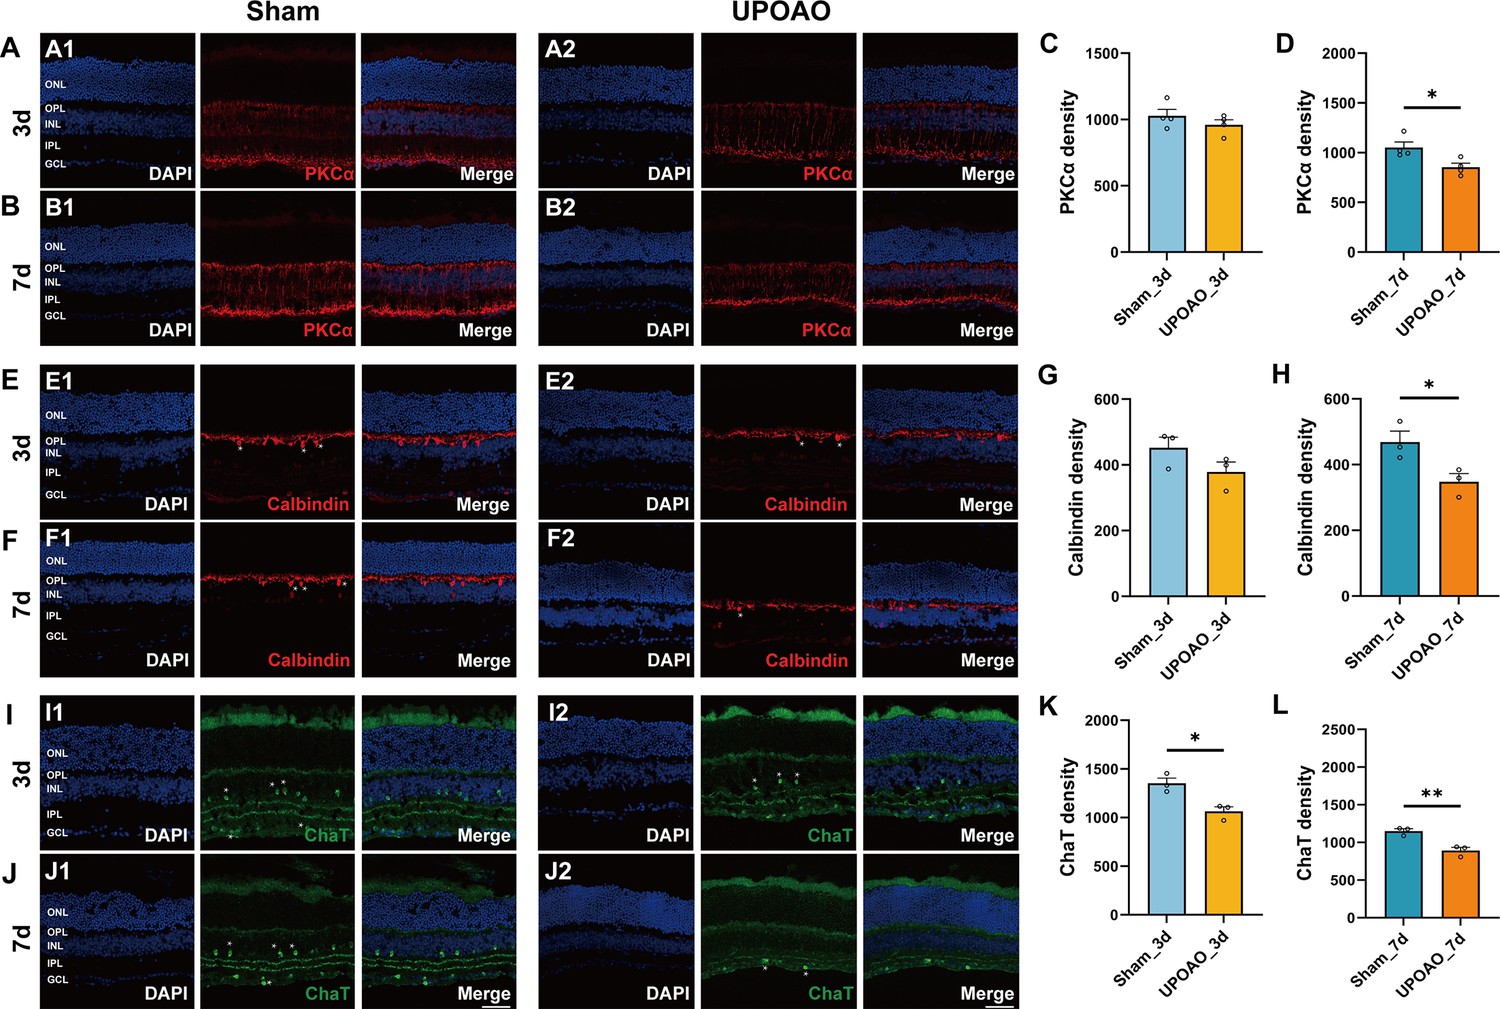
Changes in bipolar cells, horizontal cells, and cholinergic amacrine cells in unilateral pterygopalatine ophthalmic artery occlusion (UPOAO) mice.
(A) Representative images of mouse retina co-stained with DAPI and PKCα at 3 days (B) Representative images of mouse retina co-stained with DAPI and PKCα at 7 days. (C) Quantification of PKCα fluorescence density at 3 days. (D) Quantification of PKCα fluorescence density at 7 days. n=4. (E) Representative images of mouse retina co-stained with DAPI and Calbindin at 3 days. (F) Representative images of mouse retina co-stained with DAPI and Calbindin at 7 days. Horizontal cell somata are indicated by white asterisks. (G) Quantification of Calbindin fluorescence density at 3 days. (H) Quantification of Calbindin fluorescence density at 7 days. n=3. (I) Representative images of mouse retina co-stained with DAPI and ChAT at 3 days. (J) Representative images of mouse retina co-stained with DAPI and ChAT at 7 days. Cholinergic amacrine cell somata are indicated by white asterisks. (K) Quantification of ChAT fluorescence density at 3 days. (L) Quantification of ChAT fluorescence density at 7 days. n=3. Data were presented as means ± SEM, *p<0.05, **p<0.01, ***p<0.001, t-test. Scale bar = 50 μm.
Figure 5—figure supplement 1
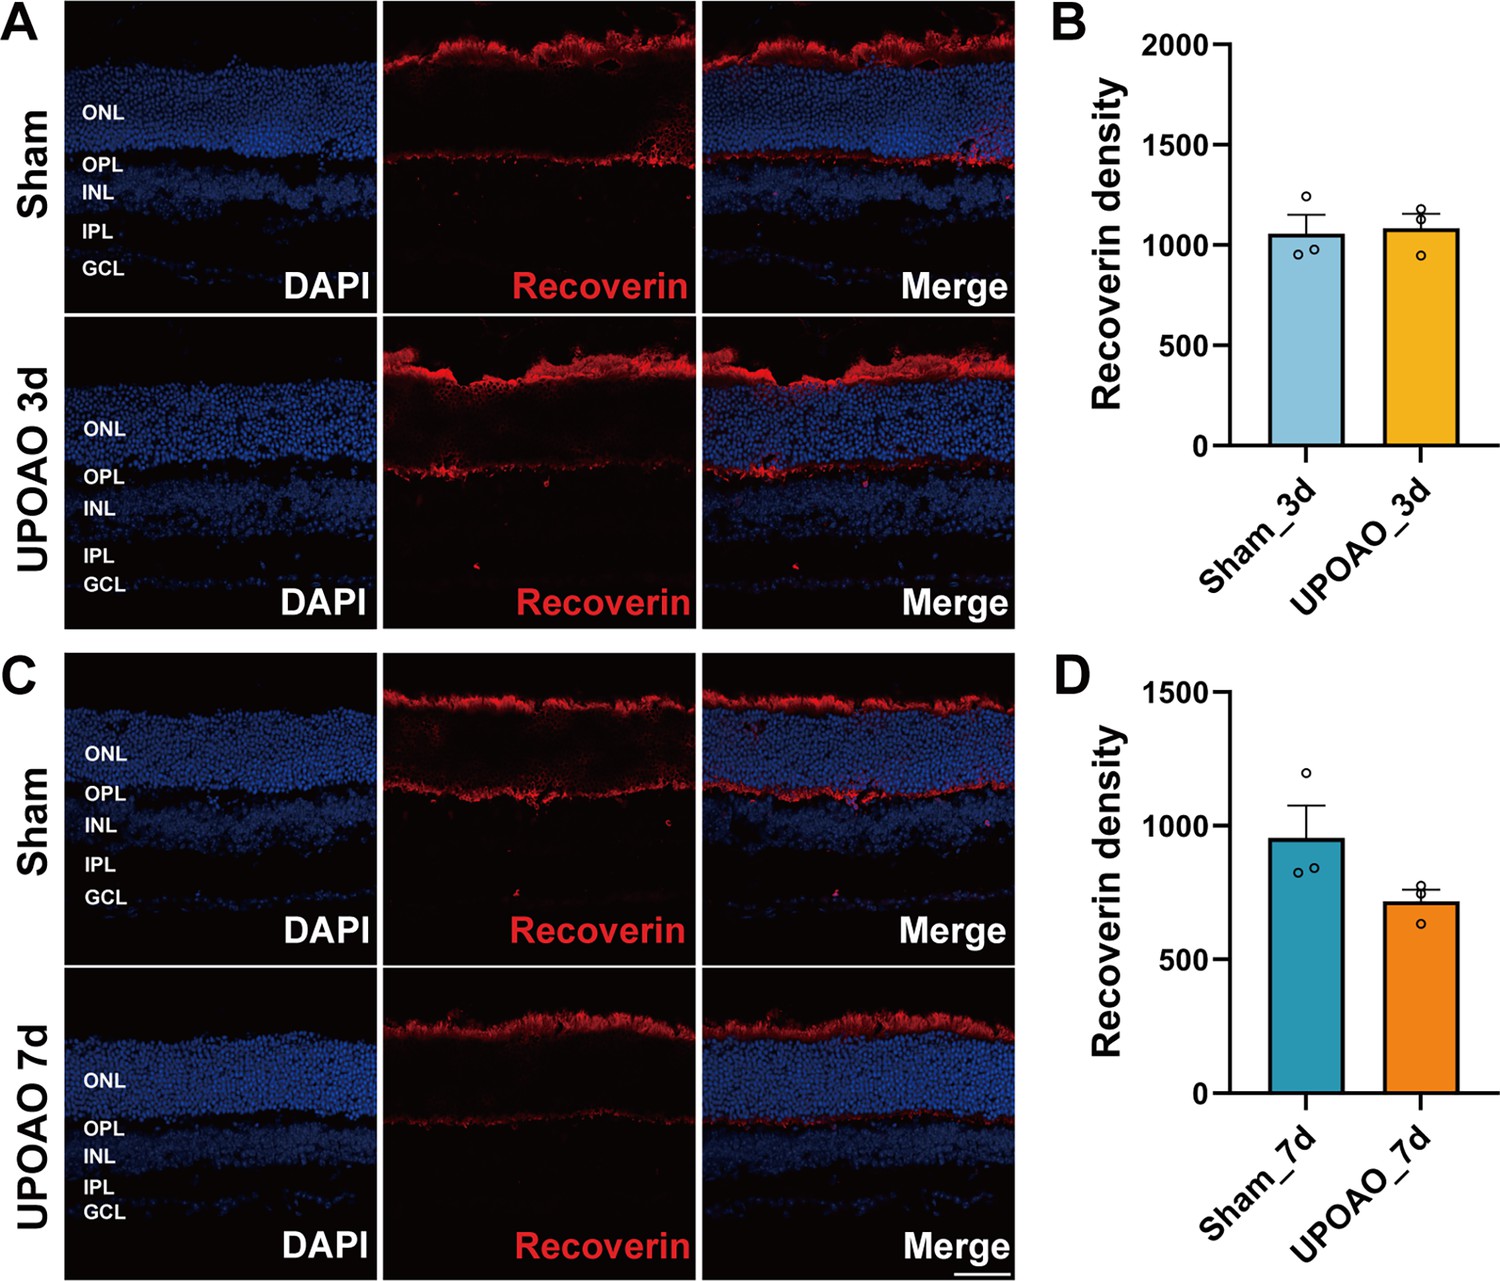
Changes in photoreceptor cells in unilateral pterygopalatine ophthalmic artery occlusion (UPOAO).
(A) Representative images of mouse retina co-stained with DAPI and Recoverin at 3 days. (B) Representative images of mouse retina co-stained with DAPI and Recoverin at 7 days. n=3. Data were presented as means ± SEM, *p<0.05, **p<0.01, ***p<0.001, ****p<0.0001, t-test. Scale bar = 50 μm.
Figure 6 with 5 supplements
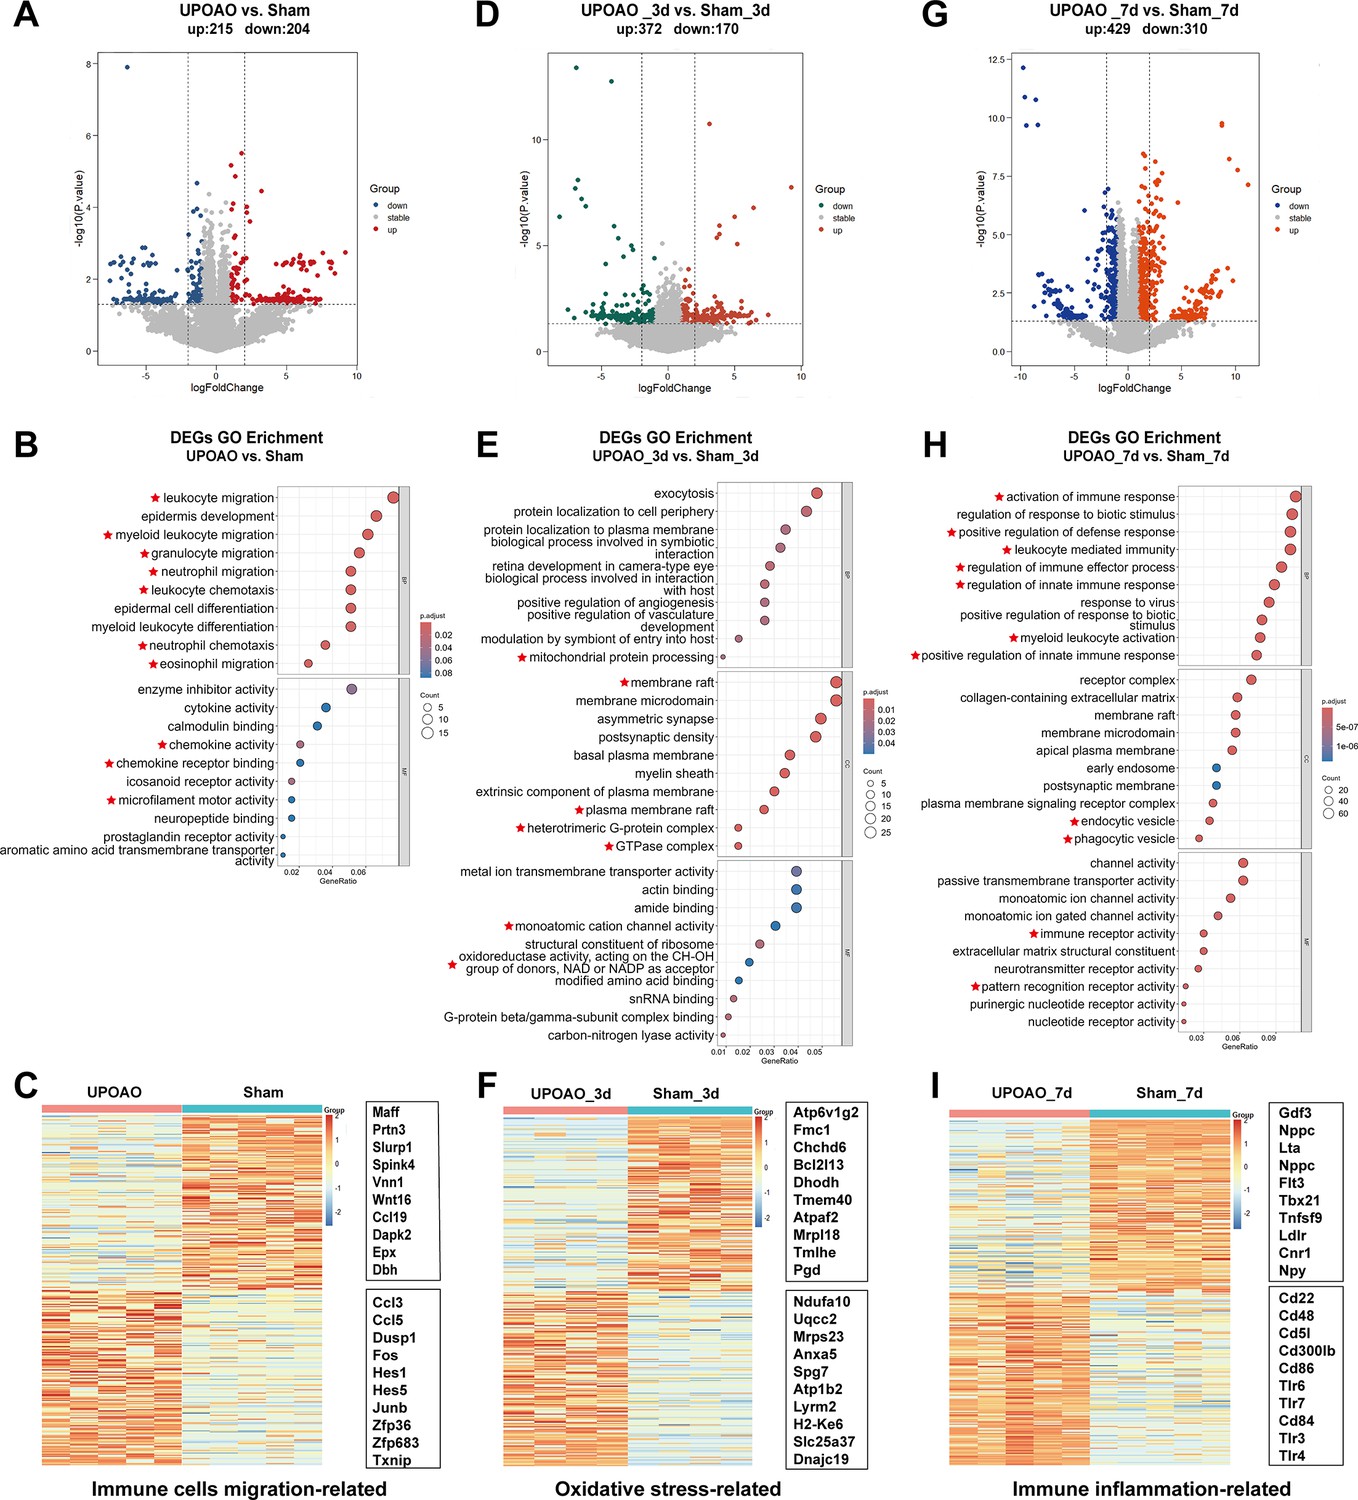
Transcriptomic features at different times of reperfusion.
RNA-seq evaluation was performed at 0 day, 3 days, and 7 days reperfusion periods in unilateral pterygopalatine ophthalmic artery occlusion (UPOAO) revealing enrichment in pathways related to immune cell migration, oxidative stress, and immune inflammation. (A, D, G) Volcano plots display differential expression genes (DEGs) between UPOAO and sham eyes in the no-perfusion group (A), 3 days perfusion group (D), and 7 days perfusion group (G), respectively. Red dots: significantly upregulated genes, green and blue dots: significantly downregulated genes, and gray dots: stable expressed genes, adjusted p<0.05. log2FC = 1. (B, E, H) Gene ontology (GO) analysis of differential genes in the non-perfusion group (B), 3 days group (E), and 7 days group (H). The DEGs between UPOAO and sham eyes were enriched in pathways associated with immune cell migration (0d), oxidative stress (3d), and immune inflammation (7d), respectively. (C, F, I) Heatmap displaying the top 100 downregulated and top 100 upregulated DEGs between UPOAO and sham at non-perfusion, 3 days, and 7 days reperfusion, respectively. The box represents the genes related to immune cell migration (C), oxidative stress (F), and immune inflammation (I). The ranking was determined by the magnitude of fold change. In each heatmap, the upper box represents the top 10 downregulated genes, while the lower box represents the top 10 upregulated genes.
Figure 6—figure supplement 1
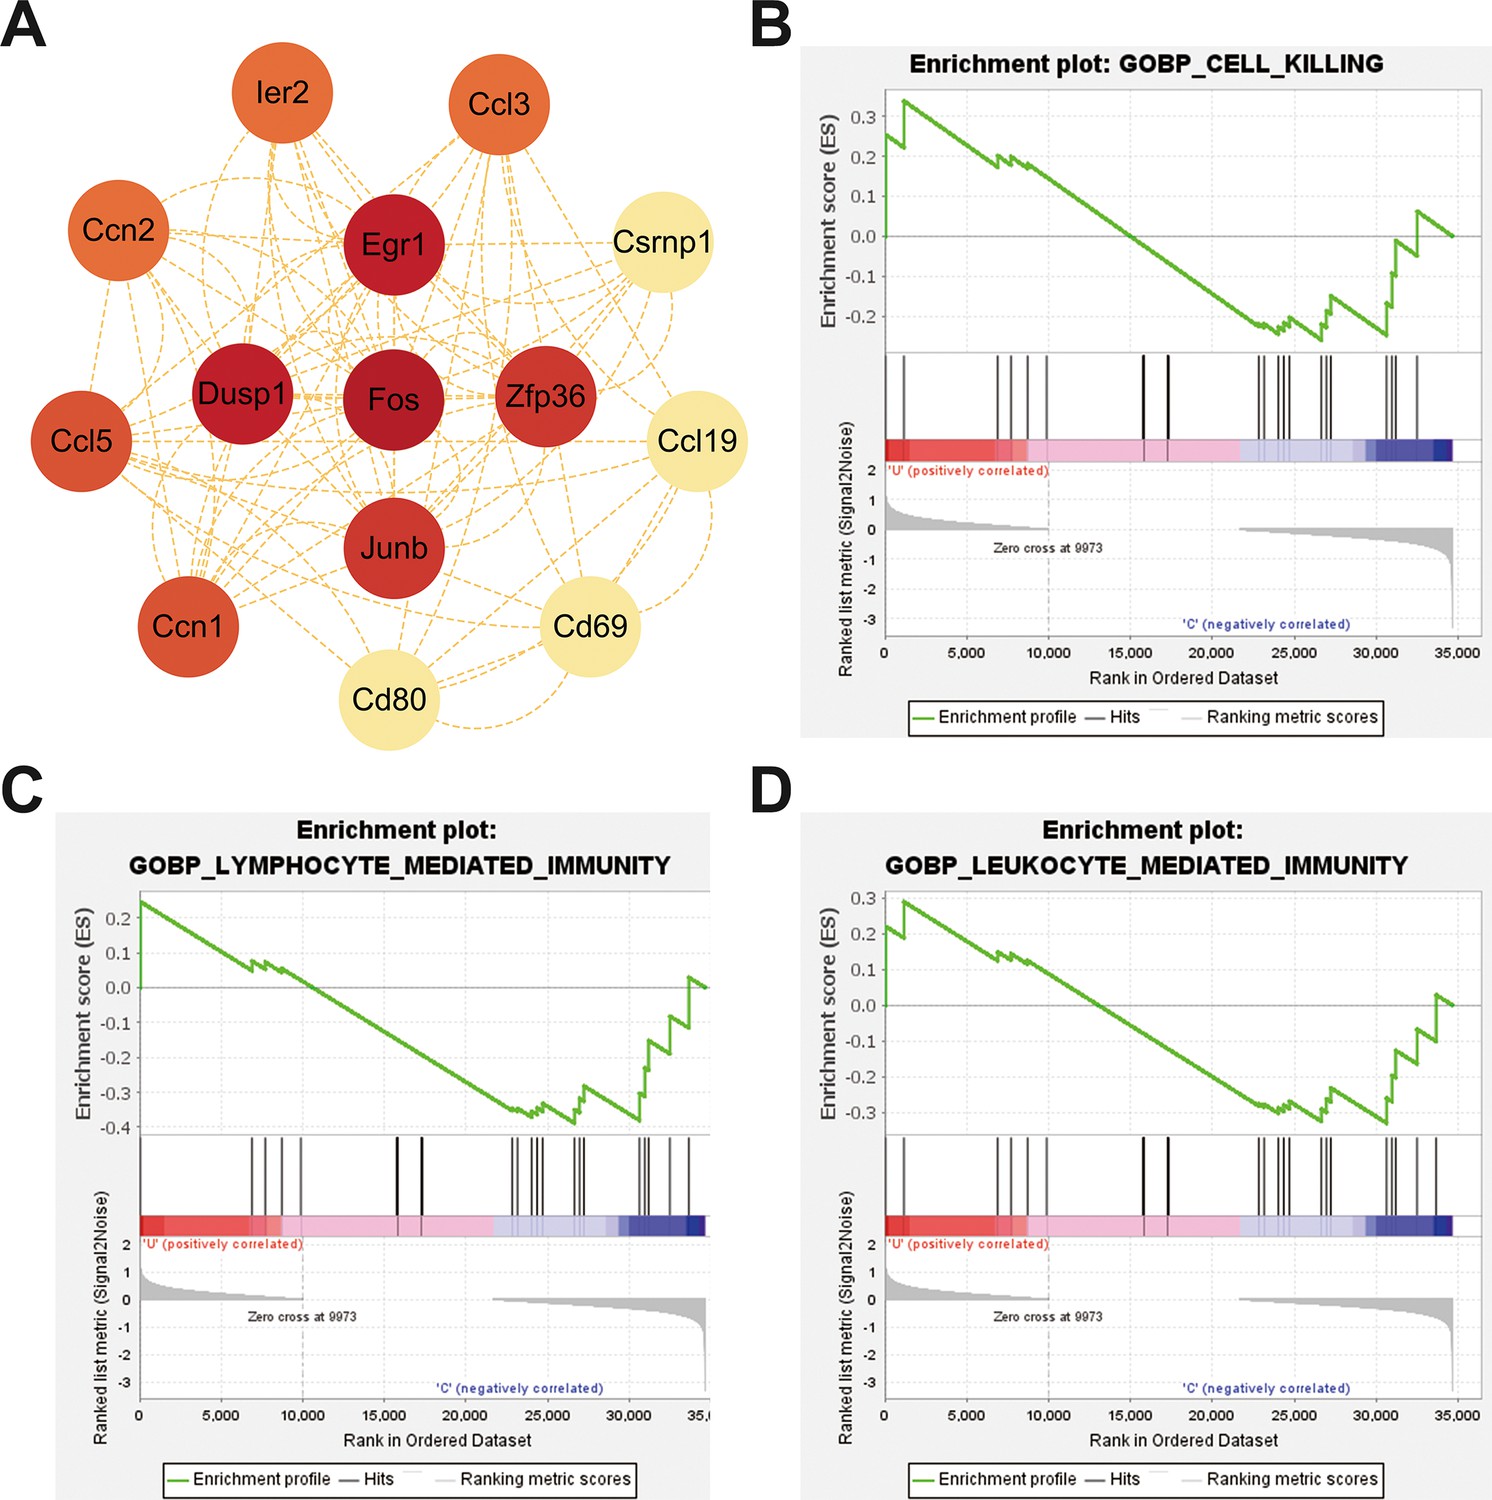
Hub genes in protein-protein interaction (PPI) analysis and gene set enrichment analysis (GSEA) during the non-reperfusion stage in unilateral pterygopalatine ophthalmic artery occlusion (UPOAO).
(A) Hub genes identified through PPI analysis of differential expression genes (DEGs) in the non-reperfusion group. (B–D) GSEA analysis of the pathway of the cell killing (B), lymphocyte mediated-immunity (C), and leukocyte mediated-immunity (D) in the non-reperfusion group.
Figure 6—figure supplement 2
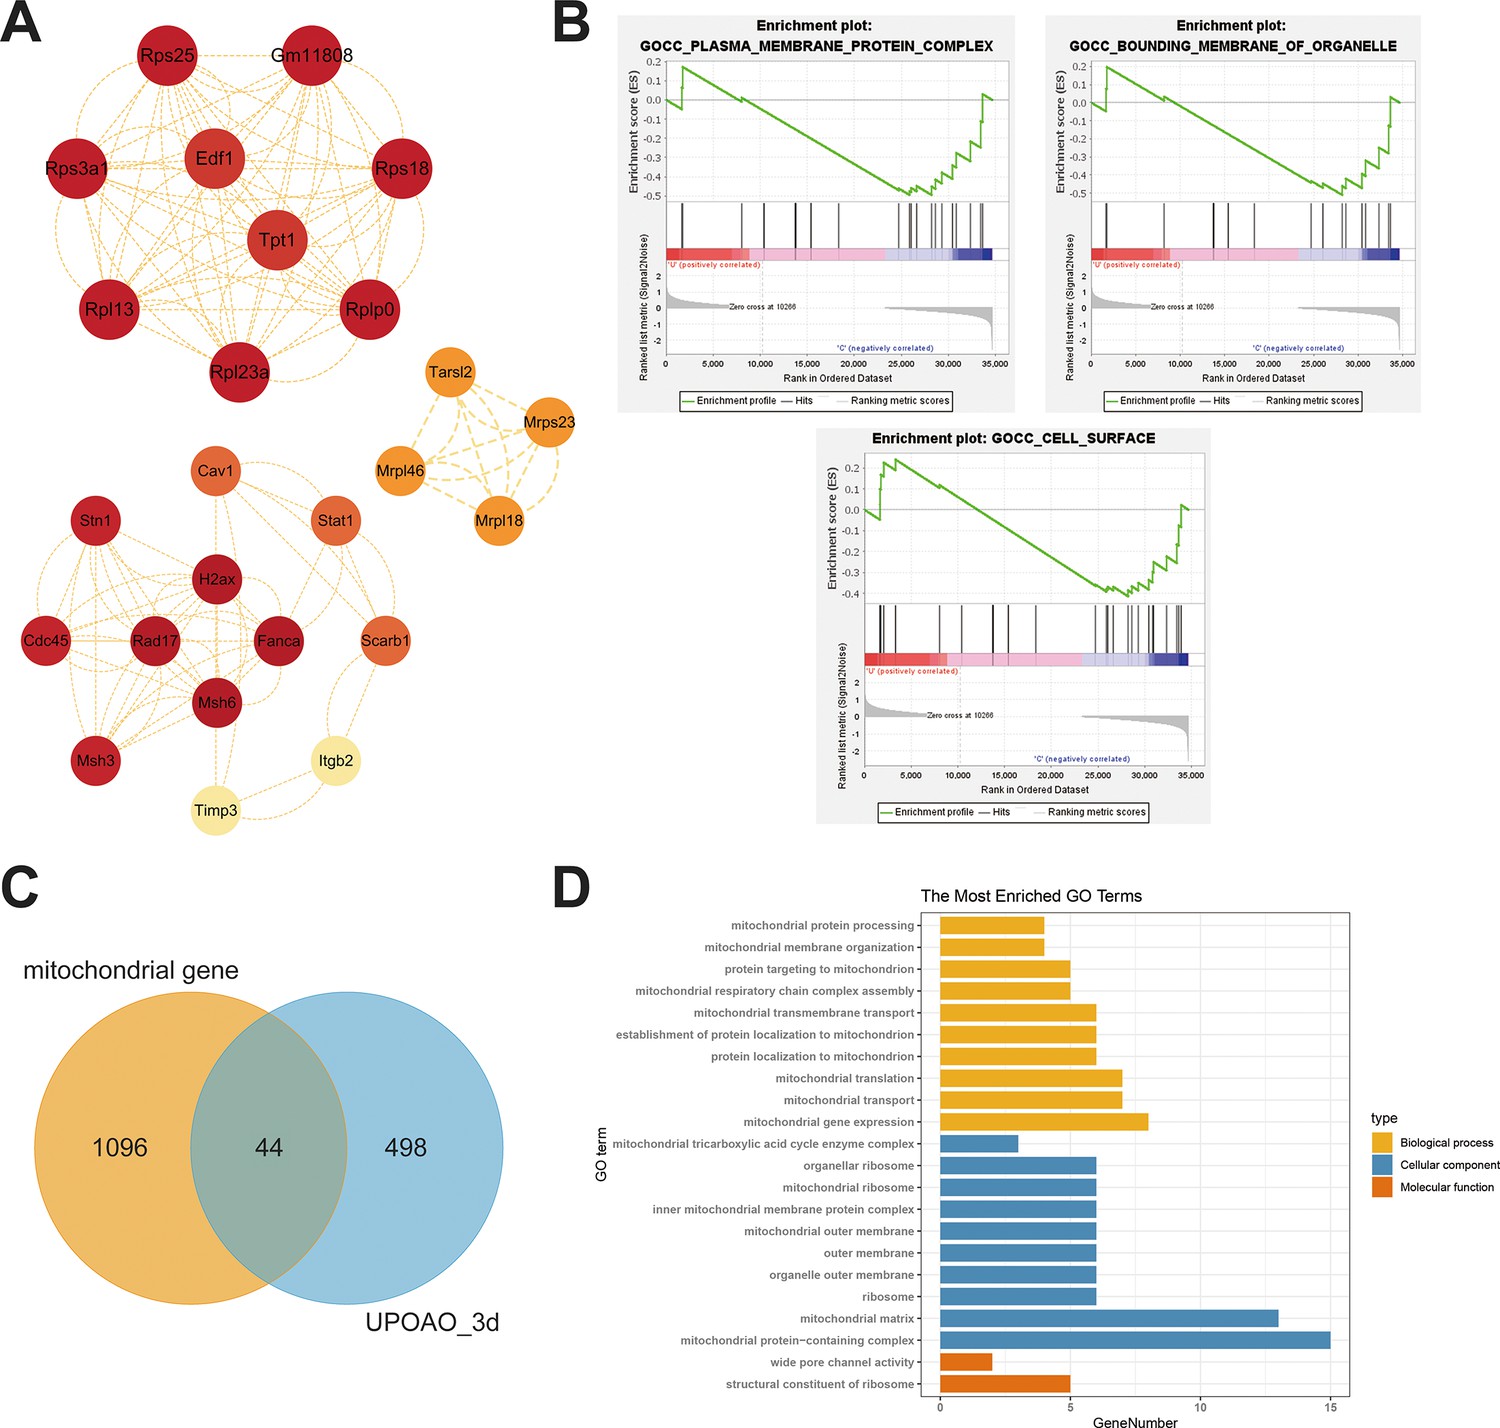
Hub genes, gene set enrichment analysis (GSEA) analysis at 3 days reperfusion in unilateral pterygopalatine ophthalmic artery occlusion (UPOAO), and relation with mitochondrial genes.
(A) Hub genes were identified through protein-protein interaction (PPI) analysis of differential expression genes (DEGs) in the 3 days reperfusion group. (B) GSEA analysis of the pathways related to plasma membrane protein complex (top left), bounding membrane of organelle (top right), and cell surface (bottom). (C) Venn diagram showing the overlapping genes between mitochondrial genes and DEGs at 3 days reperfusion (44 genes). (D) Gene ontology (GO) analysis of the 44 overlapping DEGs.
Figure 6—figure supplement 3
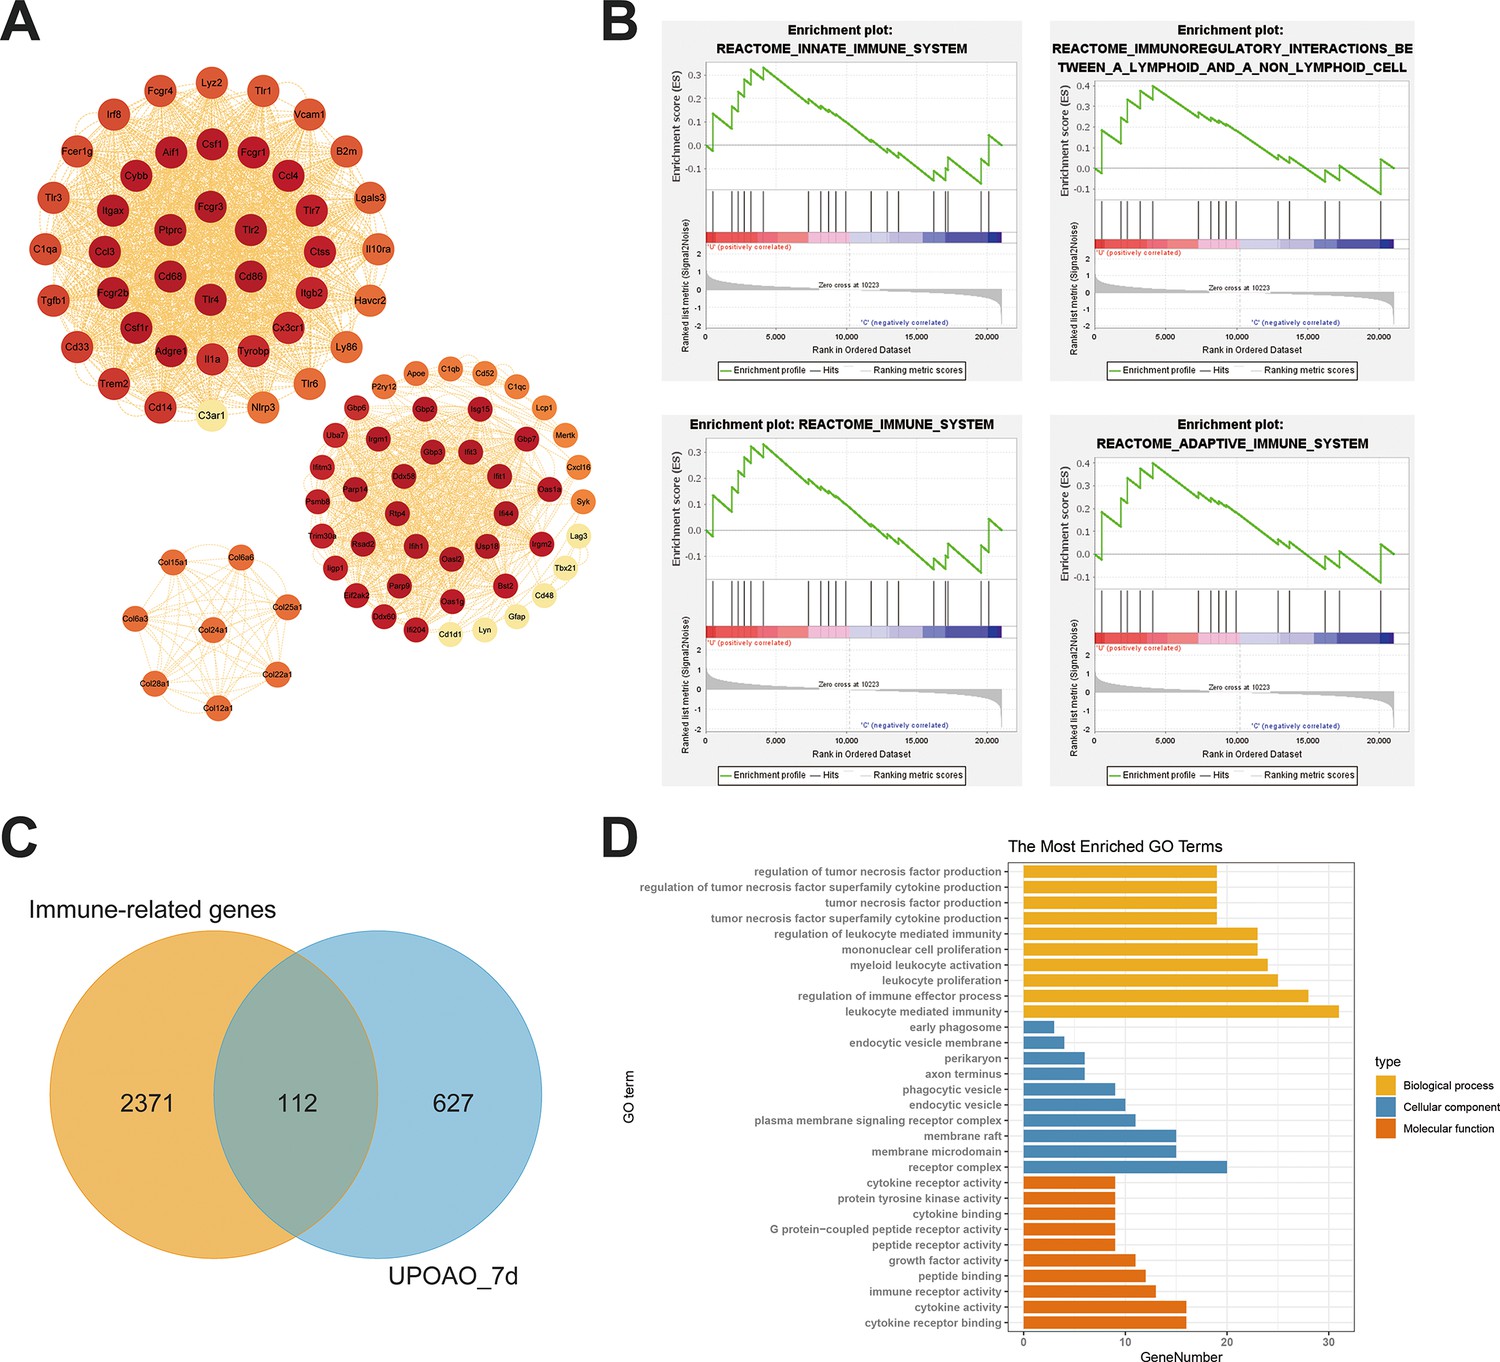
Hub Genes, gene set enrichment analysis (GSEA) analysis at 7 days reperfusion in unilateral pterygopalatine ophthalmic artery occlusion (UPOAO), and relation with immune genes.
(A) Hub genes identified through protein-protein interaction (PPI) analysis of differential expression genes (DEGs) in the 7 days reperfusion group. (B) GSEA analysis of the pathways related to the reactome innate immune system (top left), reactome immunoregulatory interactions between a lymphoid and a non-lymphoid cell (top right), reactome immune system (bottom left), and reactome adaptive immune system (bottom right). (C) Venn diagram showing the overlapping genes between immune genes and DEGs at 7 days reperfusion (112 genes). (D) Gene ontology (GO) analysis of the 112 overlapping DEGs.
Figure 6—figure supplement 4
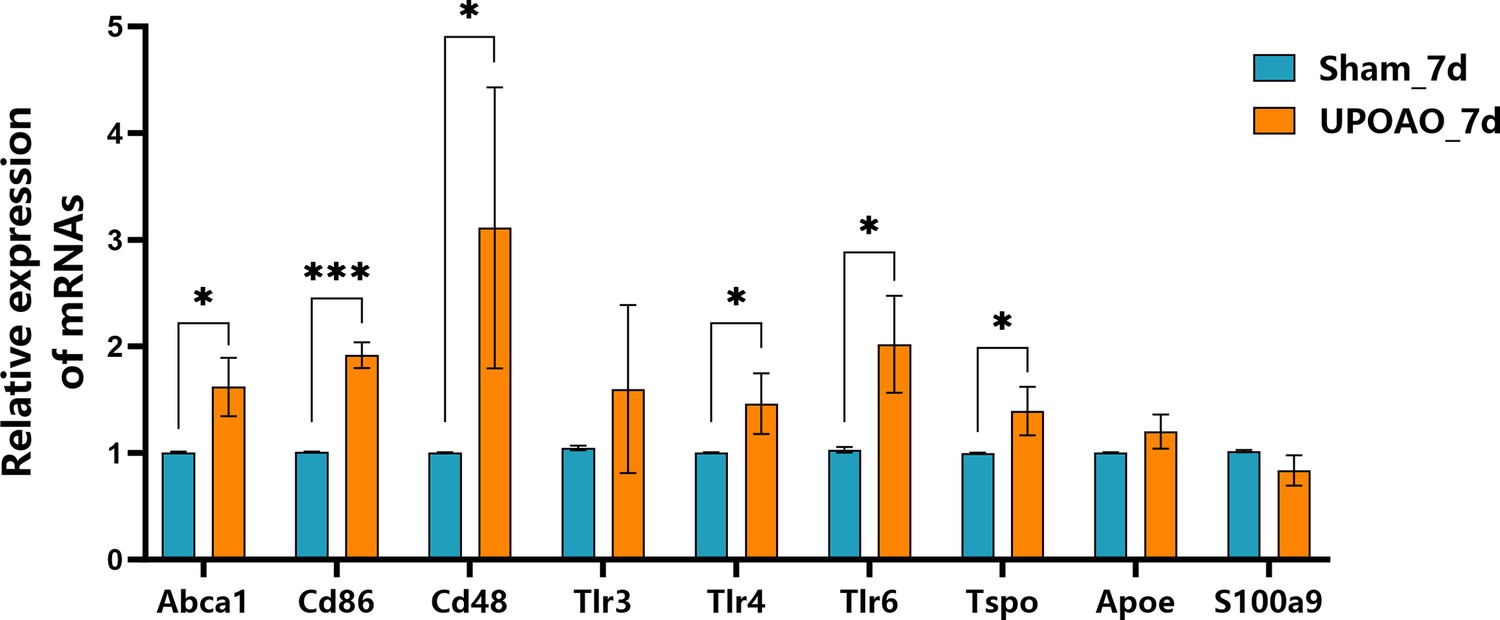
Upregulation of immune inflammation-related gene expression in the 7 days reperfusion group.
The genes Abca1, Cd86, Cd48, Tlr4, Tlr6, and Tspo were significantly upregulated in the 7 days reperfusion group, while other immune-inflammatory and chemotaxis-related genes showed no significant differences. The data points were from the retina of four animals. Data were presented as means ± s.e.m, *p<0.05, **p<0.01, ***p<0.001, ****p<0.0001, paired t-test.
Figure 6—figure supplement 5
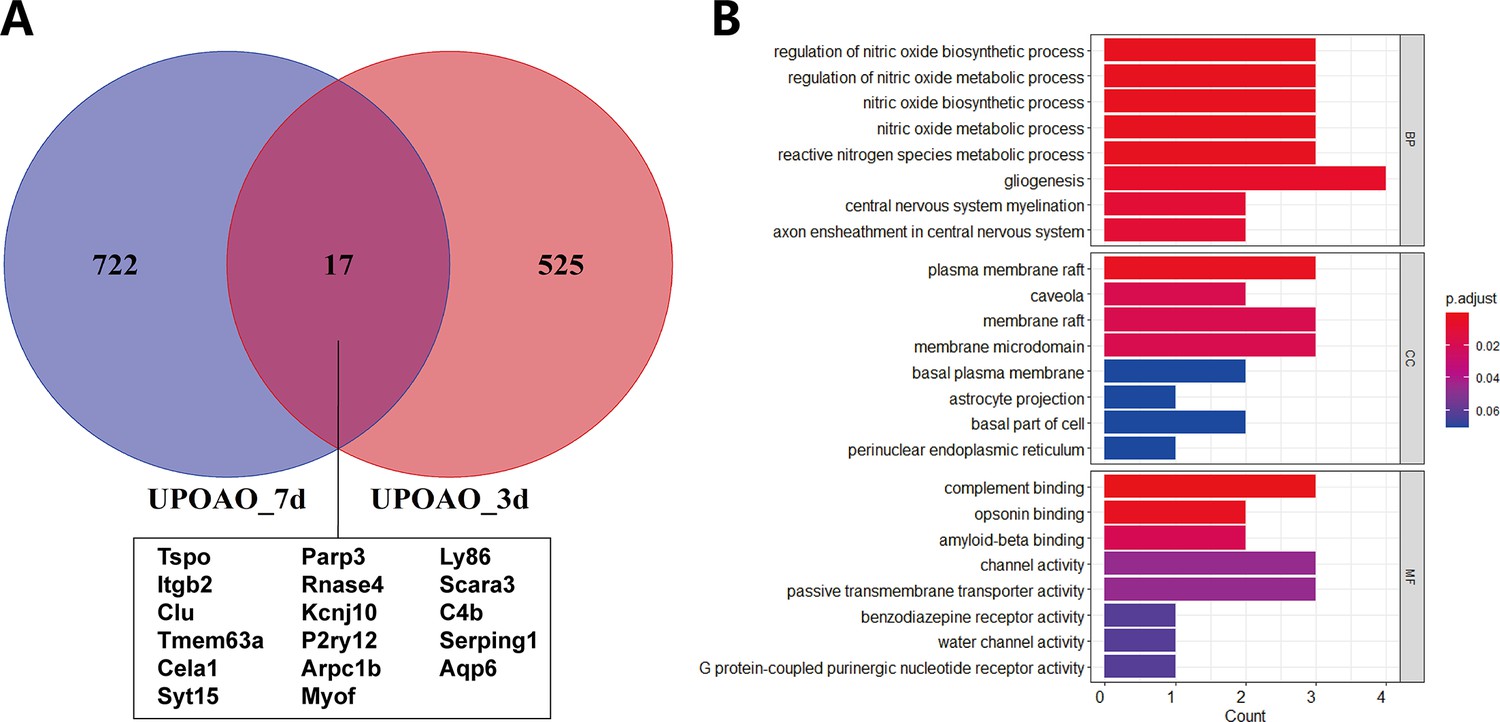
Co-expressed genes during 3 days and 7 days reperfusion.
(A) Venn diagram showing the overlap of differential expression genes (DEGs) between the 3 days and 7 days reperfusion groups, along with a list of the 17 overlapping DEGs. (B) Gene ontology (GO) analysis of the 17 overlapping DEGs.
Figure 7
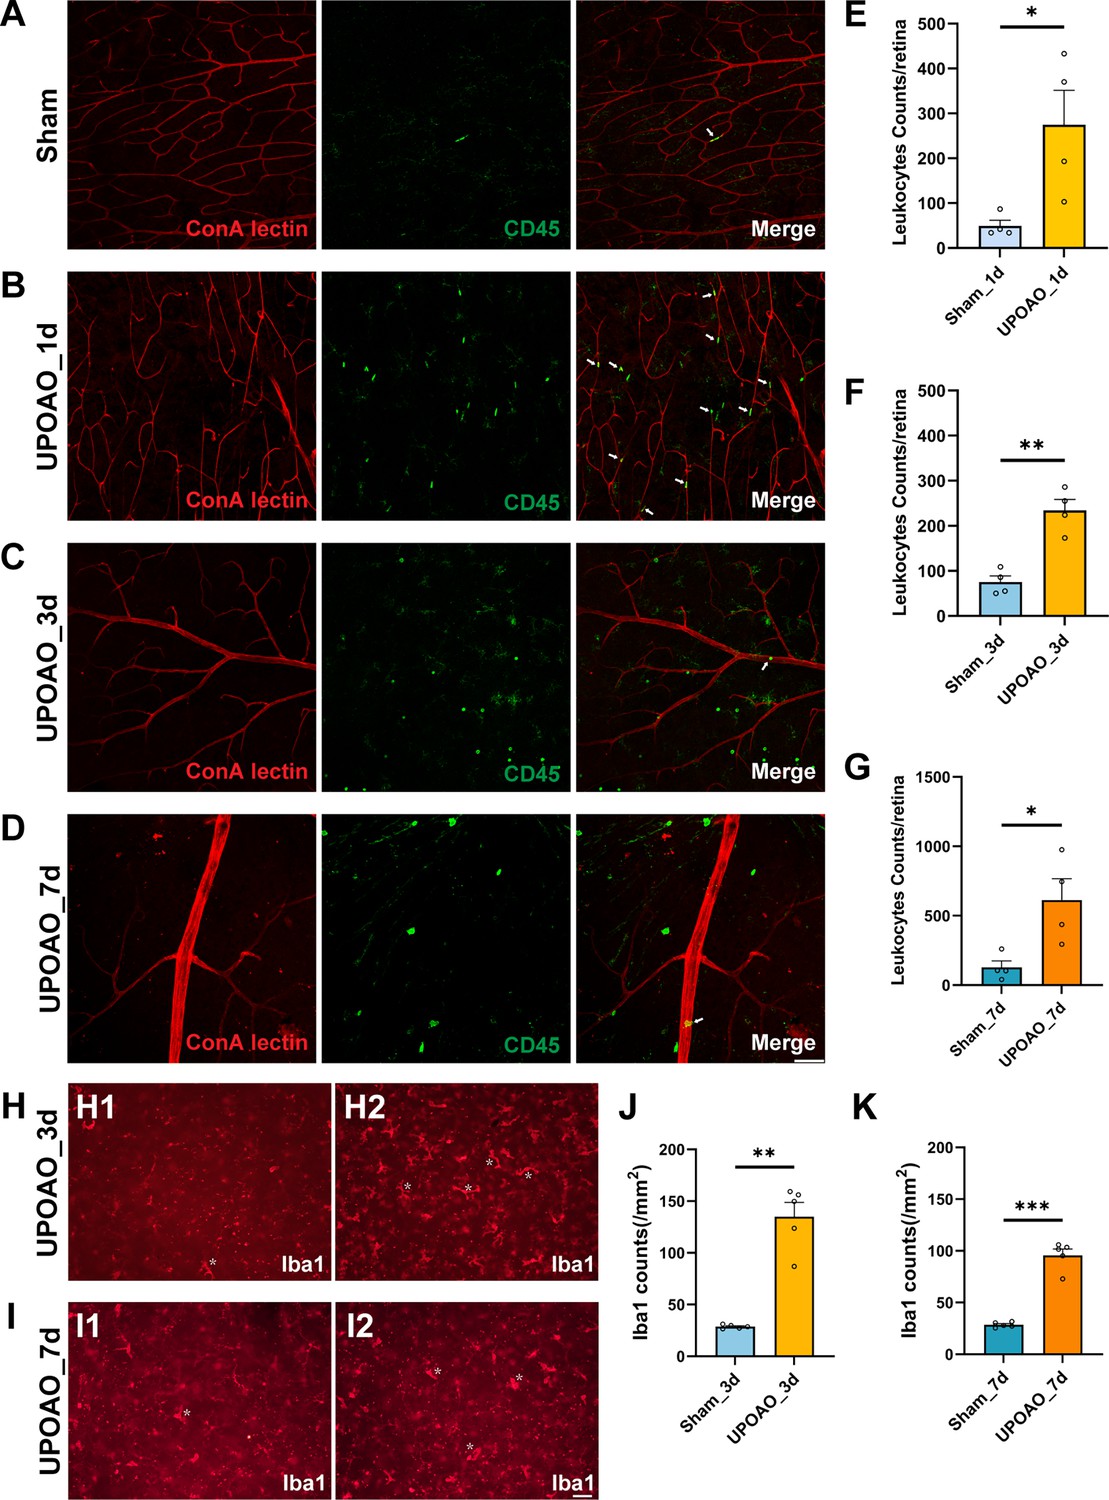
Peripheral leukocyte infiltration and retinal resident microglial activation.
Rhodamine-labeled canavalin A was used for immediate cardiac perfusion to visualize blood vessels, followed by CD45 immunofluorescent staining to observe the relationship between blood vessels and CD45+ cells in sham (A), 1 day perfusion group (B), 3 days perfusion group (C), and 7 days perfusion group (D). The presence of CD45+ cells within blood vessels is indicated by white arrows. Scale bar = 50 μm. CD45+ cell counts were performed in whole retinas of 1 day (E), 3 days (F), 7 days (G). The cellular morphology and distribution of microglial cells in the superficial retina were assessed in 3 days (H) and 7 days (I). Activated microglial cells are indicated by white asterisks. Microglial cell counting was conducted in the superficial retina for 3 days (J) and 7 days (K). Data points for CD45+ cells were derived from four flat-mounted retinas, and data points for microglial cells were from five flat-mounted retinas. Data were presented as means ± SEM, *p<0.05, **p<0.01, ***p<0.001, ****p<0.0001, t-test. Scale bar = 50 μm.
Figure 8
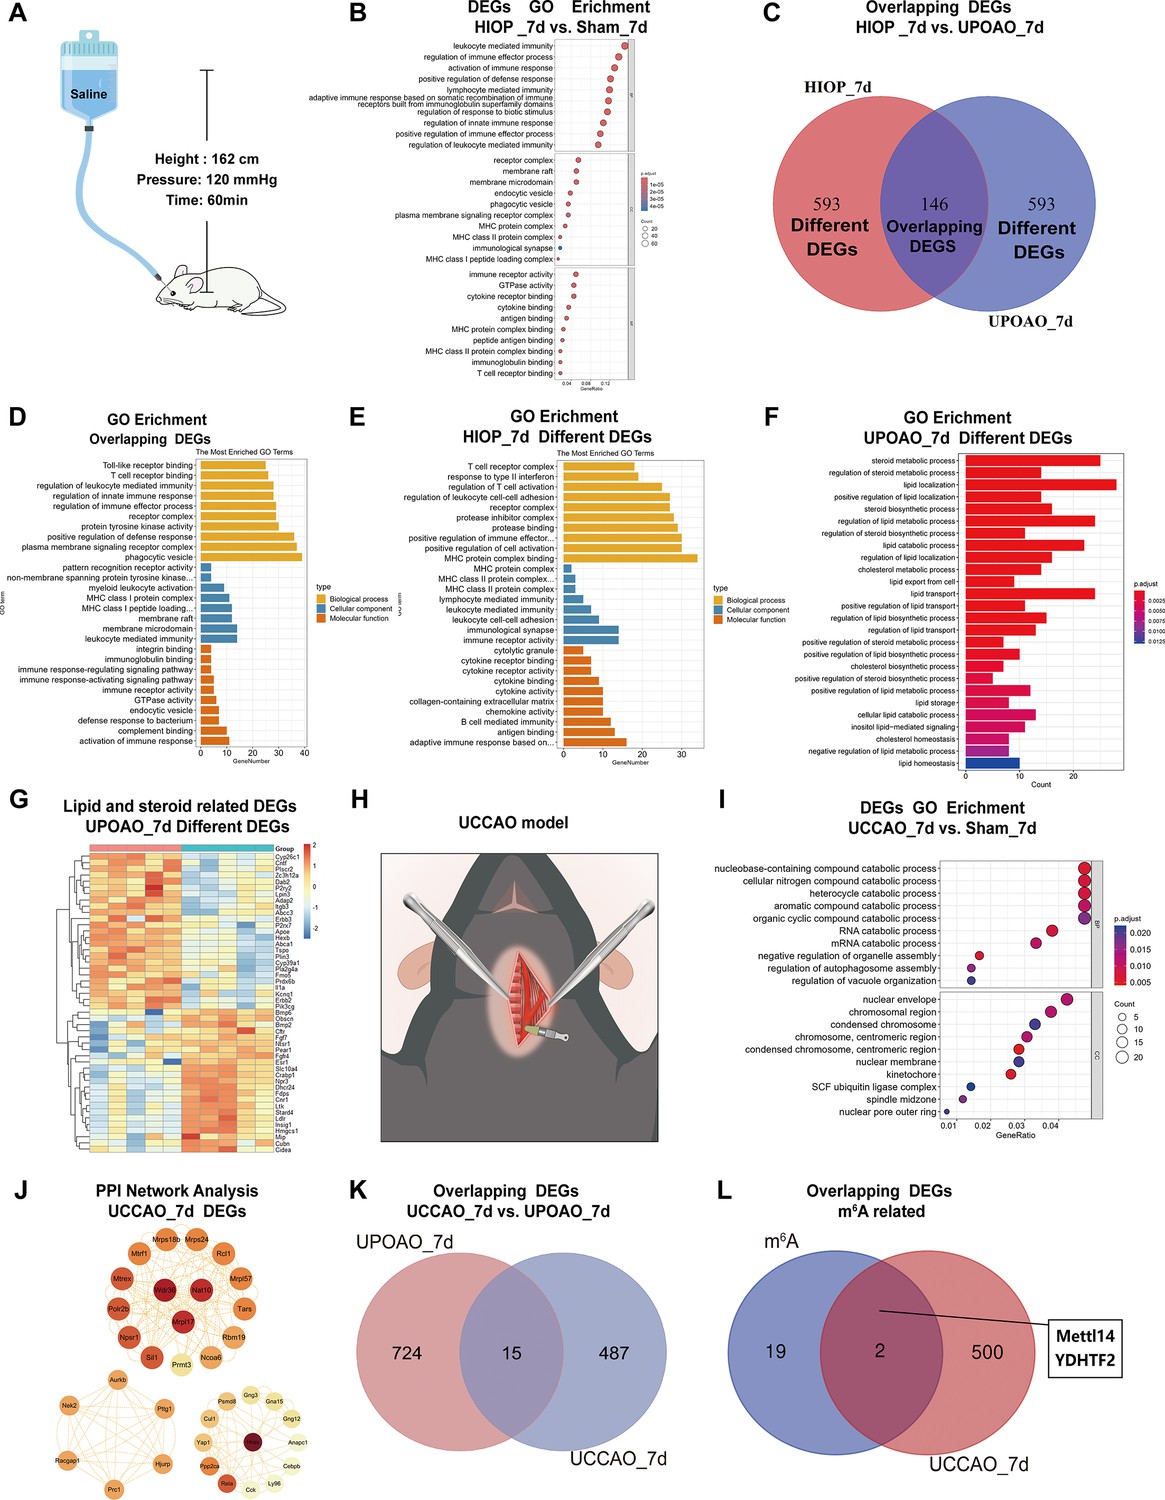
Transcriptomic results comparison between unilateral pterygopalatine ophthalmic artery occlusion (UPOAO), high intraocular pressure (HIOP), and unilateral common carotid artery occlusion (UCCAO) models.
RNA-seq comparison between UPOAO and extravascular occlusion models: HIOP and UCCAO. (A) Schematic illustration of the HIOP model. (B) Gene ontology (GO) analysis of differential expression genes (DEGs) in the high intraocular pressure (HIOP) model at 7 days perfusion. (C) Venn diagram indicating the overlapping DEGs (146 genes) between HIOP and UPOAO models, as well as the remaining DEGs specific to each group (593 genes in each group). (D) Gene ontology (GO) analysis of the overlapping DEGs between HIOP and UPOAO models. (E) GO analysis of the remaining DEGs in the HIOP model at 7 days perfusion, excluding the overlapping DEGs. (F) GO analysis of the remaining DEGs, excluding the overlapping DEGs. (G) Heatmap showing the inter-sample distribution of lipid and steroid-related DEGs from the analysis of the remaining DEGs in the UPOAO model. (H) Schematic illustration of the UCCAO model. (I) GO analysis of DEGs in the UCCAO model. (J) Hub genes were identified through protein-protein interaction (PPI) network analysis of the DEGs in the UCCAO model. (K) Venn diagram indicating the overlapping DEGs between UCCAO and UPOAO models (15 genes). (L) Venn diagram indicating the presence of two overlapping DEGs between UCCAO DEGs and m6A-related genes.
Figure 9
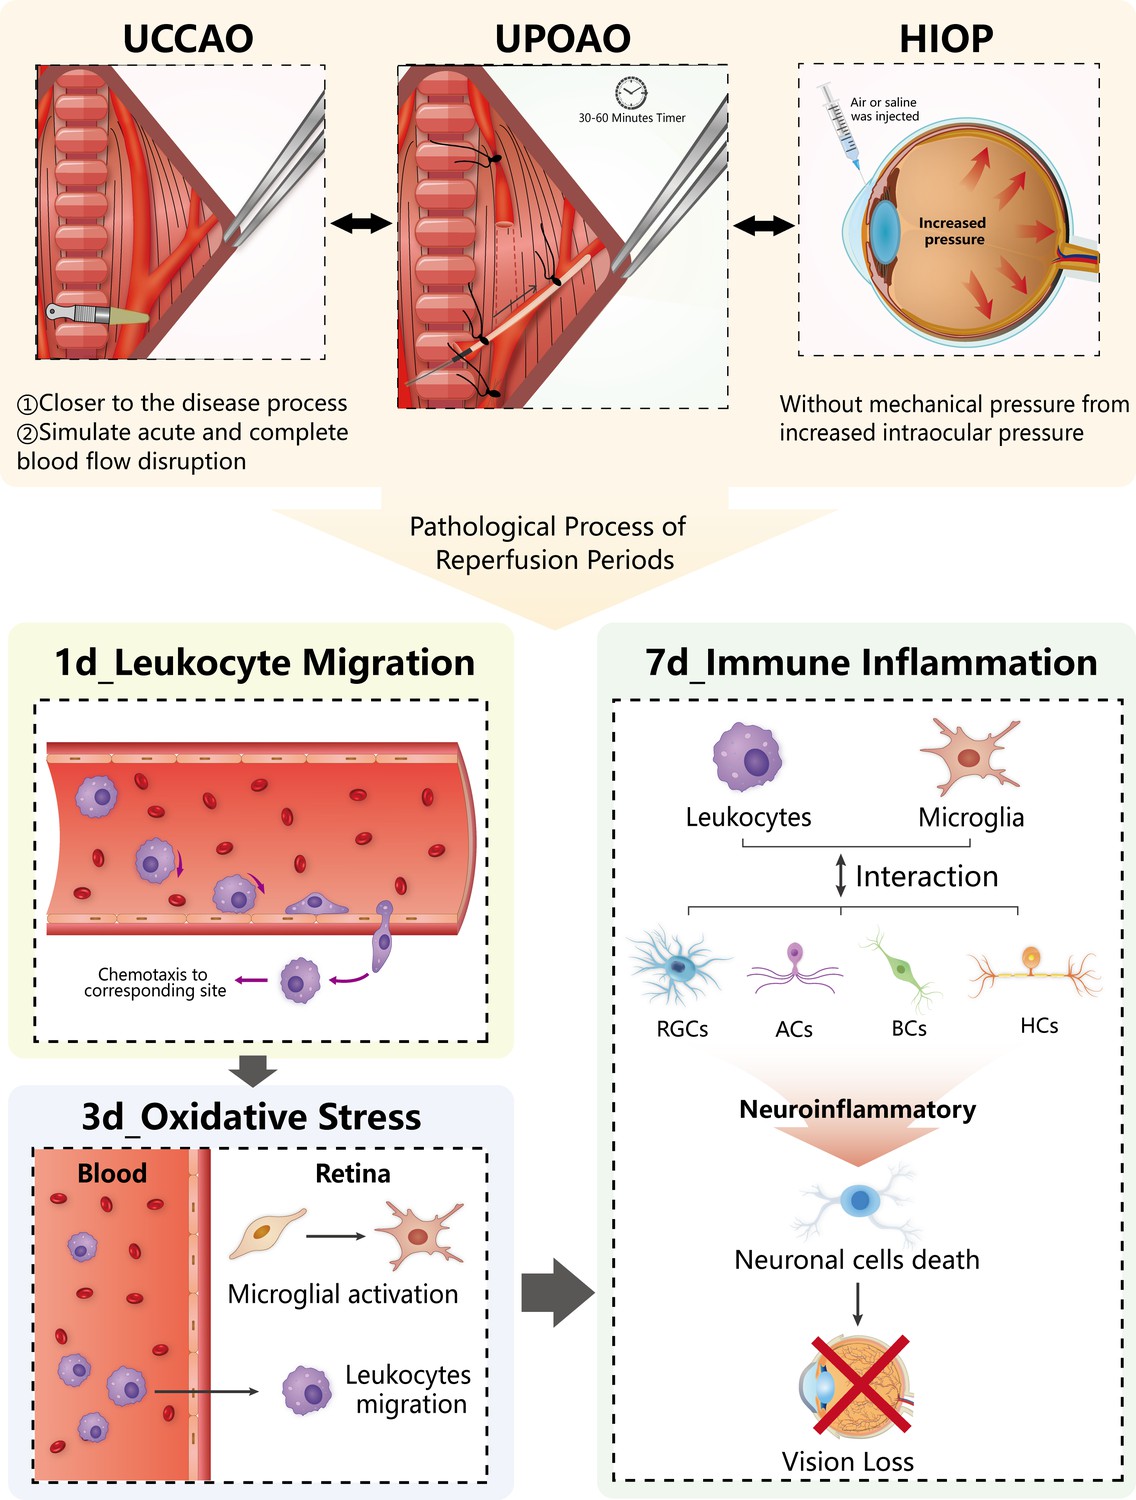
The characteristic features of unilateral pterygopalatine ophthalmic artery occlusion (UPOAO) model during ischemia-reperfusion periods.
Author response image 1

Thickness of OPL, ONL, IS/OS+RPE in HE staining.
n=3; ns: no significance (p>0.05).
Author response image 2
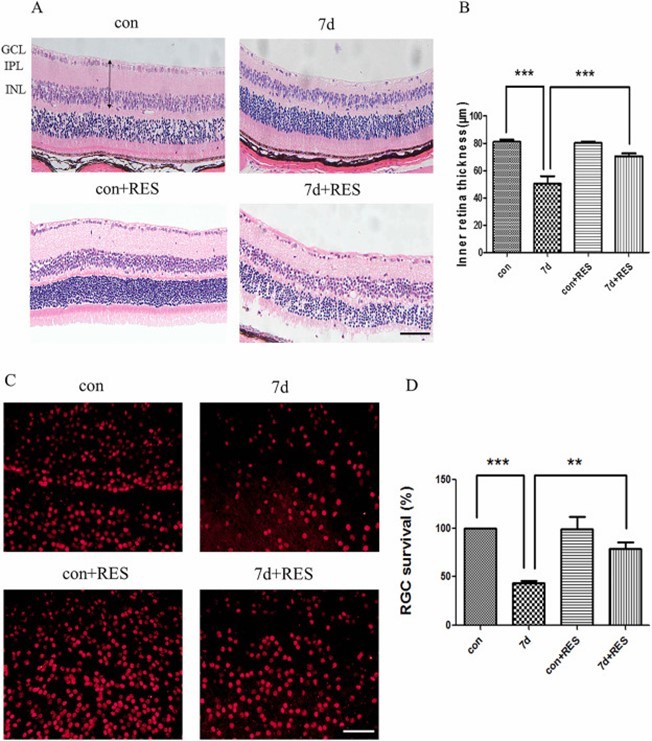
Cited from Ji, K., et al., Resveratrol attenuates retinal ganglion cell loss in a mouse model of retinal ischemia reperfusion injury via multiple pathways.
Experimental Eye Research, 2021. 209: p. 108683.
Author response image 3

Schematic diagram illustrating the selection of regions.
The figure was captured using a fluorescence microscope (BX63; Olympus, Tokyo, Japan) under a 4X objective. Scale bar=500 µm.
Author response image 4
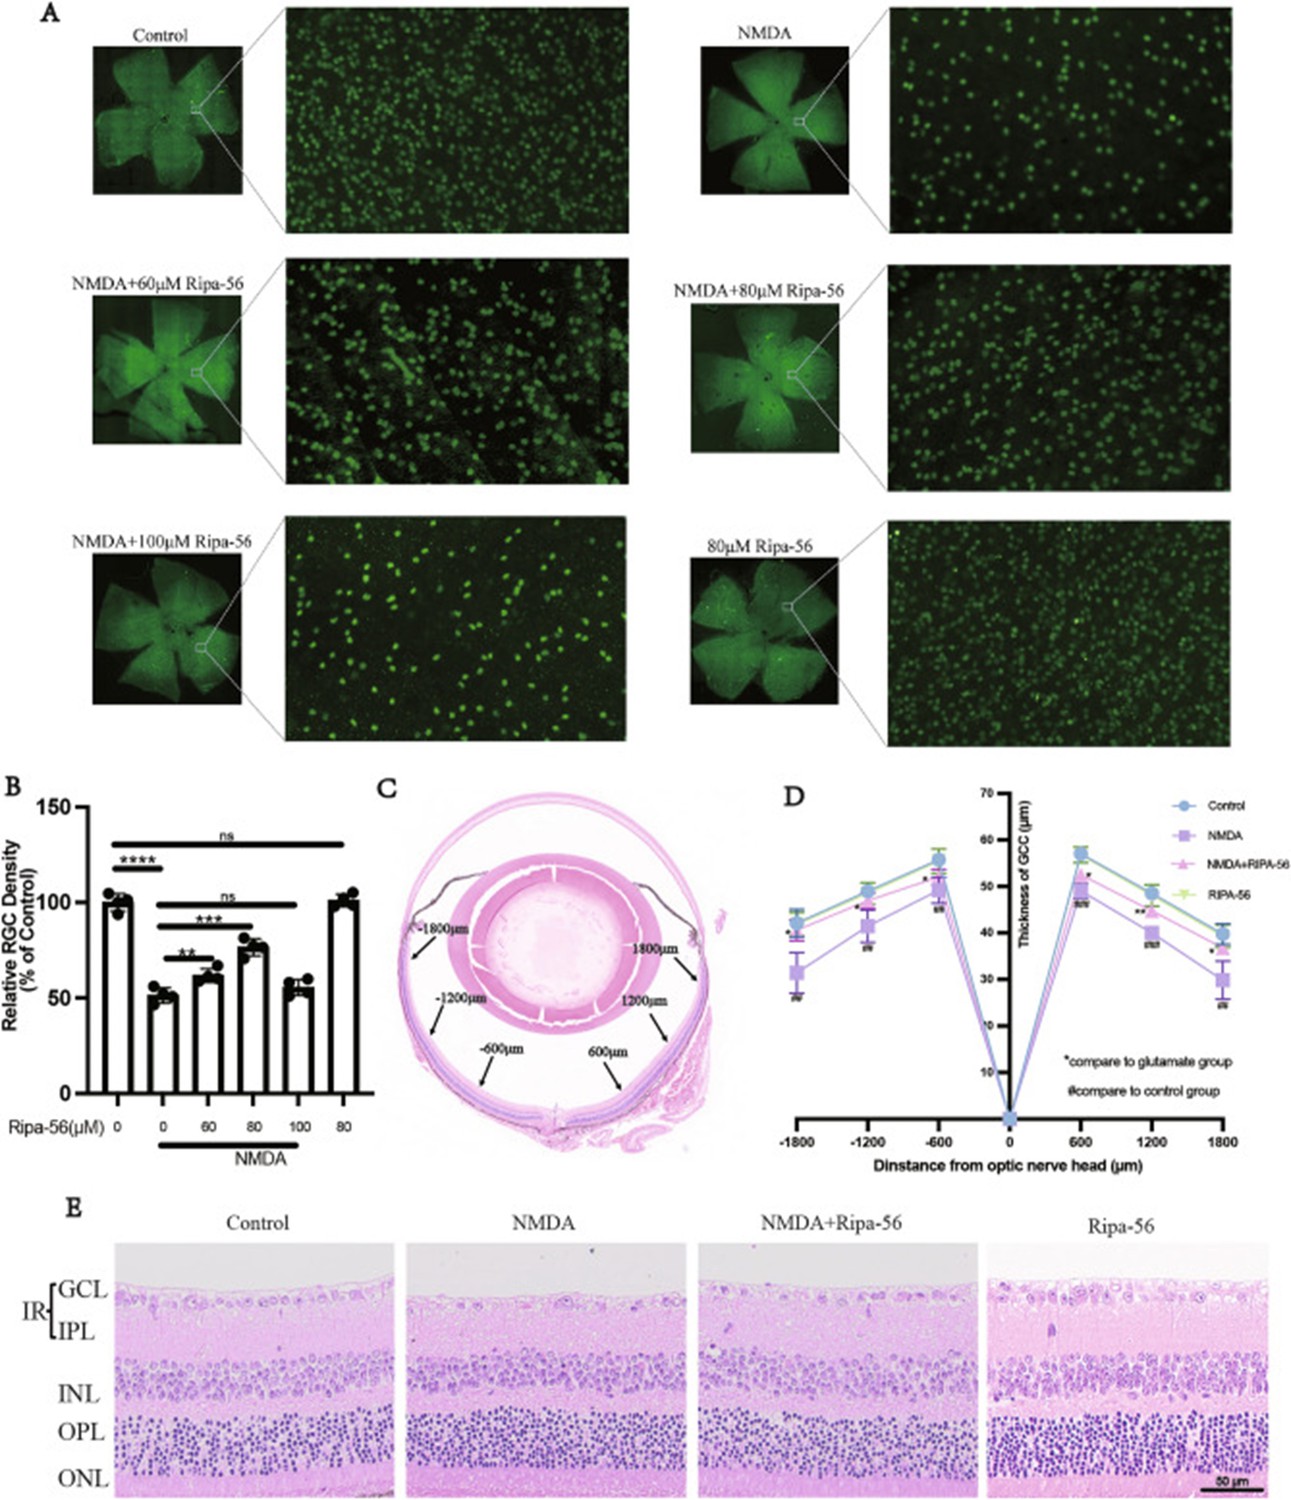
Cited from Feng, L., et al., Ripa-56 protects retinal ganglion cells in glutamate-induced retinal excitotoxic model of glaucoma. Sci Rep, 2024. 14(1): p. 3834.
Videos
Video 1
Blunt dissection of cervical vessels.
The neck was exposed, and the cervical arteries were separated using blunt dissection techniques.
Video 2
Insertion of silicone wire embolus and induction of ischemia.
The silicone wire embolus was inserted into the PPA, initiating the ischemic condition. PPA: the pterygopalatine artery.
Video 3
Extraction of silicone wire embolus and reperfusion.
The silicone wire embolus was removed, allowing reperfusion to occur. The mouse’s wound was sutured, and standard feeding procedures were followed.
Tables
Table 1
Antibodies used in staining of flat-mounted retina and sections.
| Antibodies | Species | Dilution | Company |
|---|---|---|---|
| PKCα | rabbit | 1:1000 | Sigma |
| Recoverin | rabbit | 1:1000 | Millipore |
| Calbindin | rabbit | 1:5000 | SWANT |
| ChAT | goat | 1:200 | Millipore |
| Iba1 | rabbit | 1:500 | Wako |
| CD45 | rabbit | 1:100 | CST |
| Rhodamine-labeled canavalin A | / | 1:125 | MKBio |
| Goat anti-mouse IgG Alexa Fluor 488 | goat | 1:500 | Jackson |
| Donkey anti-rabbit IgG Alexa Fluor 594 | donkey | 1:500 | Jackson |
| Donkey anti-goat IgG Alexa Fluor 488 | donkey | 1:500 | Jackson |
Additional files
-
Supplementary file 1
Summary table.
Time course of all the morphological, functional, cellular, and transcriptome changes in the UPOAO model.-: no change; ↑: increase; ↓: decrease; /: not involved in the article; #: supplementary content: also increase after 60 min-ischemia and 1d-reperfusion.
- https://cdn.elifesciences.org/articles/98949/elife-98949-supp1-v1.docx
-
Supplementary file 2
Primers used in this study.
- https://cdn.elifesciences.org/articles/98949/elife-98949-supp2-v1.xlsx
-
MDAR checklist
- https://cdn.elifesciences.org/articles/98949/elife-98949-mdarchecklist1-v1.docx
Download links
A two-part list of links to download the article, or parts of the article, in various formats.
Downloads (link to download the article as PDF)
Open citations (links to open the citations from this article in various online reference manager services)
Cite this article (links to download the citations from this article in formats compatible with various reference manager tools)
Transcriptional responses in a mouse model of silicone wire embolization induced acute retinal artery ischemia and reperfusion
eLife 13:RP98949.
https://doi.org/10.7554/eLife.98949.4


