Genome-wide mapping of native co-localized G4s and R-loops in living cells
- Key Laboratory of Birth Defects and Related Disease of Women and Children of MOE, Department of Pediatrics, West China Second University Hospital, State Key Laboratory of Biotherapy and Collaborative Innovation Center of Biotherapy, Sichuan University, China
- Department of Hematology and Institute of Hematology, State Key Laboratory of Biotherapy and Cancer Center, West China Hospital, Sichuan University, China
- Development and Related Diseases of Women and Children Key Laboratory of Sichuan Province, China
Figures
Figure 1 with 1 supplement
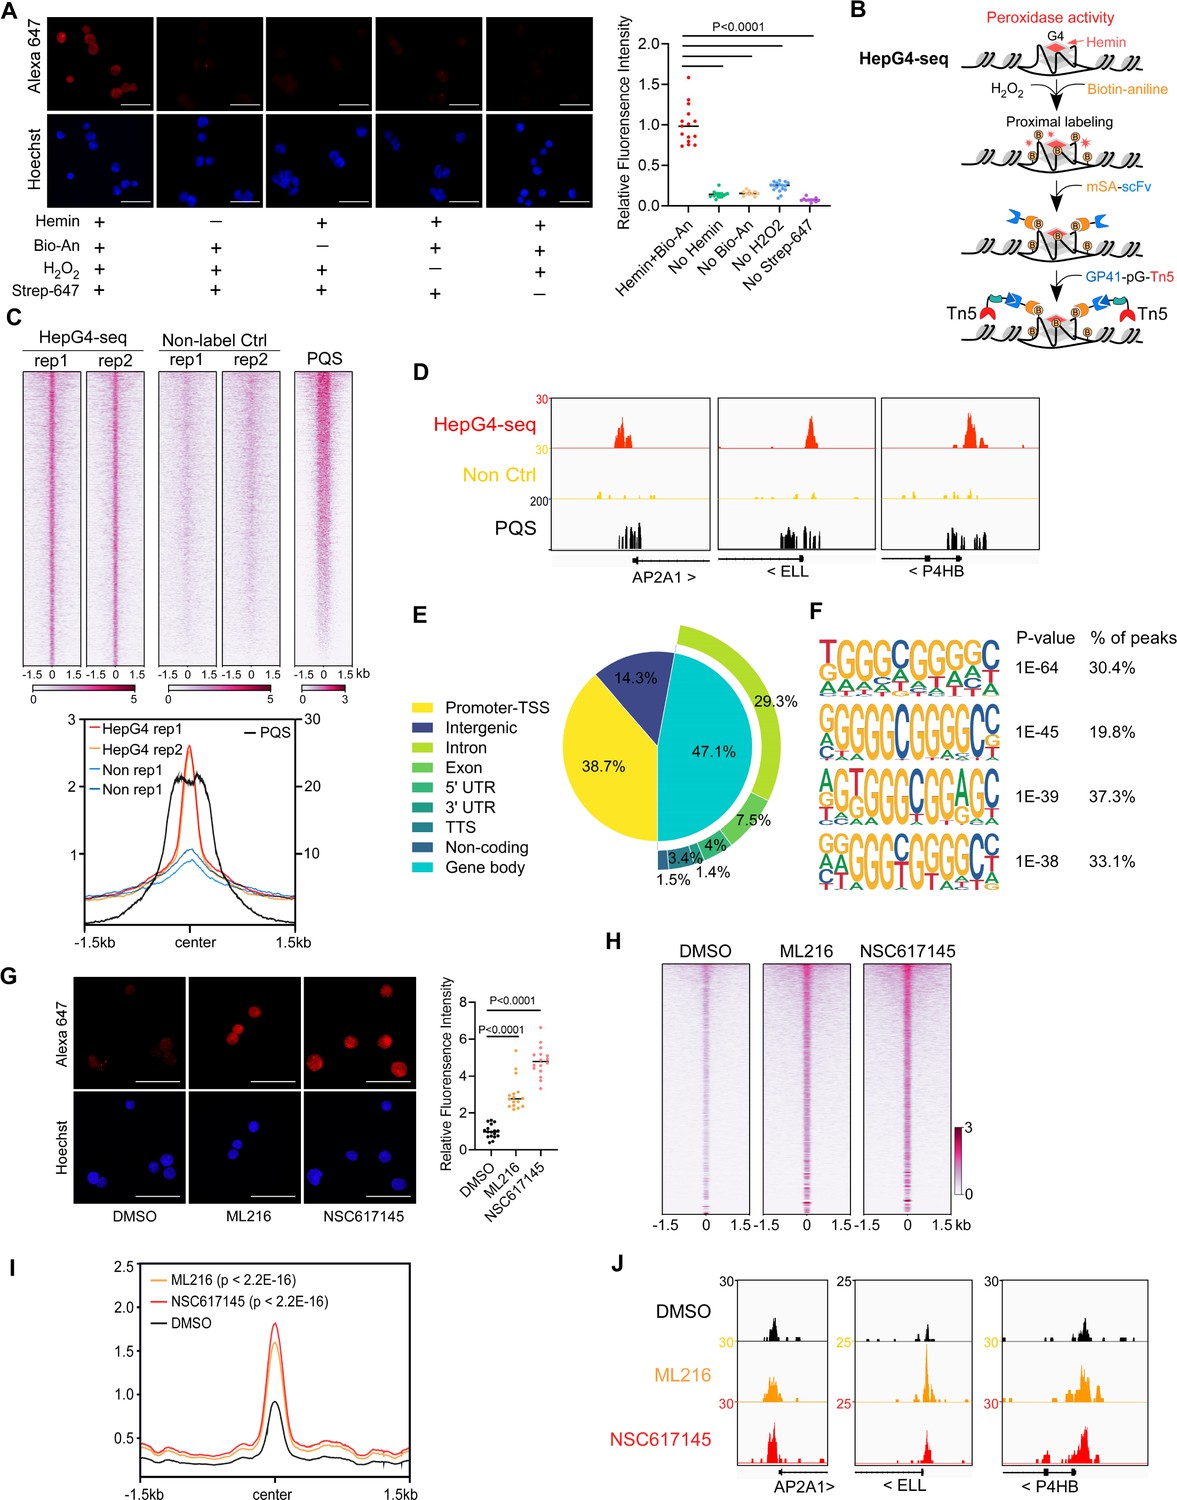
Mapping of the native DNA G-quadruplex (G4) through the G4-hemin-mediated proximal biotinylation.
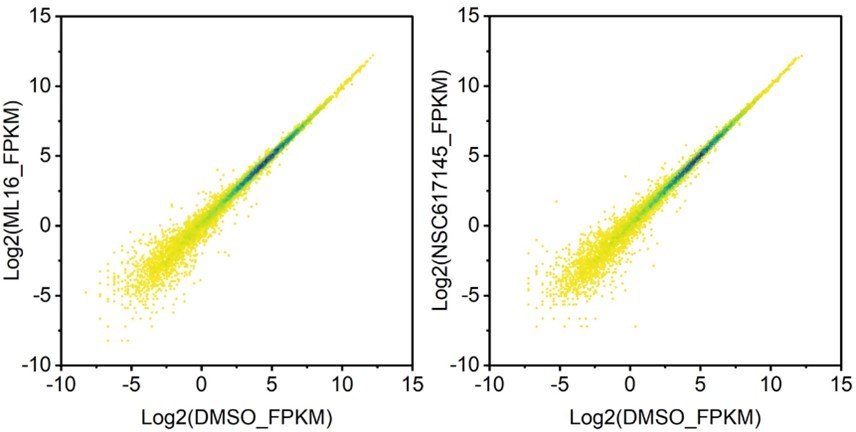
(A) Immunofluorescence staining of the HEK293 cells treated with indicated conditions using the Alexa Fluor 647 labeled recombinant streptavidin (Strep-647). Nuclei were stained with the Hoechst33342. Scale bar, 50 µm. Bio-An, Biotin-aniline; H2O2, Hydrogen peroxide. The quantified relative fluorescence intensities were shown in the right panel. This experiment was repeated once with similar results. (B) Schematic of the HepG4-seq procedure. SA-scFv, the recombinant fusion protein of mSA and anti-GP41 Single Chain Fragment Variable (scFv); GP41-pG-Tn5, the recombinant fusion protein of the GP41 tag, protein G and Tn5. (C) Top: Heatmap showing the signal of BG4-seq, HepG4-seq, and max Scores of PQS ±1.5 kb around the center of peaks identified by HepG4-seq in HEK293 cells. Color scales represent the density of the signals. Bottom: Profile plot showing the average signal of HepG4-seq reads ±1.5 kb around the center of peaks and the average maxScores of PQS calculated by pqsfinder at the same positions. HepG4 rep1/rep2, two biologically independent HepG4-seq replicates in HEK293 cells; Non rep1/rep2, two biologically independent non-label negative control replicates in HEK293 cells. (D) Representative genome browser tracks showing HepG4-seq (red), non-label negative control of HepG4-seq (yellow), and PQS (black) signals in HEK293 cells along the indicated genomic loci. (E) Distribution of HepG4-seq signals in HEK293 cells in different gene features. (F) The top enriched motifs on the HepG4-seq peaks in HEK293 cells. (G) Immunofluorescence staining of the HEK293 cells treated with DMSO, ML216 (25 µM), or NSC617145 (3 µM) using the Alexa Fluor 647 labeled recombinant streptavidin. Nuclei were stained with the Hoechst33342. Scale bar, 50 µm. The quantified relative fluorescence intensities were shown in the right panel. This experiment was repeated once with similar results. (H) Heatmap showing the HepG4-seq signals ±1.5 kb around the center of peaks identified in HEK293 cells treated with DMSO, ML216 (25 µM), or NSC617145 (3 µM). Color scales represent the density of the signals. (I) Profile plot showing the average signal of HepG4-seq reads ±1.5 kb around the center of peaks identified in HEK293 cells treated with DMSO, ML216 (25 µM), or NSC617145 (3 µM). The p values (ML216 v.s. DMSO; NSC617145 v.s. DMSO) were calculated using the Mann-Whitney test. (J) Representative genome browser tracks showing the HepG4-seq signals in HEK293 cells treated with DMSO, ML216 (25 µM), or NSC617145 (3 µM) along the indicated genomic loci.
-
Figure 1—source data 1
PDF file containing original microscope images displayed in Figure 1A and G, indicating the selected regions.
- https://cdn.elifesciences.org/articles/99026/elife-99026-fig1-data1-v1.pdf
-
Figure 1—source data 2
Original files of microscope images are displayed in Figure 1A and G.
- https://cdn.elifesciences.org/articles/99026/elife-99026-fig1-data2-v1.zip
Figure 1—figure supplement 1
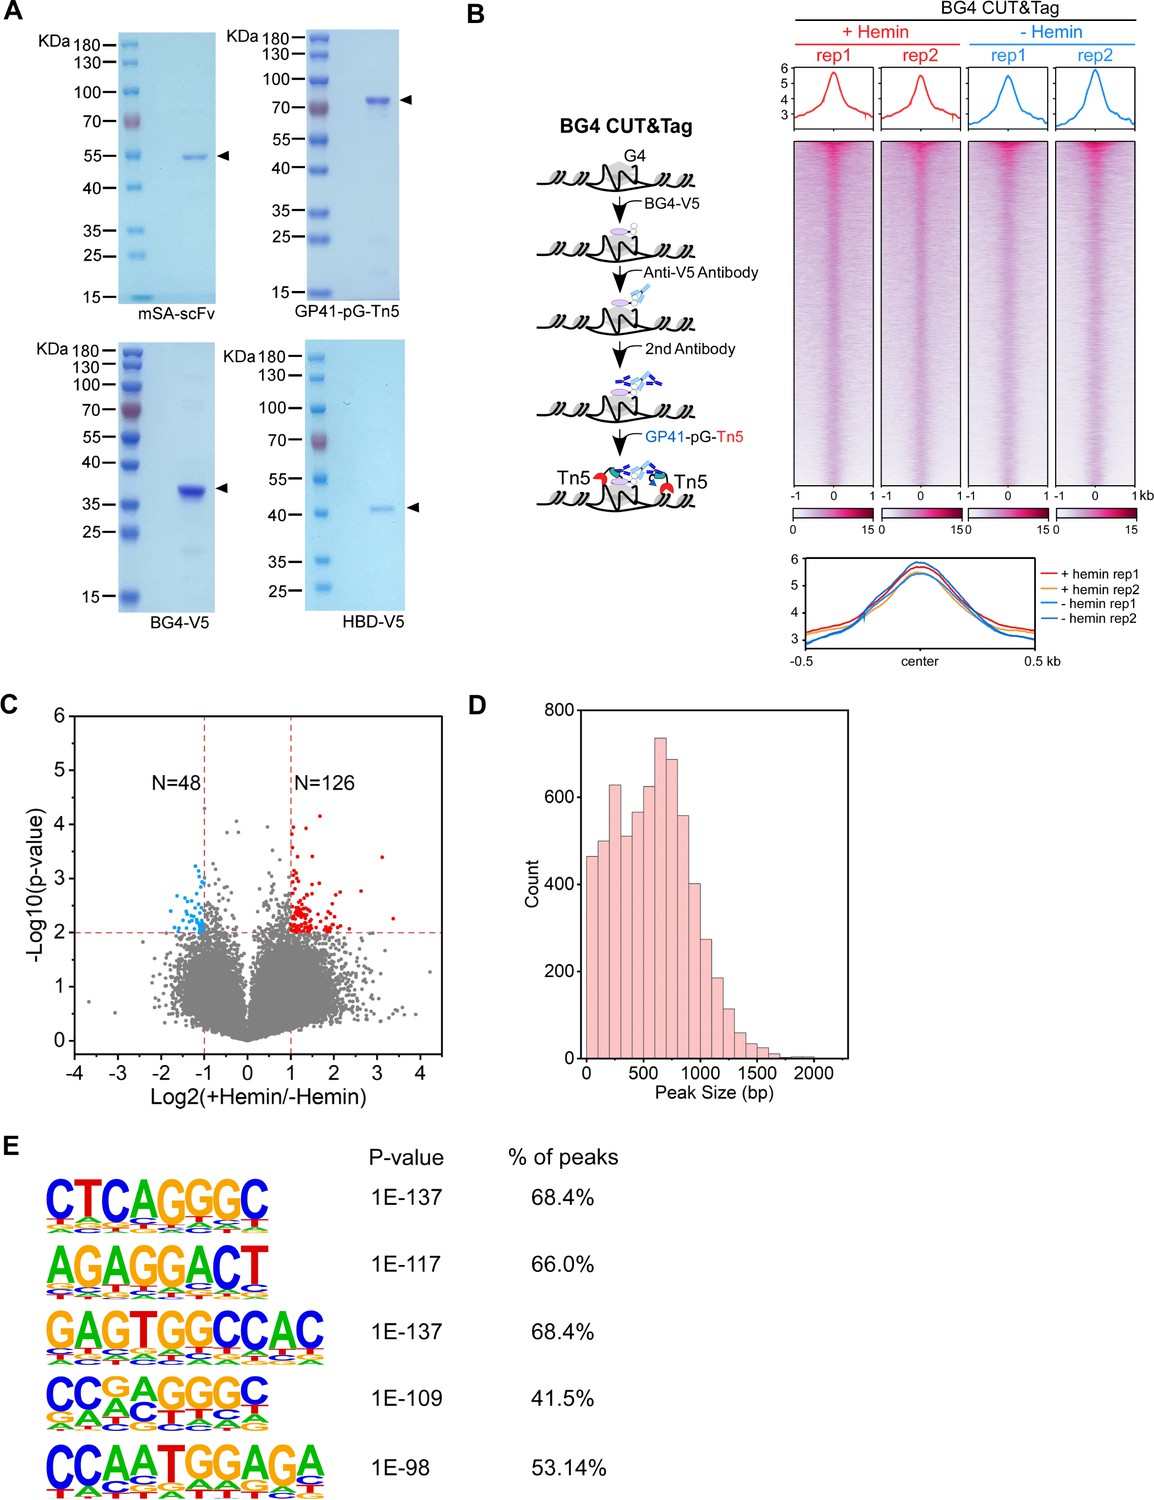
Comparison between the BG4-seq and HepG4-seq.
(A) The Coomassie blue stained SDS-PAGE gel showing the purified recombinant mSA-scFV (mSA and anti-GP41 scFV), GP41-pG-Tn5 (GP41 tag, protein G and Tn5), BG4-V5 (G4 scFV BG4 and V5 tag), and HBD-V5 (N-terminal hybrid-binding domain of RNase H1, EGFP, and V5 tag). (B) Left: Schematic of the BG4 CUT&Tag procedure. Right top: Heatmap showing the signal of BG4 CUT&Tag ±1.5 kb around the center of peaks in HEK293 cells treated with or without 25 µM hemin. Two biologically independent replicates are shown. Color scales represent the density of the signals. The average signal is plotted at the top of each heatmap panel. Right bottom: Profile plot showing the average signal of BG4 CUT&Tag reads around the center of peaks in HEK293 cells. (C) Volcano plot showing distributions of differential BG4 CUT&Tag peaks in HEK293 cells treated with or without 25 µM hemin. Significantly up-regulated (p-value <0.01, fold change ≥2) and down-regulated (p-value <0.01, fold change ≤0.5) peaks are labeled with red and blue dots, respectively. The numbers of up- or down-regulated peaks are labeled on the plot. (D) Bar chart showing the distribution of co-localized G-quadruplex (G4) & R-loop peak sizes in HEK293 cells. (E) The top enriched motifs of the extra accumulated peaks induced by inhibition of Werner syndrome ATP-dependent helicase (WRN) and Bloom syndrome protein (BLM) in the Figure 1H and I.
-
Figure 1—figure supplement 1—source data 1
PDF file containing original gel pictures for Figure 1—figure supplement 1A, indicating the selected regions.
- https://cdn.elifesciences.org/articles/99026/elife-99026-fig1-figsupp1-data1-v1.pdf
-
Figure 1—figure supplement 1—source data 2
Original files for gel pictures are displayed in Figure 1—figure supplement 1A.
- https://cdn.elifesciences.org/articles/99026/elife-99026-fig1-figsupp1-data2-v1.zip
Figure 2
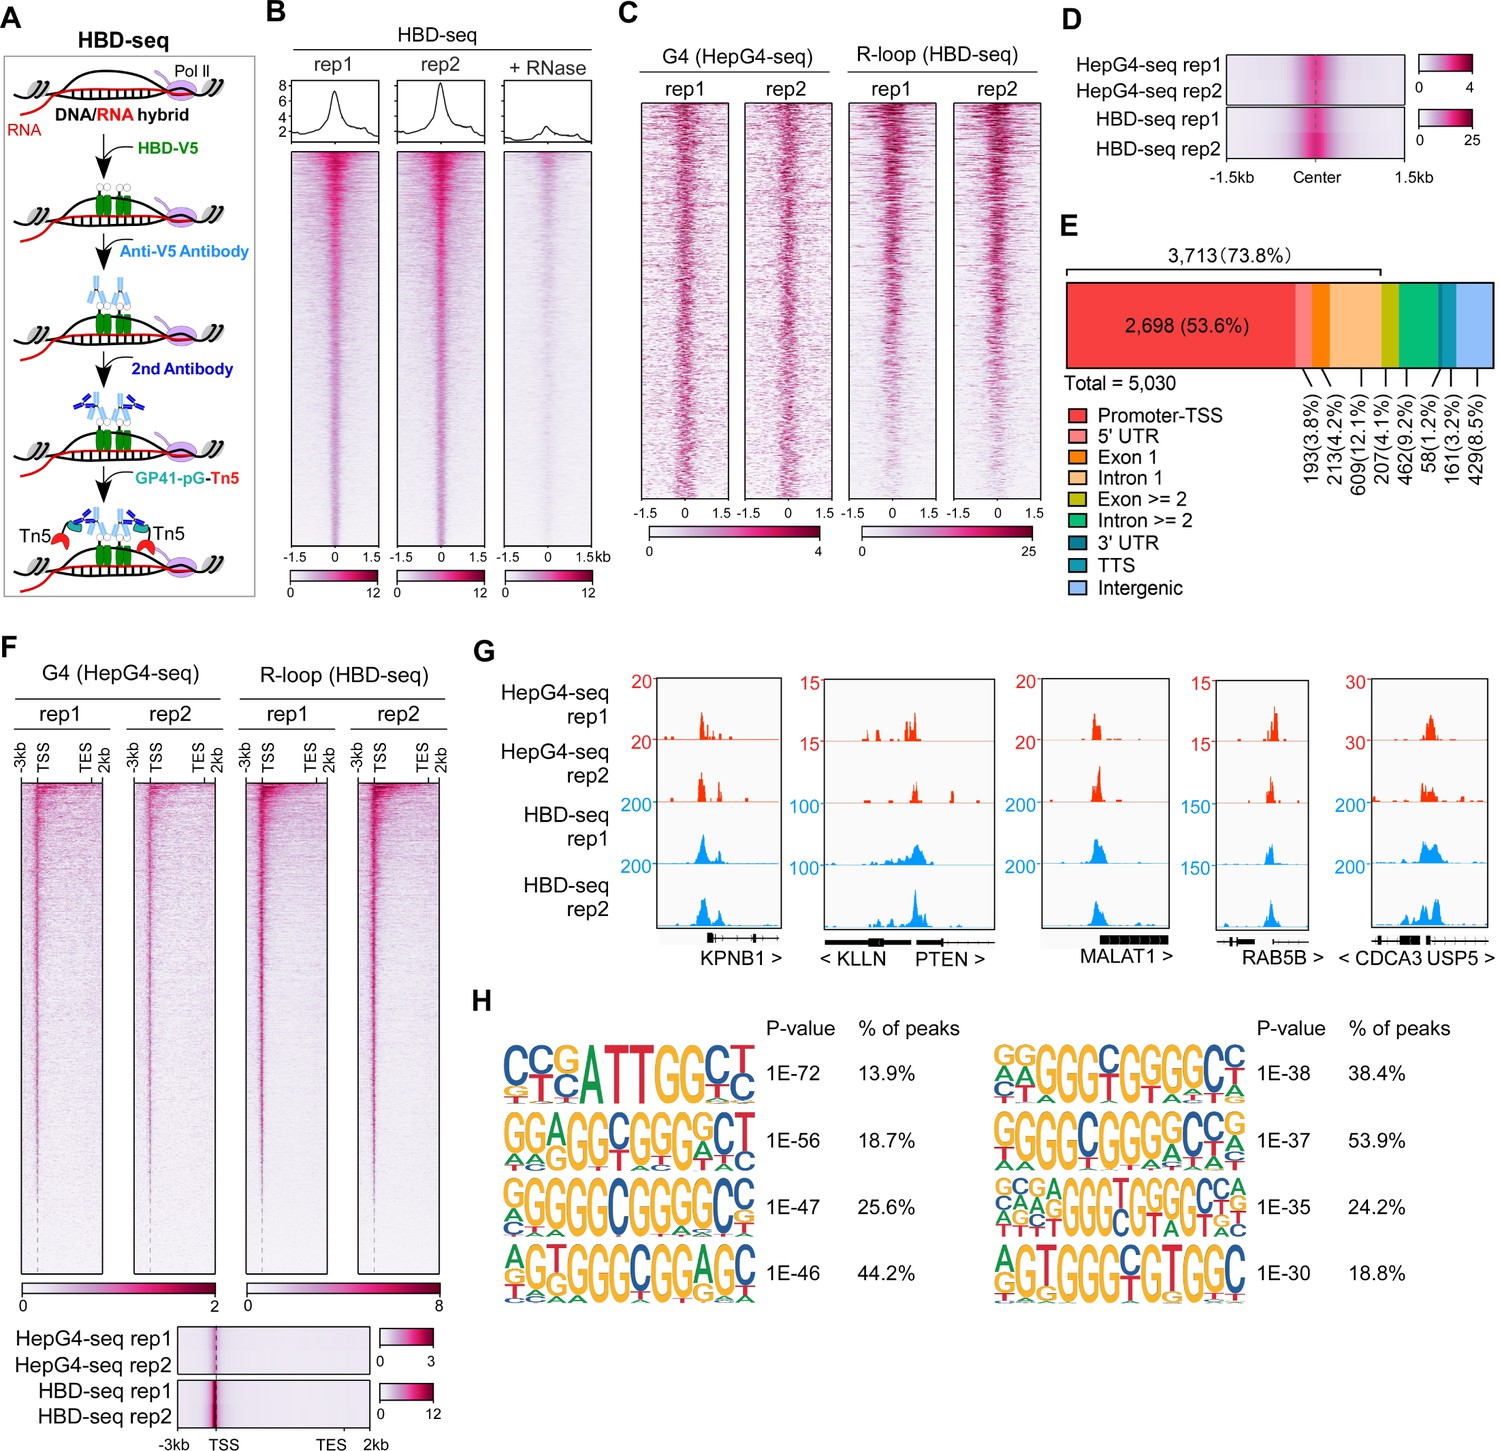
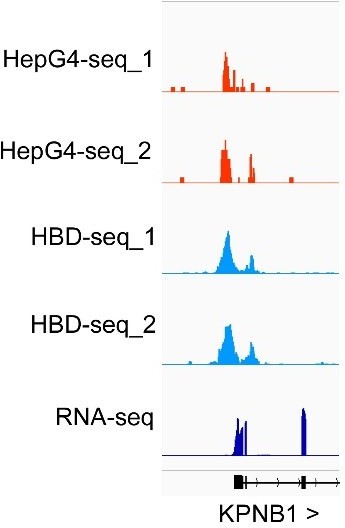
Mapping of the co-localized G-quadruplex (G4) and R-loop in the HEK 293 cells by combining the HepG4-seq and hybrid-binding domain (HBD)-seq.
(A) Schematic of the HBD-seq procedure. HBD-V5, the recombinant fusion protein of the N-terminal hybrid-binding domain (HBD) of RNase H1 and V5 tag; GP41-pG-Tn5, the recombinant fusion protein of the GP41 tag, protein G, and Tn5. (B) Heatmap showing the signal of HBD-seq reads ±1.5 kb around the center of peaks in HEK293 cells. Two biologically independent replicates are shown. ‘+RNase’ represents the treatment of RNase A and RNase H prior to the HBD-seq. Color scales represent the density of the signals. (C) Heatmap showing the signal of HepG4-seq and HBD-seq reads ±1.5 kb around the center of co-localized G4 and R-loop peaks in HEK293 cells. Color scales represent the density of the signals. (D) Profile plot showing the average signal of HepG4-seq and HBD-seq reads ±1.5 kb around the center of co-localized G4 and R-loop peaks in HEK293 cells. The plot is visualized using the heatmap. Color scales represent the density of the signals. (E) Distribution of the co-localized G4s and R-loops in HEK293 cells in different gene features. (F) Top: Heatmap showing the signal of HepG4-seq and HBD-seq reads of the co-localized G4s and R-loops in HEK293 cells along the gene body, 3 kb upstream of transcription start site (TSS) and 2 kb downstream of transcription end site (TES). Bottom: Profile plot showing the average signal of HepG4-seq and HBD-seq reads of the co-localized G4s and R-loops in HEK293 cells along the indicated gene features. The plot is visualized using the heatmap. Color scales represent the density of the signals. (G) Representative genome browser tracks showing the HepG4-seq and HBD-seq signals of the co-localized G4s and R-loops in HEK293 cells along the indicated genomic loci. (H) The top enriched motifs of the co-localized G4s and R-loops in HEK293 cells.
Figure 3
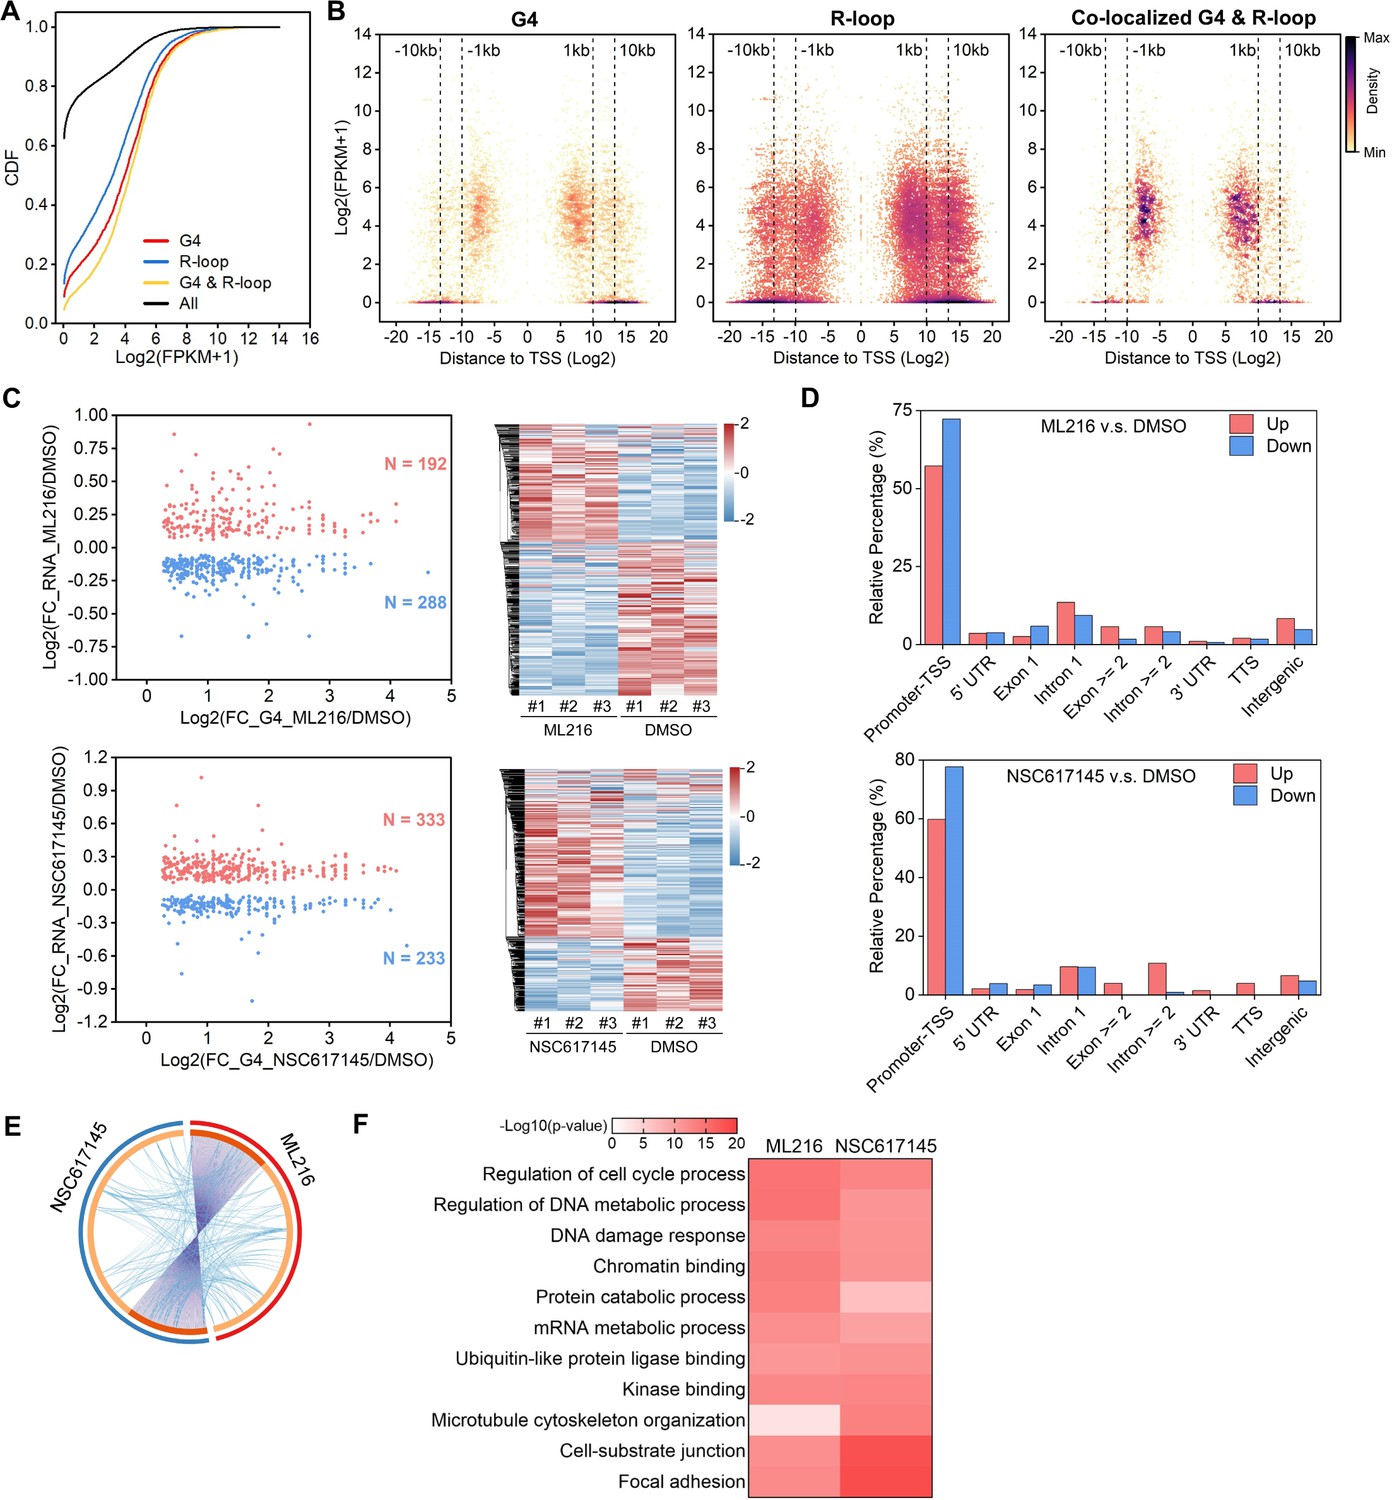
The co-localized G-quadruplexes (G4s) and R-loops-mediated transcriptional regulation in HEK293 cells.
(A) Cumulative distribution plot showing comparisons of FPKMs of G-quadruplexe (G4), R-loop, co-localized G4 & R-loop associated genes and all genes in HEK293 cells. (B) Scatter plot showing the distributions of FPKMs of G4, R-loop, co-localized G4 & R-loop-associated genes versus the distances of G4, R-loop, co-localized G4 & R-loop to nearest transcription start site (TSS). The distance is in bp. Color scales represent the density of dots. (C) Left: Scatter plot showing the distributions of foldchanges (FCs) of RNA levels of co-localized G4 & R-loop -associated genes (p-value <0.05) versus FCs of G4 signals of co-localized G4s & R-loops (FC ≥ 1.5) after treatment with indicated inhibitors of G4 resolving helicases Bloom syndrome protein (BLM) or Werner syndrome ATP-dependent helicase (WRN). The number of genes were labeled on the plot. Right: Heatmap showing differential expression levels of co-localized G4 & R-loop-associated genes after treatment with indicated G4 inhibitors. RNA-seq data are from three biologically independent repeats. Color scales represent the normalized expression levels. (D) Distributions of co-localized G4s & R-loops expressions of which-associated genes were significantly up- or down-regulated after treatment with indicated G4 inhibitors across different gene features. (E) Circos plot showing the overlap co-localized G4 & R-loop-associated genes differentially expressed after the treatment of ML216 or NSC617145 in HEK293 cells. Purple lines link the same gene that ares shared by multiple groups. Blue lines link the genes, although different, fall under the same ontology term. Dark orange color of the inside arc represents the genes that are shared by multiple groups and the light orange color of the inside arc represents genes that are unique to that group. (F) Heatmap showing the GO-based enrichment terms of co-localized G4 & R-loop-associated genes differentially expressed after the treatment of ML216 or NSC617145 in HEK293 cells. The heatmap cells are colored by their p-values.
Figure 4 with 1 supplement
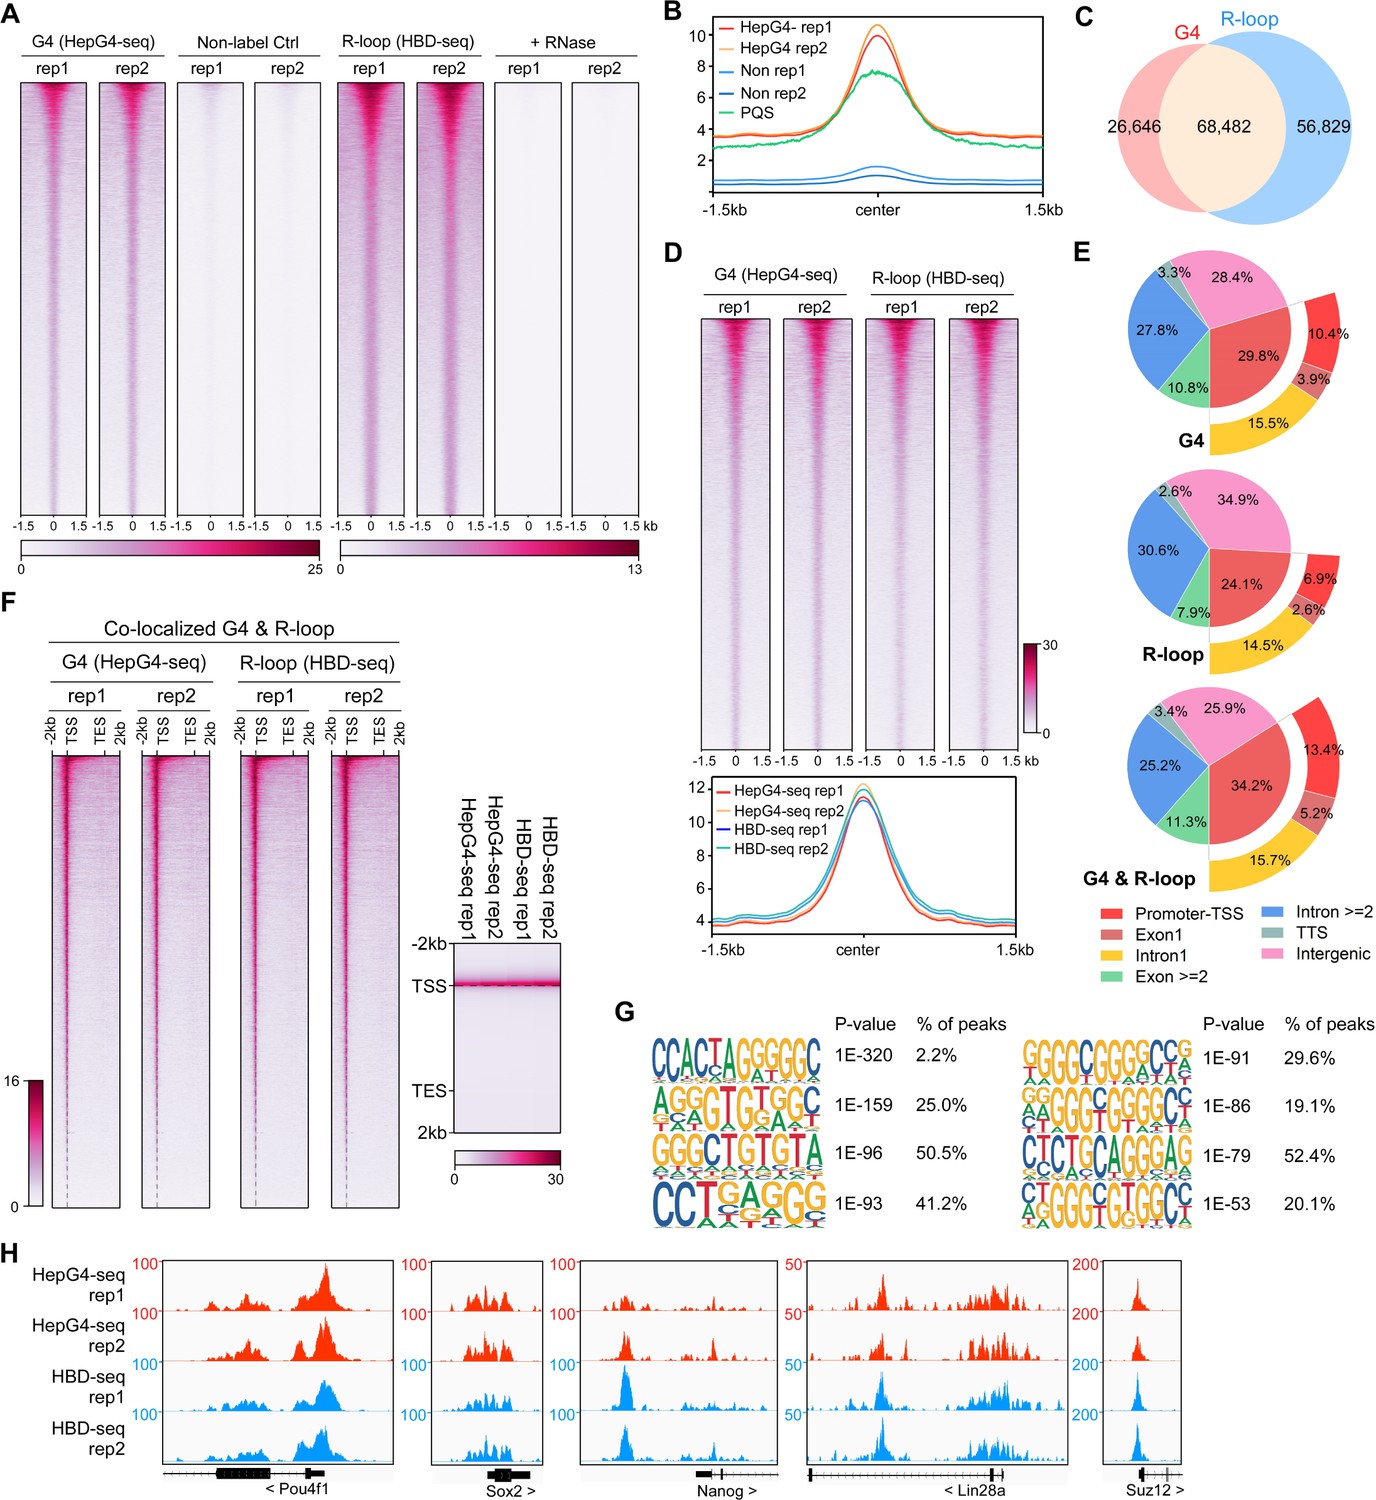
Mapping of the co-localized G-quadruplexes (G4s) and R-loops in the mouse embryonic stem cells.
(A) Heatmap showing the signal of HepG4-seq and hybrid-binding domain (HBD)-seq ±1.5 kb around the center of peaks in mouse embryonic stem cells (mESCs). Two biologically independent replicates are shown. Two biologically independent non-label replicates were the negative controls for HepG4-seq. Two biologically independent replicates with the treatment of RNase A and RNase H prior to HBD-seq were the negative controls for HBD-seq. Color scales represent the density of the signals. (B) Profile plot showing the average signal of HepG4-seq reads ±1.5 kb around the center of peaks and the average max Scores of PQS calculated by pqsfinder at the same positions. HepG4 rep1/rep2, two biologically independent HepG4-seq replicates in mESCs; Non rep1/rep2, two biologically independent non-label negative control replicates in mESCs. (C) Venn diagram comparing the DNA G4 and R-loop in mESCs. (D) Top: Heatmap showing the signal of HepG4-seq and HBD-seq ±1.5 kb around the center of co-localized G4s & R-loops in mESCs. Two biologically independent replicates are shown. Color scales represent the density of the signals. Bottom: Profile plot showing the average signal of HepG4-seq and HBD-seq reads ±1.5 kb around the center of co-localized G4s & R-loops in mESCs. (E) Distribution of G4s, R-loops, and co-localized G4s & R-loops signals in mESCs in different gene features. (F) Left: Heatmap showing the signal of HepG4-seq and HBD-seq reads of the co-localized G4s & R-loops in mESCs along the gene body, 2 kb upstream of TSS and 2 kb downstream of TES. Right: Profile plot showing the average signal of HepG4-seq and HBD-seq reads of the co-localized G4s & R-loops in mESCs along the indicated gene features. The plot is visualized using the heatmap. Color scales represent the density of the signals. (G) The top enriched motifs of the co-localized G4s & R-loops in mESCs. (H) Representative genome browser tracks showing the HepG4-seq and HBD-seq signals of the co-localized G4s & R-loops in mESCs along the indicated genomic loci.
Figure 4—figure supplement 1

Distribution of co-localized G4 & R-loop peak sizes.
(A) Bar chart showing the distribution of co-localized G-quadruplex (G4) & R-loop peak sizes in mouse embryonic stem cells (mESCs). Different, the strand of PQS localized is the same as the template strand of the nearest gene; NA, no PQS.
Figure 5
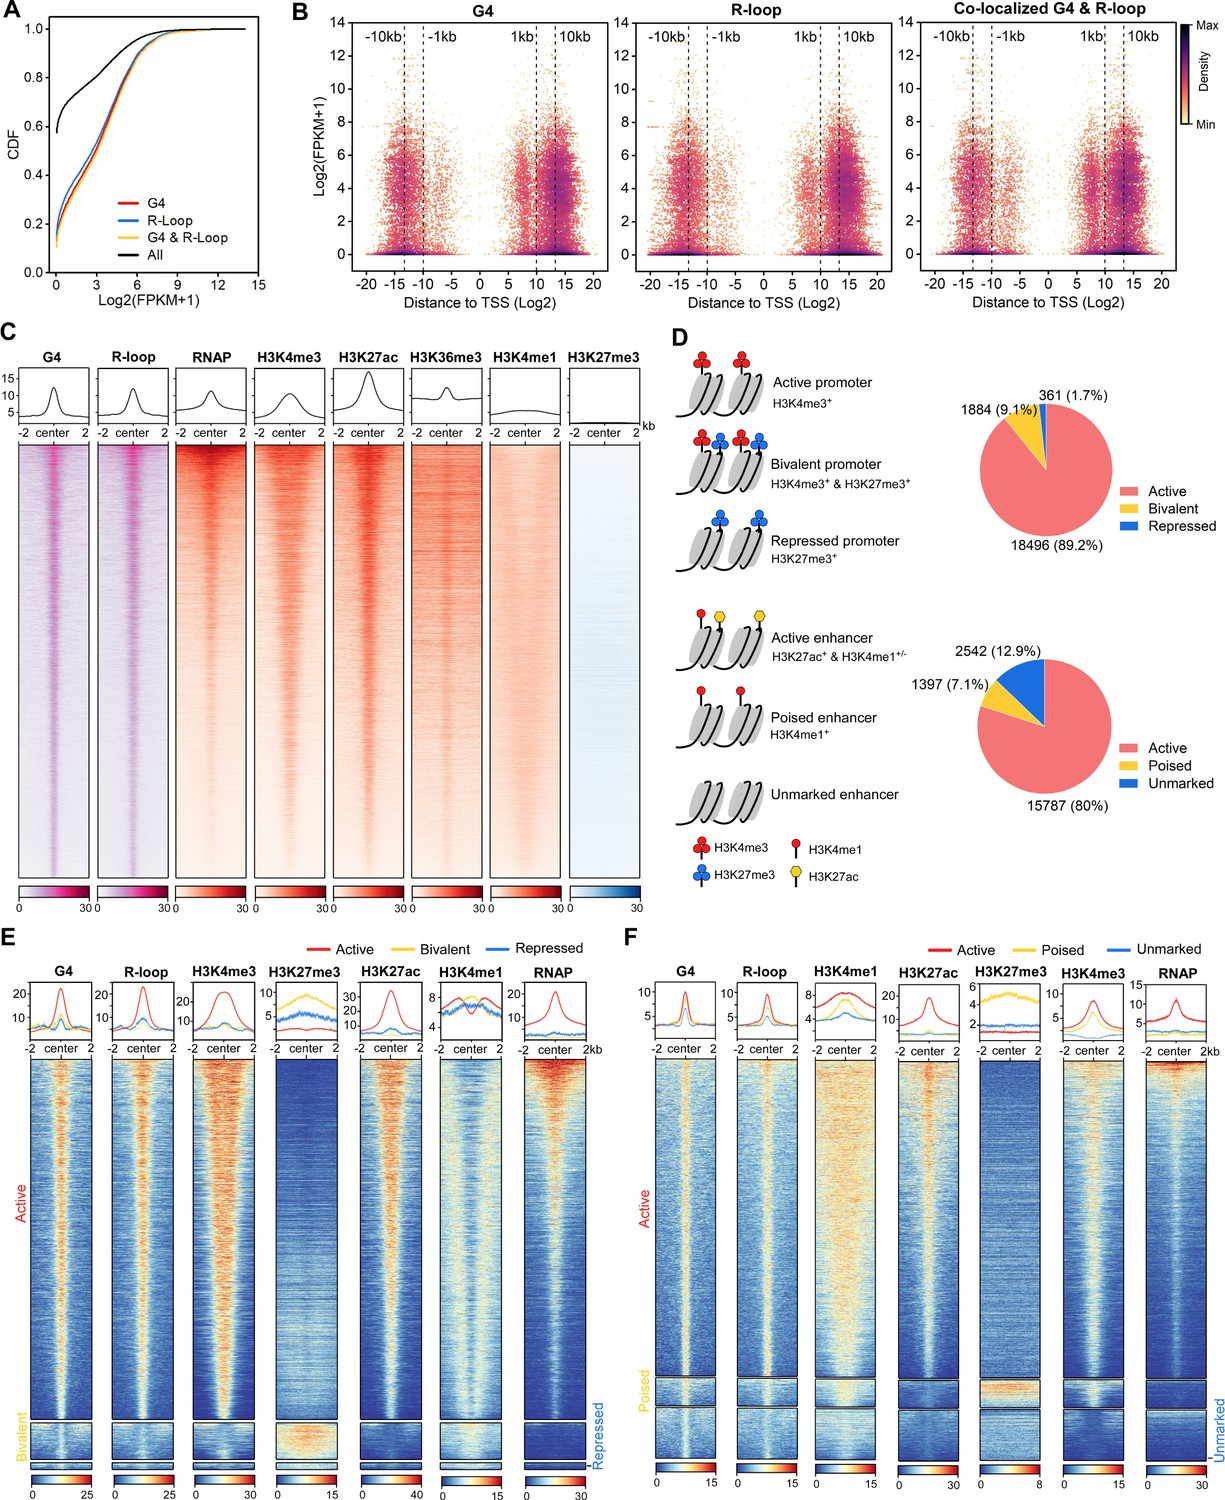
The co-localized G-quadruplexes (G4s) & R-loops are mainly localized in active promoters and enhancers.
(A) Cumulative distribution plot showing comparisons of FPKMs of G4-, R-loop-, and co-localized G4 & R-loop-associated genes and all genes in mouse embryonic stem cells (mESCs). (B) Scatter plot showing the distributions of FPKMs of G4-, R-loop-, and co-localized G4 & R-loop -associated genes versus the distances of these peaks to the nearest transcription start site (TSS). The distance is in bp. Color scales represent the density of dots. (C) Heatmap showing the signal of representative HepG4-seq (G4), HBD-seq (R-loop), RNA polymerase II Ser5P, H3K4me3, H3K27ac, H3K36me3, H3K4me1, and H3K27me3±2 kb around the center of the co-localized G4s & R-loops in mESCs. Color scales represent the density of the signals. The average signal is plotted at the top of each heatmap panel. (D) Schematic of different types of promoters and enhancers. Pie chart showing the proportion of different types of promoters or enhancers that harbor the co-localized G4s & R-loops. (E, F) Heatmap showing the signal of representative HepG4-seq (G4), HBD-seq (R-loop), RNA polymerase II Ser5P, H3K4me3, H3K27ac, H3K36me3, H3K4me1, and H3K27me3±2 kb around the center of the co-localized G4s & R-loops in the different types of promoters (E) or enhancers (F) in mESCs. Color scales represent the density of the signals. The average signal is plotted at the top of each heatmap panel.
Figure 6 with 1 supplement
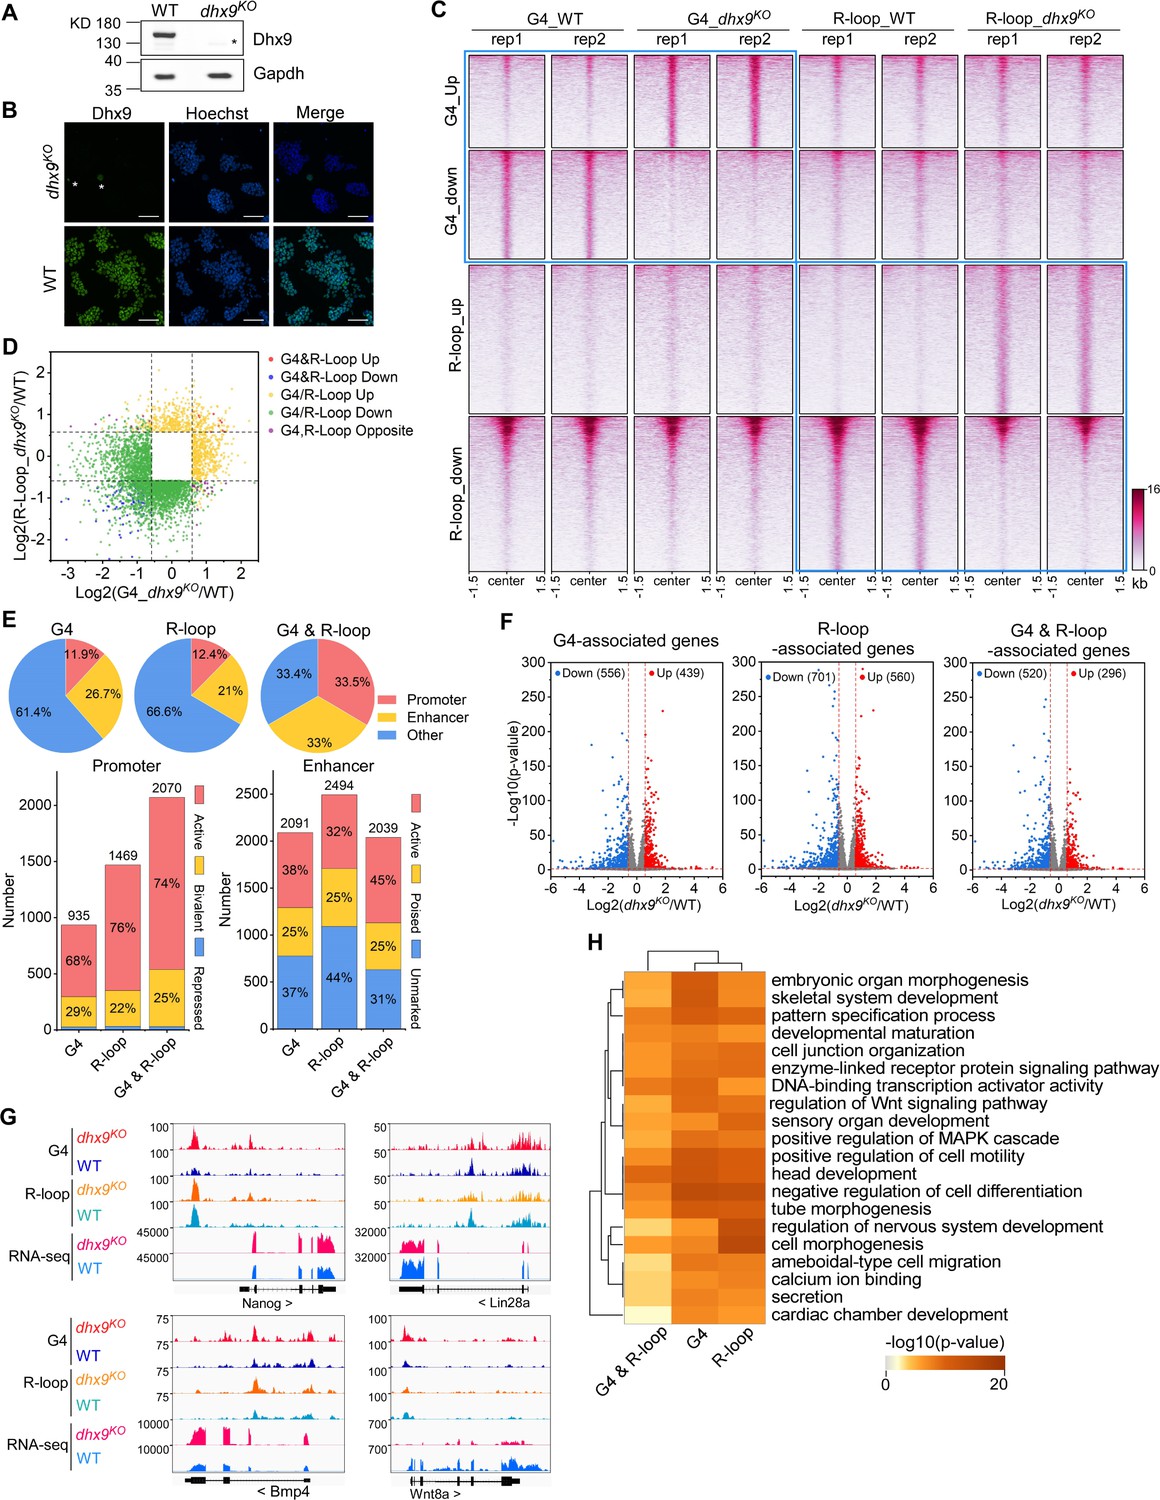
Modulation of the co-localized G-quadruplexes (G4s) & R-loops by the helicase Dhx9.
(A) Western blot showing the protein levels of Dhx9 and Gapdh in the wild-type (WT) and dhx9KO mouse embryonic stem cells (mESCs). The non-specific band is labeled with a star. This experiment was repeated once with similar results. (B) Immunofluorescence staining of Dhx9 in the WT and dhx9KO mESCs cultured without mouse embryonic fibroblasts (MEFs) feeder. Nuclei were stained with the Hoechst33342. The immunofluorescence signal of contaminated MEFs is labeled with a a star. Scale bar, 100 µm. (C) Heatmap showing the signal of DNA G4 (HepG4-seq) and R-loop (HBD-seq) ±1.5 kb around the center of significantly differential peaks (p-value <0.05, fold change ≥1.5) in WT and dhx9KO mESCs. Two biologically independent replicates are shown. Color scales represent the density of the signals. (D) Scatter plot showing distributions of foldchanges of differential G4s versus foldchanges of differential R-loop in WT and dhx9KO mESCs. ‘G4&R-loop Up,’ both G4 and R-loop up-regulated; ‘G4&R-loop Down,’ both G4 and R-loop down-regulated; ‘G4/R-loop Up,’ G4 or R-loop up-regulated; ‘G4/R-loop Down,’ G4 or R-loop down-regulated; ‘G4, R-loop Opposite,’ G4 up-regulated and R-loop down-regulated, or, G4 down-regulated and R-loop up-regulated. (E) Top: pie chart showing proportions of differential G4s, R-loops, and co-localized G4s & R-loops in dhx9KO mESCs in promoters, enhancers, and other regions; Bottom: bar chart showing numbers of differential G4, R-loops and co-localized G4s & R-loops in dhx9KO mESCs in different types of promoters or enhancers. (F) Volcano plot showing distributions of G4-, R-loop-, or co-localized G4 & R-loop-associated genes differentially expressed in WT and dhx9KO mESCs. Significantly up-regulated (p-value <0.05, fold change ≥1.5) and down-regulated (p-value <0.05, fold change ≤0.67) genes in the dhx9KO mESCs are labeled with red and blue dots, respectively. The numbers of up- or down-regulated genes are labeled on the plot. (G) Representative genome browser tracks showing the G4 (HepG4), R-loop (HBD-seq), and RNA-seq signals in WT and dhx9KO mESCs along the indicated genomic loci. (H) GO-based enrichment terms of G4-, R-loop-, or co-localized G4 & R-loop-associated genes differentially expressed in WT and dhx9KO mESCs were hierarchically clustered into a tree based on Kappa-statistical similarities among their gene memberships. The heatmap cells are colored by their p-values.
-
Figure 6—source data 1
PDF file containing original western blots for Figure 6A and original microscope images for Figure 6B, indicating the selected regions.
- https://cdn.elifesciences.org/articles/99026/elife-99026-fig6-data1-v1.pdf
-
Figure 6—source data 2
Original files for western blots are displayed in Figure 6A and microscope images are displayed in Figure 6B.
- https://cdn.elifesciences.org/articles/99026/elife-99026-fig6-data2-v1.zip
Figure 6—figure supplement 1
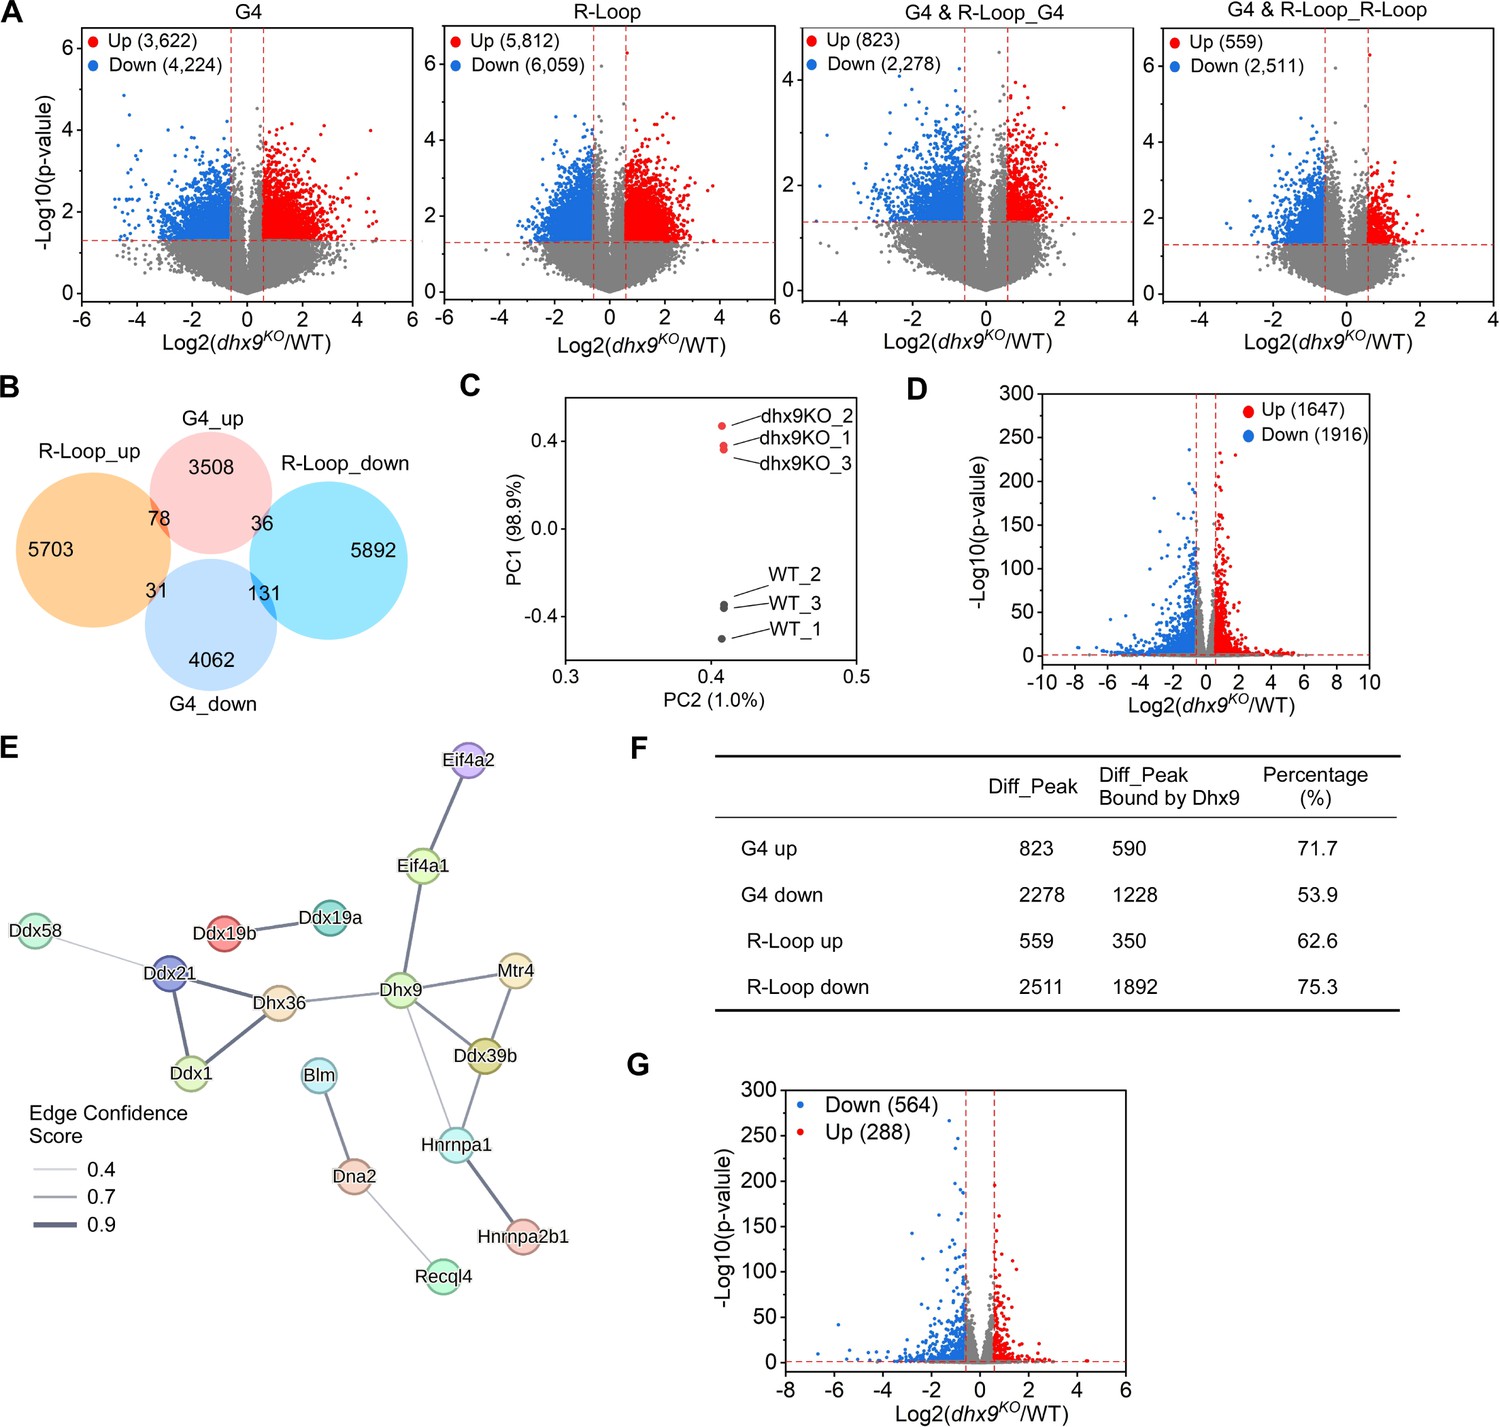
This figure is linked to both Figure 6 and Figure 7.
(A) Volcano plot showing distributions of differential G-quadruplexes (G4s) and R-loops in wild-type (WT) and dhx9KO mouse embryonic stem cells (mESCs). Significantly up-regulated (p-value <0.05, fold change ≥1.5) and down-regulated (p-value <0.05, fold change ≤0.67) G4s or R-loops in the dhx9KO mESCs are labeled with red and blue dots, respectively. The numbers of up- or down-regulated G4s or R-loops are labeled on the plot. (B) Venn diagram comparing differential G4s or R-loops in WT and dhx9KO mESCs. (C) Principal component analysis (PCA) of RNA levels of WT and dhx9KO mESCs. (D) Volcano plot showing distributions of genes differentially expressed in WT and dhx9KO mESCs. Significantly up-regulated (p-value <0.05, fold change ≥1.5) and down-regulated (p-value <0.05, fold change ≤0.67) genes in the dhx9KO mESCs are labeled with red and blue dots, respectively. The numbers of up- or down-regulated genes are labeled on the plot. (E) The STRING protein-protein physical interaction network of G4s and/or R-loops resolving helicases or regulators that are differentially expressed in WT and dhx9KO mESCs. The line thickness indicates the edge confidence scores that report the strength of data support from the STRING database. The minimum required edge confidence score is 0.4. (F) Table summarizing the differential co-localized G4s & R-loops in the absence of Dhx9 and the differential co-localized G4s & R-loops directly bound by Dhx9. (G) Volcano plot showing distributions of genes differentially expressed in WT and dhx9KO mESCs. Significantly up-regulated (p-value <0.05, fold change ≥1.5) and down-regulated (p-value <0.05, fold change ≤0.67) genes in the dhx9KO mESCs are labeled with red and blue dots, respectively. The numbers of up- or down-regulated genes are labeled on the plot.
Figure 7
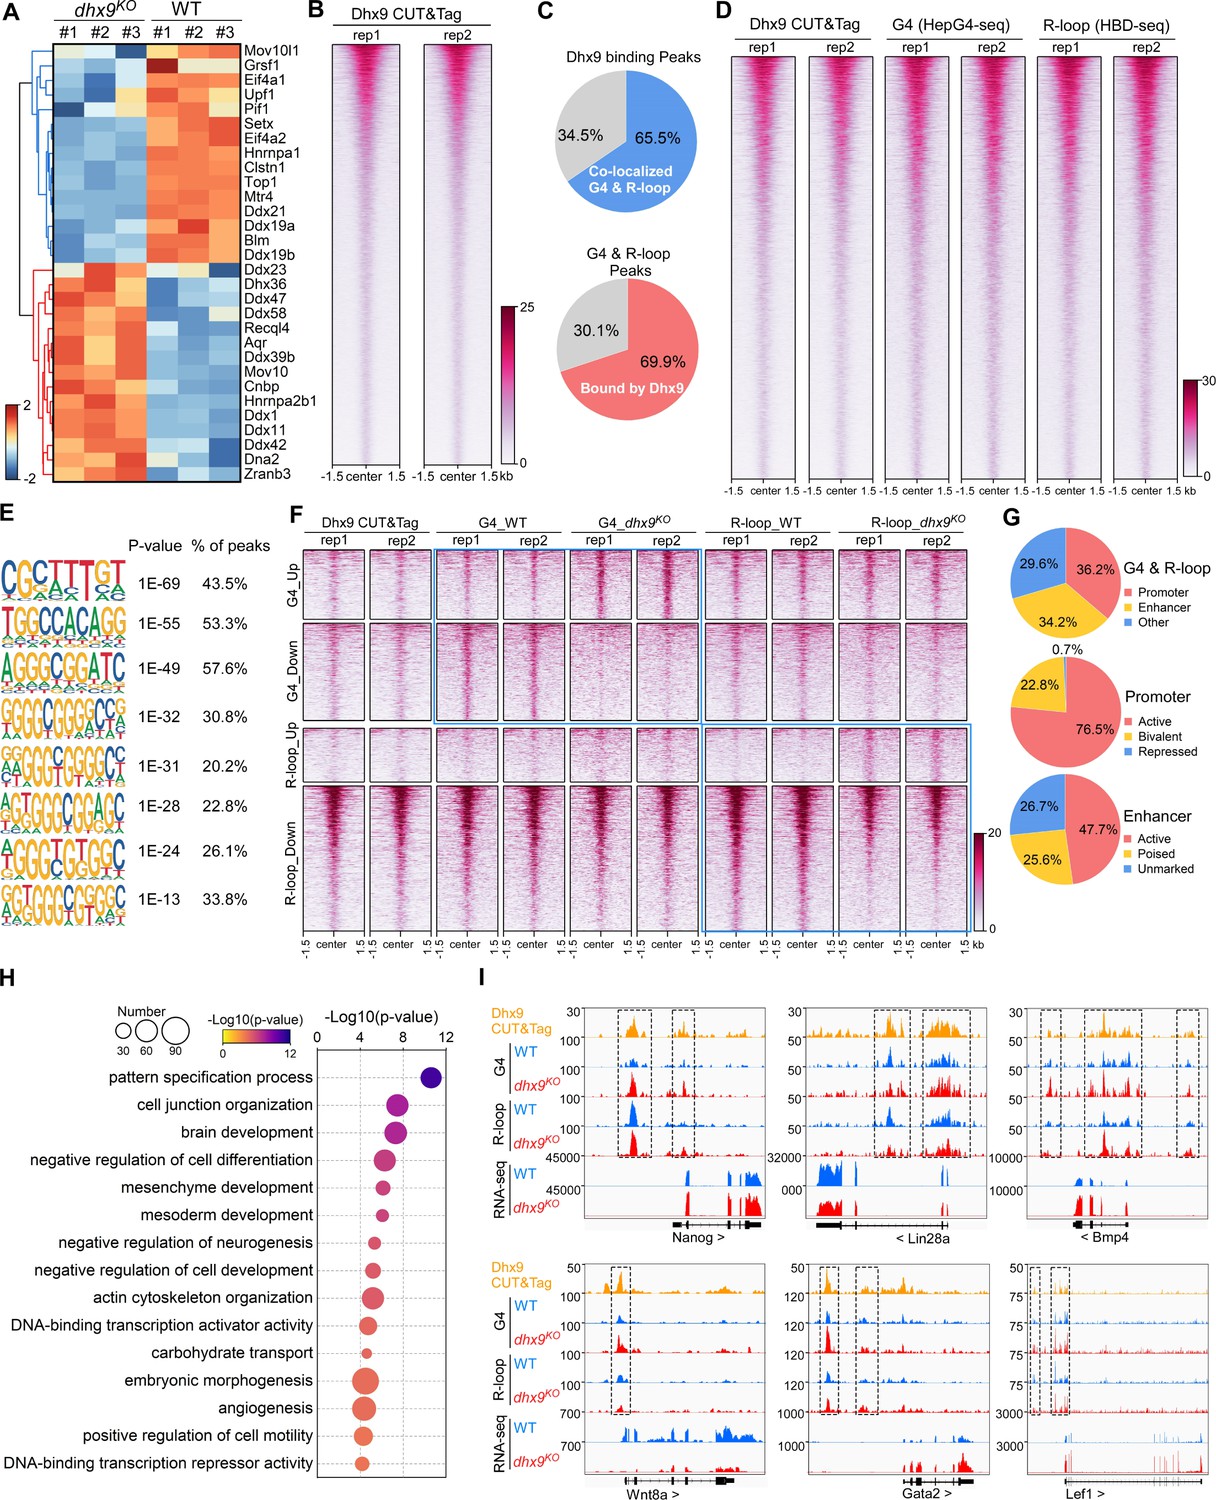
Characterization of the co-localized G-quadruplexes (G4s) & R-loops directly bound by Dhx9.
(A) Heatmap showing expression levels of resolving helicases or regulators of G4s and/or R-loops differentially expressed in wild-type (WT) and dhx9KO mouse embryonic stem cells (mESCs). Color scales represent the normalized expression levels. (B) Heatmap showing the signal of Dhx9 CUT&Tag reads ±1.5 kb around the center of peaks in WT mESCs. Two biologically independent replicates are shown. Color scales represent the density of the signals. (C) Pie chart showing proportions of the overlapping peaks between Dhx9 binding peaks and the co-localized G4 & R-loops peaks. (D) Heatmap showing the signal of Dhx9 CUT&Tag, HepG4-seq, and HBD-seq ±1.5 kb around the center of Dhx9-bound Co-localized G4 & R-loop peaks in mESCs. Two biologically independent replicates are shown. Color scales represent the density of the signals. (E) The top enriched motifs of Dhx9 binding peaks overlapping with the co-localized G4 & R-loops in mESCs. (F) Heatmap showing the signal of Dhx9 CUT&Tag, HepG4-seq and HBD-seq ±1.5 kb around the center of Dhx9-bound significantly differential Co-localized G4 & R-loop peaks (p-value <0.05, fold change ≥1.5) in WT and dhx9KO mESCs. Two biologically independent replicates are shown. Color scales represent the density of the signals. (G) Pie chart showing proportions of differential Dhx9-bound co-localized G4 & R-loops in dhx9KO mESCs in different types of promoters or enhancers. (H) Top enriched GO terms in Dhx9-bound co-localized G4 & R-loop-associated genes that are differentially expressed in WT and dhx9KO mESCs. The bubble size represents the number of genes in each indicated term. The color scale represents the p-value. (I) Representative genome browser tracks showing the Dhx9 CUT&Tag, G4 (HepG4), R-loop (HBD-seq), and RNA-seq signals in WT and dhx9KO mESCs along the indicated genomic loci. The dashed box highlights Dhx9-bound significantly differential co-localized G4 & R-loop peaks in dhx9KO mESCs.
Figure 8
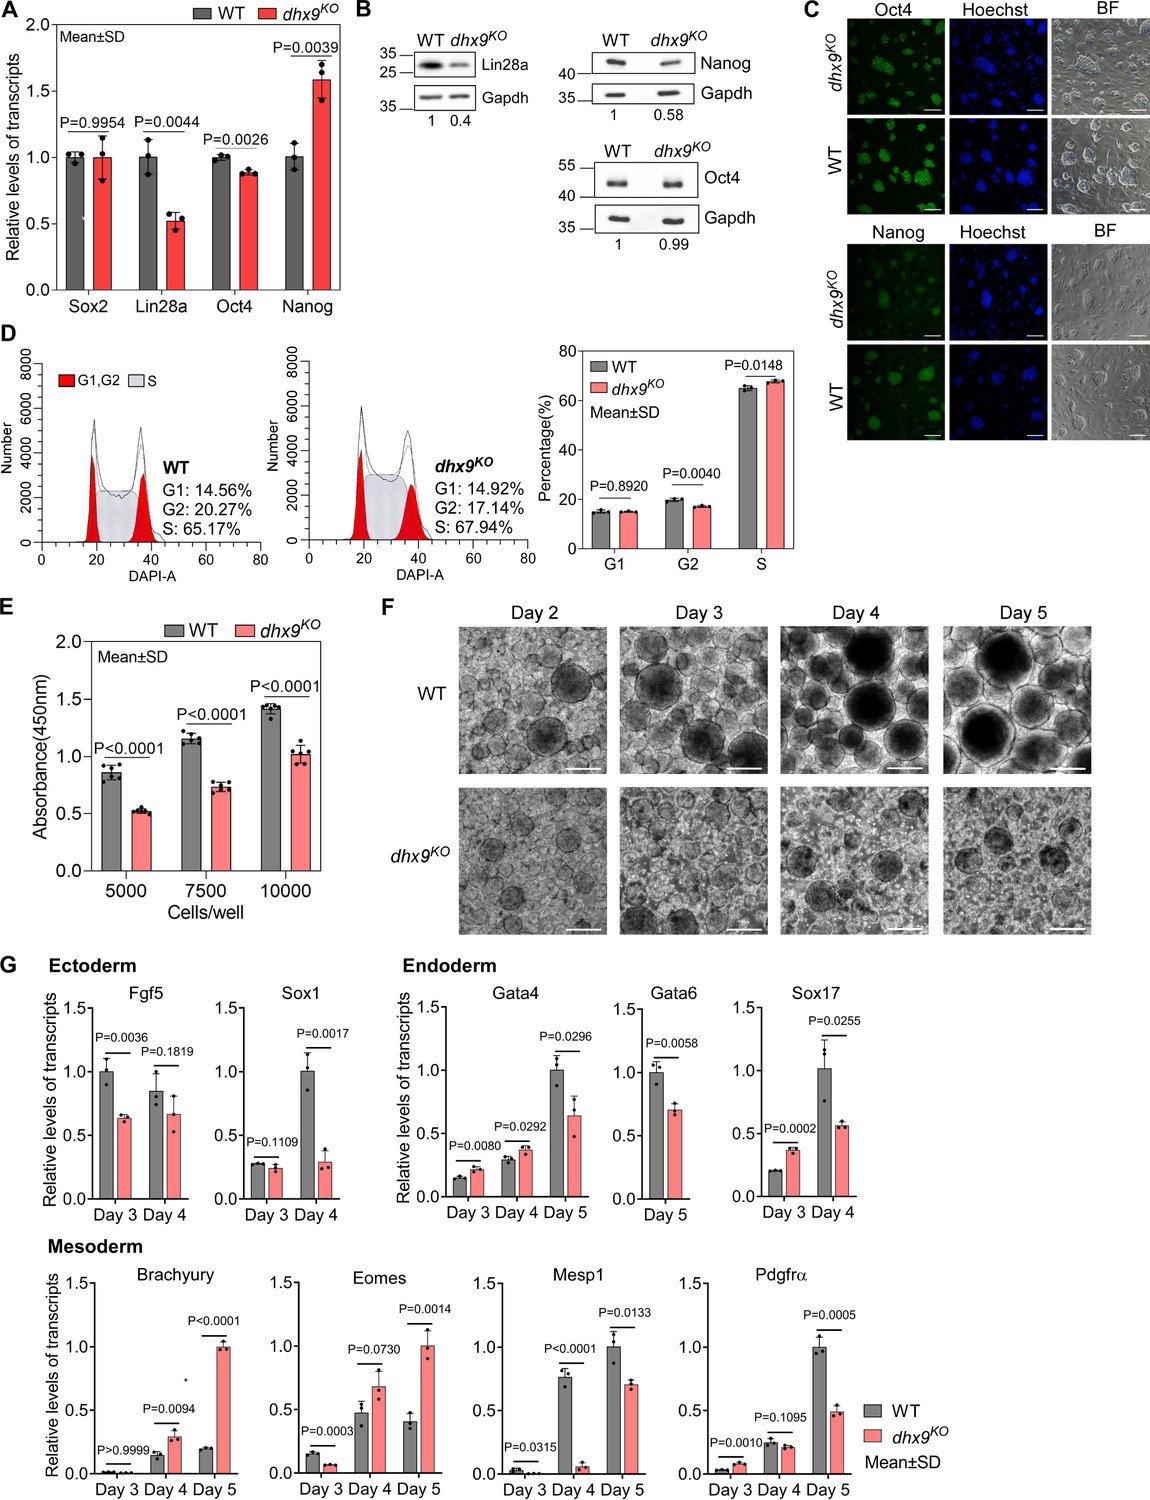
Dhx9 regulates the cell fate of mouse embryonic stem cells.
(A) Relative RNA levels of indicated genes in the wild-type (WT) and dhx9KO mouse embryonic stem cells (mESCs) that were measured by quantitative RT-PCR (qRT-PCR). Data are means ± SD; n=3 (three independent biological samples), significance was determined using the two-tailed Student’s t-test. (B) Western blot showing the protein levels of indicated genes in the WT and dhx9KO mESCs. The normalized relative protein levels were labeled below each panel, where gel images were quantified by ImageJ and the level of Gapdh was used for normalization. This experiment was repeated once with similar results. (C) Immunofluorescence staining of Oct4 and Nanog in the WT and dhx9KO mESCs cultured on MEF feeder. Nuclei were stained with the Hoechst33342. BF, bright field. Scale bar, 100 µm. (D) Cell cycle profiles determined by flow cytometry of DAPI staining in the WT and dhx9KO mESCs. The proportions of different phases of the cell cycle were analyzed by ModFit. Data are means ± SD; n=3, and significance was determined using the two-tailed Student’s t-test. (E) Cell proliferation rate of WT and dhx9KO mESCs were measured by CCK-8 cell proliferation assay. The number of cells seeded at the beginning was labeled at the x-axis. Absorbance at 450 nm was determined after 2 days of culture. Data are means ± SD; n=6, and significance was determined using the two-tailed Student’s t-test. (F) Pictures of embryoid bodies at indicated days of in vitro differentiation of WT and dhx9KO mESCs. Scale bar, 200 µm. (G) Relative RNA levels of indicated genes in the WT and dhx9KO embryoid bodies at indicated days of in vitro differentiation that were measured by qRT-PCR. Data are means ± SD; n=3, and significance was determined using the two-tailed Student’s t-test.
-
Figure 8—source data 1
PDF file containing original western blots for Figure 8B and original microscope images for Figure 8C and F, indicating the selected regions.
- https://cdn.elifesciences.org/articles/99026/elife-99026-fig8-data1-v1.pdf
-
Figure 8—source data 2
Original files for western blots are displayed in Figure 8B and microscope images are displayed in Figure 8C and F.
- https://cdn.elifesciences.org/articles/99026/elife-99026-fig8-data2-v1.zip
Figure 9
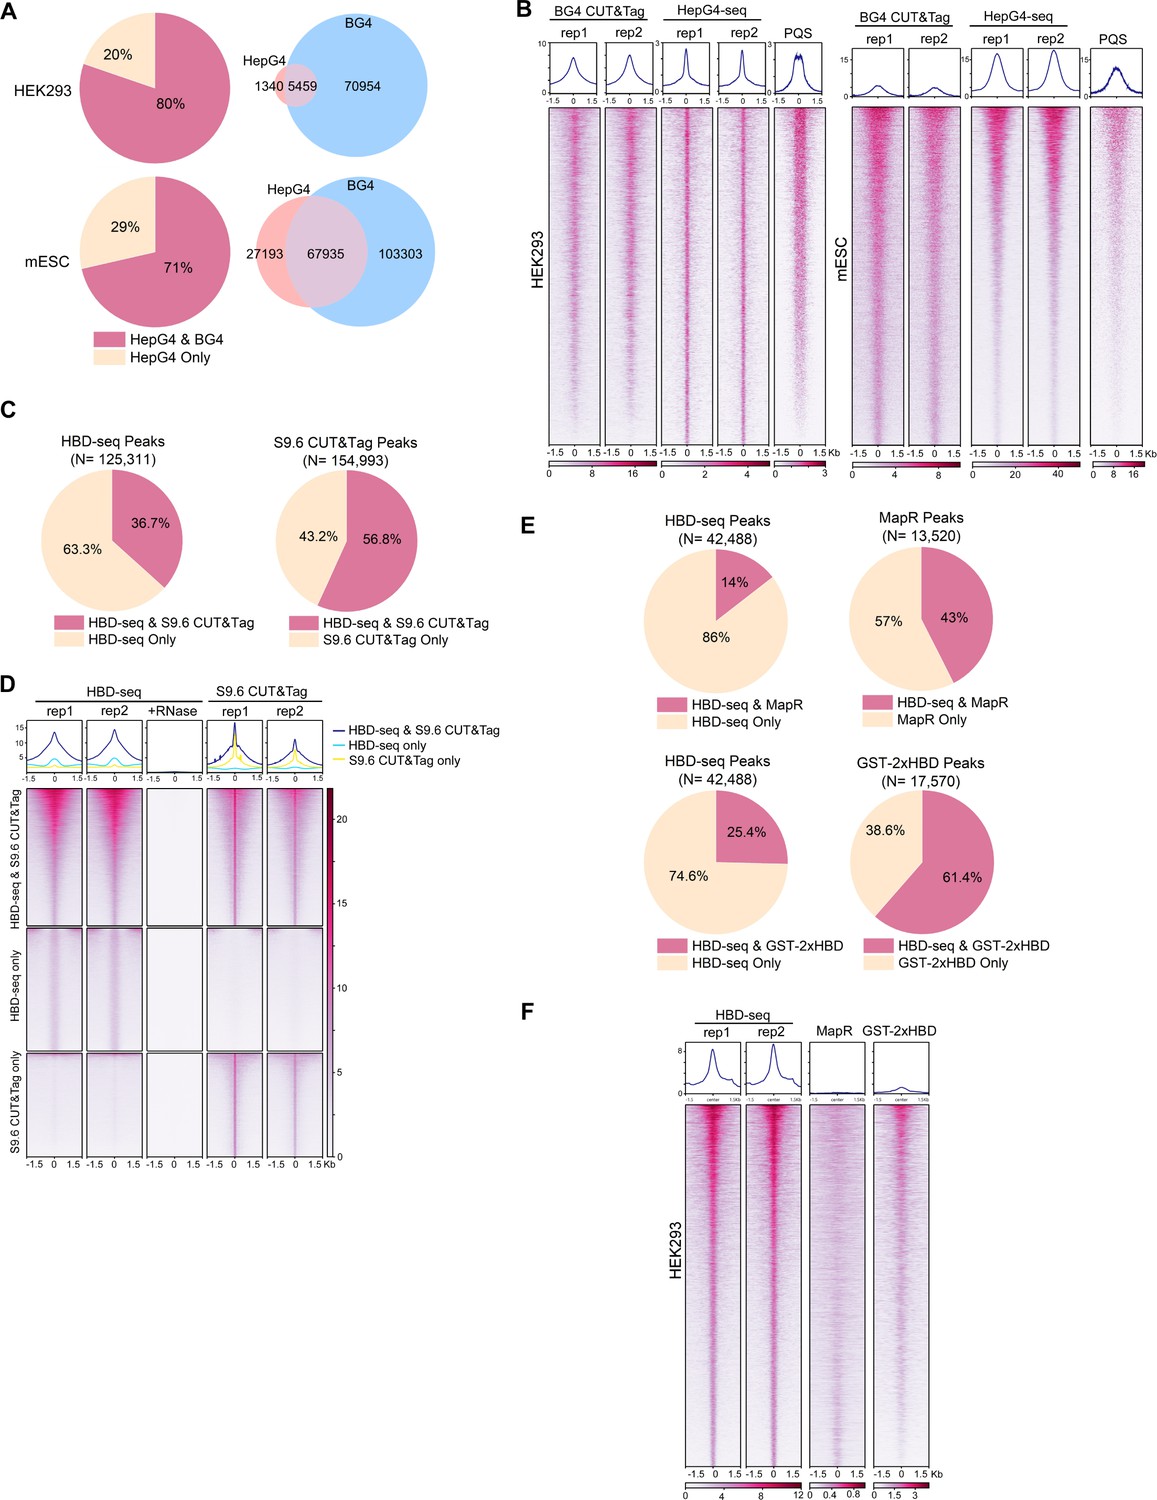
Comparisons of HepG4-seq and hybrid-binding domain (HBD)-seq with previous methods.
(A) Pie charts showing the percentages of HepG4-seq peaks overlapping with peaks identified by BG4 CUT&Tag; Venn diagrams comparing HepG4-seq peaks and BG4 CUT&Tag seqs. (B) Heatmap showing the signal of BG4 CUT&Tag, HepG4-seq, and maxScores of PQS ±1.5 kb around the center of peaks identified by both BG4 CUT&Tag and HepG4-seq in HEK293 cells or mouse embryonic stem cells (mESCs). Color scales represent the density of the signals. Top: Profile plot showing the average signal. Rep1/rep2, two biologically independent replicates. (C) Pie charts showing the overlapping percentages of peaks between HBD-seq and S9.6 CUT&Tag in mESCs. (D) Heatmap showing the signal of HBD-seq and S9.6 CUT&Tag ± 1.5 kb around the center of peaks identified by HBD-seq and S9.6 CUT&Tag in mESCs. Color scales represent the density of the signals. Top: Profile plot showing the average signal. Rep1/rep2, two biologically independent replicates. (E) Pie charts showing the overlapping percentages of peaks between HBD-seq and MapR or GST-2xHBD CUT&Tag in HEK293 cells. (F) Heatmap showing the signal of HBD-seq, MapR, and GST-2xHBD CUT&Tag ±1.5 kb around the center of peaks identified by HBD-seq in HEK293 cells. Color scales represent the density of the signals. Top: Profile plot showing the average signal. Rep1/rep2, two biologically independent replicates.
Author response image 1
Author response image 2
Tables
Key resources table
| Reagent type (species) or resource | Designation | Source or reference | Identifiers | Additional information |
|---|---|---|---|---|
| Antibody | anti-Dhx9 (Rabbit monoclonal) | ABclonal | Cat# A4563; RRID:AB_2863296 | IF(1:100), WB (1:1000) |
| Antibody | anti-GAPDH (Mouse monoclonal) | Proteintech | Cat# 60004–1-Ig; RRID:AB_2107436 | WB (1:200000) |
| Antibody | anti-Nanog (Rabbit monoclonal) | Proteintech | Cat#: 14295–1-AP; RRID:AB_1607719 | WB (1:2000) |
| Antibody | anti-Nanog (Mouse monoclonal) | Developmental Studies Hybridoma Bank (DHSB) | Cat#: PCRP-NANOGP1-2D8; RRID:AB_2722264 | IF (1:50) |
| Antibody | anti-Oct4 (Mouse monoclonal) | Santa Cruz | Cat#: sc-5279; RRID:AB_628051 | IF (1:200), WB (1:1000) |
| Antibody | anti-Lin28a (Rabbit monoclonal) | Proteintech | Cat#: 11724–1-AP; RRID:AB_2135039 | WB (1:1000) |
| Antibody | anti-rabbit IgG (H+L) HRP (Goat Polyclonal) | Bioss | Cat#: bs-0295G-HRP; RRID:AB_10923693 | WB (1:2000) |
| Antibody | anti-mouse IgG (H+L) HRP (Goat Polyclonal) | SinoBiological | Cat#: SSA007; RRID:AB_2917997 | WB (1:2000) |
| Antibody | anti-mouse IgG (H+L) Alexa Fluor 488 (Donkey Polyclonal) | Invitrogen | Cat#: A-21202; RRID:AB_141607 | IF (1:2000) |
| Recombinant protein | Streptavidin-Alexa647 | Bioss | Cat#: bs-0437P-AF647 | IF (1:200) |
| Sequence-based reagent | Dhx9 sgRNA1 | This paper | CRISPR sgRNA targeting Sequence | ATCAGAGGTGTCGCTAAGTA |
| Sequence-based reagent | Dhx9 sgRNA2 | This paper | CRISPR sgRNA targeting Sequence | GAAGGGTTACCAGCACCAAT |
Additional files
-
Supplementary file 1
G-quadruplex (G4) and R-loop peaks in HEK293 cells.
(a) HepG4-seq peaks in HEK293 cells (b) Merged HepG4-seq peaks in HEK293 cells treated with DMSO, ML216, NSC617145 (c) HBD-seq peaks in HEK293 cells (d) Co-localized G4 and R-loop peaks in HEK293 cells € Co-localized G4 and R-loop peaks-associated genes with differential expression after treatment with G4 Inhibitor.
- https://cdn.elifesciences.org/articles/99026/elife-99026-supp1-v1.xlsx
-
Supplementary file 2
G-quadruplex (G4) and R-loop peaks in mouse embryonic stem cells (mESCs).
(a) HepG4-seq peaks in mESCs (b) HBD-seq peaks in mESCs (c) Co-localized G4s and R-loops in mESCs (d) Co-localized G4s and R-loops in the promoters of mESCs (e) Co-localized G4s and R-loops in the enhancers of mESCs (f) Differential G4 and R-loop peaks in dhx9KO mESCs compared to WT mESCs (g) Genes with differential expression levels in dhx9KO mESCs compared to wild-type (WT) mESCs (h) Dhx9 CUT&Tag peaks in mESCs (i) Co-localized G4s and R-loops bound by Dhx9 in mESCs.
- https://cdn.elifesciences.org/articles/99026/elife-99026-supp2-v1.xlsx
-
MDAR checklist
- https://cdn.elifesciences.org/articles/99026/elife-99026-mdarchecklist1-v1.docx
Download links
A two-part list of links to download the article, or parts of the article, in various formats.
Downloads (link to download the article as PDF)
Open citations (links to open the citations from this article in various online reference manager services)
Cite this article (links to download the citations from this article in formats compatible with various reference manager tools)
Genome-wide mapping of native co-localized G4s and R-loops in living cells
eLife 13:RP99026.
https://doi.org/10.7554/eLife.99026.3


