Soluble immune mediators orchestrate protective in vitro granulomatous responses across Mycobacterium tuberculosis complex lineages
- Swiss Tropical and Public Health Institute, Switzerland
- University of Basel, Switzerland
Figures
Figure 1 with 1 supplement
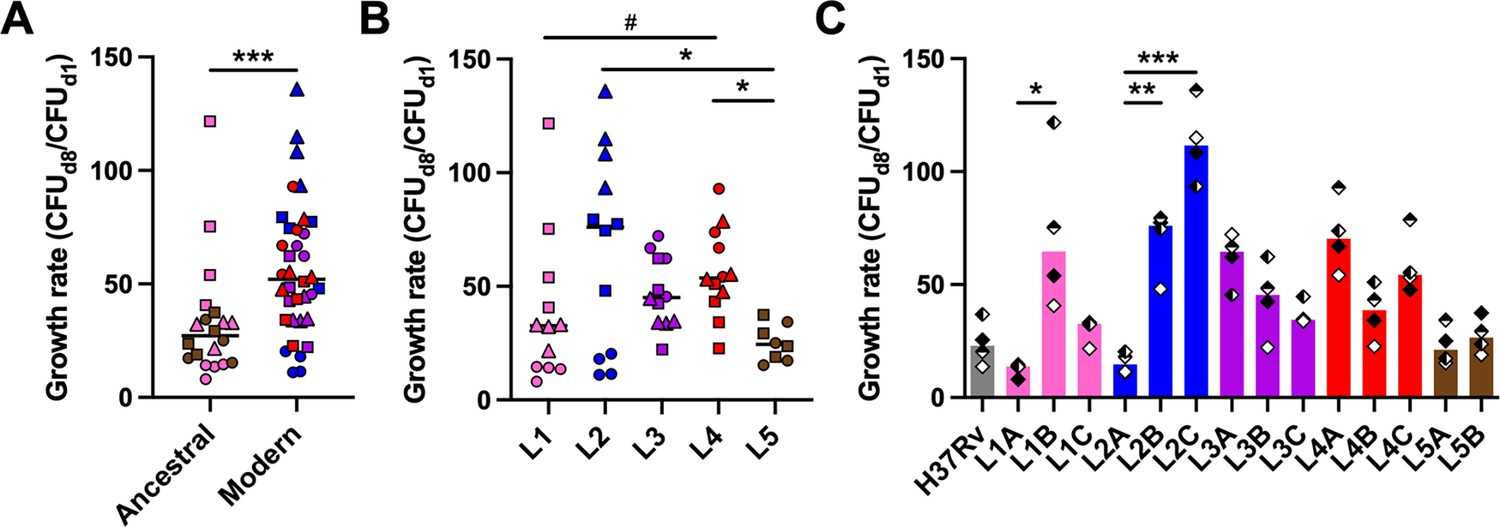
Mycobacterial growth in human in vitro granulomas shows marked intra-lineage diversity and is overall increased for M. tuberculosis complex (MTBC) modern lineages.
Growth rate between days 1 and 8 post-infection stratified by (A) ancestral or modern lineage, (B) specific lineage, or (C) individual strain. Colors indicate lineage and horizontal lines and bars represent medians. Shapes stand for (A, B) individual strains within the same lineage (LXA in circles, LXB in squares, and LXC in triangles), or (C) independent donors (n=4). Statistical analyses by (A) two-tailed Mann-Whitney, (B) Kruskal-Wallis, or (C) Friedman tests with post hoc Dunn’s correction. #, p<0.1; *, p<0.05; **, p<0.01; ***, p<0.001.
Figure 1—figure supplement 1
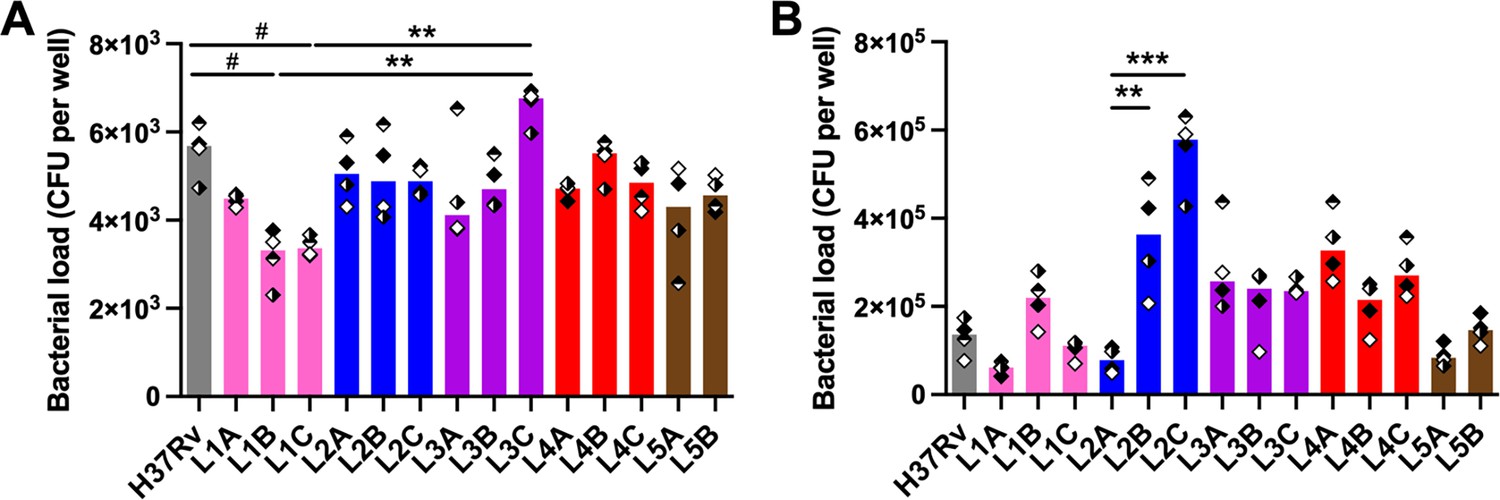
Bacterial load of the selected M. tuberculosis complex (MTBC) isolates in human in vitro granulomas.
Colony forming units (CFU) were quantified on (A) day 1 and (B) day 8 post-infection. Colors indicate lineage, bars represent medians, and shapes stand for independent donors (n=4). Statistical analysis by Friedman test with post hoc Dunn’s correction. #, p<0.1; **, p<0.01; ***, p<0.001.
Figure 2 with 1 supplement
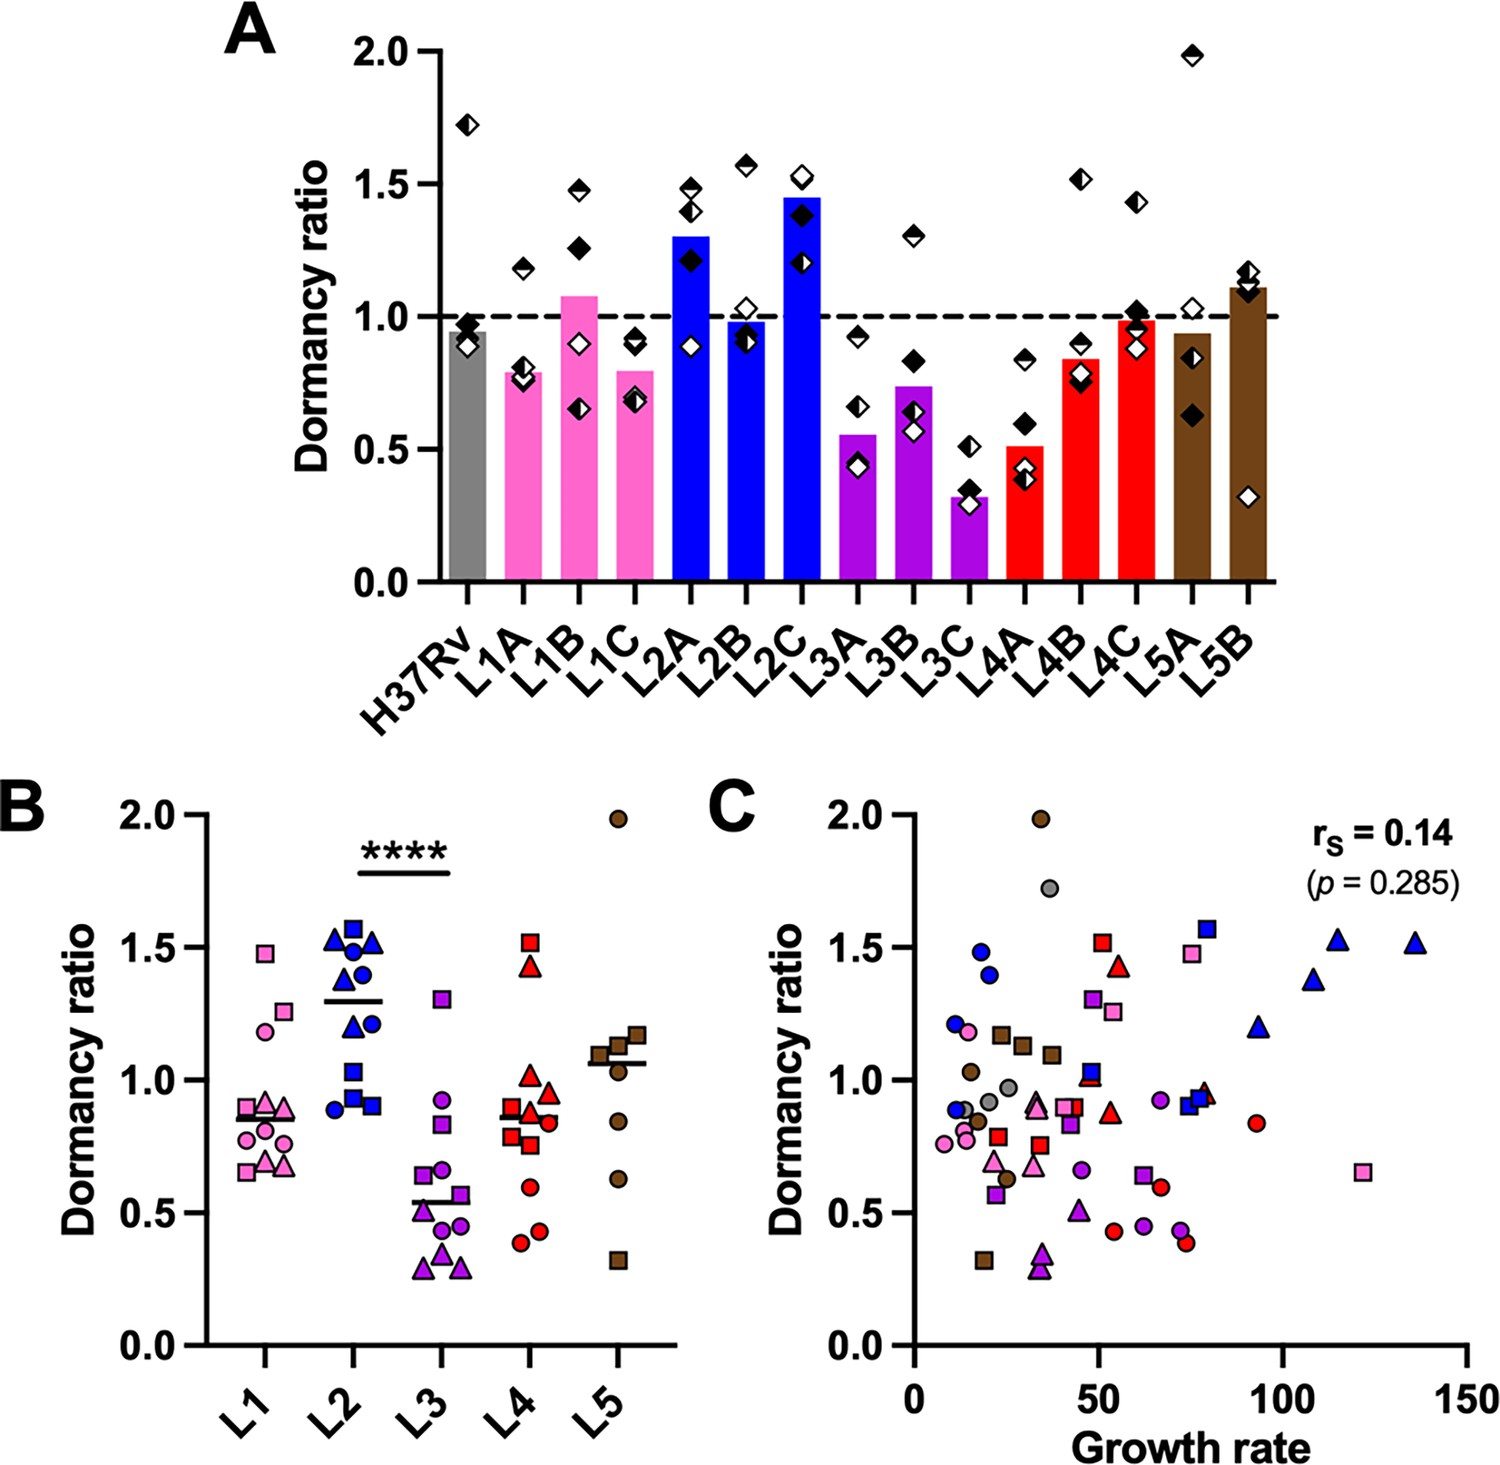
Propensity to enter dormancy is particularly pronounced in lineage 2 and reduced in lineage 3 strains.
Bacilli recovered on day 8 post-infection were stained with Auramine-O (Au) and Nile red (NR) and quantified by fluorescence microscopy. Dormancy ratio was defined as the ratio between dormant-like (Au– NR+) and metabolically active (Au+ NR–) bacteria. Data stratified by (A) individual strain or (B) lineage. (C) Two-tailed Spearman’s correlation analysis of dormancy ratio with growth rate. Colors indicate lineage and bars and horizontal lines represent medians. Shapes stand for (A) independent donors (n=4) or (B, C) individual strains within the same lineage (LXA in circles, LXB in squares, and LXC in triangles). Statistical analyses by (A) Friedman or (B) Kruskal-Wallis tests with post hoc Dunn’s correction. ****, p<0.0001.
Figure 2—figure supplement 1
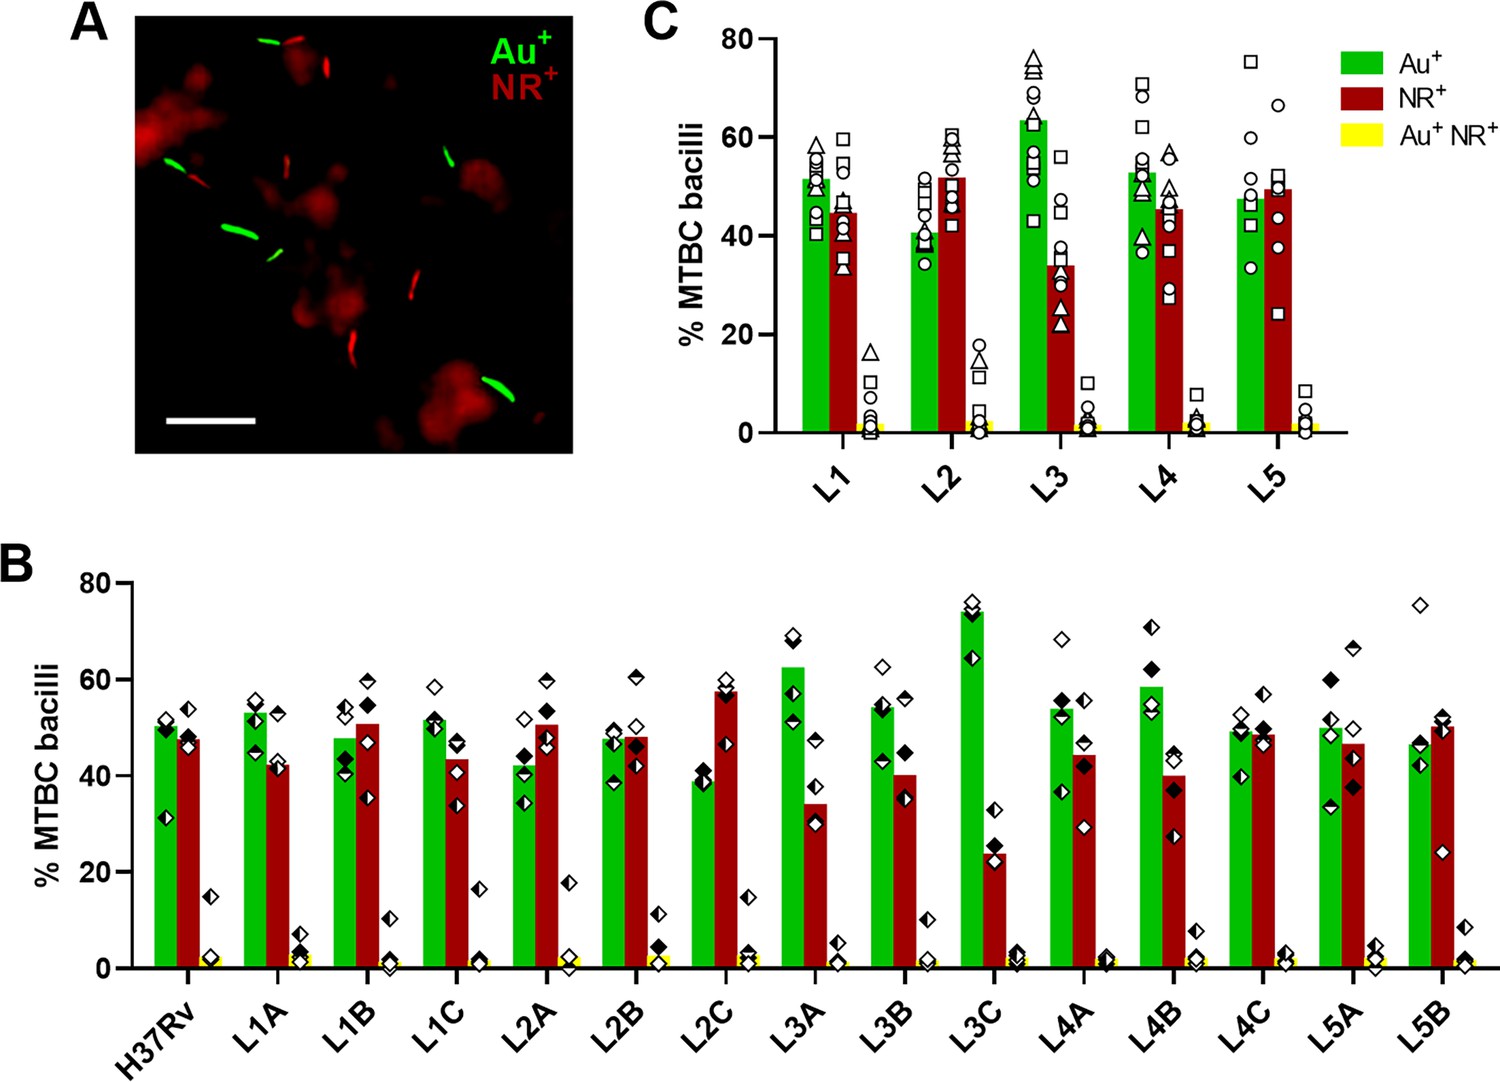
Auramine-O (Au)/Nile red (NR) profile of the selected M. tuberculosis complex (MTBC) isolates.
Bacilli recovered on day 8 post-infection were stained with Au and NR and quantified by fluorescence microscopy. (A) Photomicrograph picturing representative staining phenotypes. Scale bar = 10 μm. Data stratified by (B) individual strain or (C) lineage. Bars represent medians and shapes stand for (B) independent donors (n=4) or (C) individual strains within the same lineage (LXA in circles, LXB in squares, and LXC in triangles).
Figure 3 with 2 supplements
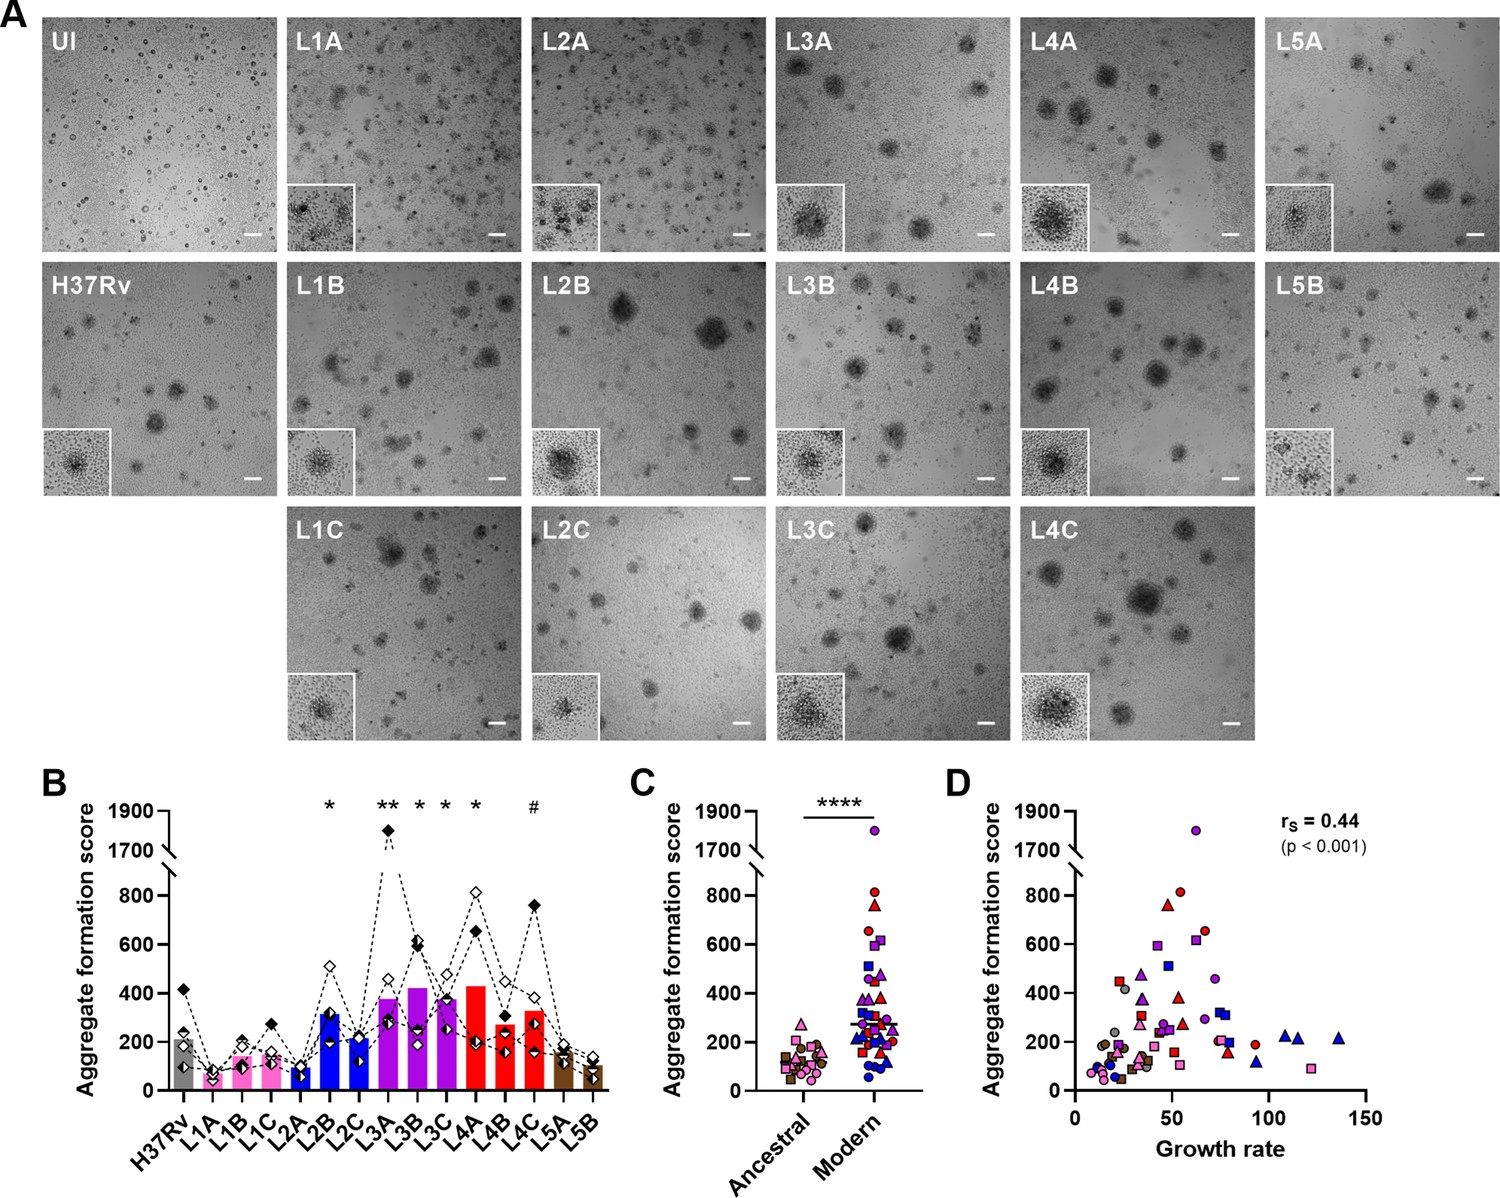
M. tuberculosis complex (MTBC) strain diversity translates into a spectrum of granulomatous responses that correlates with bacterial growth.
(A) Bright-field images of in vitro granulomas on day 7 post-infection from a representative donor. Scale bar = 100 μm. UI, uninfected. Lower left corner higher magnification inserts (200 μm sides) depict granulomas of characteristic size and morphology. (B–D) Number, area, and aspect ratio of cell aggregates were quantified and integrated into an aggregate formation score (see Materials and methods section). Aggregate formation scores stratified by (B) individual strain and (C) ancestral or modern lineage. (D) Two-tailed Spearman’s correlation analysis of aggregate formation score with growth rate. Colors indicate lineage and bars represent medians. Shapes stand for (B) independent donors (n=4) or (C, D) individual strains within the same lineage (LXA in circles, LXB in squares, and LXC in triangles). Statistical analyses by (B) Friedman test with post hoc Dunn’s correction (comparisons against L1A) or (C) two-tailed Mann-Whitney test. #, p<0.1; *, p<0.05; **, p<0.01; ****, p<0.0001.
Figure 3—figure supplement 1
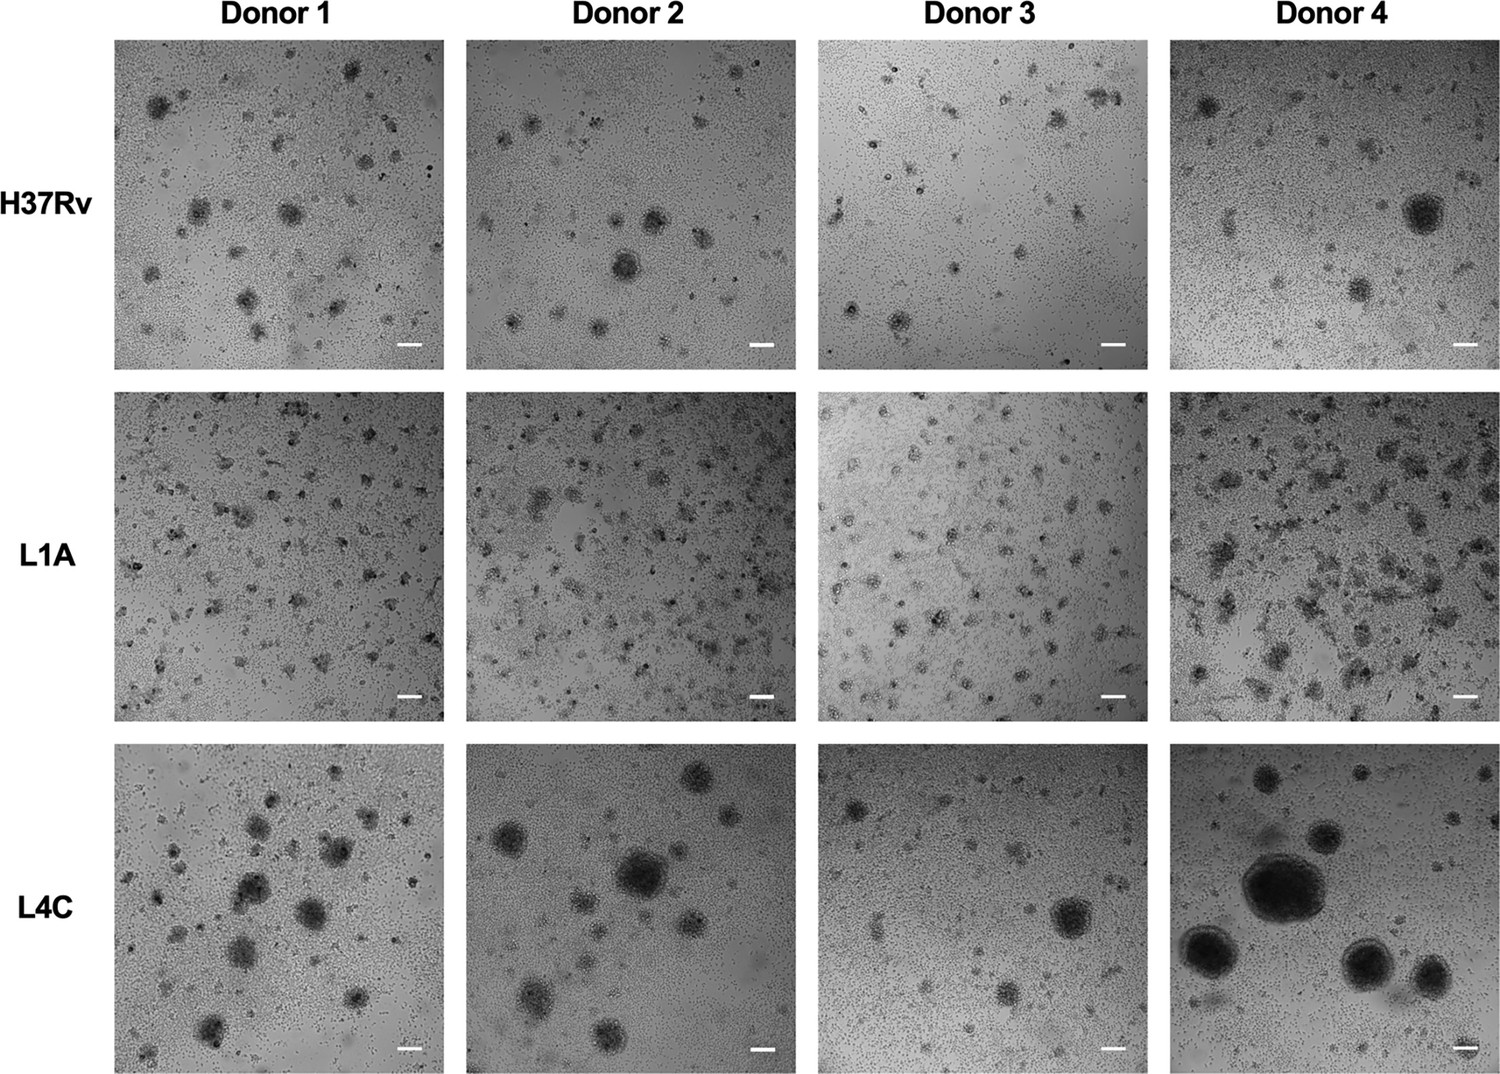
Granulomatous response variability across M. tuberculosis complex (MTBC) strains is consistent across independent donors.
Bright-field images of in vitro granulomas on day 7 post-infection from MTBC strains representative of the spectrum of granulomatous responses observed. Scale bar = 100 μm.
Figure 3—figure supplement 2
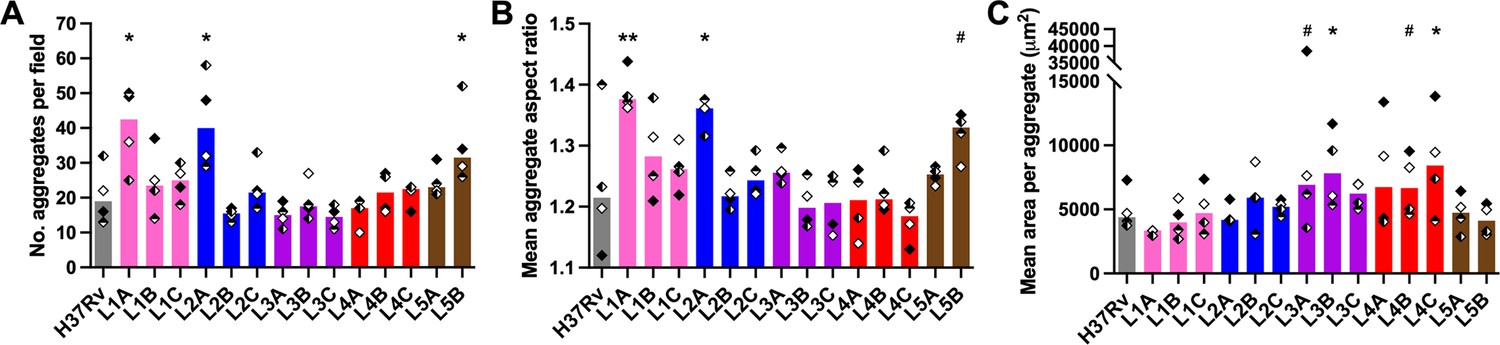
The number, shape, and size of in vitro granulomas vary depending on the M. tuberculosis complex (MTBC) infecting strain.
(A) Total number (no.) of aggregates, as well as their individual (B) aspect ratio and (C) area were quantified on a representative bright field for each strain and donor. Colors indicate lineage, shapes correspond to individual donors (n=4), and bars represent medians. Statistical analysis by Friedman test with post hoc Dunn’s correction (comparisons against H37Rv). #, p<0.1; *, p<0.05; **, p<0.01.
Figure 4 with 2 supplements
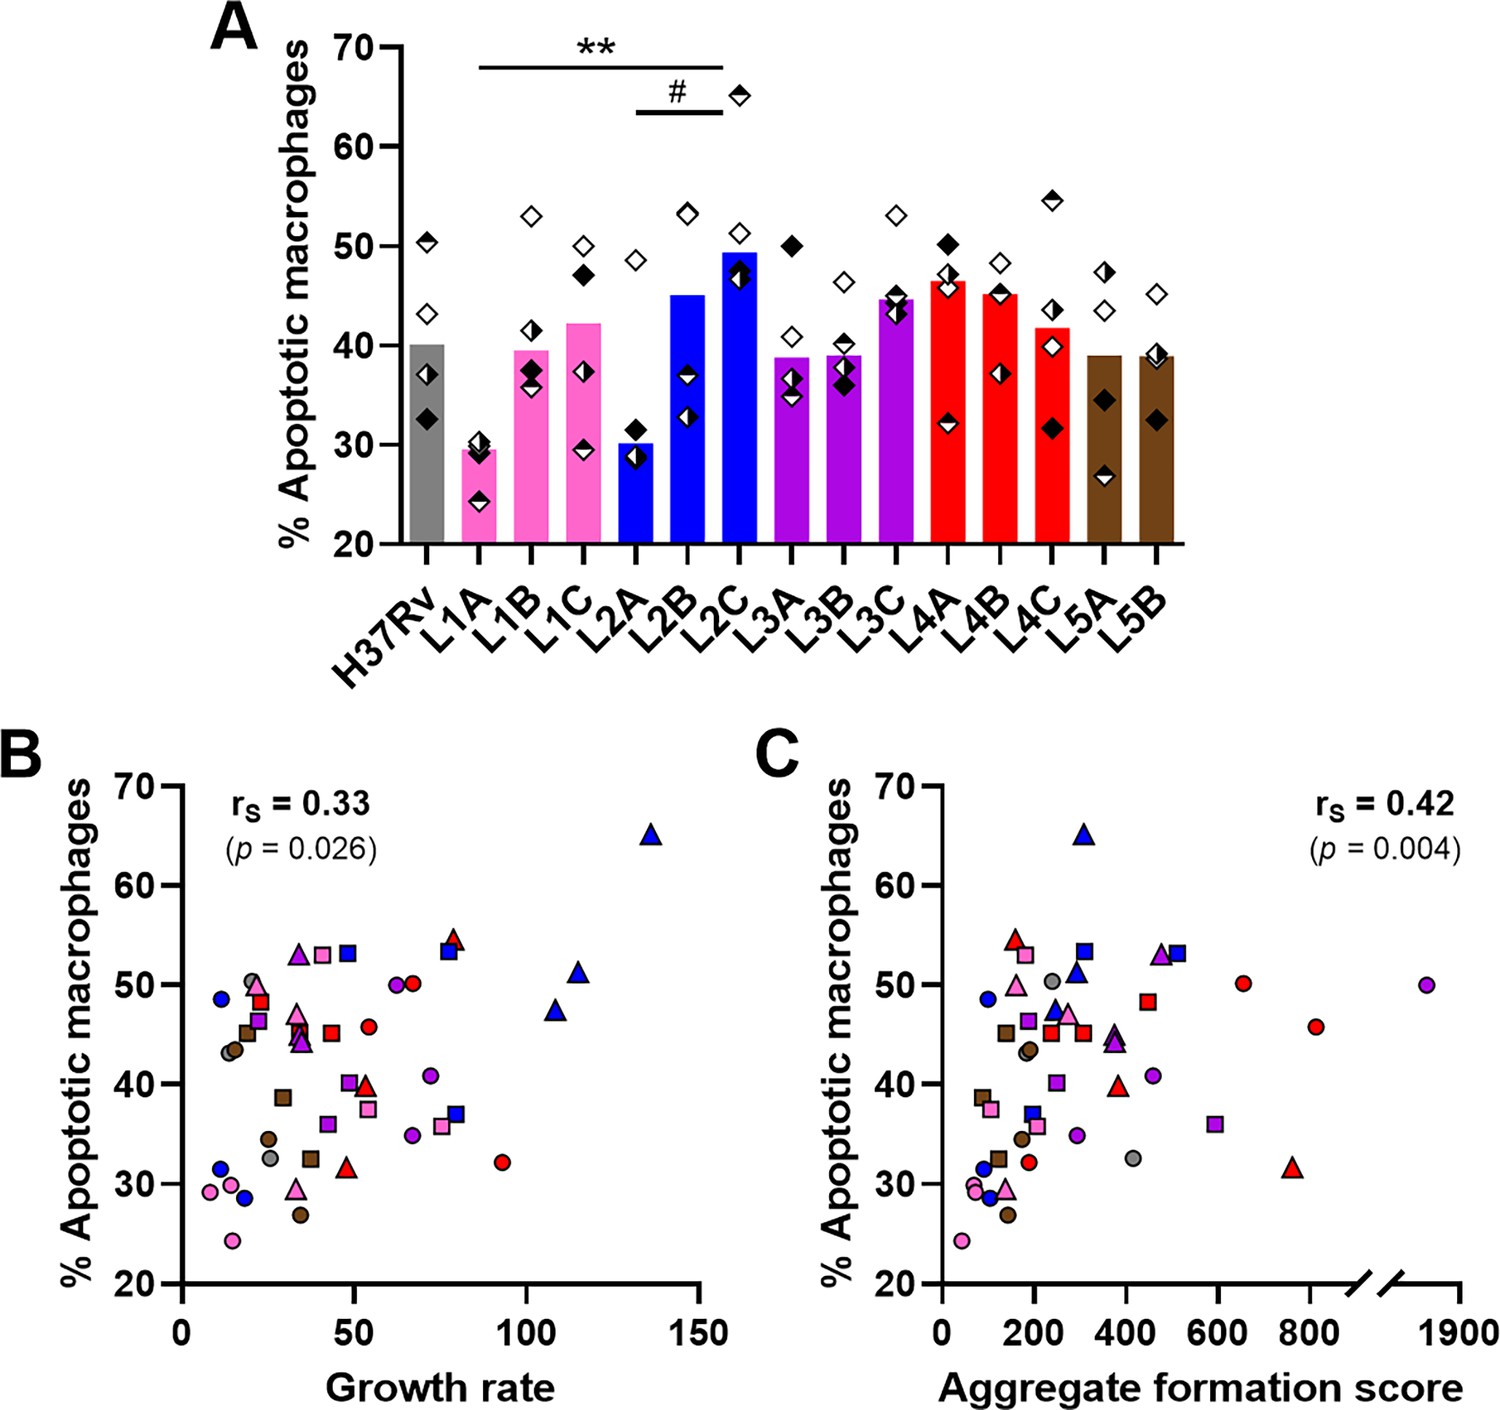
Macrophage apoptosis is positively associated with mycobacterial growth rate and aggregate formation score.
(A) Percentage of apoptotic macrophages (CD11b+ Annexin V+ 7-AAD–) on day 6 post-infection quantified by flow cytometry. (B, C) Two-tailed Spearman’s correlation analysis of macrophage apoptosis with (B) growth rate or (C) aggregate formation score. Colors indicate lineage and bars represent medians. Shapes stand for (A) independent donors (n=4) or (B, C) individual strains within the same lineage (LXA in circles, LXB in squares, and LXC in triangles). (A) Statistical analysis by Friedman test with post hoc Dunn’s correction. #, p<0.1; **, p<0.01.
Figure 4—figure supplement 1
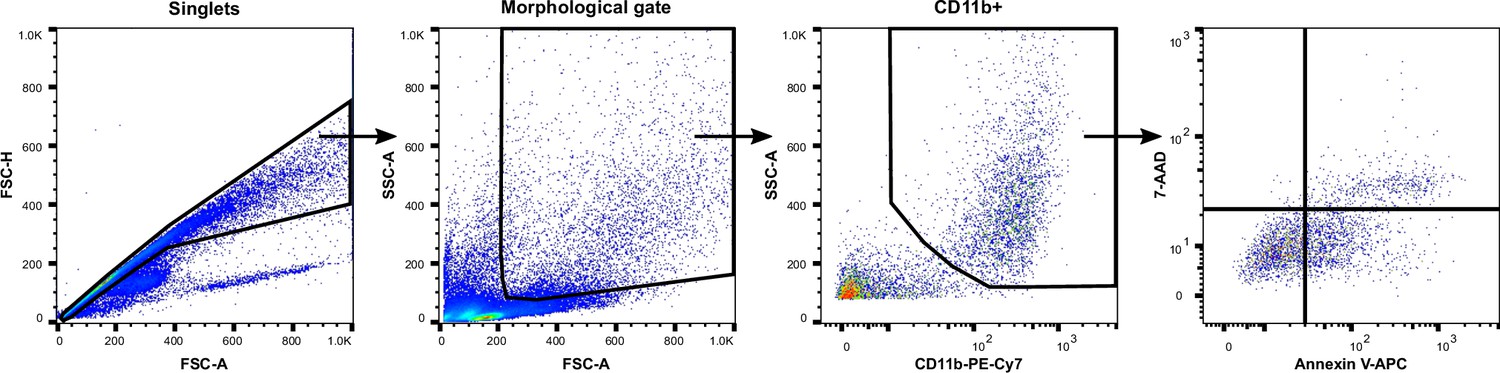
Flow cytometry gating strategy for the quantification of cell death induction in CD11b+ macrophages.
Figure 4—figure supplement 2
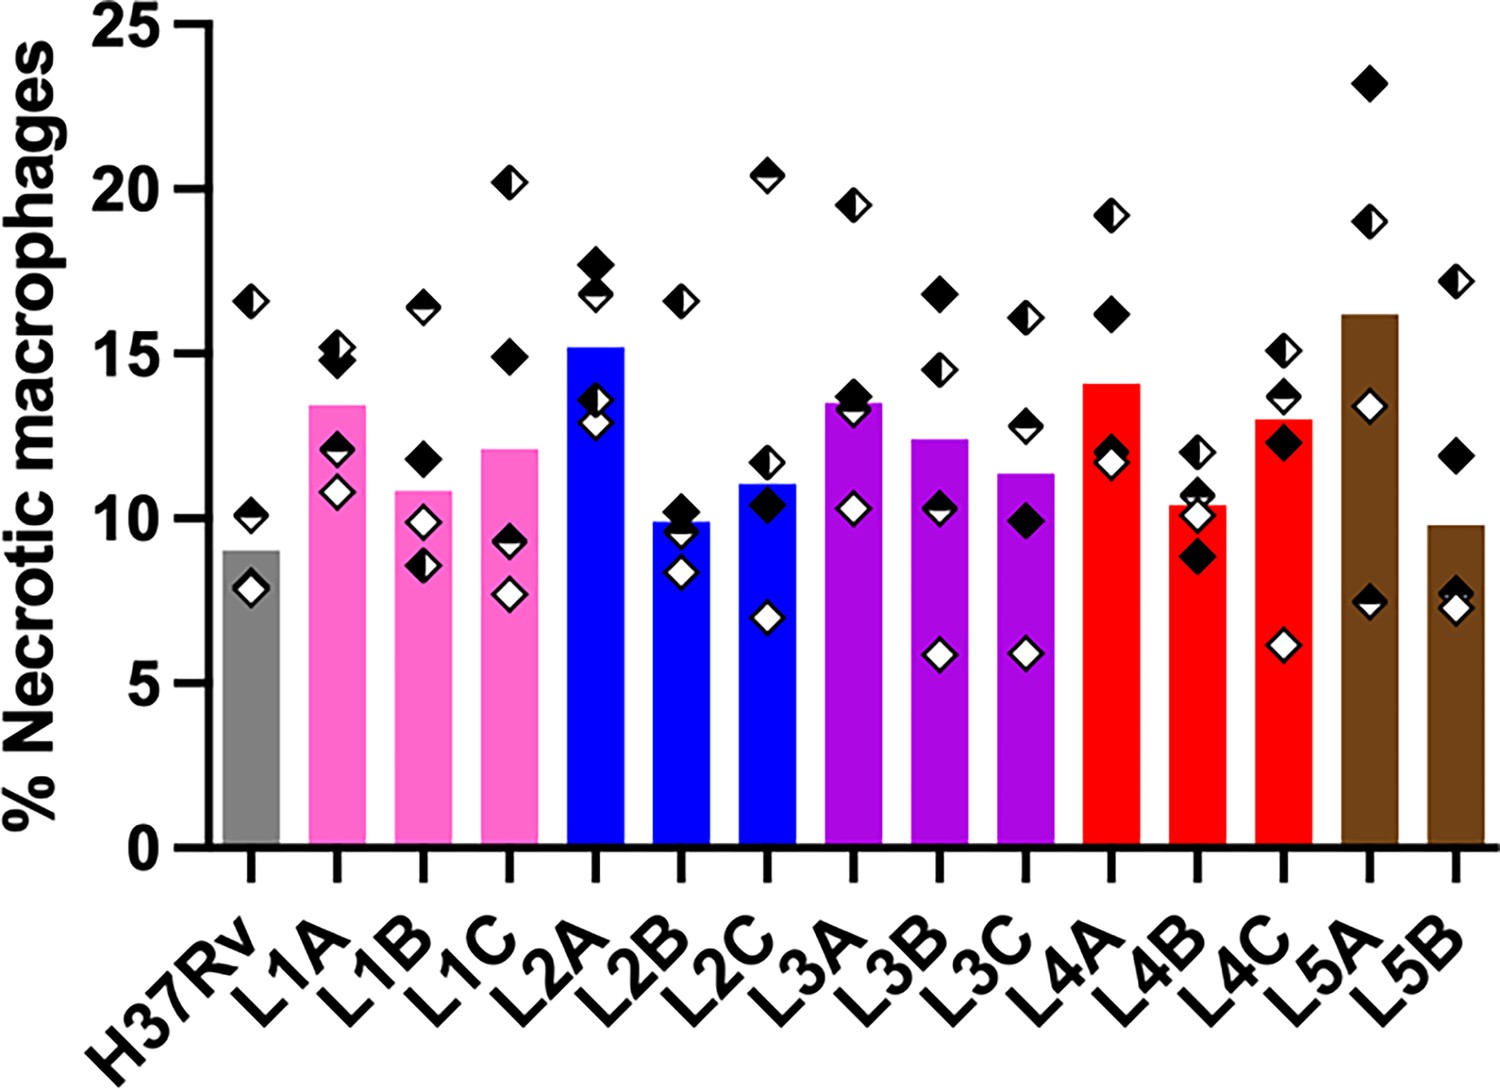
M. tuberculosis complex (MTBC) strains did not induce significantly different percentages of necrotic macrophages.
Percentage of necrotic macrophages (CD11b+ Annexin V+ 7-AAD+) on day 6 post-infection quantified by flow cytometry. Colors indicate lineage, bars represent medians, and shapes stand for independent donors (n=4). Statistical analysis by Friedman test.
Figure 5 with 3 supplements
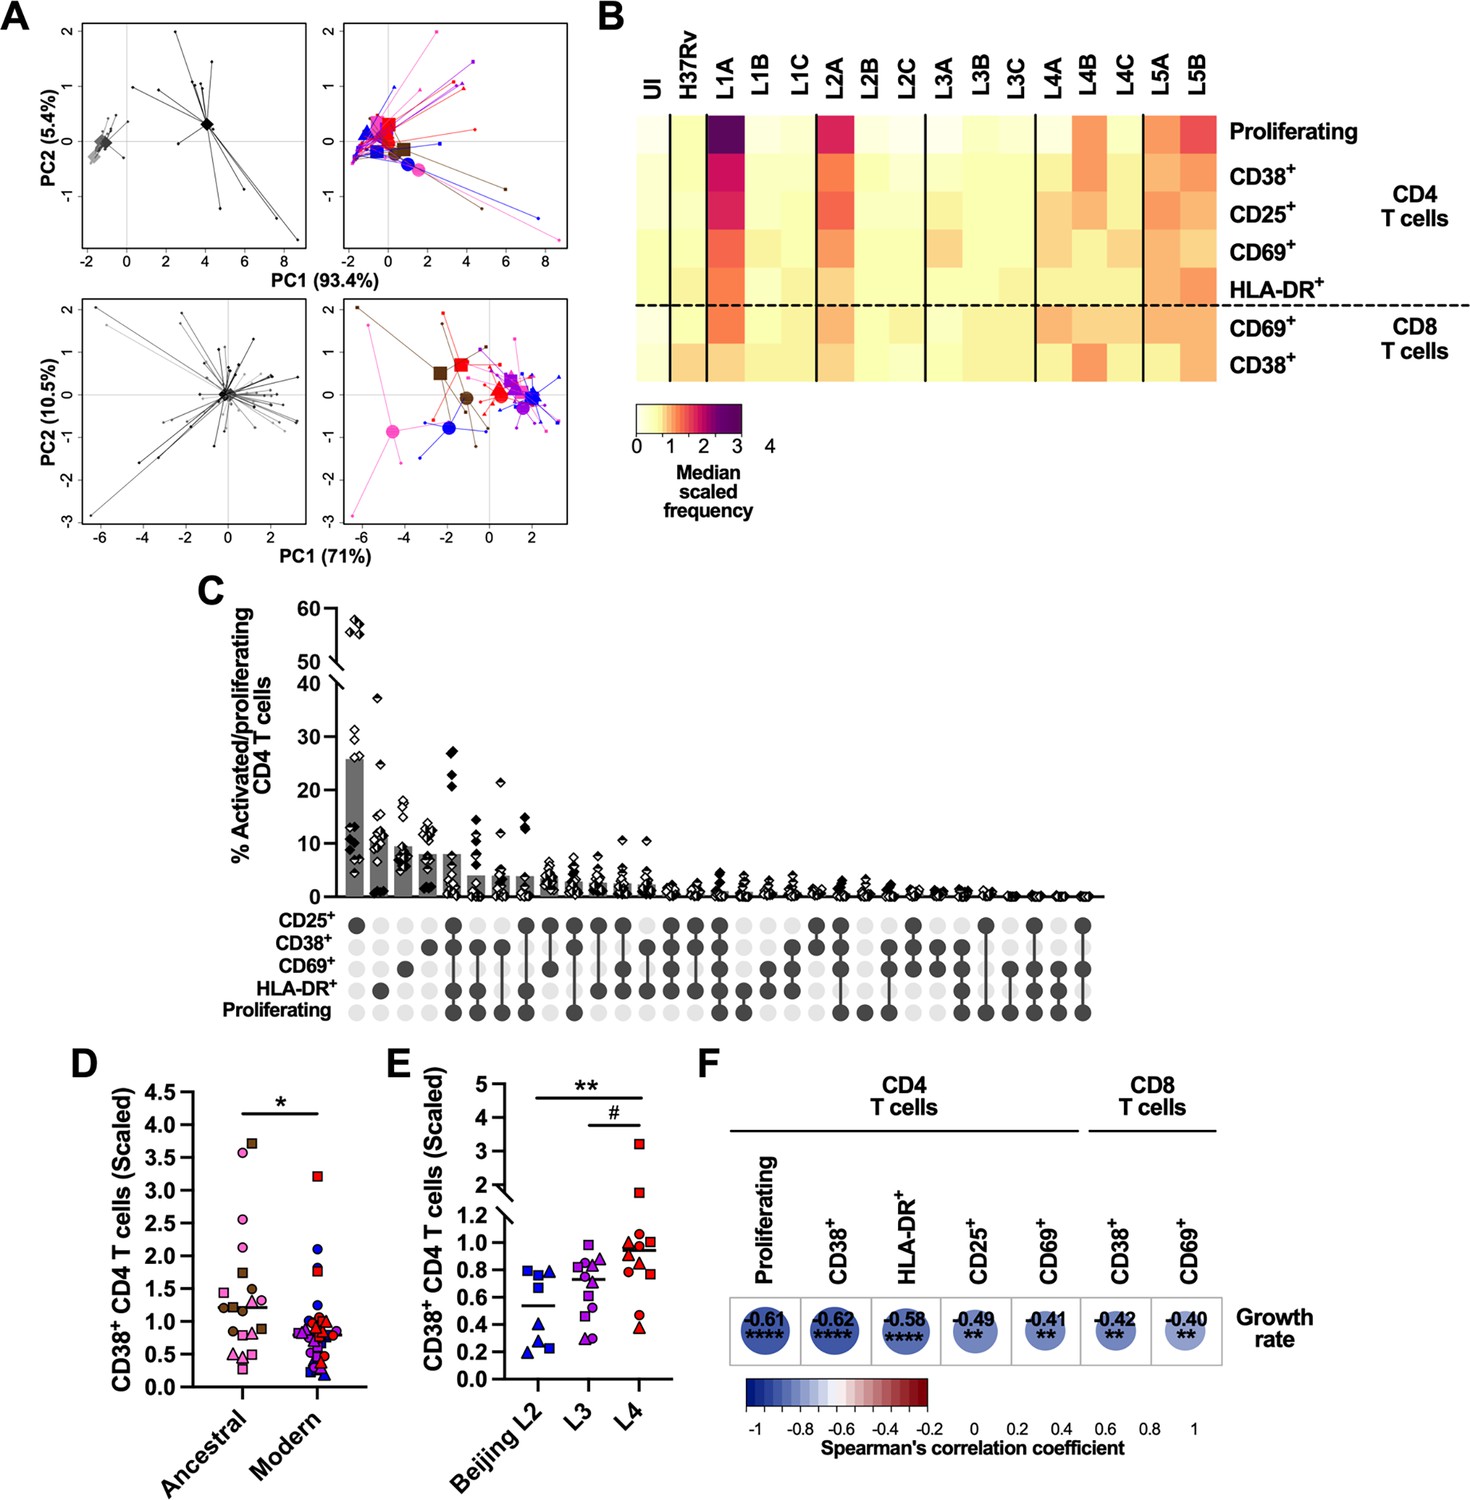
Activation and proliferation of T cells is associated with reduced mycobacterial growth across the M. tuberculosis complex (MTBC).
Percentage of activated (expressing any of the markers) and proliferating (carboxyfluorescein succinimidyl ester [CFSE–]) T cells on day 6 post-infection was quantified by flow cytometry. (A) Principal component (PC) analysis using raw (top panels) or scaled (lower panels) data. Data were grouped by donor (left panels), with gray shades representing independent donors (n=4); or by MTBC infecting strain (right panels), with colors indicating lineage and shapes standing for individual strains within the same lineage (LXA in circles, LXB in squares, and LXC in triangles). (B) Heatmap representing the median scaled frequencies induced by each MTBC strain. UI, uninfected. (C) Marker co-expression on the activated/proliferating CD4 T cells induced by L1A, L2A, and L5 strains. Bars represent the mean percentage of cells expressing the indicated marker combination and each filling pattern of the shapes corresponds to an individual donor. (D, E) Percentage of CD38+ CD4 T cells elicited by (D) ancestral or modern lineages, or (E) specific modern lineages. Colors and shapes same as in (A) and horizontal lines represent medians. Statistical analyses by (D) two-tailed Mann-Whitney or (E) Kruskal-Wallis tests with post hoc Dunn’s correction. (F) Heatmap of Spearman’s correlation coefficients of activated/proliferating T cell populations with MTBC growth rate (two-tailed, post hoc Benjamini-Hochberg corrected). #p<0.1; *, p<0.05; **, p<0.01; ****, p<0.0001.
Figure 5—figure supplement 1
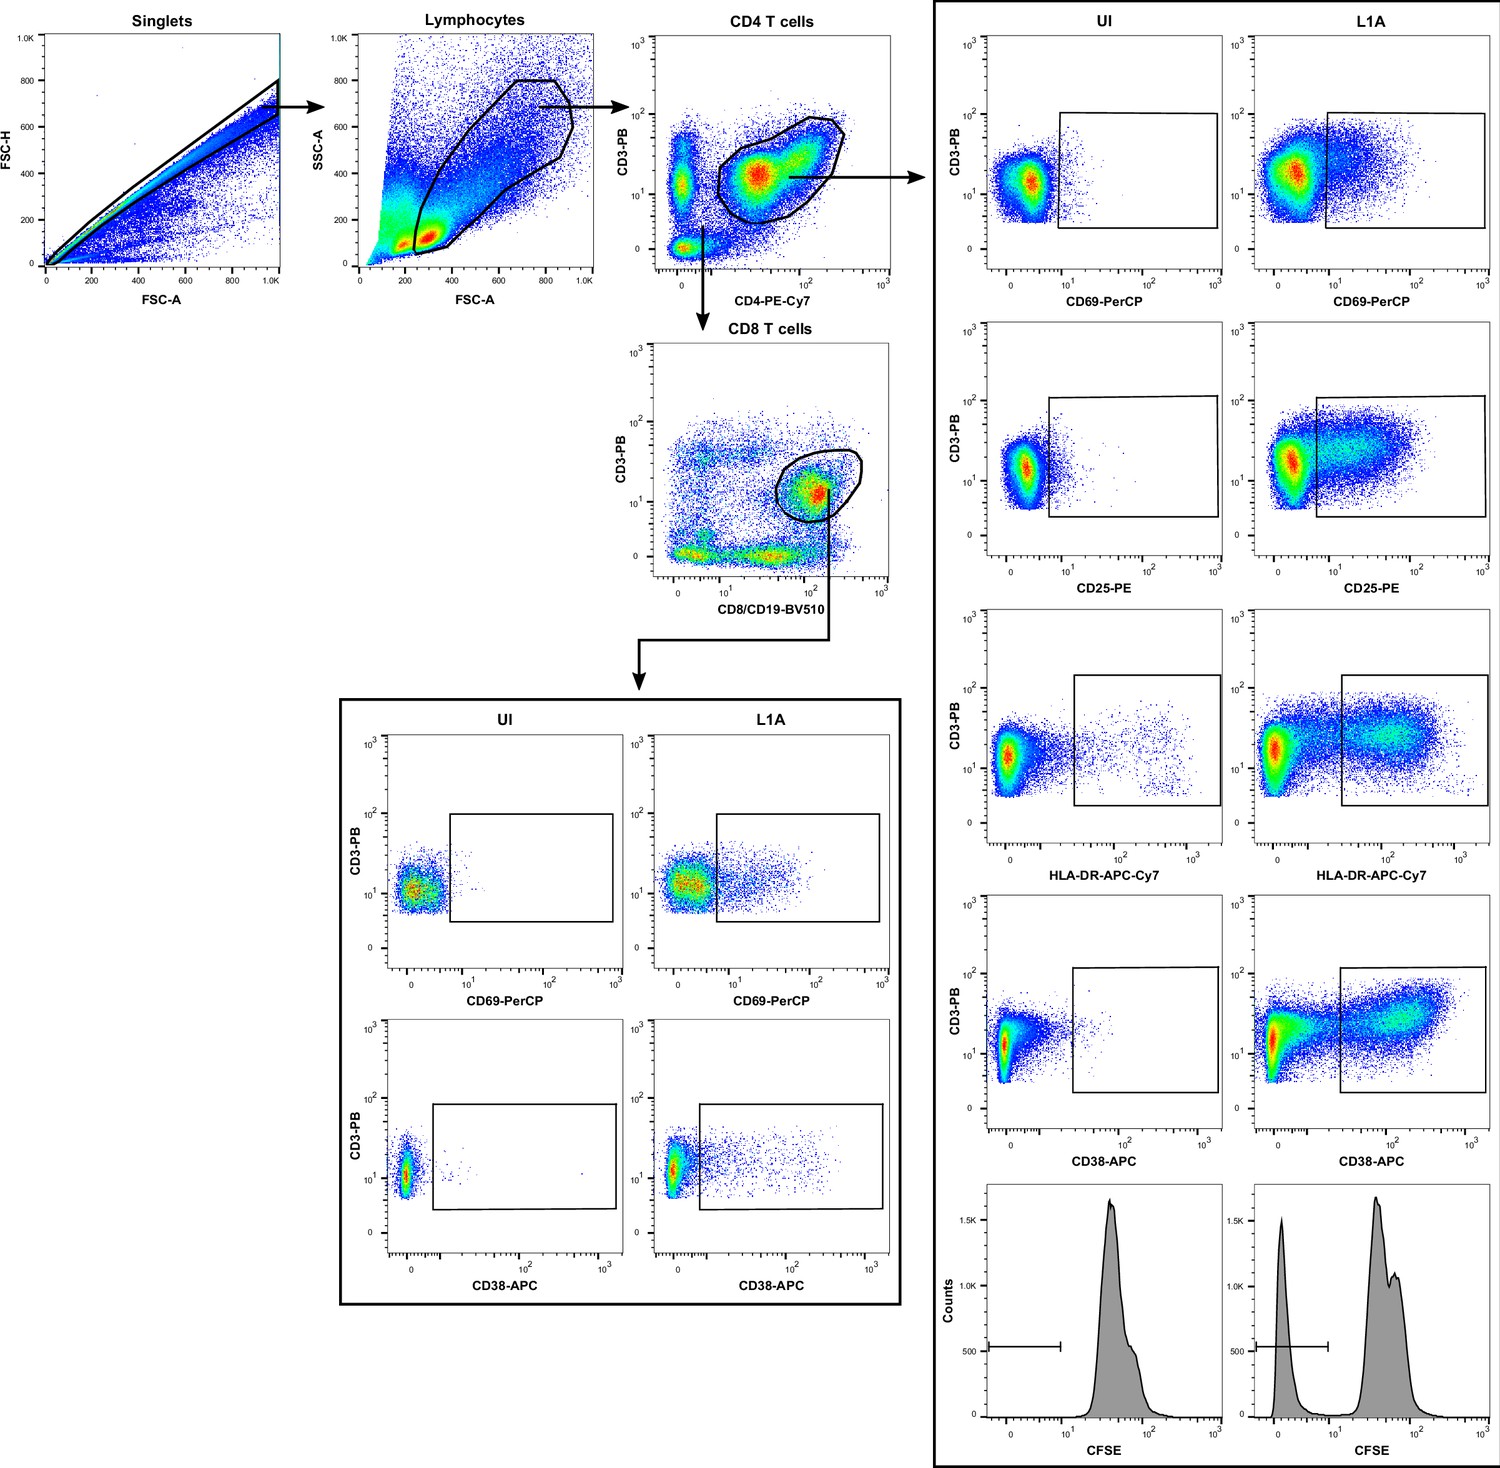
Flow cytometry gating strategy for the analysis of T cell proliferation and activation.
UI, uninfected.
Figure 5—figure supplement 2
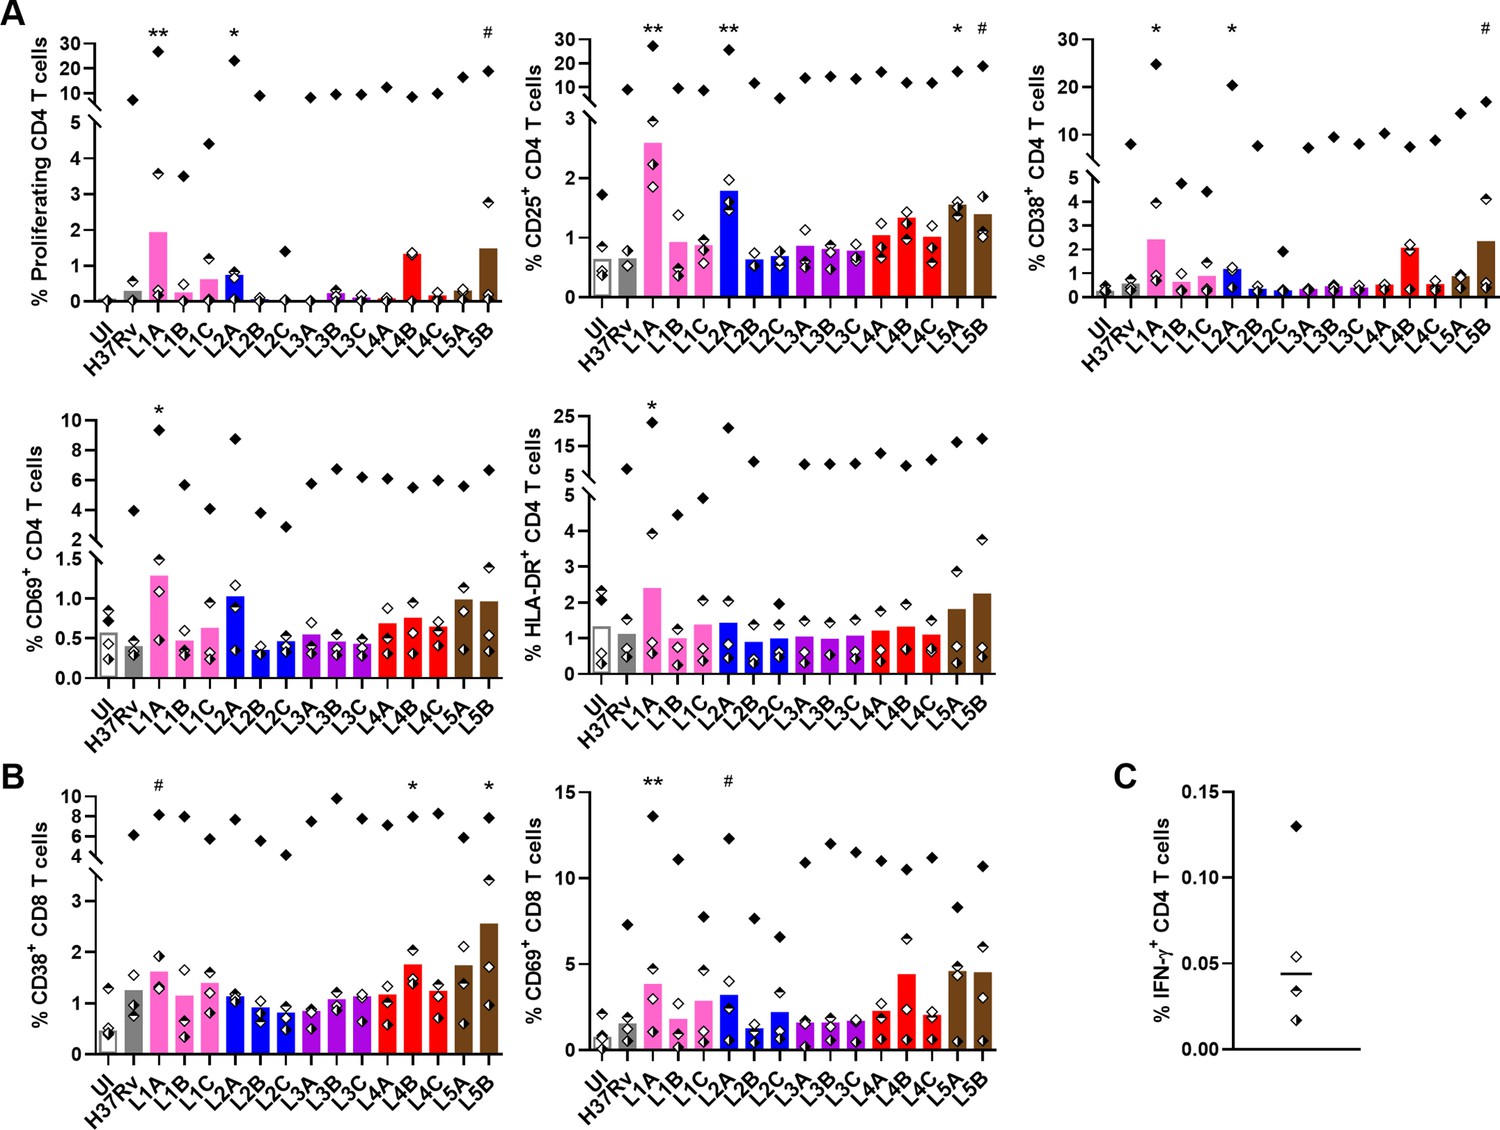
M. tuberculosis complex (MTBC) strain diversity results in induction of quantitatively distinct T cell responses.
Frequencies of (A) proliferating and/or activated CD4 and (B) CD8 T cells quantified by flow cytometry on day 6 post-infection. UI, uninfected. Colors indicate lineage, shapes correspond to individual donors (n=4), and bars represent medians. Statistical analysis by Friedman test with post hoc Dunn’s correction (comparisons against UI). #, p<0.1; *, p<0.05; **, p<0.01. (C) Frequency of IFN-γ+ CD4 T cells quantified by flow cytometry upon overnight purified protein derivative (PPD) stimulation. Shapes same as in (A, B) and horizontal line represents the median.
Figure 5—figure supplement 3
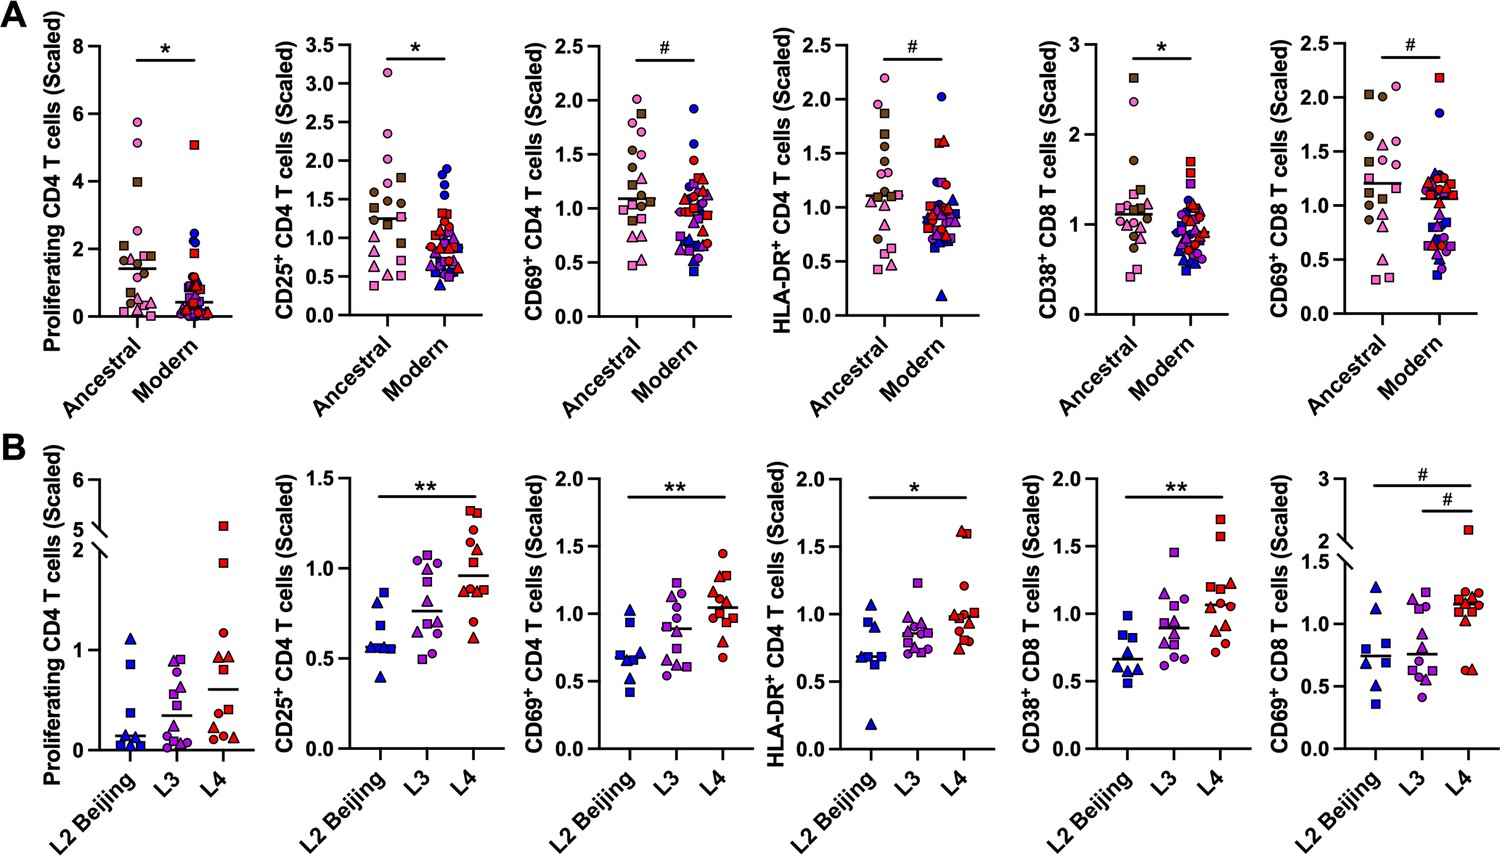
Induction of T cell activation and proliferation exhibits both lineage- and mycobacterial growth-associated trends.
Frequency of each population stratified by (A) ancestral or modern lineage, or (B) specific modern lineages. Statistical analyses by (A) two-tailed Mann-Whitney or (B) Kruskal-Wallis test with post hoc Dunn’s correction. *p<0.05; **, p<0.01. Colors indicate lineage, shapes stand for individual strains within the same lineage (LXA in circles, LXB in squares, and LXC in triangles), and horizontal lines represent medians.
Figure 6 with 1 supplement
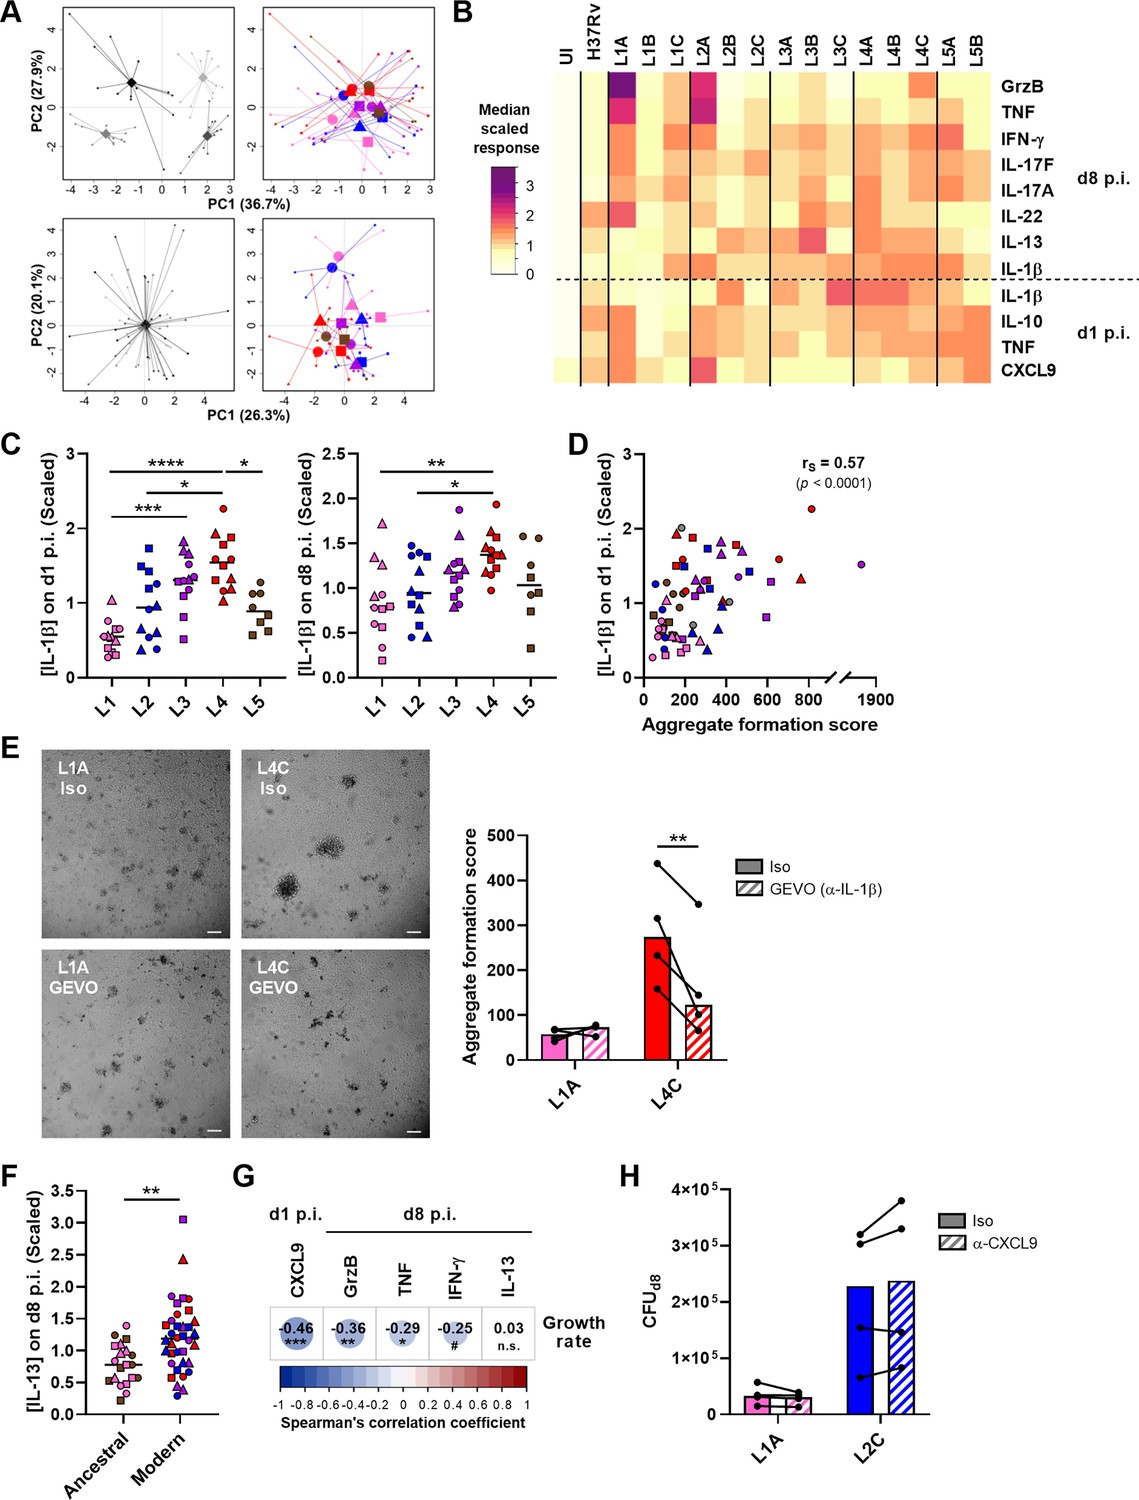
CXCL9, granzyme B, and TNF secretion is associated with reduced mycobacterial growth across the M. tuberculosis complex (MTBC).
The concentration of soluble mediators in the supernantant of in vitro granulomas on days 1 and 8 post-infection (p.i.) was quantified by multiplex bead-based immunoassay. (A) Principal component (PC) analysis was performed using raw (top panels) or scaled (lower panels) concentrations. Data were grouped by donor (left panels), with gray shades representing independent donors (n=4); or by MTBC infecting strain (right panels), with colors indicating lineage and shapes standing for individual strains within the same lineage (LXA in circles, LXB in squares, and LXC in triangles). (B) Heatmap of the median scaled response induced by each MTBC strain. UI, uninfected; GrzB, granzyme B. (C) IL-1β response stratified by lineage. Colors and shapes same as in (A) and horizontal lines represent medians. (D) Two-tailed Spearman’s correlation analysis of IL-1β response on day 1 p.i. with aggregate formation score. Colors and shapes same as in (A). (E) Effect of blocking of IL-1β on granuloma formation using gevokizumab (GEVO). Bright-field images of in vitro granulomas on day 7 p.i. from a representative donor. Iso, isotype control. Scale bar = 100 μm. Aggregate formation score was calculated as indicated in Figure 3. Colors indicate lineage, bars represent medians, and data from the same donor are connected through lines. (F) IL-13 response stratified by ancestral or modern lineages. Colors and shapes same as in (A) and horizontal lines represent medians. (G) Heatmap representing Spearman’s correlation coefficients of cytokine concentrations with MTBC replication rate (two-tailed, post hoc Benjamini-Hochberg corrected). (H) Effect of early blocking of CXCL9 on bacterial load on day 8 p.i. Colors indicate lineage, bars represent medians, and data from the same donor are connected through lines. Statistical analyses by (C) Kruskal-Wallis test with post hoc Dunn’s correction, (E, H) two-way ANOVA with post hoc Sidak’s correction, or (F) two-tailed Mann-Whitney tests. n.s., p>0.1; #, p<0.1; *, p<0.05; **, p<0.01; ***, p<0.001; ****, p<0.0001.
Figure 6—figure supplement 1
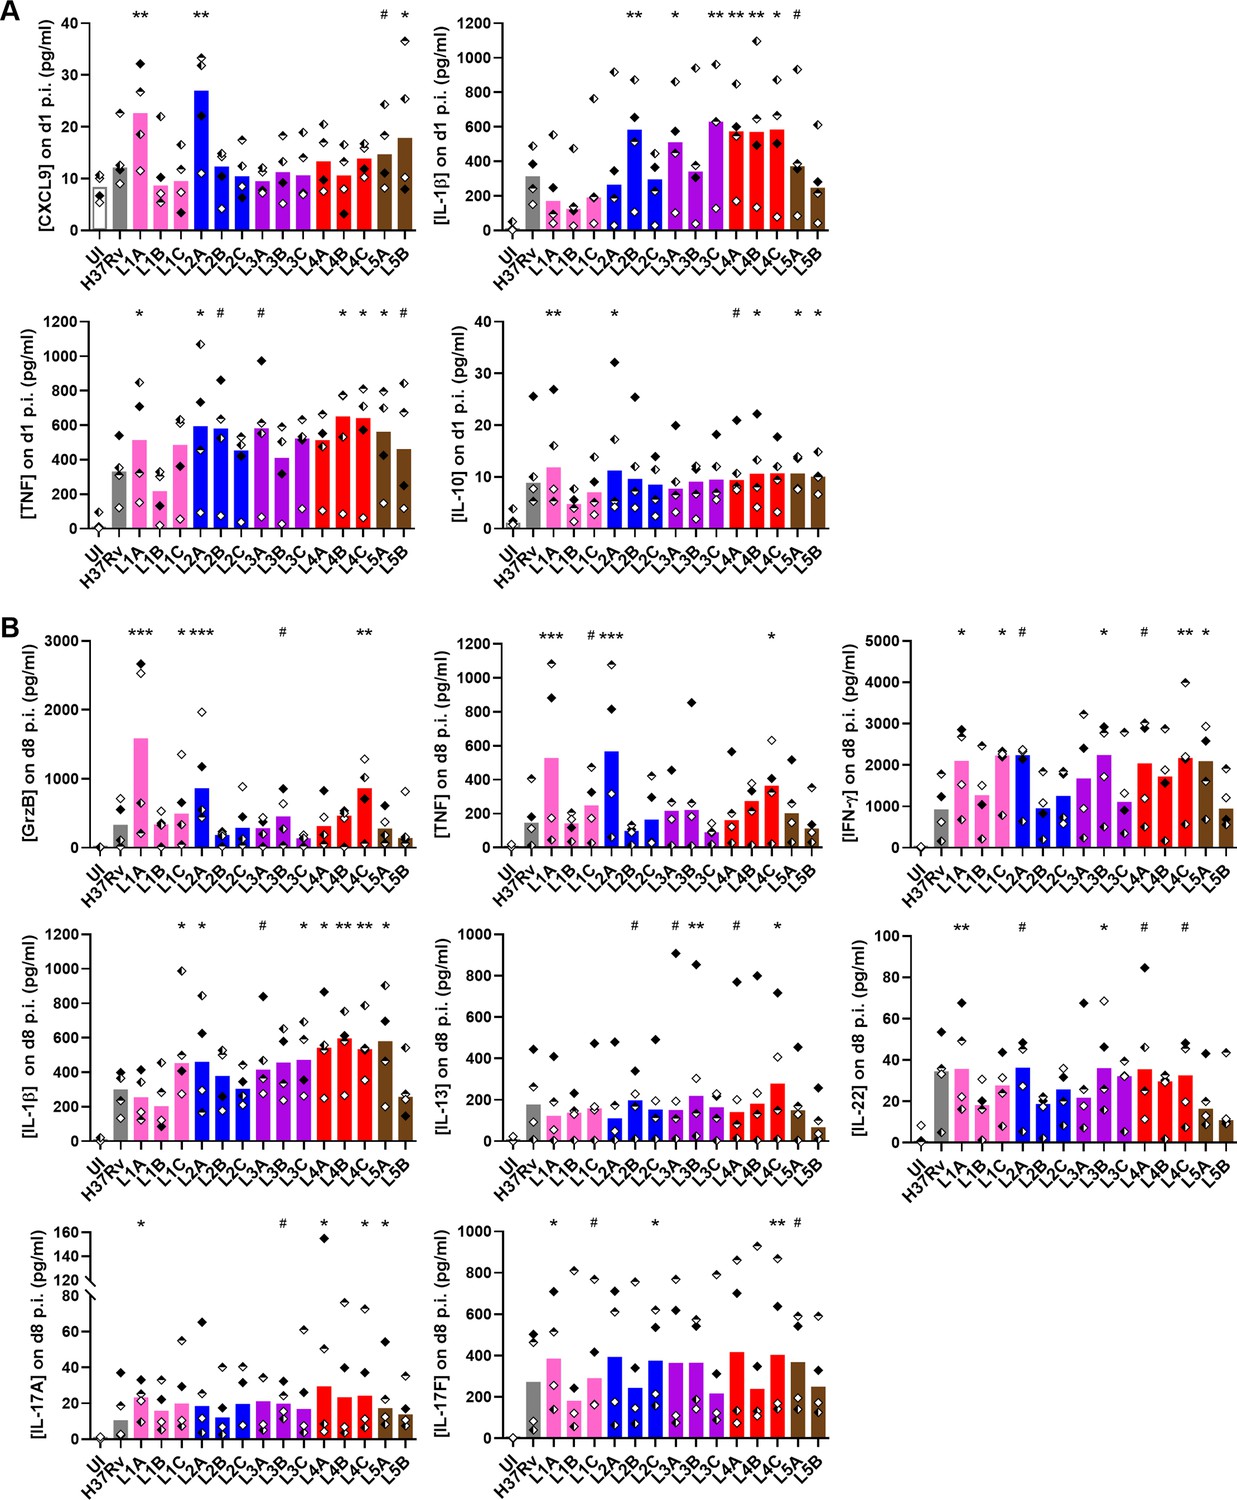
M. tuberculosis complex (MTBC) diversity results in variable soluble factor immune responses.
Concentrations of soluble factors induced by MTBC infection on (A) day 1 or (B) day 8 post-infection (p.i). UI, uninfected. Colors indicate lineage, shapes stand for independent donors (n=4), and bars represent medians. Statistical analysis by Friedman test with post hoc Dunn’s correction (comparisons against UI). #, p<0.1; *, p<0.05; **, p<0.01; p<0.001.
Tables
Table 1
M. tuberculosis complex (MTBC) isolates used in this work.
| Strain* | Sublineage† | Patient origin | Additional information | |
|---|---|---|---|---|
| L1A | N0069 | L1.1.1 | China | |
| L1B | N0072 | L1.1.2 | India | |
| L1C | N0157 | L.1.2.1 | Philippines | |
| L2A | N0031 | L2.1 | China | Proto-Beijing (DRD105, RD207 present) |
| L2B | N0052 | L.2.2.2 | China | Ancestral Beijing (DRD105, DRD207) |
| L2C | N0155 | L2.2.1 | China | Modern Beijing (DRD105, DRD207, DRD181) |
| L3A | N0004 | L3.1 | India | |
| L3B | N0054 | ND | Ethiopia | |
| L3C | N1274 | L3.2 | Afghanistan | |
| L4A | N1216 | L4.6.2.2 | Ghana | Cameroon—‘Specialist’ |
| L4B | N0136 | L4.3.3 | USA | LAM—‘Generalist’ |
| L4C | N1283 | L4.2.1 | Germany | Ural |
| L5A | N1268 | L5.1 | Sierra Leone | |
| L5B | N1272 | L5.1.2 | Ghana | |
-
*
Nomenclature used in the current study (left) and in Borrell et al., 2019 (right).
-
†
Classification based on Ates et al., 2018; Coll et al., 2014; Napier et al., 2020. ND, not determined; Δ, deletion; RD, region of difference.
Additional files
-
MDAR checklist
- https://cdn.elifesciences.org/articles/99062/elife-99062-mdarchecklist1-v1.pdf
-
Source data 1
Raw data generated during this study.
- https://cdn.elifesciences.org/articles/99062/elife-99062-data1-v1.xlsx
Download links
A two-part list of links to download the article, or parts of the article, in various formats.
Downloads (link to download the article as PDF)
Open citations (links to open the citations from this article in various online reference manager services)
Cite this article (links to download the citations from this article in formats compatible with various reference manager tools)
Soluble immune mediators orchestrate protective in vitro granulomatous responses across Mycobacterium tuberculosis complex lineages
eLife 13:RP99062.
https://doi.org/10.7554/eLife.99062.4


