RUNX2 isoform II protects cancer cells from ferroptosis and apoptosis by promoting PRDX2 expression in oral squamous cell carcinoma
- State Key Laboratory of Oral & Maxillofacial Reconstruction and Regeneration, Key Laboratory of Oral Biomedicine Ministry of Education, Hubei Key Laboratory of Stomatology, School & Hospital of Stomatology, Wuhan University, China
- RNA Institute, Wuhan University, China
- Department of Endodontics, School and Hospital of Stomatology, Wuhan University, China
Figures
Figure 1 with 2 supplements
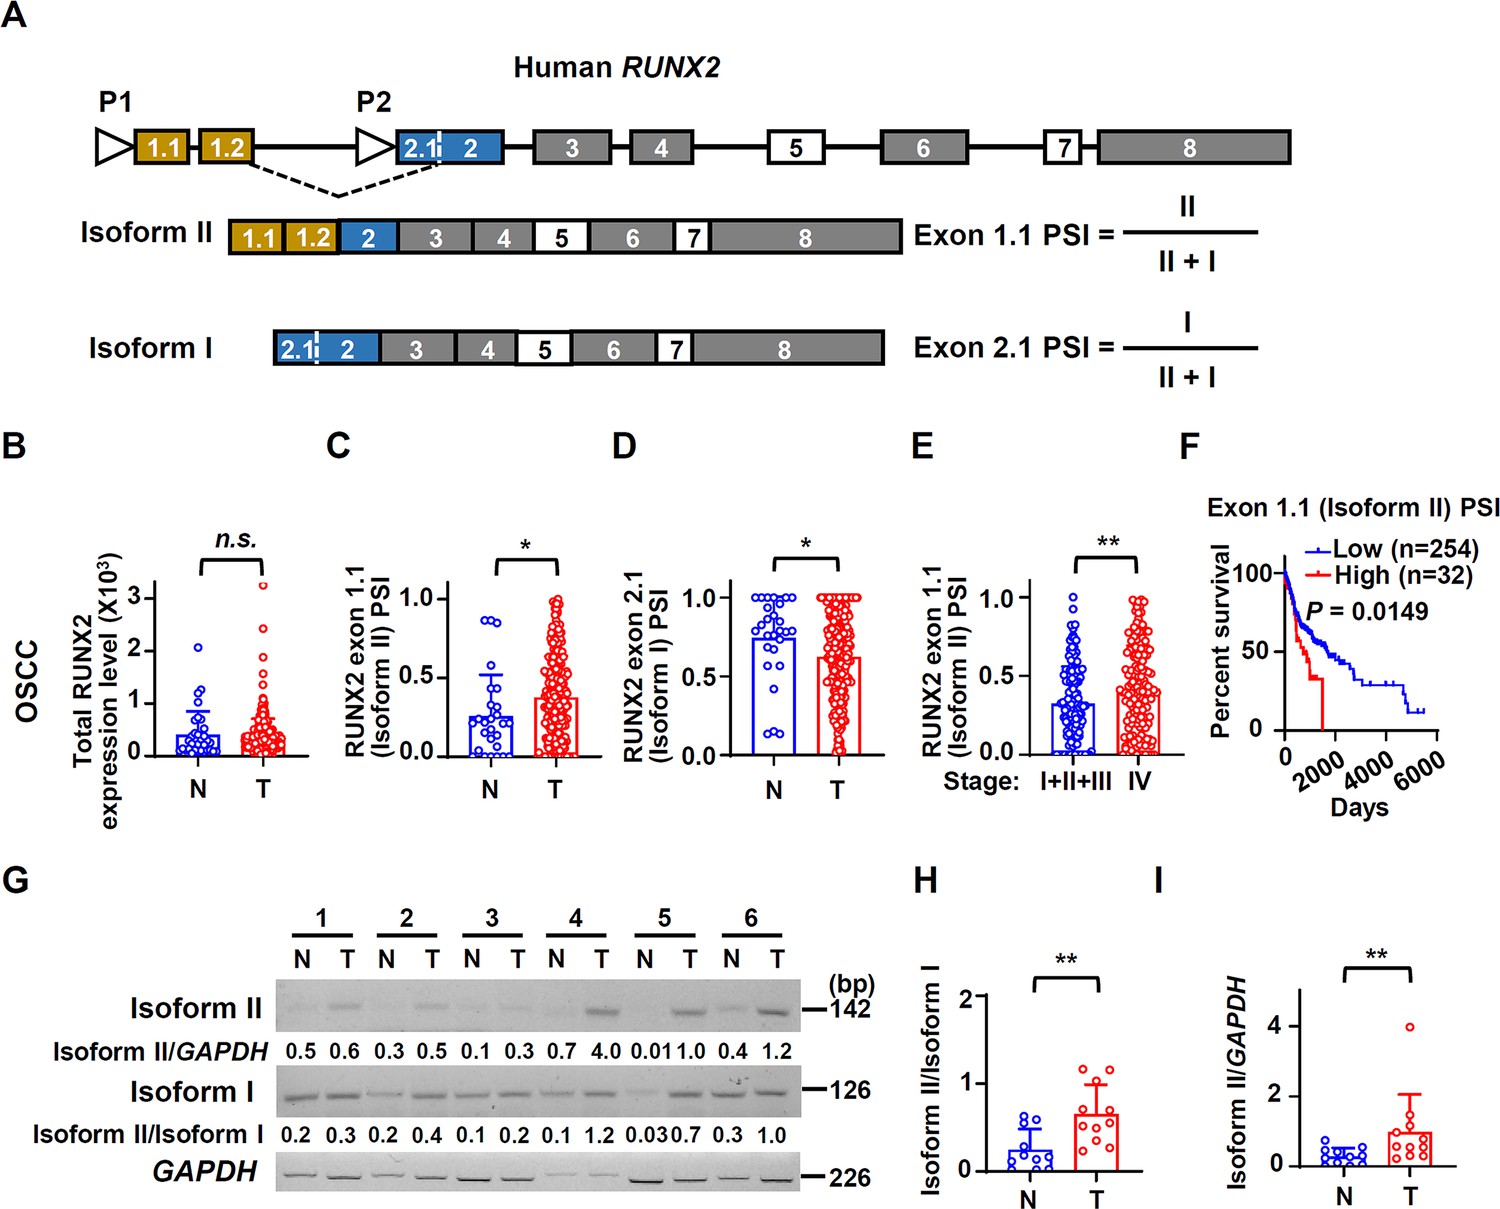
Human RUNX2 isoform II is overexpressed and associated with poor prognosis in oral squamous cell carcinoma (OSCC).
(A) Schematic diagram of the isoforms and alternative promoters of the human RUNX2 gene. Boxes and lines represent exons or introns in the pre-mRNA, respectively. P1 and P2 represent promoters. Isoform II is transcribed from P1, while isoform I is transcribed from P2. Exon 5 and 7 are alternative exons. (B–D) The expression levels of total RUNX2 and isoforms in TCGA OSCC patients. (B) The normalized expression levels of total RUNX2, obtained from an online program, TSVdb, in normal (32 cases) or OSCC tissues (309 cases). (C, D) The percent-splice-in (PSI) values of exon 1.1 (isoform II) (C) and exon 2.1 (isoform I) (D) (total 288 cases with PSI values of exon 1.1 and exon 2.1) in normal (27 cases) and OSCC tissues (288 cases) were obtained from an online program, TCGA SpliceSeq. The PSI values represent the relative expression levels of individual isoform. (E) Comparison of exon 1.1 (isoform II) PSI between patients in stage I, II and III (132 cases) and those in stage IV (156 cases) of OSCC TCGA patients. (F) OSCC TCGA patients (total 286 cases with survival data) with low expression (254 cases) or high expression (32 cases) of exon 1.1 (isoform II) in OSCC. Low exon 1.1 (isoform II) PSI was defined as less than mean + 1.427 SD. (G) The representative RT-PCR results of isoform II and isoform I in our OSCC or normal samples. GAPDH served as a loading control. (H–I) The scatter dot plot summarized the ratio of isoform II versus isoform I (isoform II/isoform I) (H) or the relative expression levels of isoform II (isoform II/GAPDH) (I) in our clinical OSCC (11 cases) and normal samples (11 cases). *p<0.05, **p<0.01.
-
Figure 1—source data 1
Raw data files for Figure 1B-E and Figure 1G-I.
- https://cdn.elifesciences.org/articles/99122/elife-99122-fig1-data1-v2.zip
Figure 1—figure supplement 1
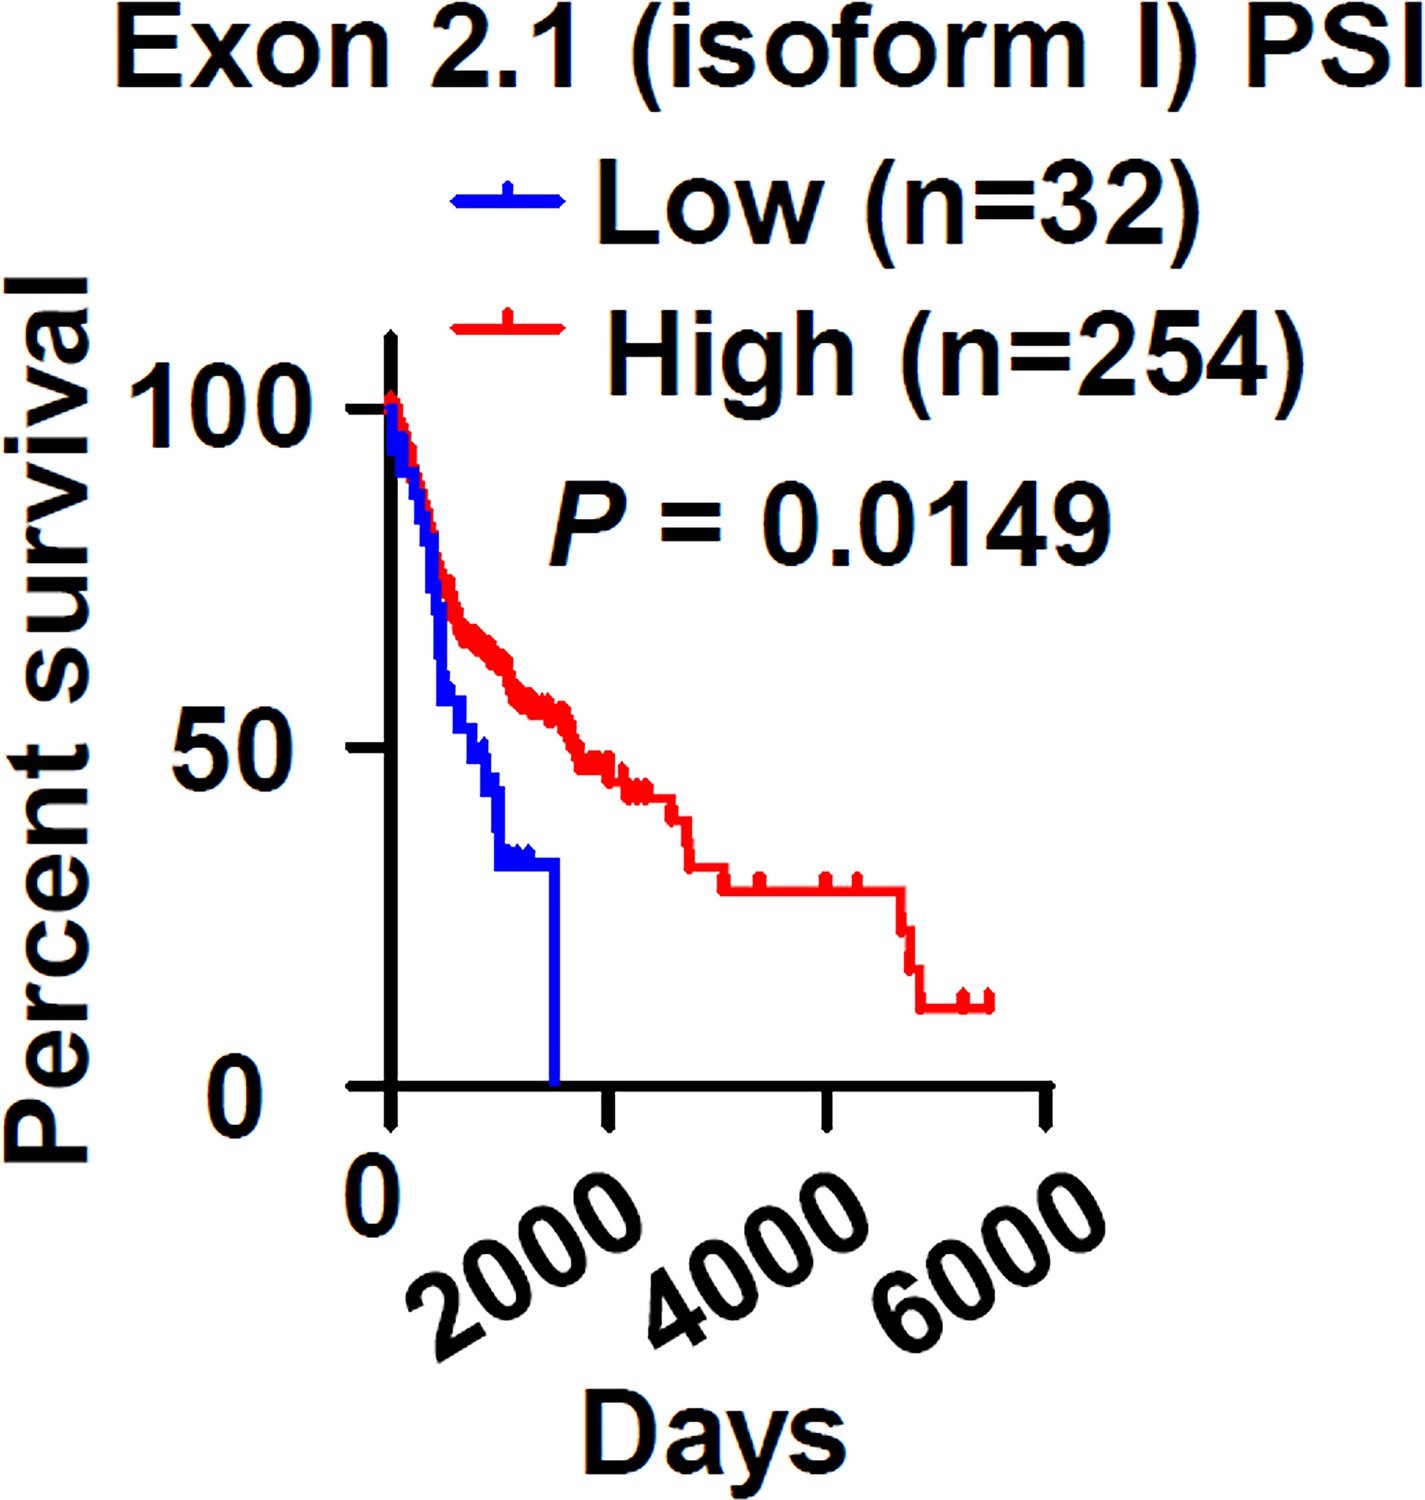
Lower RUNX2 isoform I expression is associated with poor overall survival in oral squamous cell carcinoma (OSCC) patients.
OSCC TCGA patients (total 286 cases with survival data) with low expression (32 cases) or high expression (254 cases) of exon 2.1 (isoform I) in OSCC. High exon 2.1 (isoform II) percent-splice-in (PSI) was defined as more than mean -1.427 SD.
Figure 1—figure supplement 2
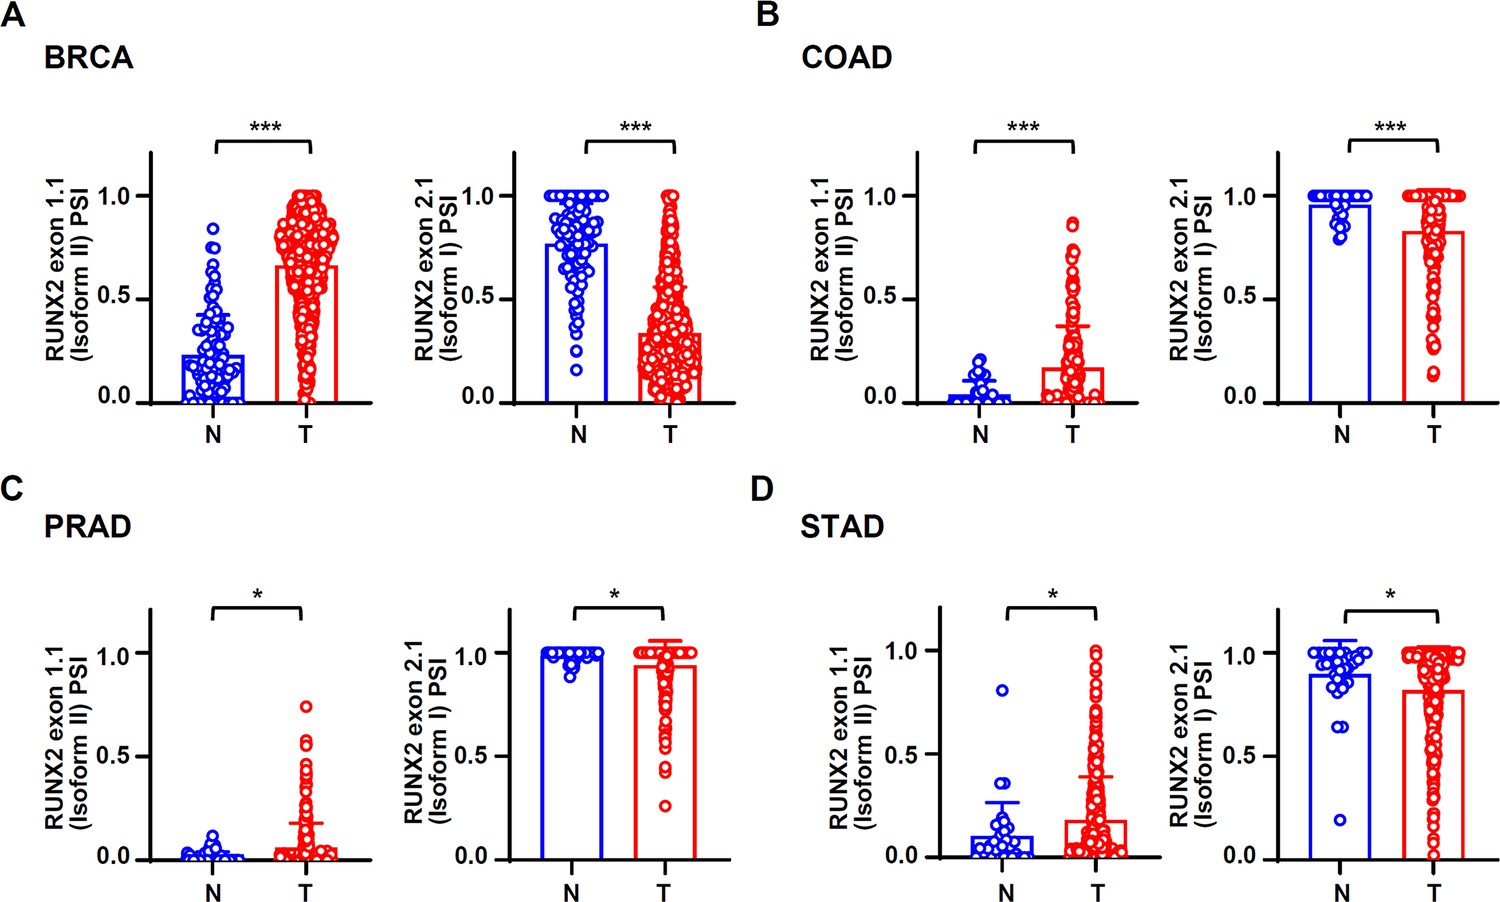
RUNX2 isoform II is also overexpressed in some other carcinomas.
(A–D) The data valuing the expression levels of RUNX2 isoforms (indicated by percent-splice-in) were obtained from TCGA SpliceSeq. The expression levels of RUNX2 exon 1.1 (isoform II) and exon 2.1 (isoform I) were compared between normal (99 cases) and tumor tissues (1050 cases) in BRCA (A) patients, normal (39 cases) and tumor tissues (241 cases) in colon adenocarcinoma (COAD) (B) patients, normal (50 cases) and tumor tissues (320 cases) in prostate adenocarcinoma (PRAD) (C) patients, normal (31 cases) and tumor tissues (397 cases) in stomach adenocarcinoma (STAD) (D). *p<0.05, ***p<0.001.
-
Figure 1—figure supplement 2—source data 1
Raw data files for Figure 1—figure supplement 2A-D.
- https://cdn.elifesciences.org/articles/99122/elife-99122-fig1-figsupp2-data1-v2.zip
Figure 2 with 4 supplements
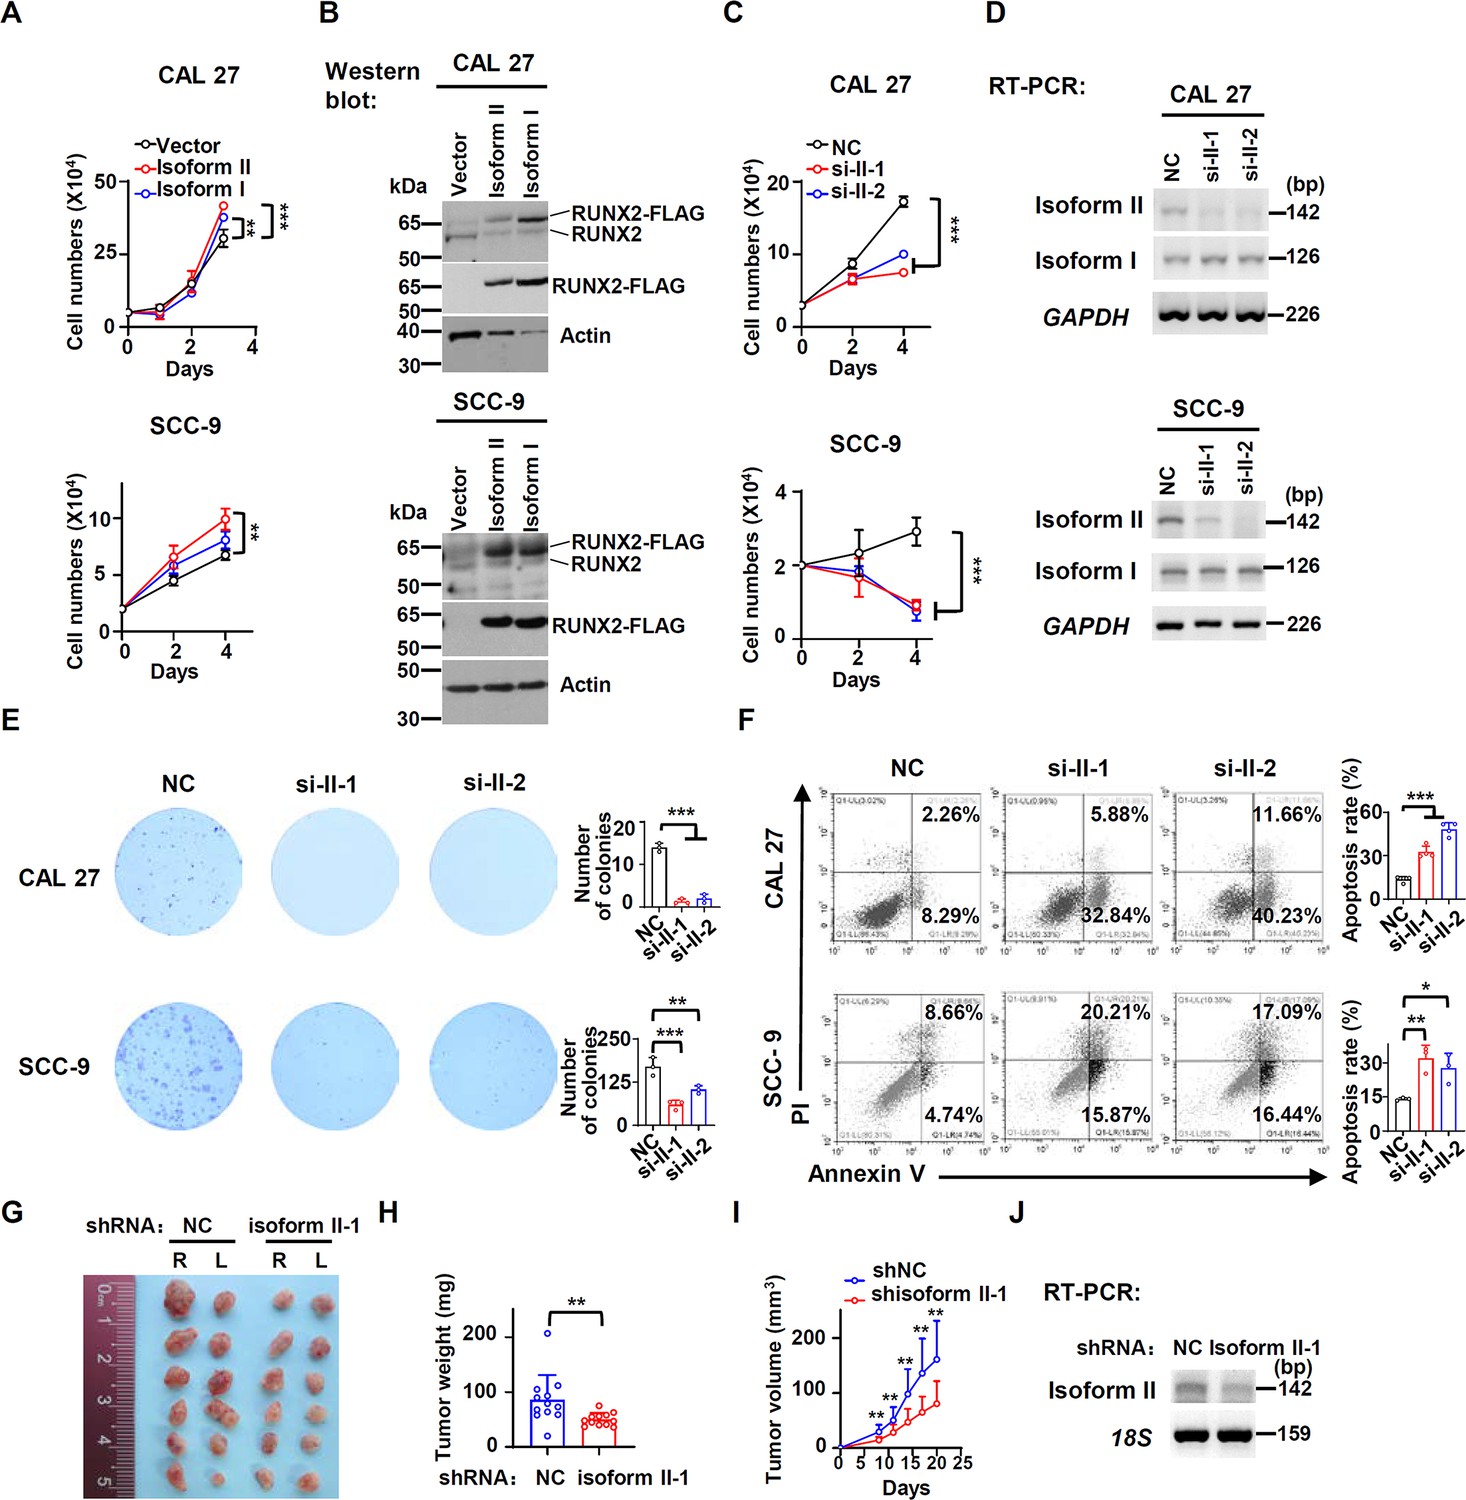
RUNX2 isoform II is required for the proliferation in vitro and tumorigenesis in vivo.
(A) CAL 27 or SCC-9 cells were stably transfected by isoform II-expression, isoform I-expression or vector control lentivirus. CAL 27 cells were seeded into 24-well plates at day 0 and counted on day 1, 2, and 3. SCC-9 cells were seeded into 24-well plates at day 0 and counted on day 2 and 4. Data are means ± SD, n = 3. (B) Overexpression of RUNX2 isoform II or isoform I was confirmed by western blot. Actin served as a loading control. (C) Proliferation curves of CAL 27 and SCC-9 cells treated with anti-isoform II siRNAs (si-II-1 or si-II-2) or negative control siRNA (NC). Data are means ± SD, n = 3. (D) Knockdown efficiency of isoform II was analyzed by RT-PCR. GAPDH served as a loading control. (E) Effects of isoform II-knockdown on the clonogenic ability in CAL 27 and SCC-9. The histograms on the right summarized the numbers of colonies (at least 50 cells/colony). Data are means ± SD, n = 3. (F) CAL 27 and SCC-9 cells were treated with si-II-1, si-II-2, or NC siRNA. The cellular apoptosis was analyzed by flow cytometry. The histograms on the right summarized the cellular apoptosis. Data are means ± SD, n=4 for CAL 27, n = 3 for SCC-9. (G–I) CAL 27 cells with stable isoform II shRNA (shisoform II-1) or nonspecific shRNA (shNC) were injected into both sides of the dorsum of BALB/c nude mice. (G, H) Tumors were dissected out and weighed on day 21. (I) Tumor volumes were measured on different days. (J) Knockdown efficiency of isoform II was analyzed by RT-PCR. 18S rRNA served as a loading control. *p<0.05, **p<0.01, ***p<0.001.
-
Figure 2—source data 1
Raw data files for Figure 2B, D-F, H and J.
- https://cdn.elifesciences.org/articles/99122/elife-99122-fig2-data1-v2.zip
Figure 2—figure supplement 1
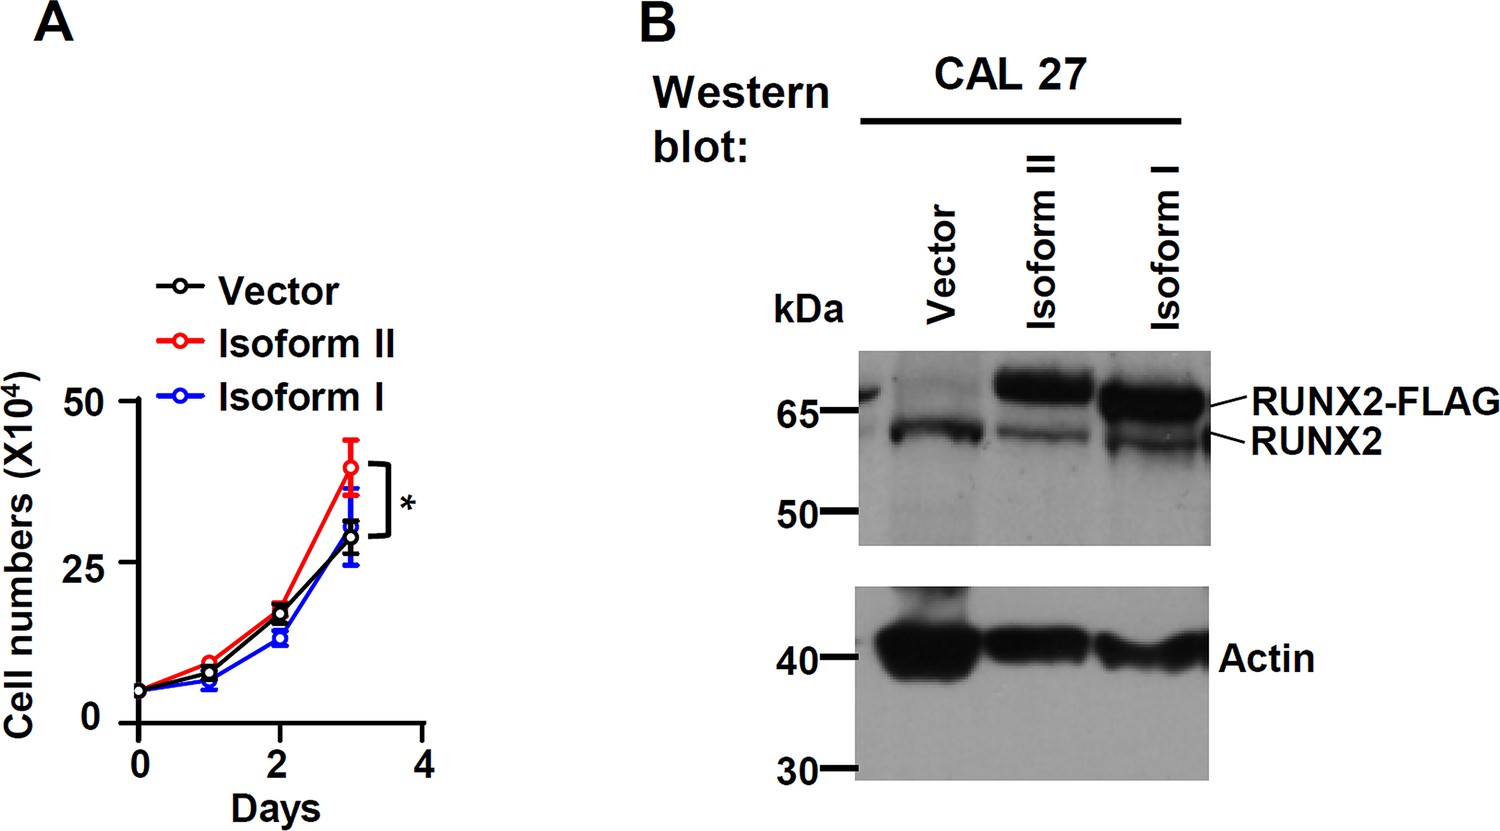
RUNX2 isoform II overexpression promoted cell proliferation.
CAL 27 were stably transfected by isoform II-expression, isoform I-expression, or vector control lentivirus. (A) Cells were seeded in 24-well plates at day 0 and counted on days 1, 2, and 3. Data are means ± SD, n = 3. (B) Overexpression of RUNX2 isoform II or isoform I was confirmed by western blot. *p<0.05.
-
Figure 2—figure supplement 1—source data 1
Raw data files for Figure 2—figure supplement 1B.
- https://cdn.elifesciences.org/articles/99122/elife-99122-fig2-figsupp1-data1-v2.zip
Figure 2—figure supplement 2
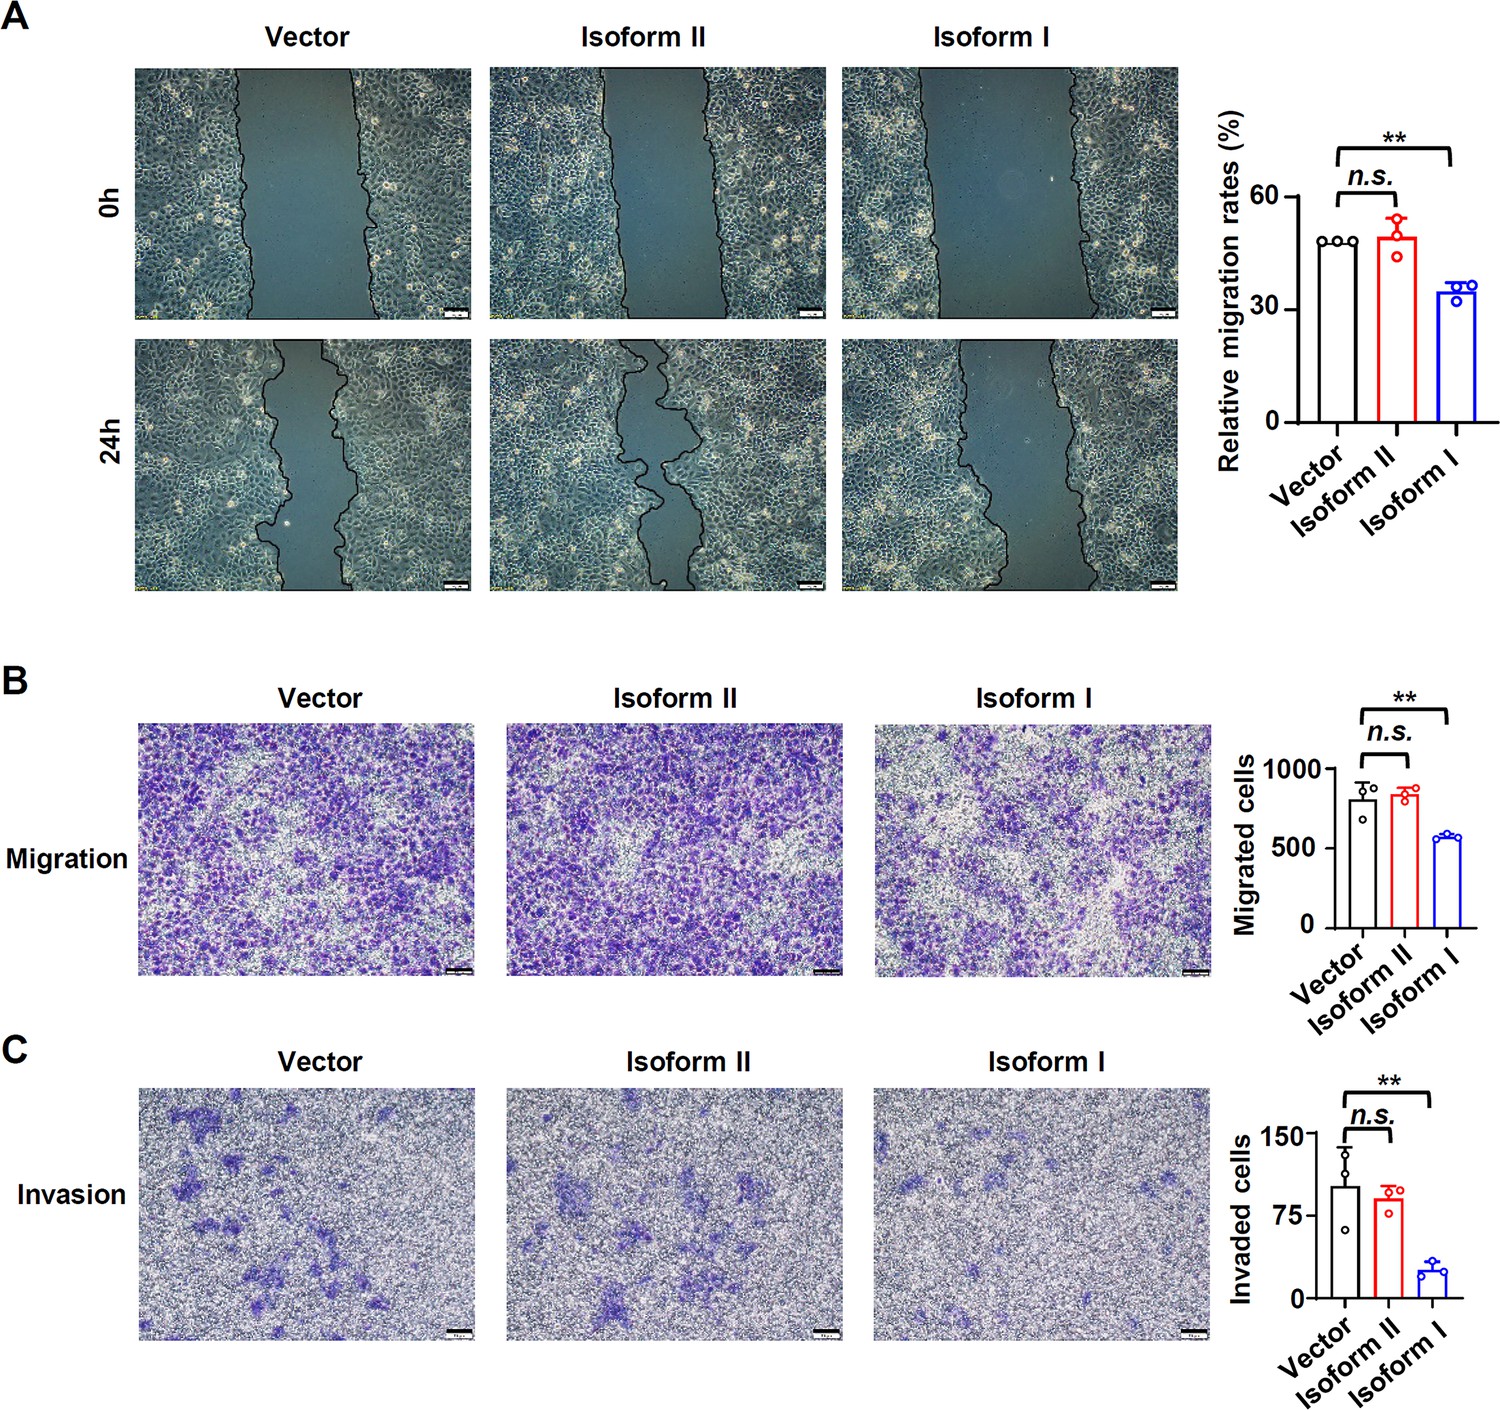
RUNX2 isoform II has no effect on migration or invasion of oral squamous cell carcinoma (OSCC) cells.
(A) Representative images of wound-healing in cells overexpressing isoform II, isoform I, or vector (control). The histogram on the right summarized the relative migration rates. (B, C) Representative images of transwell migration (B) or invasion (C) in cells overexpressing isoform II, isoform I, or control. The histograms on the right summarized the migrated cells (B) or invaded cells (C). Scale bar: 100 μm. Data are means ± SD, n = 3, **p<0.01.
-
Figure 2—figure supplement 2—source data 1
Raw data files for Figure 1—figure supplement 2A-C.
- https://cdn.elifesciences.org/articles/99122/elife-99122-fig2-figsupp2-data1-v2.zip
Figure 2—figure supplement 3
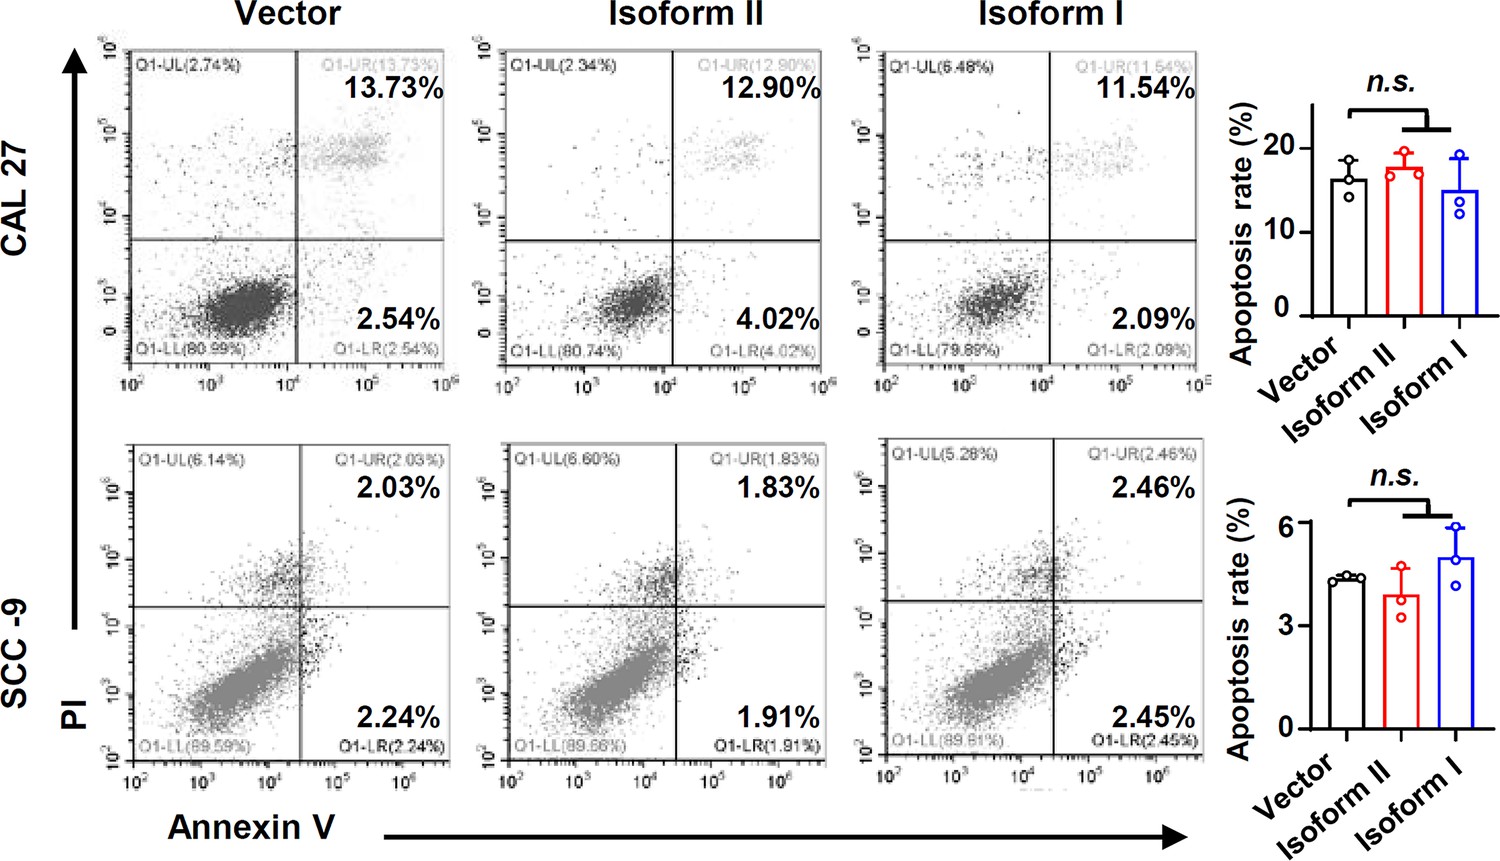
Overexpression of RUNX2 isoform II or isoform I did not affect cellular apoptosis.
The cellular apoptosis of CAL 27 or SCC-9 stably transfected by isoform II-expression, isoform I-expression or vector control lentivirus was analyzed by flow cytometry. The histograms on the right summarized the cellular apoptosis. Data are means ± SD, n = 3.
-
Figure 2—figure supplement 3—source data 1
Raw data file for Figure 2—figure supplement 3.
- https://cdn.elifesciences.org/articles/99122/elife-99122-fig2-figsupp3-data1-v2.zip
Figure 2—figure supplement 4
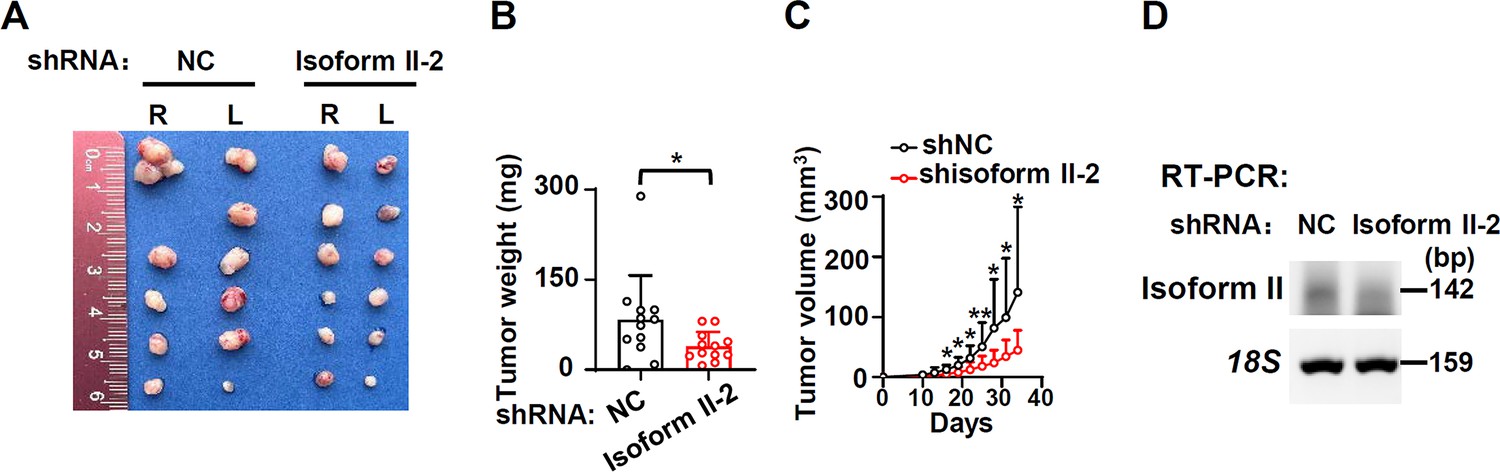
RUNX2 isoform II-knockdown inhibits the tumor growth.
CAL 27 cells with another stable isoform II shRNA (shisoform II-2) or nonspecific shRNA (shNC) were injected into both sides of the dorsum of BALB/c nude mice. (A, B) Tumors were dissected out and weighed on day 34. (C) Tumor volumes were measured on different days. (D) Knockdown efficiency of isoform II was analyzed by RT-PCR. 18S rRNA served as a loading control. *p<0.05, **p<0.01.
-
Figure 2—figure supplement 4—source data 1
Raw data files for Figure 2—figure supplement 4B and D.
- https://cdn.elifesciences.org/articles/99122/elife-99122-fig2-figsupp4-data1-v2.zip
Figure 3 with 8 supplements
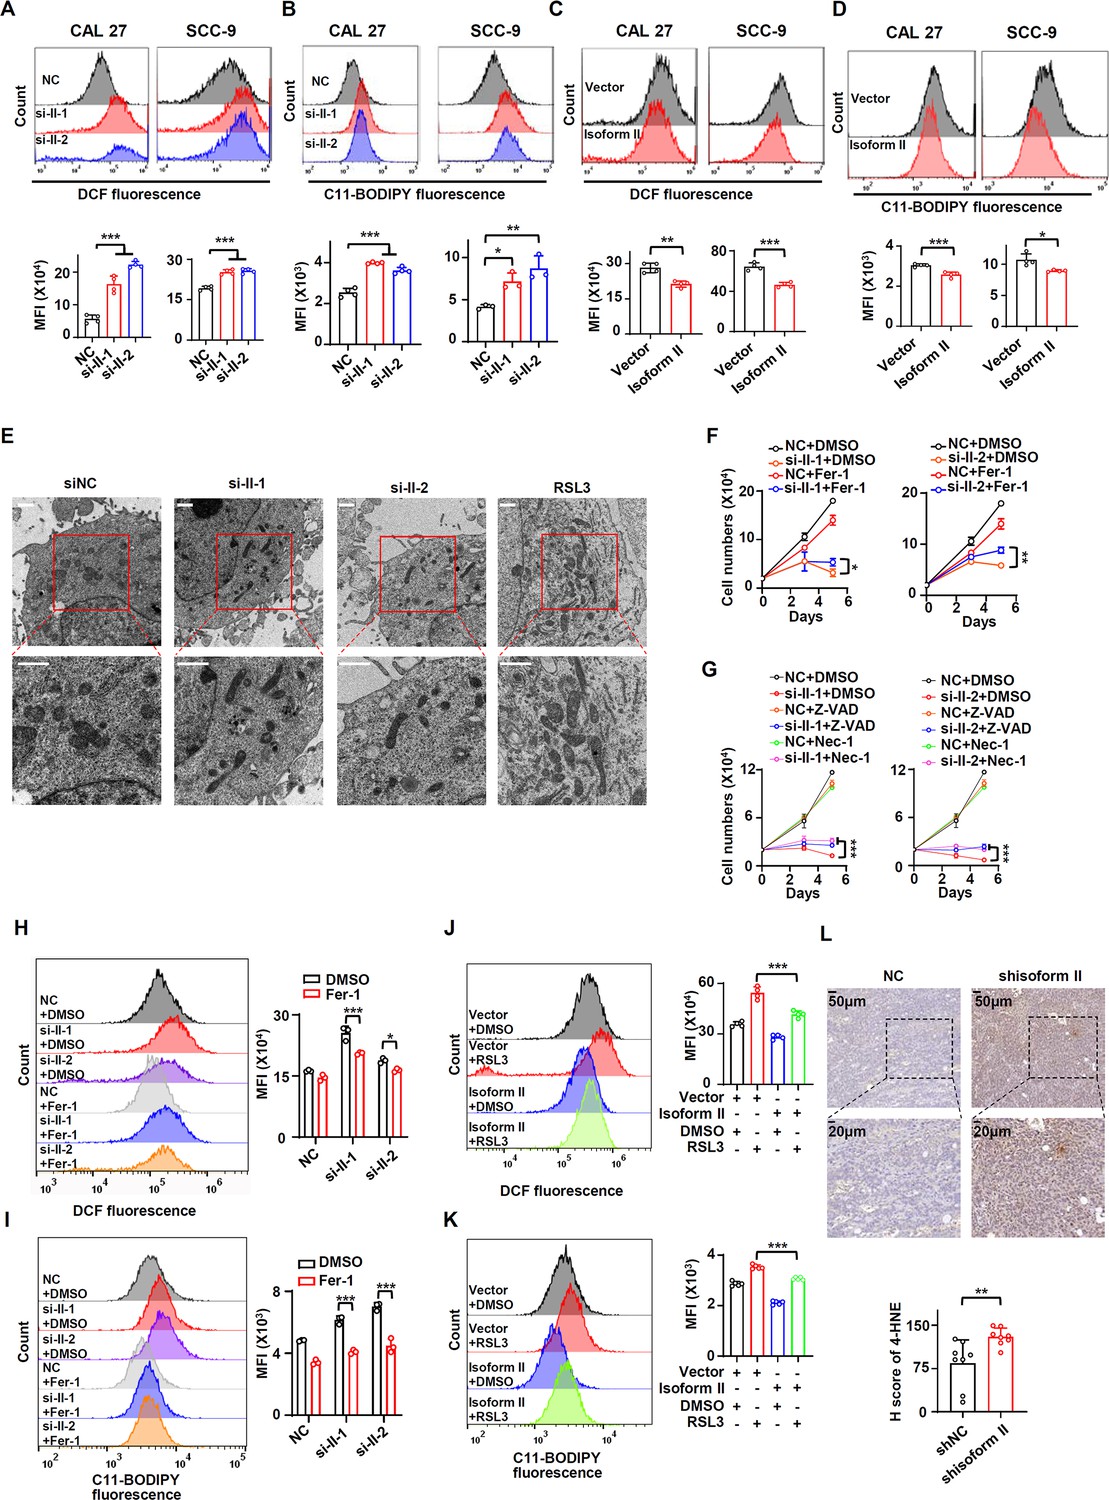
RUNX2 isoform II suppresses ferroptosis.
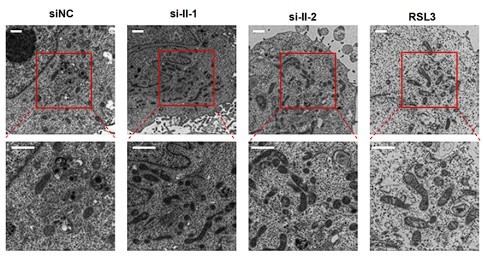
(A, B) CAL 27 and SCC-9 cells were treated with anti-isoform II siRNAs (si-II-1 and si-II-2) or negative control siRNA (NC). (A) The levels of total reactive oxygen species (ROS) were detected with DCFH-DA using flow cytometry. The histograms below summarized the levels of mean fluorescent intensity (MFI). Data are means ± SD, n = 4. (B) The lipid peroxidation of cells was analyzed with C11 BODIPY 581/591 reagent using flow cytometry. The histograms below summarized the levels of MFI. Data are means ± SD, n = 4 for CAL 27, n = 3 for SCC-9. (C, D) CAL 27 or SCC-9 cells were stably transfected by isoform II-expression or vector control lentivirus. The levels of ROS (C) or lipid peroxidation (D) were detected by flow cytometry. The histograms below summarized the levels of MFI. Data are means ± SD, n = 4. (E) Transmission electron microscopy images of CAL 27 cells transfected with si-II-1, si-II-2, or NC. RSL3 (a ferroptosis activator) served as a positive control. Scale bar: 1 μm (F) CAL 27 cells transfected with anti-isoform II siRNAs were also treated with ferrostatin-1 (Fer-1, 10 μM), a ferroptosis inhibitor. Negative control siRNA and DMSO were used as controls. Cells were divided into six groups: NC + DMSO, si-II-1 + DMSO, si-II-2 + DMSO, NC + Fer-1, si-II-1 + Fer-1, and si-II-2 + Fer-1. To display clear diagrams, the proliferation curves of si-II-1-treated cells or si-II-2-treated cells were shown separately. Data are means ± SD, n = 3. (G) CAL 27 cells transfected with anti-isoform II siRNAs were also treated with Z-VAD (20 μM, an apoptosis inhibitor) or necrostatin-1 (Nec-1, 20 μM, a necroptosis inhibitor). Negative control siRNA and DMSO were used as controls. Cells were divided into nine groups: NC + DMSO, si-II-1 + DMSO, si-II-2 + DMSO, NC + Z-VAD, si-II-1 + Z-VAD, si-II-2 + Z-VAD, NC + Nec-1, si-II-1 +Nec-1, and si-II-2 + Nec-1. To display clear diagrams, the proliferation curves of si-II-1-transfected cells or si-II-2-transfected cells were shown separately. Data are means ± SD, n = 3. (H, I) The total ROS levels (H) or lipid peroxidation (I) of cells simultaneously transfected with anti-isoform II siRNAs or NC and treated with Fer-1 or DMSO were detected with DCFH-DA (H) or BODIPY 581/591 reagent (I) by flow cytometry. The histogram on the right summarized the levels of MFI. Data are means ± SD, n = 3. (J, K) The total ROS levels (J) or lipid peroxidation (K) of isoform II-overexpressed cells treated with RSL3 (2 μM, a ferroptosis activator) or DMSO were detected with DCFH-DA (J) or BODIPY 581/591 reagent (K) by flow cytometry. The histogram on the right summarized the levels of MFI. Data are means ± SD, n = 4 for (J), n = 5 for (K). (L) Representative images of immunohistochemical staining of 4-HNE in tumors with or without isoform II-knockdown (shisoform II vs shNC) in Figure 2G. The histogram below summarized the H score of 4-HNE staining in tumors. *p<0.05, **p<0.01, ***p<0.001.
-
Figure 3—source data 1
Raw data files for Figure 3A-D and Figure 3H-L.
- https://cdn.elifesciences.org/articles/99122/elife-99122-fig3-data1-v2.zip
Figure 3—figure supplement 1
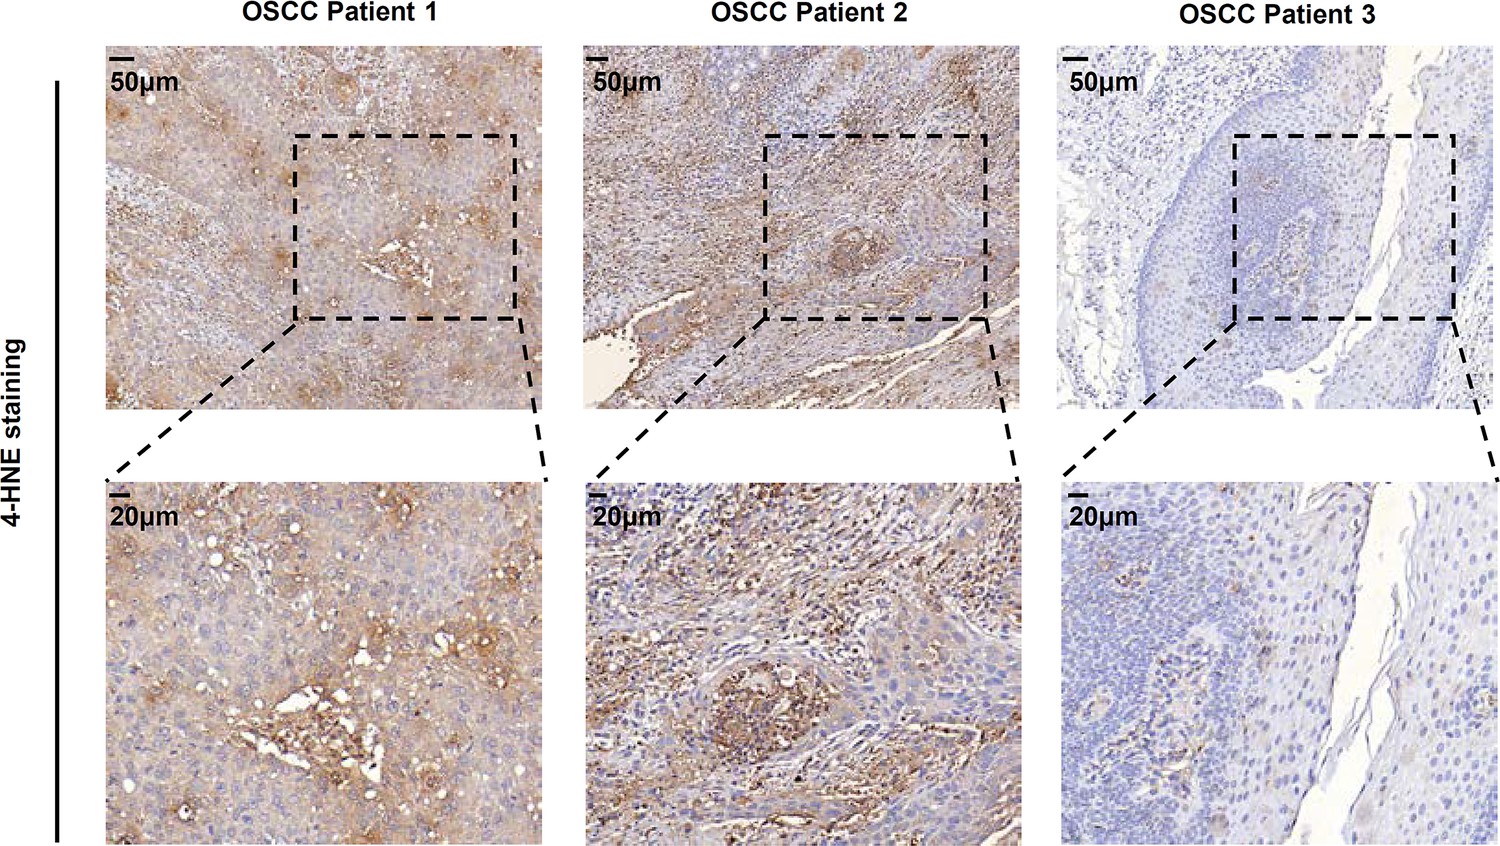
Ferroptosis may be present in oral squamous cell carcinoma (OSCC) tissues.
The images of immunohistochemical staining of 4-HNE in OSCC tissues.
Figure 3—figure supplement 2
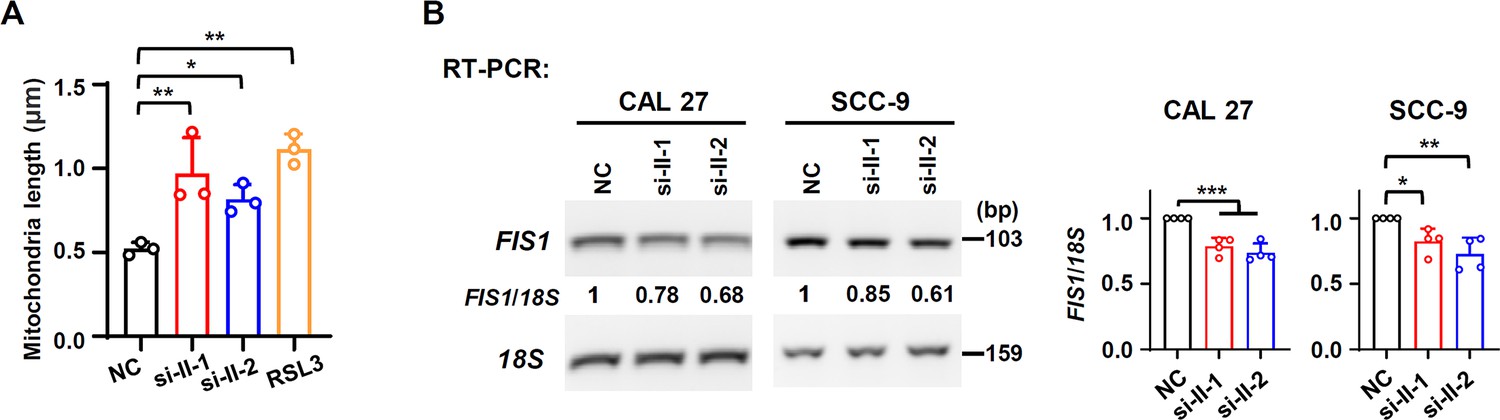
RUNX2 isoform II knockdown cells show more elongated mitochondria.
(A) The histogram summarized the mitochondrial length. Data are means ± SD, n = 3. (B) Effects of isoform II-knockdown on the expression levels of FIS1 were analyzed by RT-PCR in CAL 27 or SCC-9 cells. 18S rRNA served as a loading control. Data are means ± SD, n = 4. *p<0.05, **p<0.01, ***p<0.001.
-
Figure 3—figure supplement 2—source data 1
Raw data files for Figure 3—figure supplement 2A and B.
- https://cdn.elifesciences.org/articles/99122/elife-99122-fig3-figsupp2-data1-v2.zip
Figure 3—figure supplement 3
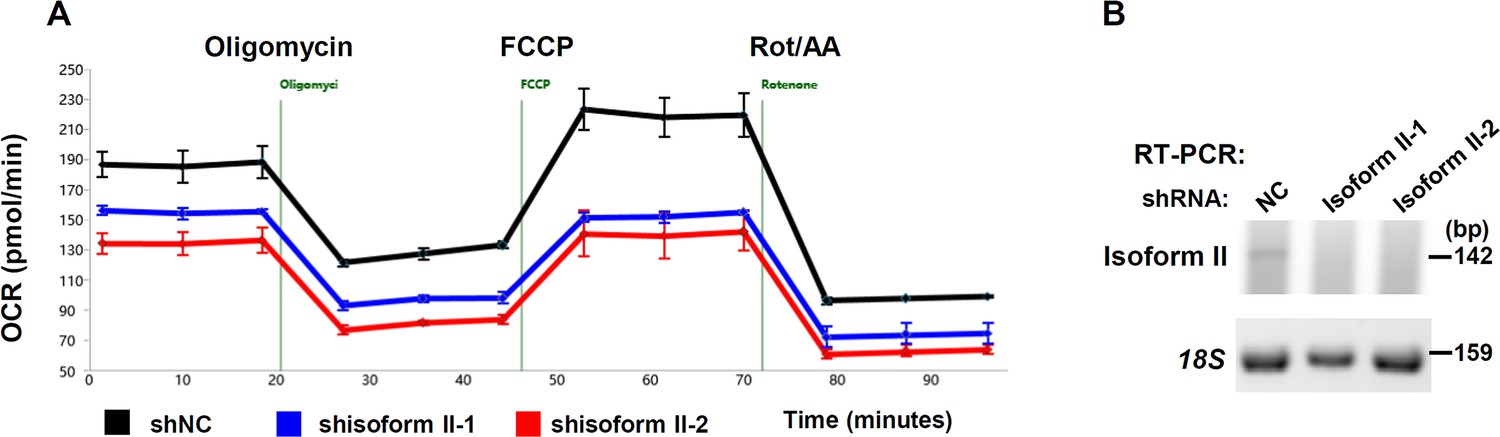
RUNX2 isoform II-knockdown inhibits oxygen consumption rate (OCR) in oral squamous cell carcinoma (OSCC) cells.
(A) OCR detection in isoform II-knockdown of SCC-9. (B) Knockdown efficiency of RUNX2 isoform II (shisoform II-1 and shisoform II-2) was analyzed by RT-PCR. 18S rRNA served as a control.
-
Figure 3—figure supplement 3—source data 1
Raw data files for Figure 3—figure supplement 3B.
- https://cdn.elifesciences.org/articles/99122/elife-99122-fig3-figsupp3-data1-v2.zip
Figure 3—figure supplement 4
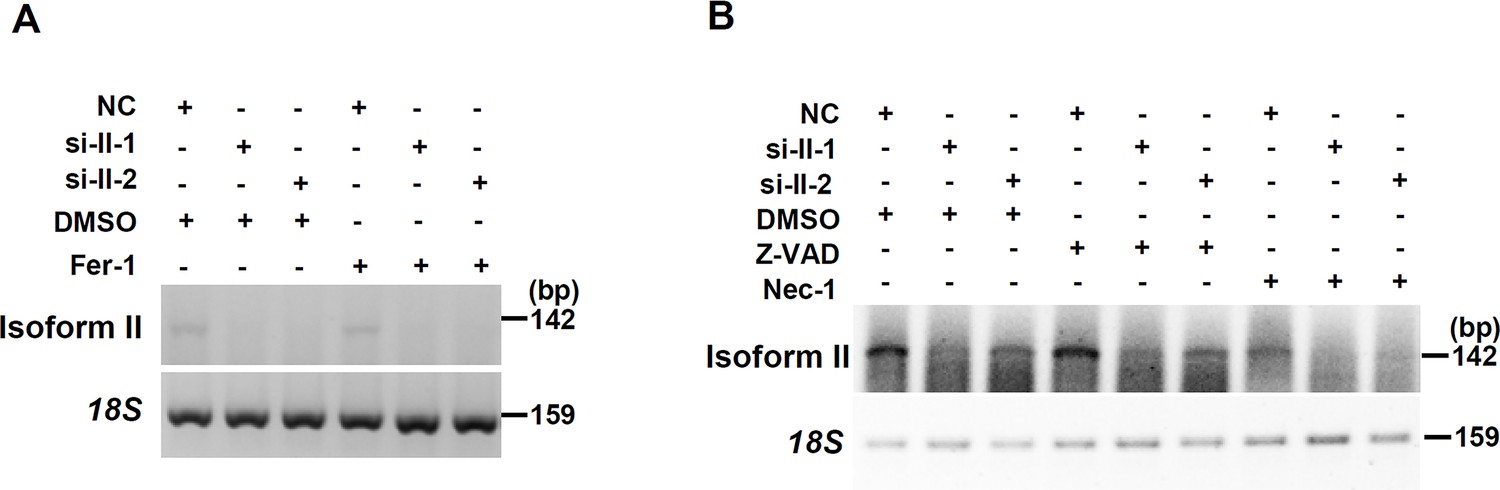
Validation of RUNX2 isoform II-knockdown in Figure 3.
(A) Knockdown efficiency of RUNX2 isoform II in ferrostatin-1 (Fer-1, a ferroptosis inhibitor) treated cells was analyzed by RT-PCR. 18S rRNA served as a control. (B) Knockdown efficiency of RUNX2 isoform II (si-II-1 and si-II-2) in Z-VAD, (an apoptosis inhibitor) or necrostatin-1 (Nec-1, a necroptosis inhibitor) treated cells was analyzed by RT-PCR. 18S rRNA served as a control.
-
Figure 3—figure supplement 4—source data 1
Raw data files for Figure 3—figure supplement 4A and B.
- https://cdn.elifesciences.org/articles/99122/elife-99122-fig3-figsupp4-data1-v2.zip
Figure 3—figure supplement 5
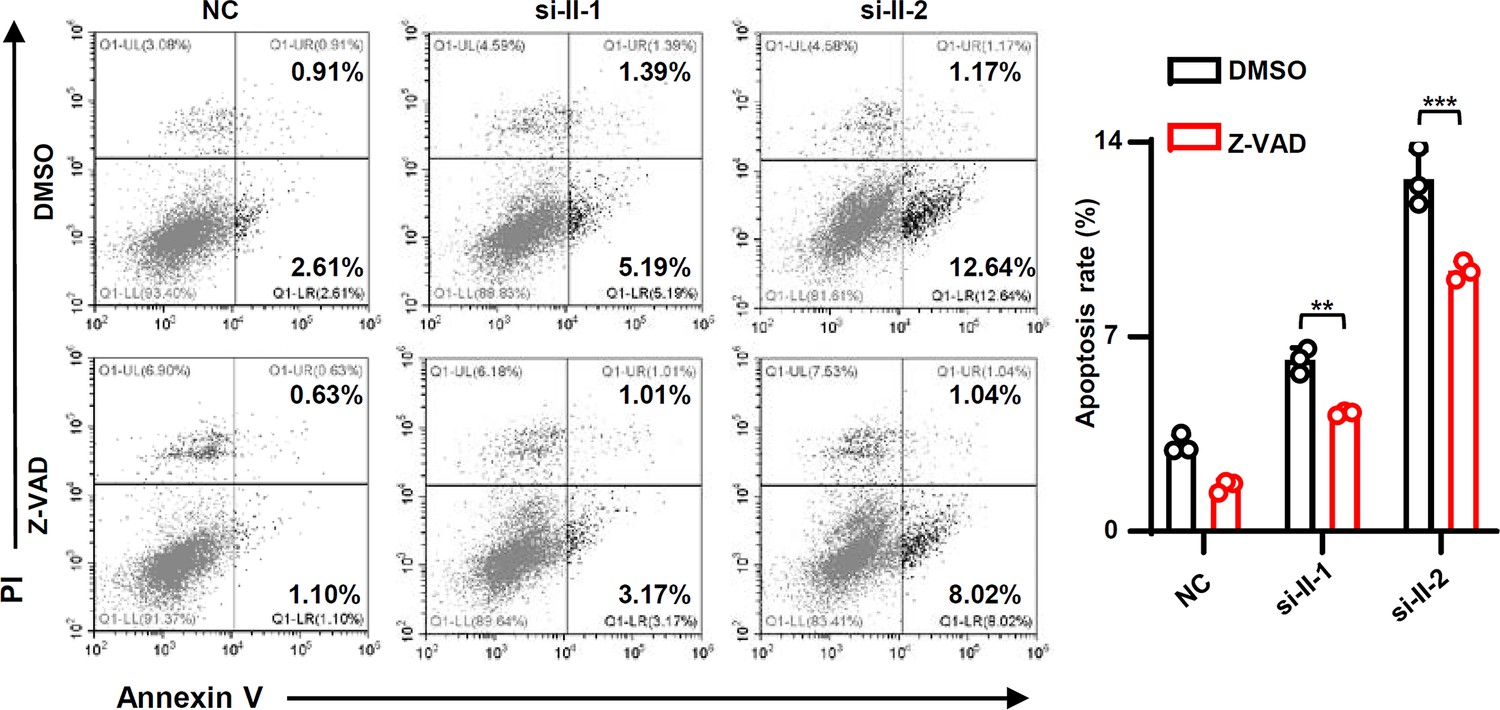
The apoptosis inhibitor Z-VAD reduces the increased apoptosis rates caused by isoform II-knockdown.
The cellular apoptosis of CAL 27 simultaneously transfected with siRNAs (anti-isoform II siRNAs or NC) and treated with Z-VAD or DMSO was detected by flow cytometry. The histogram on the right summarized the cellular apoptosis. Data are means ± SD, n = 3. ** p<0.01, ***p<0.001.
-
Figure 3—figure supplement 5—source data 1
Raw data file for Figure 3—figure supplement 5.
- https://cdn.elifesciences.org/articles/99122/elife-99122-fig3-figsupp5-data1-v2.zip
Figure 3—figure supplement 6
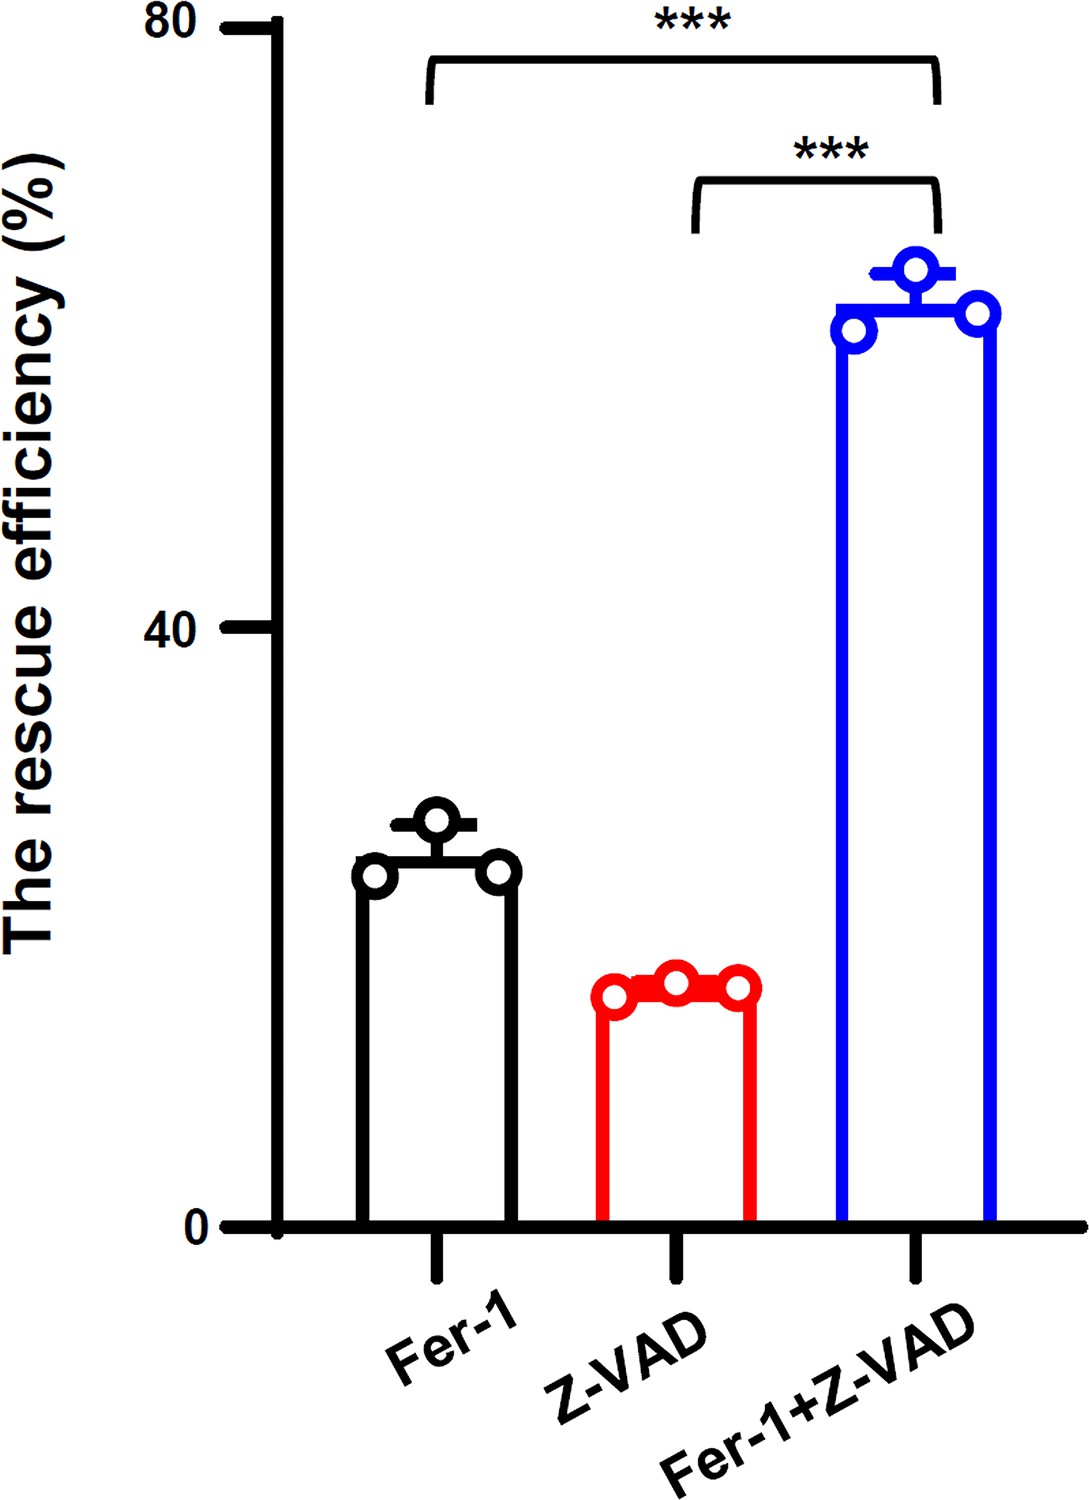
The combination of Fer-1 and Z-VAD partially rescues the deduced cell proliferation caused by isoform II knockdown.
CAL 27 cells transfected with anti-isoform II siRNA (si-II) were also treated with DMSO, Fer-1, and Z-VAD. We analyzed the rescue efficiency of Fer-1 and Z-VAD alone or the combination of Fer-1 and Z-VAD in cell proliferation. The rescue efficiency of cells = (number of cells in inhibitor-treated and isoform II-knockdown group/number of cells in inhibitor-treated and NC group – number of cells in DMSO-treated and isoform II-knockdown group/number of cells in DMSO-treated and NC group)/1 – (number of cells in DMSO-treated and isoform II-knockdown group/number of cells in DMSO-treated and NC group). Data are means ± SD, n=3. *** P<0.001.
-
Figure 3—figure supplement 6—source data 1
Raw data file for Figure 3—figure supplement 6.
- https://cdn.elifesciences.org/articles/99122/elife-99122-fig3-figsupp6-data1-v2.zip
Figure 3—figure supplement 7
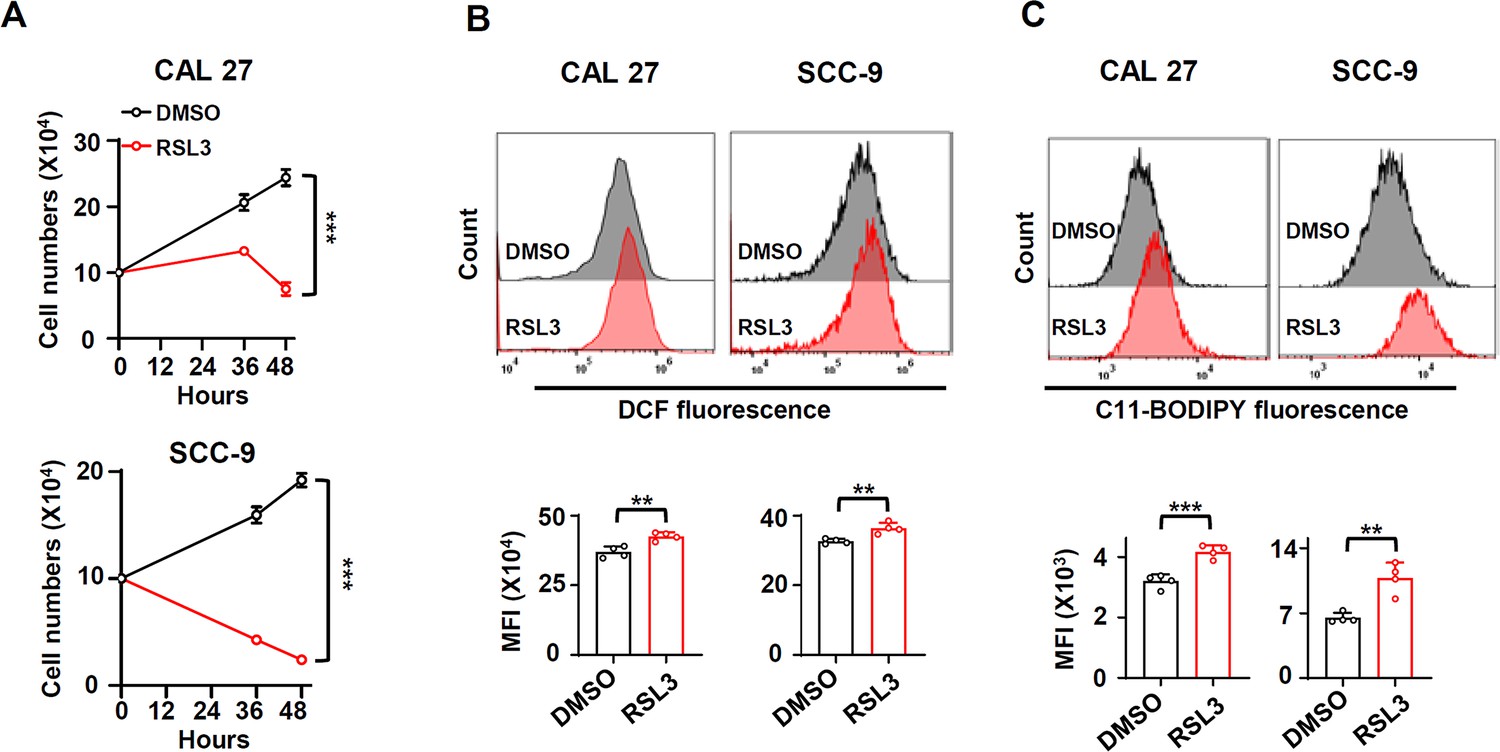
Oral squamous cell carcinoma (OSCC) cell lines are sensitive to RSL3 treatment.
(A) The OSCC cells (CAL 27 or SCC-9) were seeded into 24-well plates at day 0. Then, the cells were treated with RSL3 (2 μM, a ferroptosis activator) or DMSO 24 hours after plating. The cells were counted at 12 and 24 hours after RLS3 treatment. Data are means ± SD, n = 4. (B, C) The total reactive oxygen species (ROS) levels (B) or lipid peroxidation (C) of cells treated with RSL3 or DMSO were detected with DCFH-DA (B) or BODIPY 581/591 reagent (C) by flow cytometry. The histogram below summarized the levels of mean fluorescent intensity (MFI). Data are means ± SD, n = 4. **p<0.01, ***p<0.001.
-
Figure 3—figure supplement 7—source data 1
Raw data files for Figure 3—figure supplement 7B and C.
- https://cdn.elifesciences.org/articles/99122/elife-99122-fig3-figsupp7-data1-v2.zip
Figure 3—figure supplement 8
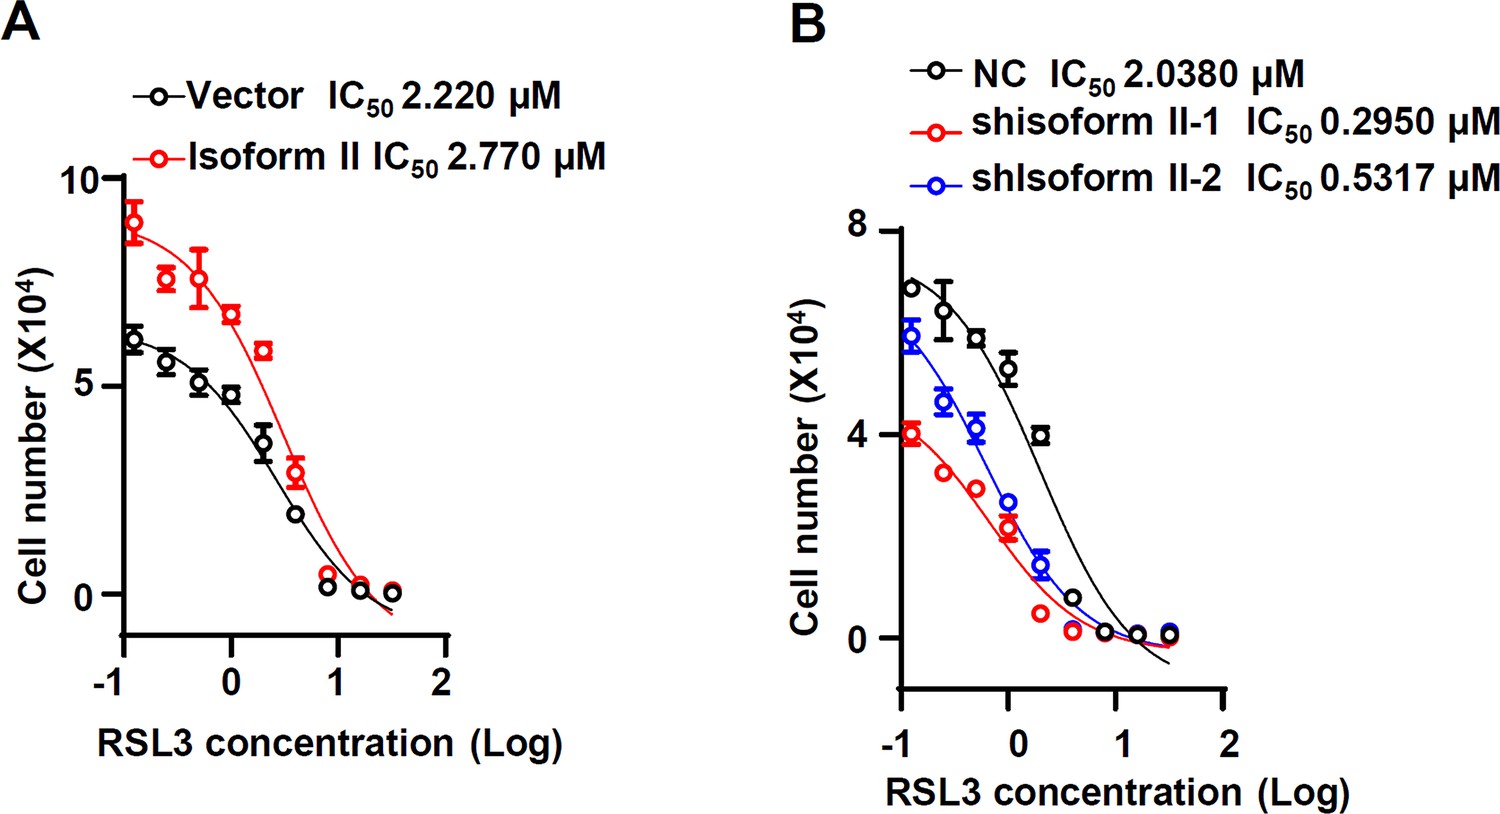
Half maximal inhibitory concentration (IC50) of RSL3 was analyzed in isoform II-overexpression CAL 27 (A) or in isoform II-knockdown CAL 27 (B).
Figure 4 with 4 supplements
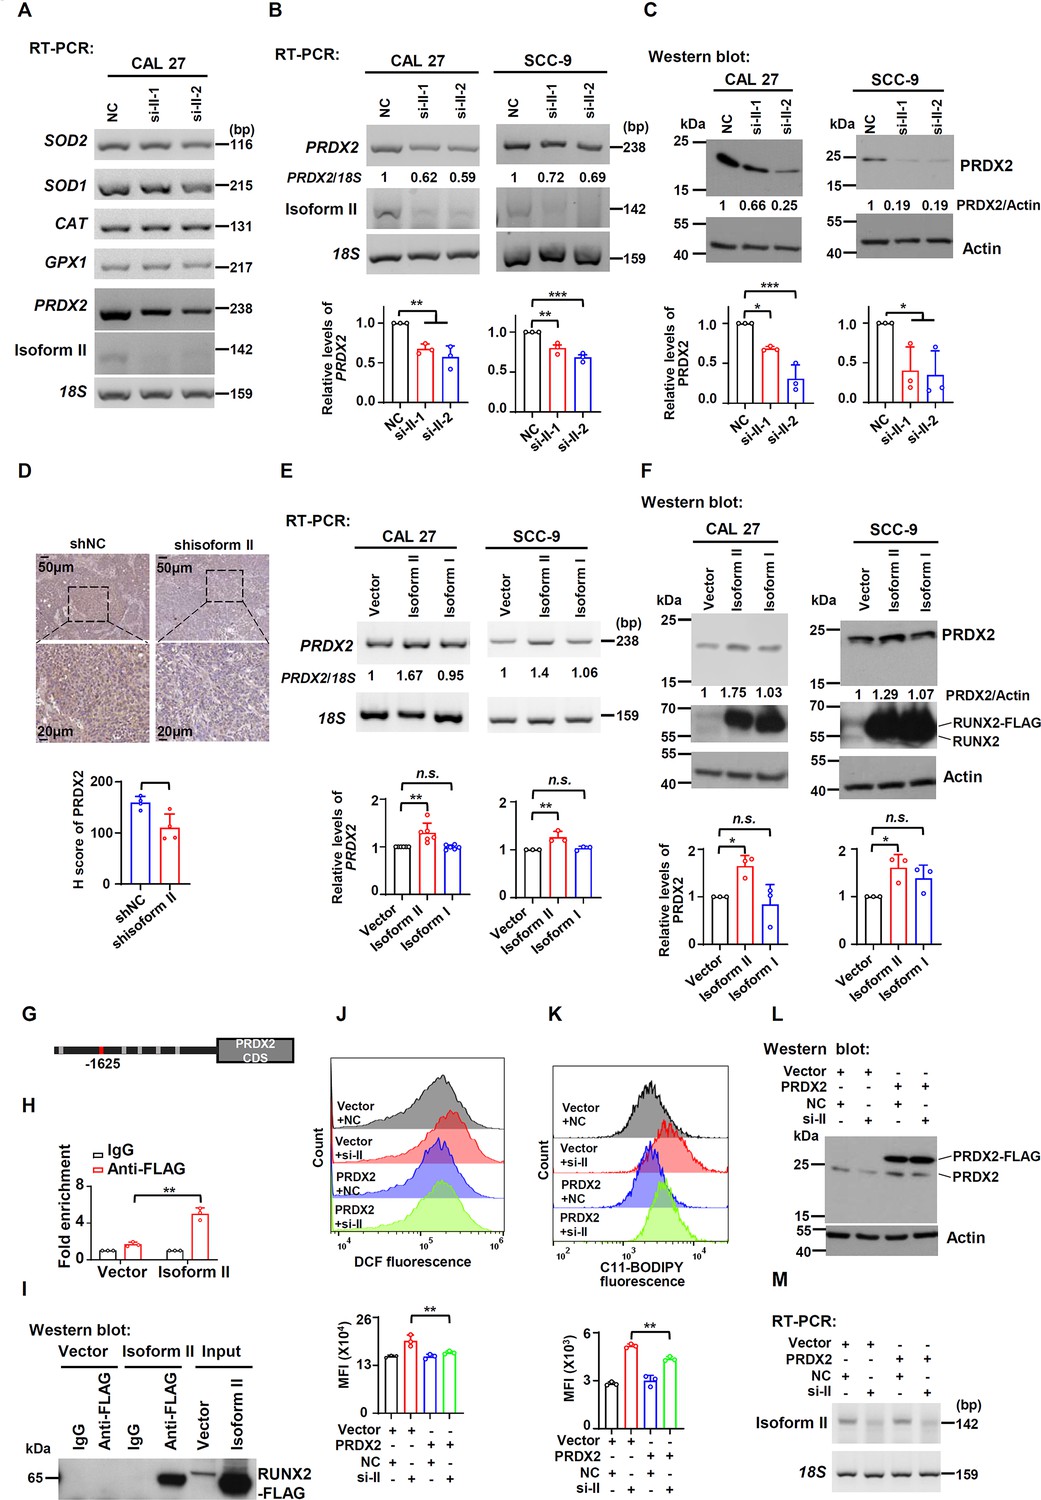
RUNX2 isoform II promotes the expression of PRDX2.
(A) Screening analysis of the expression of enzymatic antioxidant genes upon isoform II-knockdown (si-II-1 and si-II-2) in CAL 27 cells via RT-PCR. (B, C) Effects of RUNX2 isoform II-knockdown on PRDX2 expression levels were analyzed by RT-PCR (B) or western blot (C) in CAL 27 or SCC-9. 18 S rRNA (B) or actin (C) served as loading controls. Data are means ± SD, n = 3. (D) Representative images of immunohistochemical staining of PRDX2 in tumors with or without isoform II-knockdown (shisoform II vs shNC) in Figure 2G. The histogram below summarized the expression levels of PRDX2 in tumors. (E, F) Effects of RUNX2 isoform II or isoform I overexpression on PRDX2 expression levels were analyzed by RT-PCR (E) or western blot (F) in CAL 27 or SCC-9. 18S rRNA (E) or actin (F) served as loading controls. Data are means ± SD, n = 6 or 3 for CAL 27, n = 3 for SCC-9. (G) RUNX2 binding motifs on PRDX2 promoter were obtained from JASPAR. (H) Chromatin immunoprecipitation and quantitative PCR (ChIP-qPCR) assay was performed in CAL 27 with or without FLAG-tagged RUNX2 isoform II overexpression (isoform II vs vector) by using anti-FLAG or control IgG antibody. Data are means ± SD, n = 3. (I) The immunoprecipitated protein levels of FLAG-tagged RUNX2 isoform II in the ChIP assays were determined by western blot. (J–M) CAL 27 cells were co-transfected with PRDX2-expression, empty control lentivirus, and anti-isoform II siRNA (si-II), negative control siRNA (NC). Transfected cells were divided into four groups: Vector + NC, Vector + si-II, PRDX2 + NC and PRDX2 + si-II. (J, K) The total reactive oxygen species (ROS) levels (J) or lipid peroxidation (K) of transfected cells were detected with DCFH-DA (J) or BODIPY 581/591 reagent (K) by flow cytometry. The histograms below summarized the levels of mean fluorescent intensity (MFI). Data are means ± SD, n = 3. (L) Overexpression of PRDX2 was confirmed by western blot. Actin served as a loading control. (M) Knockdown efficiency of isoform II was analyzed by RT-PCR. 18S rRNA served as a loading control. *p<0.05, **p<0.01, ***p<0.001.
-
Figure 4—source data 1
Raw data files for Figure 4A-F and Figure 4H-M.
- https://cdn.elifesciences.org/articles/99122/elife-99122-fig4-data1-v2.zip
Figure 4—figure supplement 1
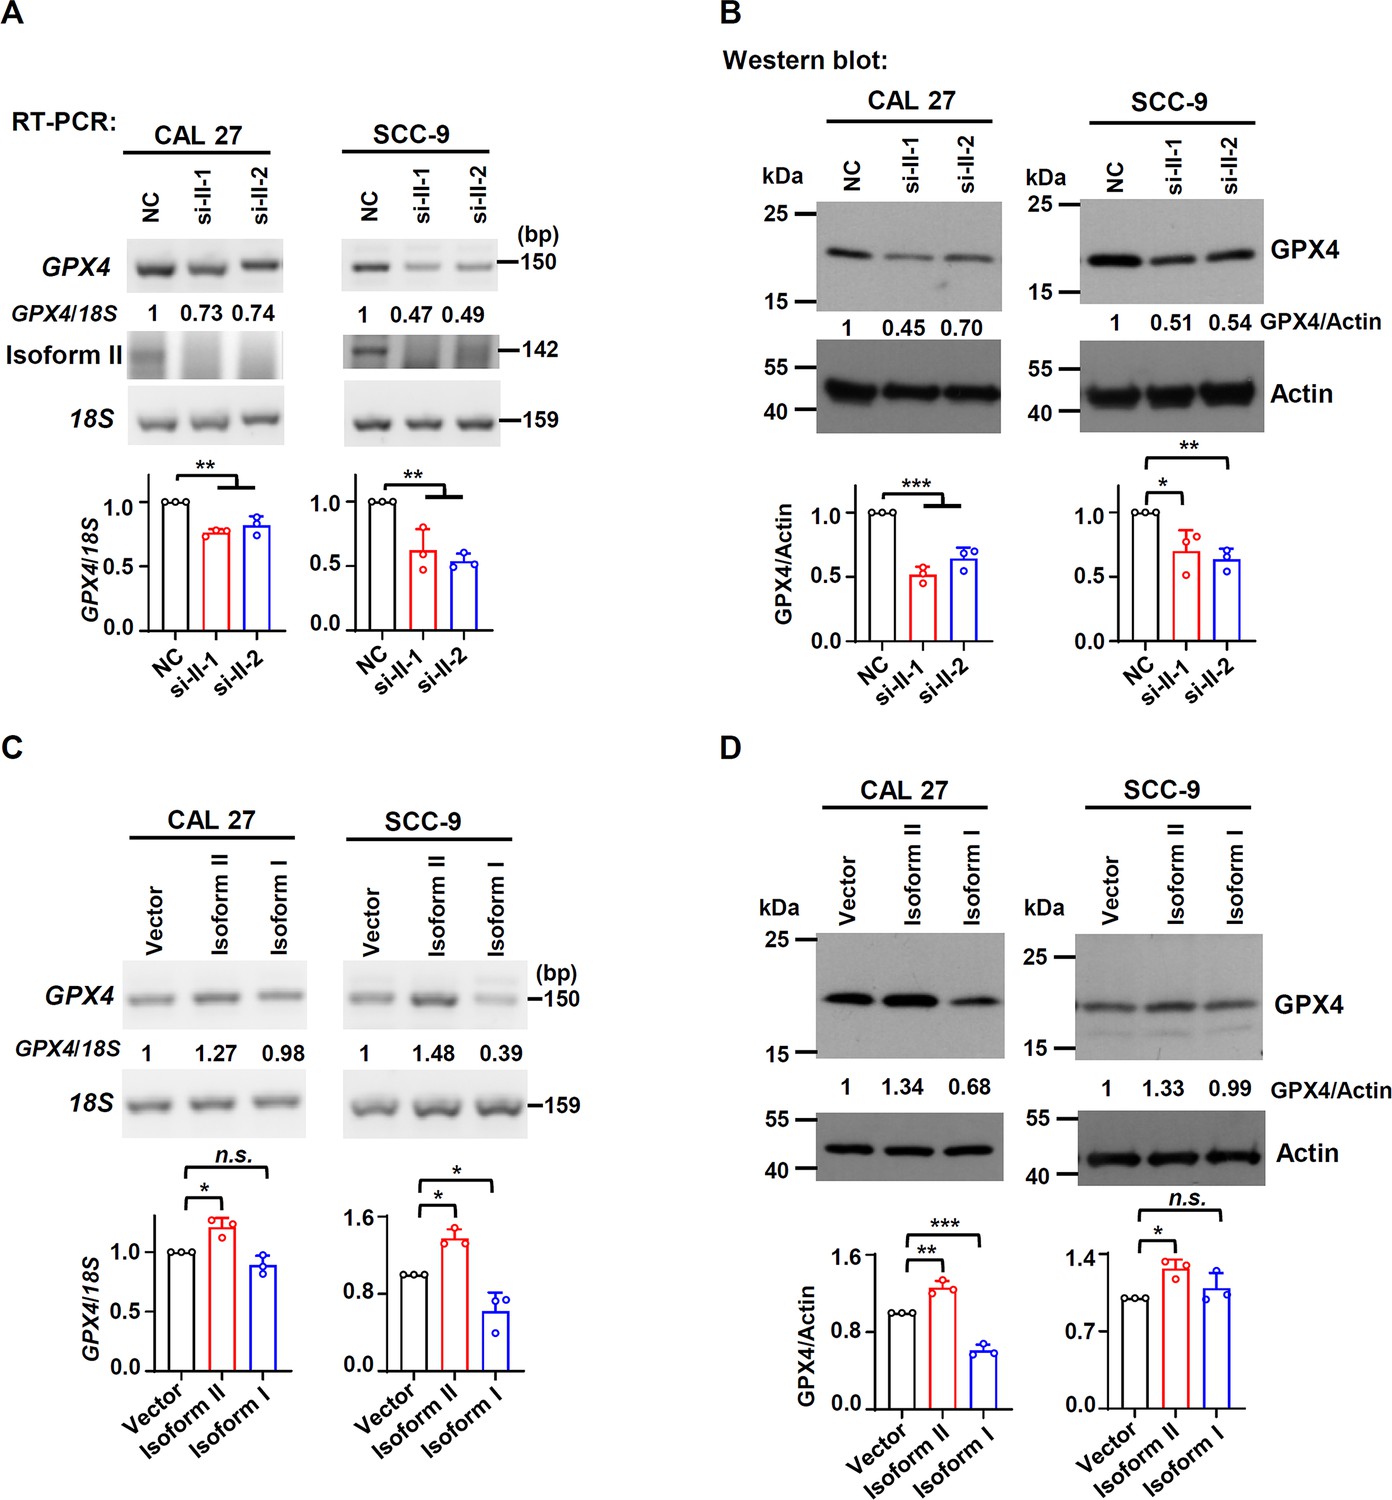
RUNX2 isoform II promotes the expression of GPX4 in oral squamous cell carcinoma (OSCC) cell lines.
(A, B) Effects of isoform II-knockdown (si-II-1 and si-II-2) on the expression levels of GPX4 were analyzed by RT-PCR (A) or western blot (B) in CAL 27 or SCC-9 cells. 18S rRNA (A) or actin (B) served as loading controls. Data are means ± SD, n = 3. (C, D) Effects of isoform II overexpression on the expression levels of GPX4 were analyzed by RT-PCR (C) or western blot (D) in CAL 27 or SCC-9 cells. 18S rRNA (A) or actin (B) served as loading controls. Data are means ± SD, n = 3. *p<0.05, **p<0.01, ***p<0.001.
-
Figure 4—figure supplement 1—source data 1
Raw data files for Figure 4—figure supplement 1A-D.
- https://cdn.elifesciences.org/articles/99122/elife-99122-fig4-figsupp1-data1-v2.zip
Figure 4—figure supplement 2
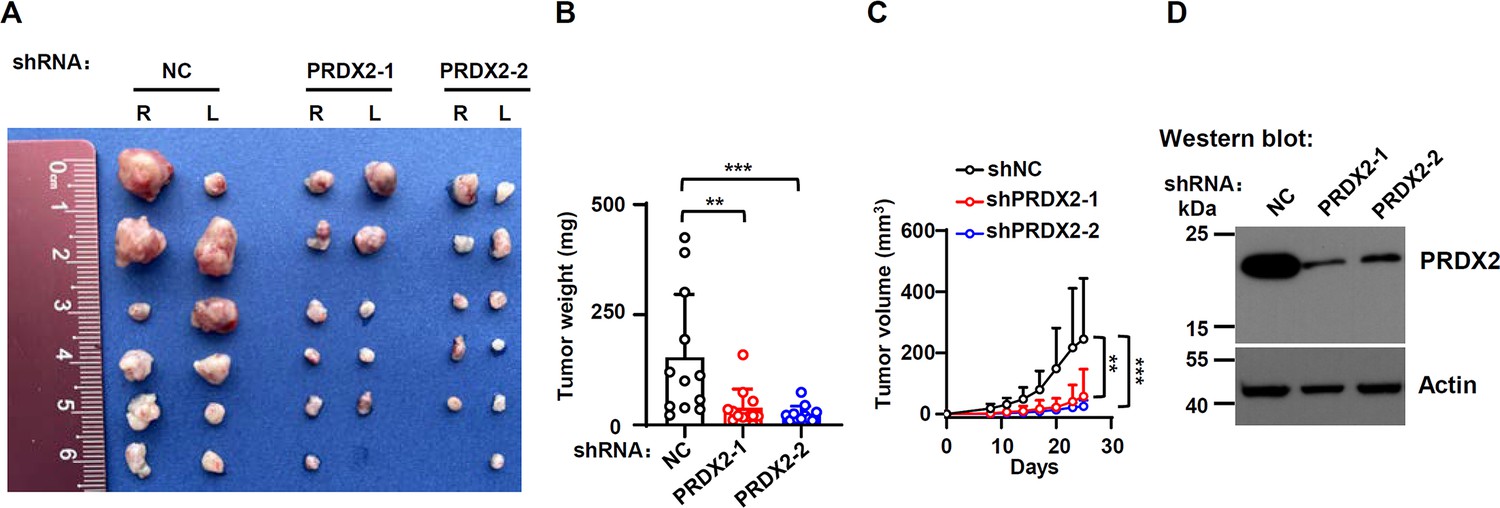
PRDX2-knockdown inhibits the tumor growth.
CAL 27 cells with stable PRDX2 shRNAs (shPRDX2-1 and shPRDX2-2) or nonspecific shRNA (shNC) were injected into both sides of the dorsum of BALB/c nude mice. (A, B) Tumors were dissected out and weighed on day 25. (C) Tumor volumes were measured on different days. (D) Knockdown efficiency of PRDX2 was analyzed by western blot. Actin served as a loading control. **p<0.01, ***p<0.001.
-
Figure 4—figure supplement 2—source data 1
Raw data files for Figure 4—figure supplement 2B and D.
- https://cdn.elifesciences.org/articles/99122/elife-99122-fig4-figsupp2-data1-v2.zip
Figure 4—figure supplement 3
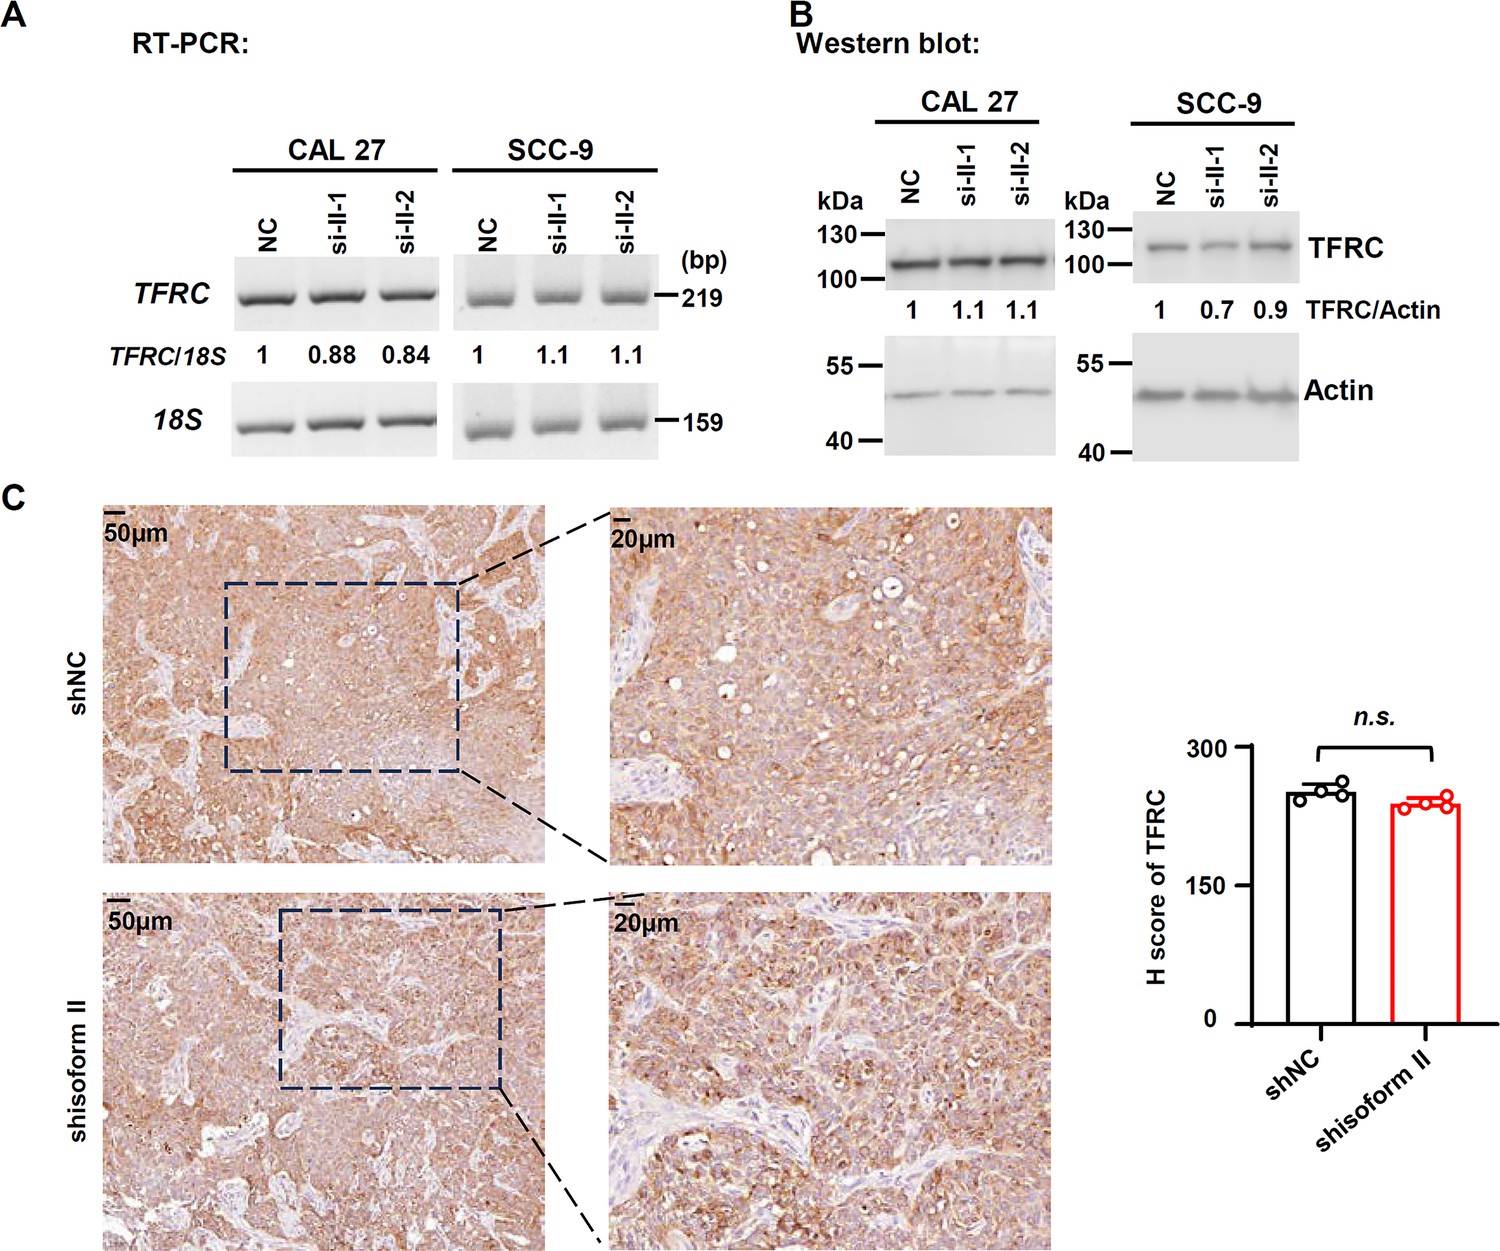
RUNX2 isoform II has no effect on TFRC expression levels and localization in oral squamous cell carcinoma (OSCC) cells.
(A, B) Effects of isoform II-knockdown (si-II-1 and si-II-2) on the expression levels of TFRC were analyzed by RT-PCR (A) or western blot (B) in CAL 27 or SCC-9 cells. 18S rRNA (A) or actin (B) served as loading controls. (C) The representative images of immunohistochemical staining of TFRC in tumors with or without isoform II-knockdown (shisoform II vs shNC) in Figure 2G. The histogram on the right summarized the H score of TFRC staining. Data are means ± SD, n = 4.
-
Figure 4—figure supplement 3—source data 1
Raw data files for Figure 4—figure supplement 3A-C.
- https://cdn.elifesciences.org/articles/99122/elife-99122-fig4-figsupp3-data1-v2.zip
Figure 4—figure supplement 4
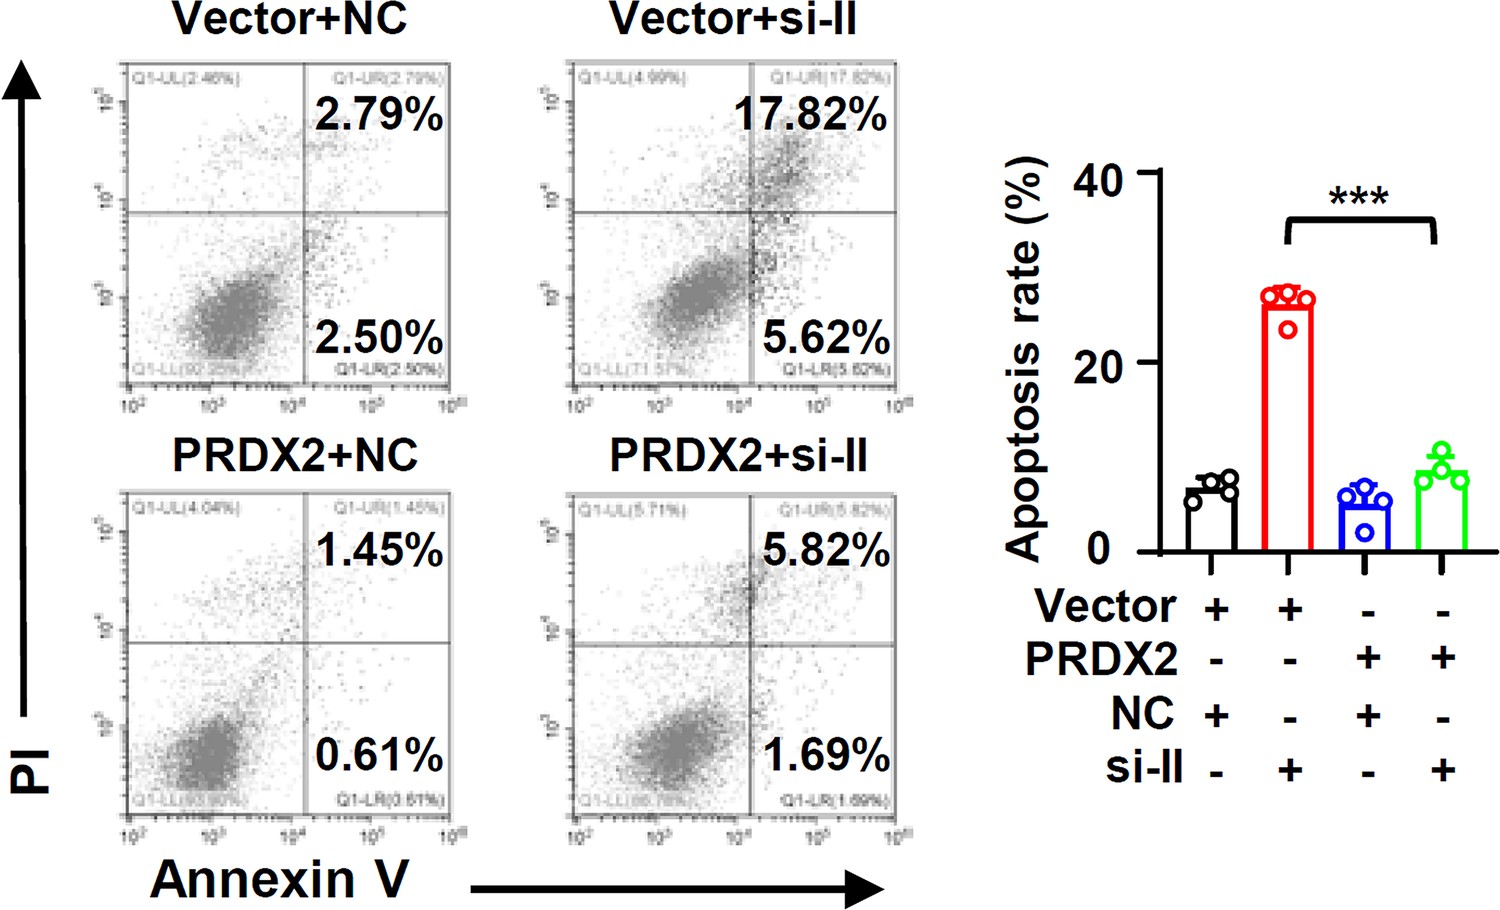
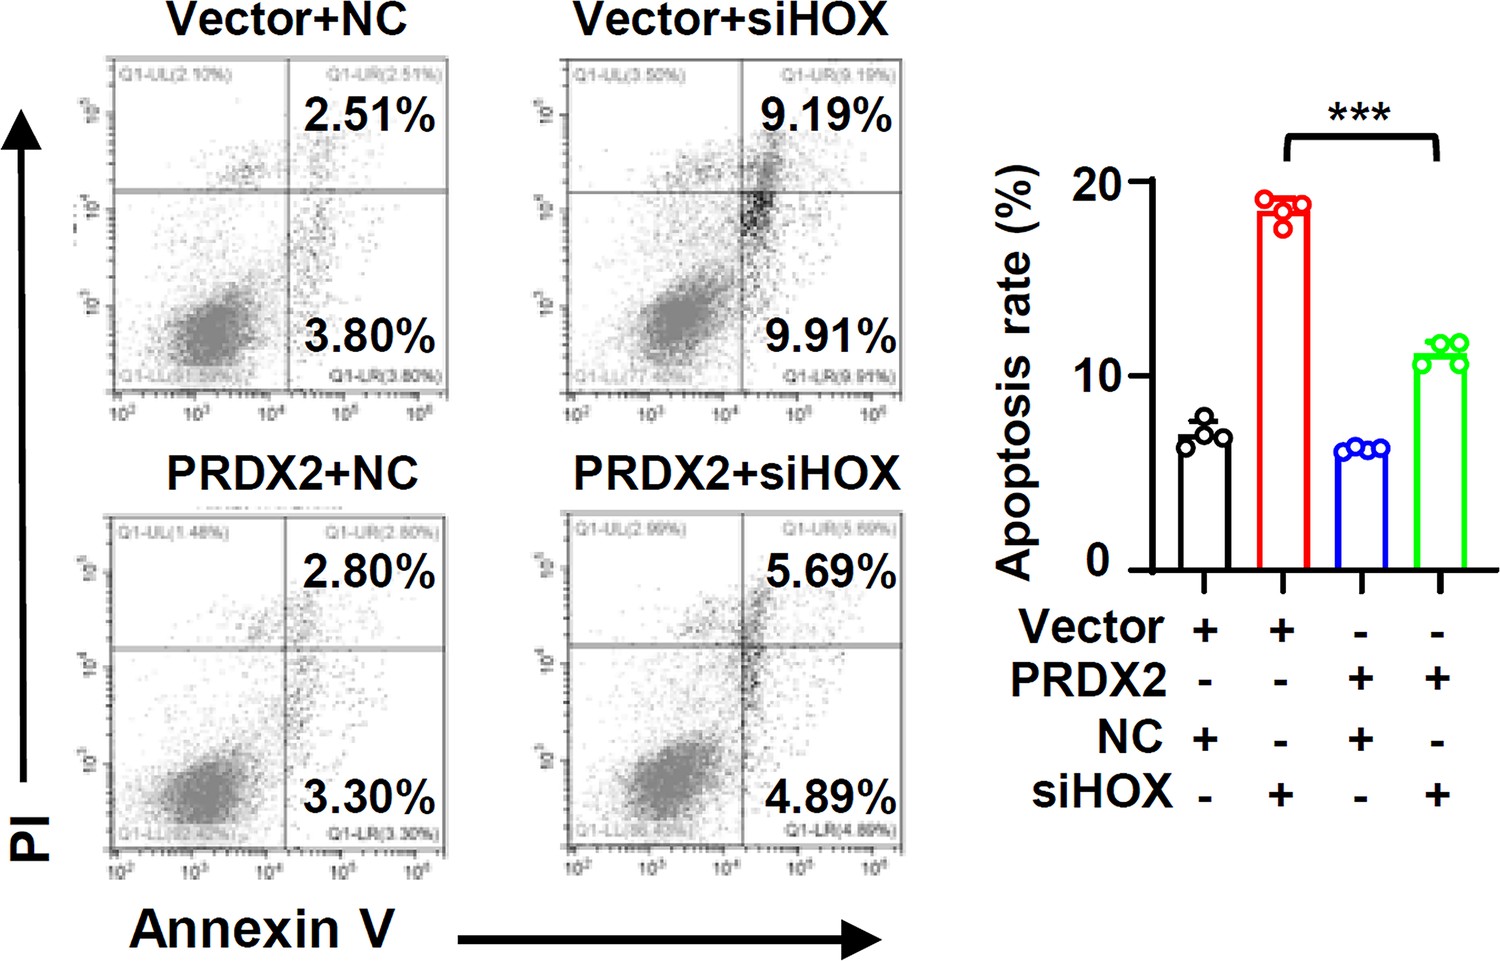
PRDX2 overexpression rescues the apoptosis induced by isoform II knockdown.
CAL 27 cells were co-transfected with PRDX2-expression lentivirus, empty control lentivirus, and isoform II siRNA (si-II), negative control siRNA (NC). Transfected cells were divided into four groups: Vector + NC, Vector + si-II, PRDX2 + NC and PRDX2 + si-II. The apoptosis of transfected cells were analyzed by flow cytometry. The histogram on the right summarized the apoptosis. Data are means ± SD, n = 4. ***p<0.001.
-
Figure 4—figure supplement 4—source data 1
Raw data file for Figure 4—figure supplement 4.
- https://cdn.elifesciences.org/articles/99122/elife-99122-fig4-figsupp4-data1-v2.zip
Figure 5 with 2 supplements
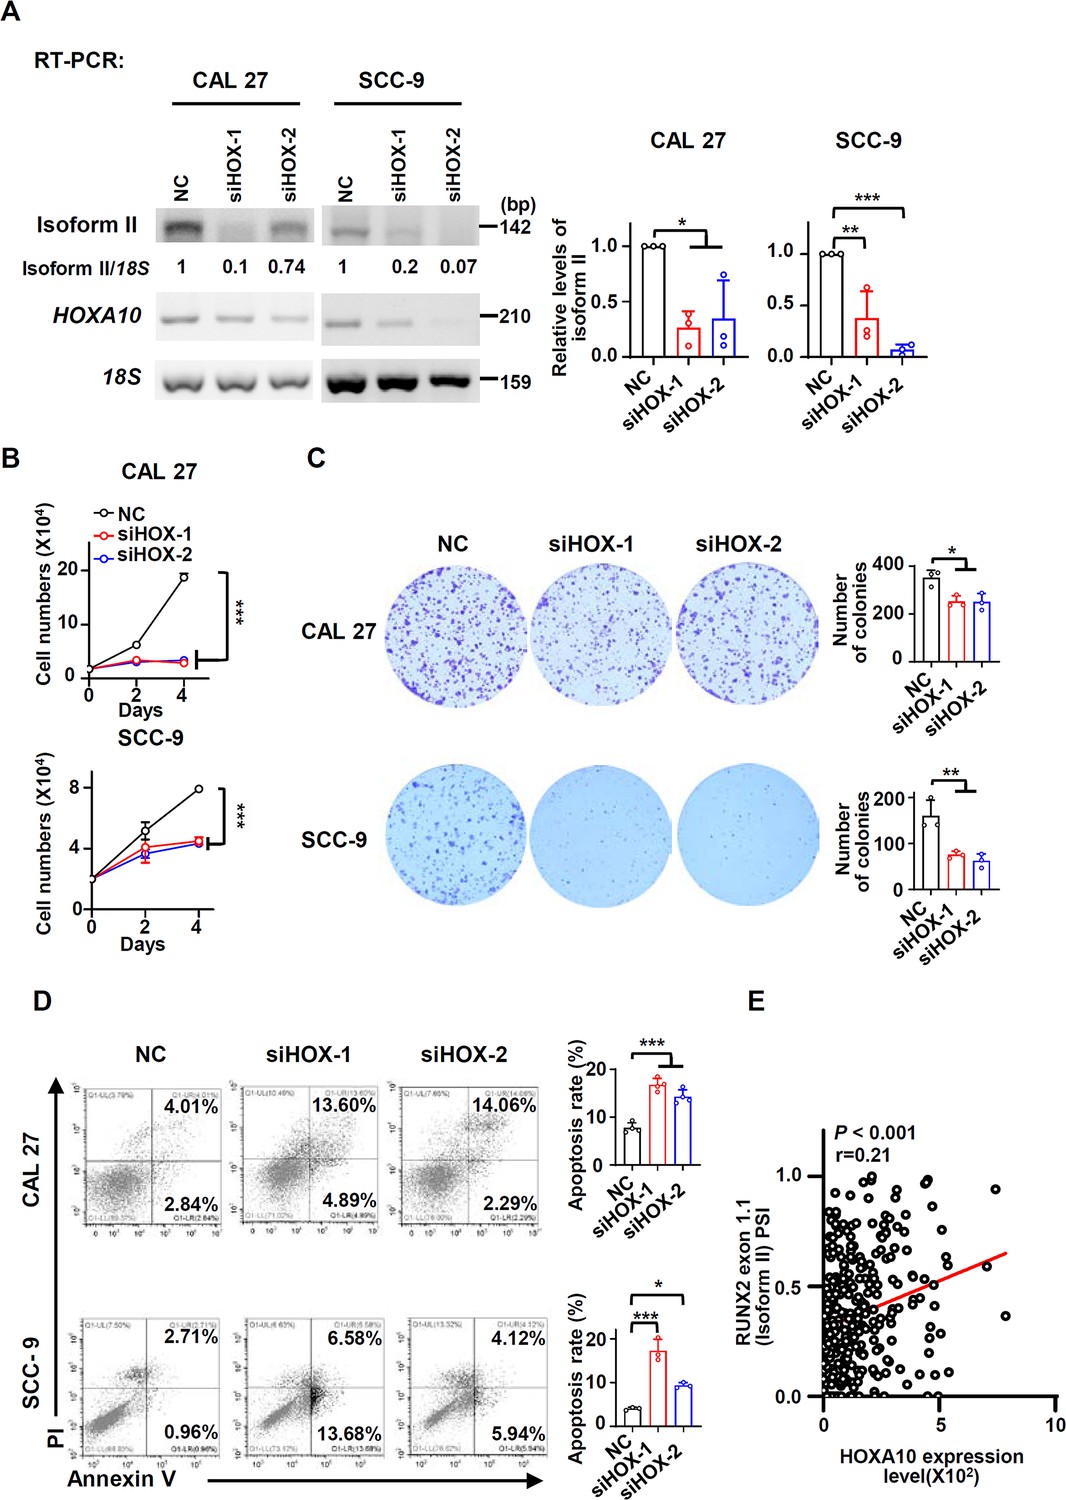
HOXA10 is required for RUNX2 isoform II expression and cell proliferation in oral squamous cell carcinoma (OSCC).
(A) Effects of HOXA10 knockdown (siHOX-1 and siHOX-2) on isoform II expression levels were analyzed by RT-PCR in CAL 27 or SCC-9. 18S rRNA served as a loading control. Data are means ± SD, n = 3. (B–D) CAL 27 or SCC-9 cells were treated with siHOX-1, siHOX-2, or NC siRNA. (B) Proliferation curves of CAL 27 or SCC-9 cells treated with HOXA10 siRNAs or NC siRNA. Data are means ± SD, n = 3. (C) Effects of HOXA10 knockdown on the clonogenic ability in CAL 27 and SCC-9. The histograms on the right summarized the numbers of colonies (at least 50 cells/colony). Data are means ± SD, n = 3. (D) The cellular apoptosis was analyzed by flow cytometry. The histograms on the right summarized the cellular apoptosis. Data are means ± SD, n = 4 for CAL 27, n = 3 for SCC-9. (E) The expression of HOXA10 in TCGA OSCC patients (288 cases) is positively correlated with RUNX2 exon 1.1 (isoform II) PSI (Spearman’s rank correlation coefficient, r = 0.21, p<0.001). *p<0.05, **p<0.01, ***p<0.001.
-
Figure 5—source data 1
Raw data files for Figure 5A, C and D.
- https://cdn.elifesciences.org/articles/99122/elife-99122-fig5-data1-v2.zip
Figure 5—figure supplement 1
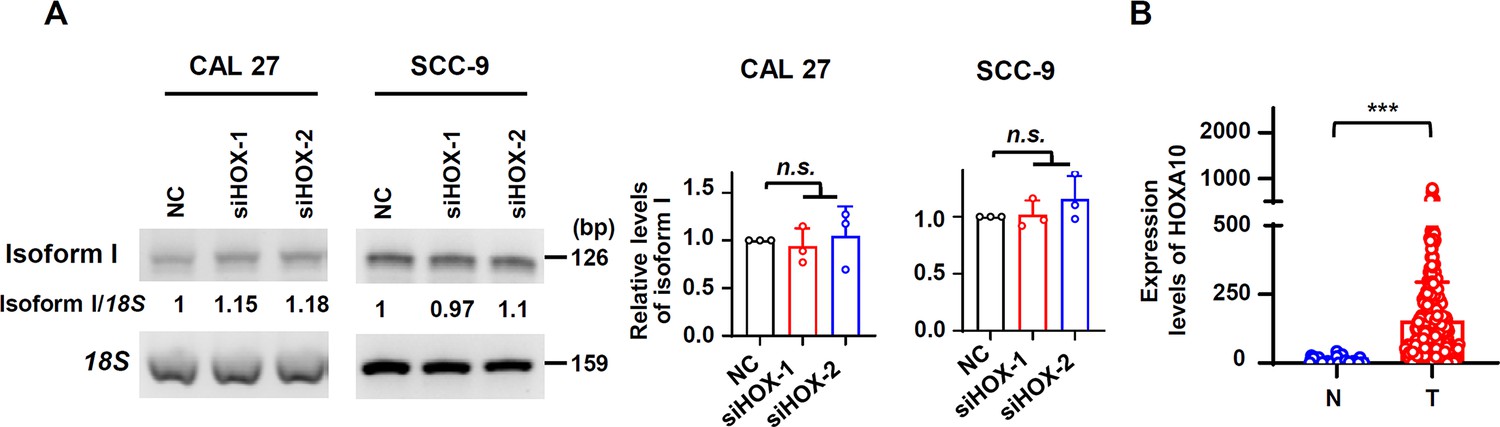
HOXA10 does not affect the expression of isoform I.
(A) Effects of HOXA10 knockdown (siHOX-1 and siHOX-2) on the isoform I expression in CAL 27 or SCC-9 were analyzed by RT-PCR. 18S rRNA served as a loading control. Data are means ± SD, n = 3. (B) The expression levels of HOXA10 in normal tissues (32 cases) or in oral squamous cell carcinoma (OSCC) tissues (309 cases) from TCGA. ***p<0.001.
-
Figure 5—figure supplement 1—source data 1
Raw data files for Figure 5—figure supplement 1A and B.
- https://cdn.elifesciences.org/articles/99122/elife-99122-fig5-figsupp1-data1-v2.zip
Figure 5—figure supplement 2
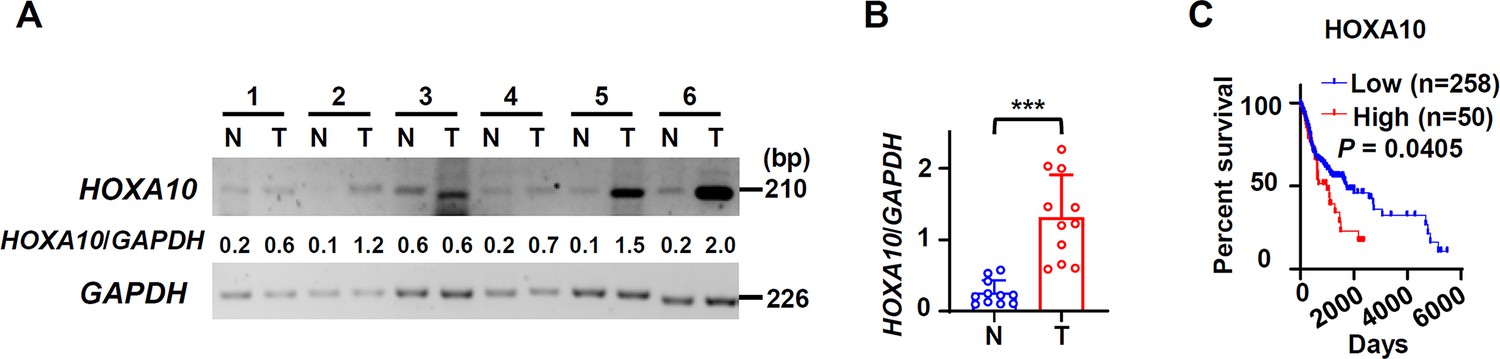
HOXA10 is overexpressed in oral squamous cell carcinoma (OSCC) and associated with poor overall survival.
(A) The representative RT-PCR results of HOXA10 in our OSCC or normal samples. GAPDH served as a loading control. (B) The scatter dot plot summarized the relative expression levels of HOXA10 (HOXA10/GAPDH) in our clinical OSCC (11 cases) and normal samples (11 cases). (C) OSCC TCGA patients (total 308 cases with survival data) with low expression (258 cases) or high expression (50 cases) of HOXA10 in OSCC. Low relative expression of HOX10 was defined as less than mean + 0.917 SD.
-
Figure 5—figure supplement 2—source data 1
Raw data files for Figure 5—figure supplement 2A and B.
- https://cdn.elifesciences.org/articles/99122/elife-99122-fig5-figsupp2-data1-v2.zip
Figure 6 with 4 supplements
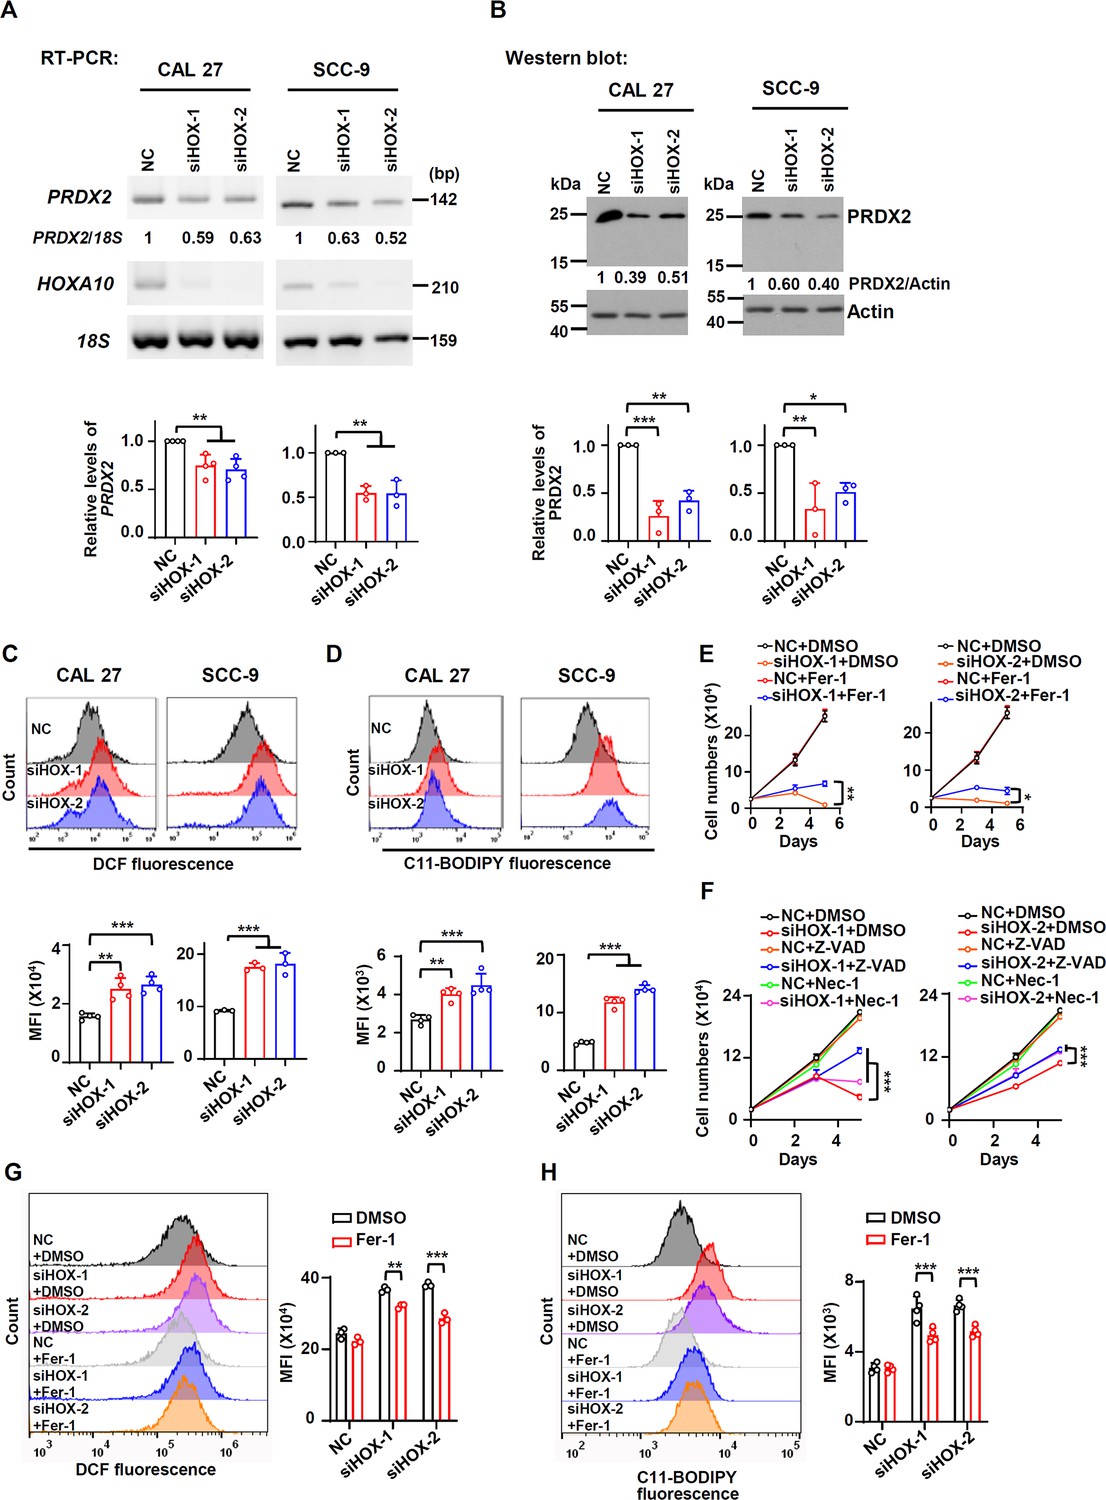
HOXA10 promotes the expression of PRDX2 and inhibits ferroptosis in oral squamous cell carcinoma (OSCC).
(A, B) Effects of HOXA10 knockdown (siHOX-1 and siHOX-2) on PRDX2 expression levels were analyzed by RT-PCR (A) or western blot (B) in CAL 27 or SCC-9. 18S rRNA (A) or actin (B) served as loading controls. Data are means ± SD, n = 4 or 3 for CAL 27, n = 3 for SCC-9. (C, D) Effects of HOXA10 knockdown on ROS levels (C) or lipid peroxidation (D) were detected with DCFH-DA (C) or BODIPY 581/591 reagent (D) by flow cytometry in CAL 27 or SCC-9. The histograms below summarized the levels of MFI. Data are means ± SD, n = 4 for CAL 27, n = 3 or 4 for SCC-9. (E) CAL 27 cells transfected with anti-HOXA10 siRNAs were also treated with Fer-1 (10 μM), a ferroptosis inhibitor. Negative control siRNA and DMSO were used as controls. Cells were divided into six groups: NC + DMSO, siHOX-1 + DMSO, siHOX-2 + DMSO, NC + Fer-1, siHOX-1 + Fer-1, and siHOX-2 + Fer-1. To display clear diagrams, the proliferation curves of siHOX-1-treated cells or siHOX-2-treated cells were shown separately. Data are means ± SD, n = 3. (F) CAL 27 cells transfected with anti-HOXA10 siRNAs were also treated with Z-VAD (20 μM, an apoptosis inhibitor) or Nec-1 (20 μM, a necroptosis inhibitor). Negative control siRNA and DMSO were used as controls. Cells were divided into nine groups: NC + DMSO, siHOX-1 + DMSO, siHOX-2 + DMSO, NC + Z-VAD, siHOX-1 + Z-VAD, siHOX-2 + Z-VAD, NC + Nec-1, siHOX-1 + Nec-1, and siHOX-2 + Nec-1. To display clear diagrams, the proliferation curves of siHOX-1-transfected cells or siHOX-2-transfected cells were shown separately. Data are means ± SD, n = 3. (G, H) The total ROS levels (G) or lipid peroxidation (H) of cells simultaneously transfected with anti-HOXA10 siRNAs or NC and treated with Fer-1 or DMSO were detected with DCFH-DA (G) or BODIPY 581/591 reagent (H) by flow cytometry. The histogram on the right summarized the levels of mean fluorescent intensity (MFI). Data are means ± SD, n = 3 for (G), n = 4 for (H). *p<0.05, **p<0.01, ***p<0.001.
-
Figure 6—source data 1
Raw data files for Figure 6A-D and Figure 6G-H.
- https://cdn.elifesciences.org/articles/99122/elife-99122-fig6-data1-v2.zip
Figure 6—figure supplement 1
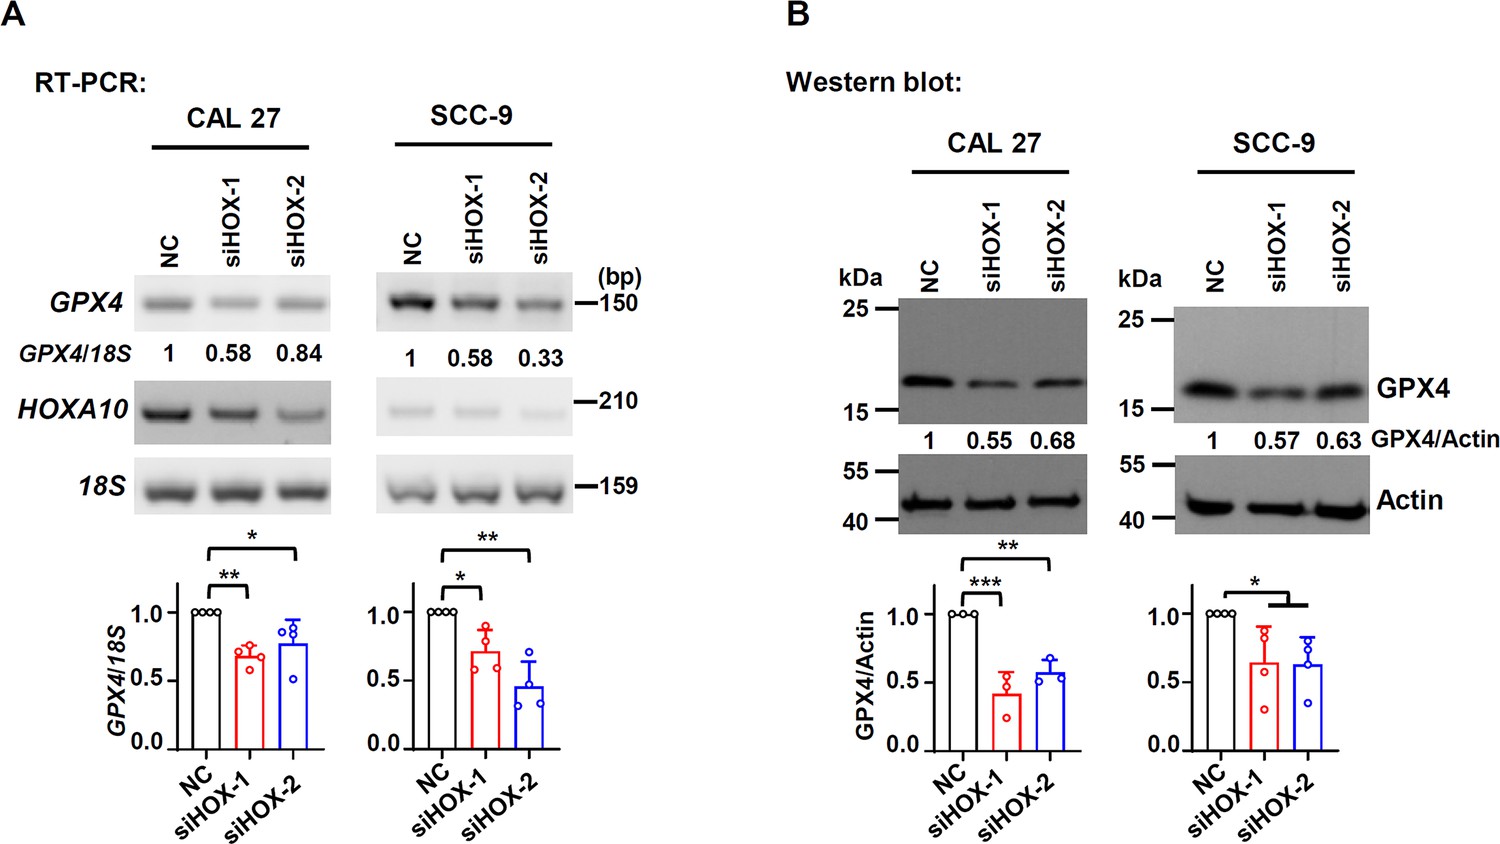
HOXA10-knockdown inhibits GPX4 expression.
(A, B) Effects of HOXA10-knockdown on GPX4 expression levels were analyzed by RT-PCR (A) or western blot (B) in CAL 27 or SCC-9. 18S rRNA (A) or actin (B) served as loading controls. Data are means ± SD, n = 3 for RT-PCR, n = 4 for western blot. *p<0.05, **p<0.01, ***p<0.001.
-
Figure 6—figure supplement 1—source data 1
Raw data files for Figure 6—figure supplement 1A and B.
- https://cdn.elifesciences.org/articles/99122/elife-99122-fig6-figsupp1-data1-v2.zip
Figure 6—figure supplement 2
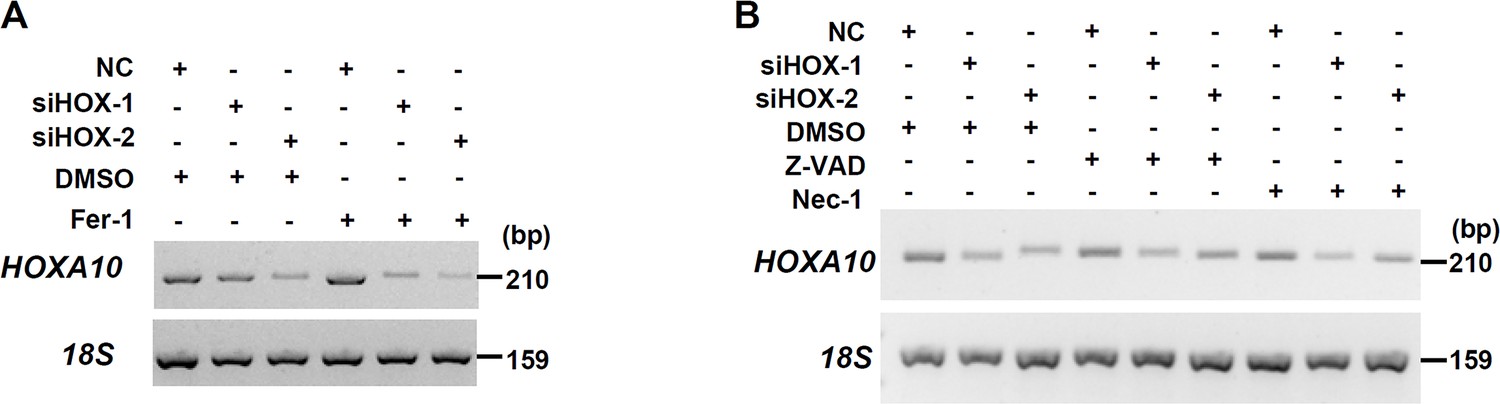
Validation of HOXA10 knockdown in Figure 6.
(A) Knockdown efficiency of HOXA10 in Fer-1 (a ferroptosis inhibitor) treated cells was analyzed by RT-PCR. 18S rRNA served as a control. (B) Knockdown efficiency of HOXA10 (siHOX-1 and siHOX-2) in Z-VAD (an apoptosis inhibitor) or Nec-1(a necroptosis inhibitor) treated cells was analyzed by RT-PCR. 18S rRNA served as a control.
-
Figure 6—figure supplement 2—source data 1
Raw data files for Figure 6—figure supplement 2A and B.
- https://cdn.elifesciences.org/articles/99122/elife-99122-fig6-figsupp2-data1-v2.zip
Figure 6—figure supplement 3
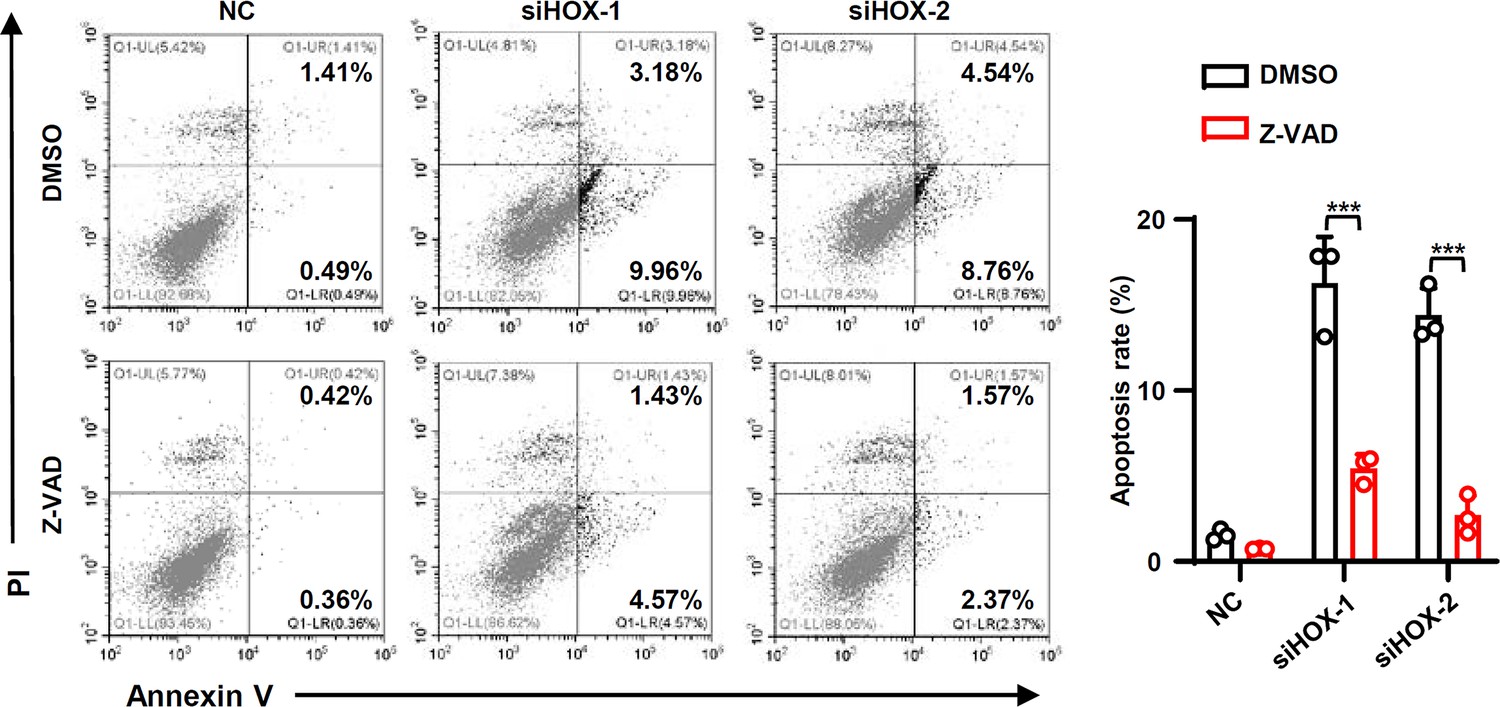
The increased apoptosis rates caused by HOXA10 knockdown could be rescued by apoptosis inhibitor Z-VAD.
The cellular apoptosis of CAL 27 simultaneously transfected with anti-HOXA10 siRNAs or NC and treated with Z-VAD or DMSO were detected by flow cytometry. The histogram on the right summarized he cellular apoptosis. Data are means ± SD, n = 3. ***p<0.001.
-
Figure 6—figure supplement 3—source data 1
Raw data file for Figure 6—figure supplement 3.
- https://cdn.elifesciences.org/articles/99122/elife-99122-fig6-figsupp3-data1-v2.zip
Figure 6—figure supplement 4
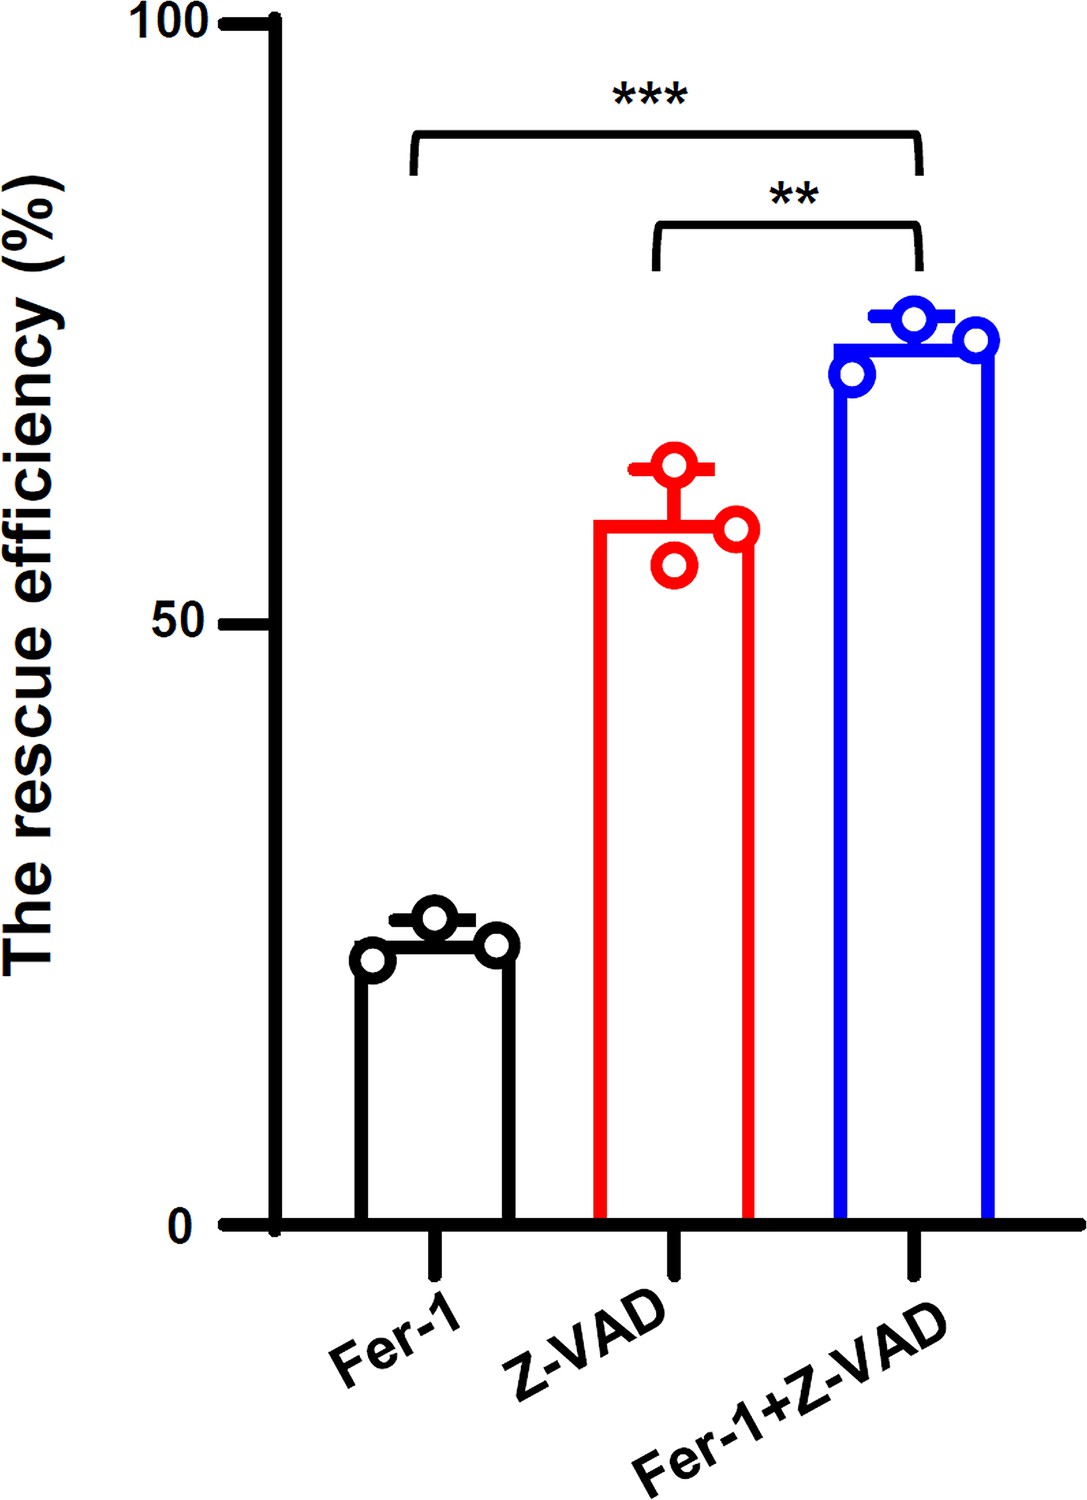
The combination of Fer-1 and Z-VAD partially rescues the deduced cell proliferation caused by HOXA10 knockdown.
CAL 27 cells transfected with anti-isoform II siRNA (si-HOX) were also treated with DMSO, Fer-1, and Z-VAD. We analyzed the rescue efficiency of Fer-1 and Z-VAD alone or the combination of Fer-1 and Z-VAD in cell proliferation. The rescue efficiency of cells = (number of cells in inhibitor-treated and HOXA10-knockdown group/number of cells in inhibitor-treated and NC group – number of cells in DMSO-treated and HOXA10-knockdown group/number of cells in DMSO-treated and NC group)/1 – (number of cells in DMSO-treated and HOXA10-knockdown group/number of cells in DMSO-treated and NC group). Data are means ± SD, n = 3. * p<0.05. ***p<0.001.
-
Figure 6—figure supplement 4—source data 1
Raw data file for Figure 6—figure supplement 4.
- https://cdn.elifesciences.org/articles/99122/elife-99122-fig6-figsupp4-data1-v2.zip
Figure 7 with 2 supplements
Ferroptosis and apoptosis induced by HOXA10-knockdown can be rescued by isoform II overexpression or PRDX2 overexpression.
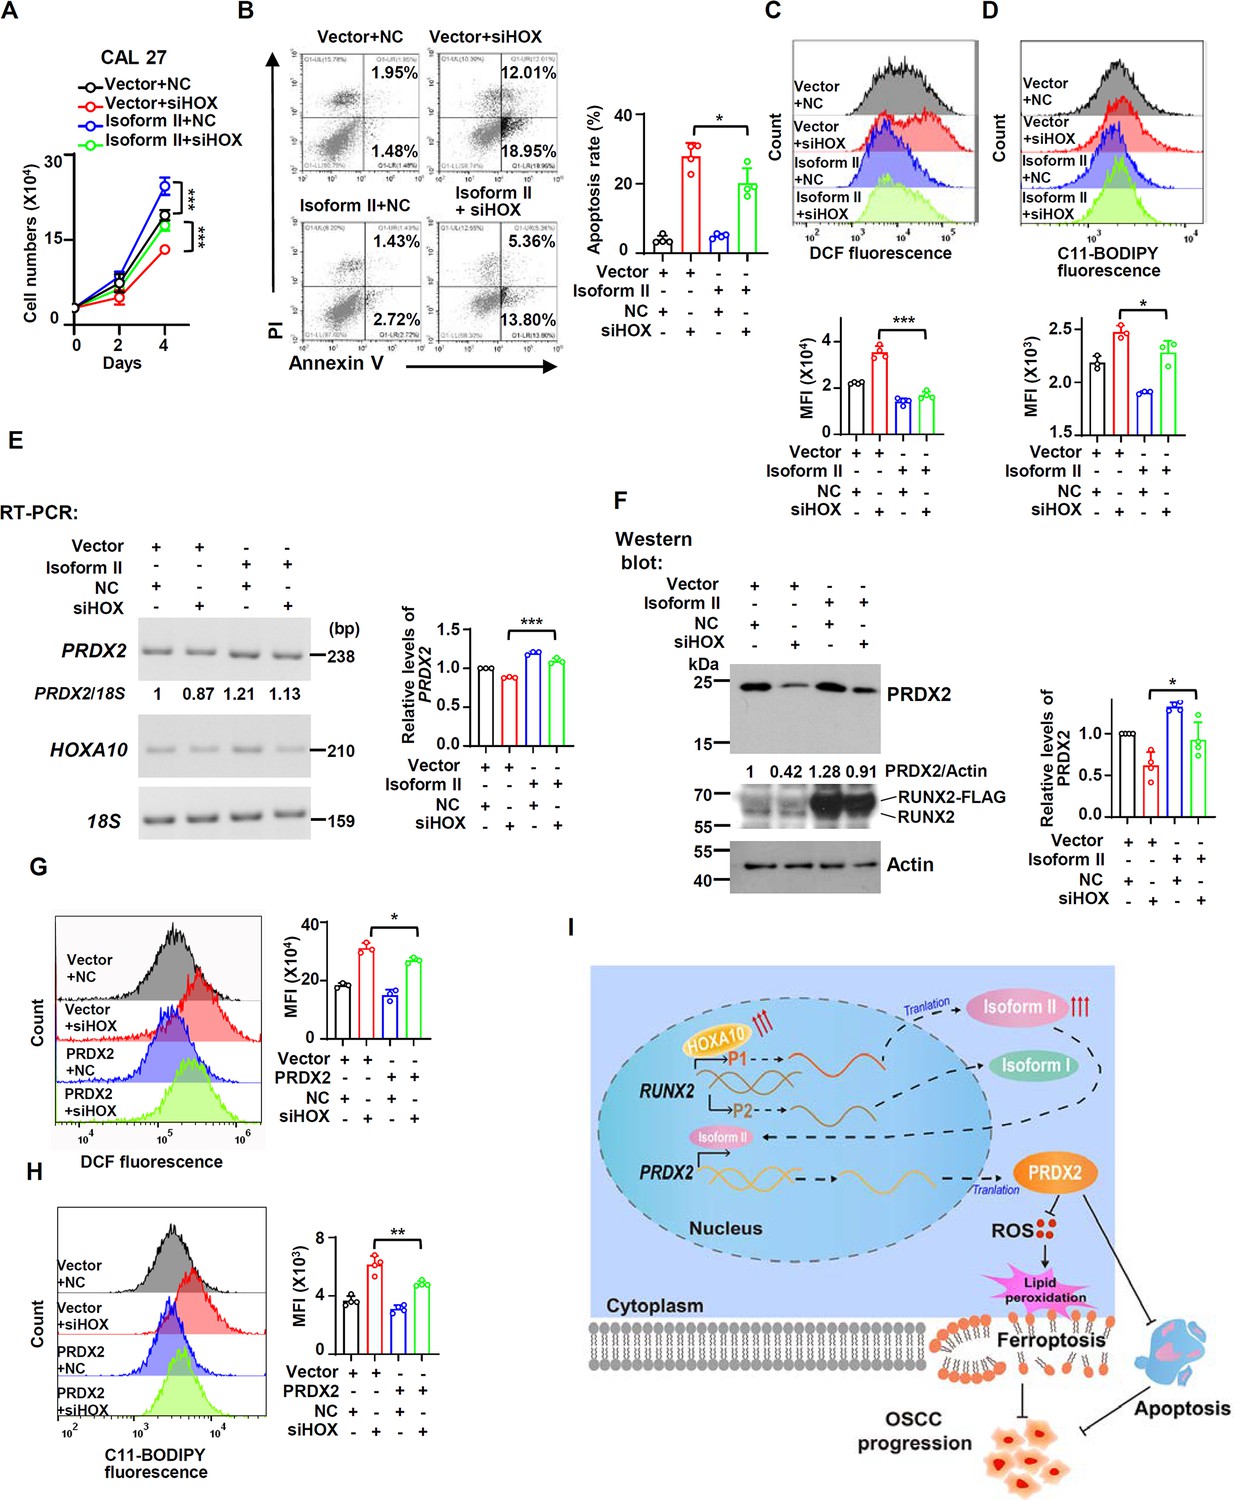
(A–F) CAL 27 cells were co-transfected with isoform II-expression lentivirus, empty control lentivirus, and HOXA10 siRNA (siHOX), negative control siRNA (NC). Transfected cells were divided into four groups: Vector + NC, Vector + siHOX, Isoform II + NC, and Isoform II + siHOX. (A) Cell number was counted on days 2 and 4. Data are means ± SD, n = 5. (B) The cellular apoptosis of transfected cells was analyzed by flow cytometry. The histogram on the right summarized the cell apoptosis. Data are means ± SD, n = 4. (C, D) The total reactive oxygen species (ROS) levels (C) or lipid peroxidation (D) of transfected cells were detected with DCFH-DA (C) or BODIPY 581/591 reagent (D) by flow cytometry. The histograms below summarized the levels of mean fluorescent intensity (MFI). Data are means ± SD, n = 4 or 3. (E, F) Effect of HOXA10-knockdown in isoform II-overexpressed cells on PRDX2 expression levels was analyzed by RT-PCR (E) or western blot (F). 18S rRNA (E) or actin (F) served as loading controls. Data are means ± SD, n = 3 or 4. (G, H) CAL 27 cells were co-transfected with PRDX2-expression lentivirus, empty control lentivirus, and siHOX, NC. Transfected cells were divided into four groups: Vector + NC, Vector + siHOX, PRDX2 + NC, and PRDX2 + siHOX. The total ROS levels (G) or lipid peroxidation (H) of transfected cells were detected with DCFH-DA (G) or BODIPY 581/591 reagent (H) by flow cytometry. The histograms on the right summarized the levels of MFI. Data are means ± SD, n = 3. (I) The model of a new ferroptosis-related or apoptosis-related pathway-HOXA10/RUNX2 isoform II/PRDX2 in this study. *p<0.05, **p<0.01, ***p<0.001.
-
Figure 7—source data 1
Raw data files for Figure 7B-H.
- https://cdn.elifesciences.org/articles/99122/elife-99122-fig7-data1-v2.zip
Figure 7—figure supplement 1
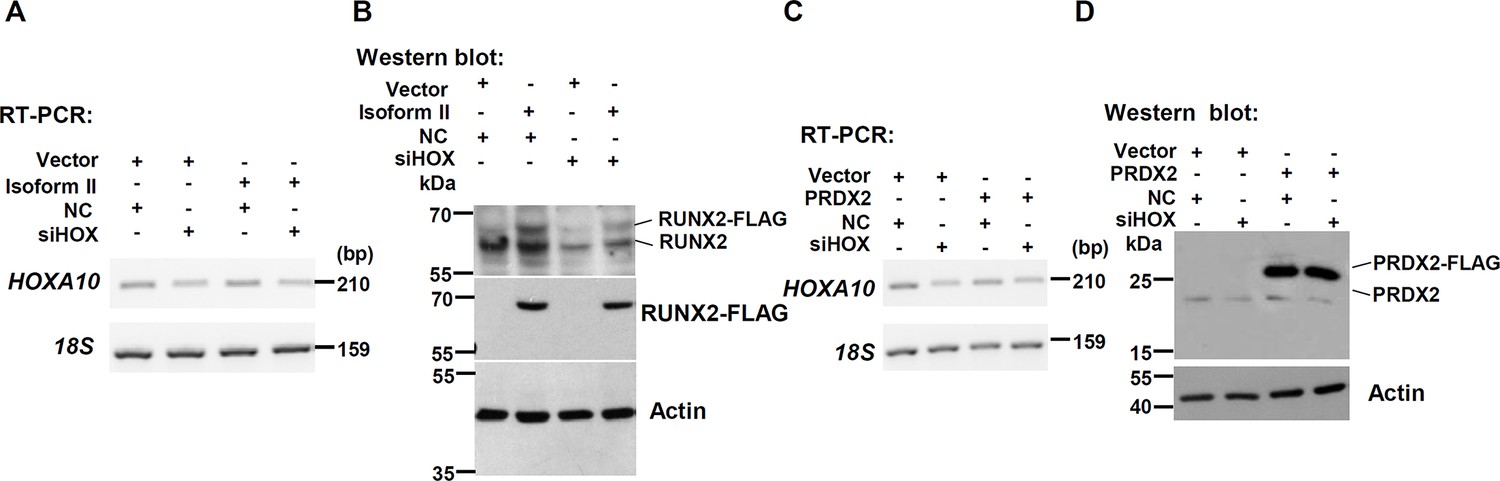
Validation of expression levels of HOXA10, RUNX2 isoform II, and PRDX2 in Figure 7.
(A) Knockdown efficiency of HOXA10 (anti-HOXA10 siRNA, siHOX) was analyzed by RT-PCR in isoform II-overexpressing CAL 27 cells. 18S rRNA served as a loading control. (B) Overexpression of RUNX2 isoform II was confirmed by western blot. Actin served as a loading control. (C) Knockdown efficiency of HOXA10 was analyzed by RT-PCR in PRDX2-overexpressing CAL 27 cells. 18S rRNA served as a loading control. (D) Overexpression of PRDX2 was confirmed by western blot. Actin served as a loading control.
-
Figure 7—figure supplement 1—source data 1
Raw data files for Figure 7—figure supplement 1A-D.
- https://cdn.elifesciences.org/articles/99122/elife-99122-fig7-figsupp1-data1-v2.zip
Figure 7—figure supplement 2
PRDX2 overexpression rescues the apoptosis induced by isoform II knockdown.
CAL 27 cells were co-transfected with PRDX2-expression lentivirus, empty control lentivirus, and isoform II siRNA (si-II), negative control siRNA (NC). Transfected cells were divided into four groups: Vector + NC, Vector + si-II, PRDX2 + NC, and PRDX2 + si-II. The apoptosis of transfected cells were analyzed by flow cytometry. The histogram on the right summarized the apoptosis. Data are means ± SD, n = 4. ***p<0.001.
-
Figure 7—figure supplement 2—source data 1
Raw data file for Figure 7—figure supplement 2.
- https://cdn.elifesciences.org/articles/99122/elife-99122-fig7-figsupp2-data1-v2.zip
Author response image 1
The new electron microscopy images in RUNX2 isoform II-knockdown cells.
RSL3 (a ferroptosis activator) served as a positive control. Scale bar: 1 μm. The calculation and statistical analysis of mitochondrial elongation were added in Figure 3-figure supplement 2A.
Author response image 2
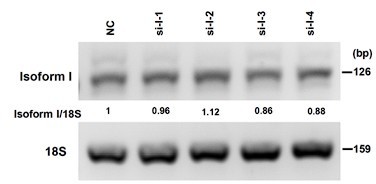
The knockdown efficiency of RUNX2 isoform I (anti-isoform I, si-I-1, si-I-2, si-I-3, si-I-4) in OSCC cells were analyzed by RT-PCR, 18S rRNA served as a loading control.
The sequences of siRNAs are as follows: 5’ GGCCACUUCGCUAACUUGU 3’ (si-I-1), 5’ GUUCCAAAGACUCCGGCAA 3’ (si-I-2), 5’ UGGCUGUUGUGAUGCGUAU 3’ (si-I-3), and 5’ CGGCAGUCGGCCUCAUCAA 3’ (si-I-4).
Tables
Key resources table
| Reagent type (species) or resource | Designation | Source or reference | Identifiers | Additional information |
|---|---|---|---|---|
| Strain, strain background (Mus musculus) | BALB/c nude mice | Vital River | Strain No.401 | |
| Cell line (human) | CAL 27 SCC-9 | Yang et al., 2018 (PMID:29857020) | ||
| Cell line (human) | HEK 293T | Procell | Cat#CL-0005 | |
| Transfected construct (human) | RUNX2 isoform II shRNAs (shisoform II-1 and shisoform II-2) | Vector Builder | Cat#VB221206-1024udv; VB221206-1021ujk | Lentiviral construct to transfect and express the shRNA |
| Transfected construct (human) | PRDX2 shRNAs (shPRDX-1 and shPRDX2-2) | Vector Builder | Cat#VB900064-6571eqq; VB900064-6578nnu | Lentiviral construct to transfect and express the shRNA |
| Transfected construct (human) | Negative control shRNA (shNC) | Vector Builder | Cat#VB010000-009mxc | |
| Transfected construct (human) | siRNAs to isoform II (si-II-1/si-II-2) | Sangon Biotech | Transfected construct (Human) | |
| Transfected construct (human) | siRNAs to HOXA10 (siHOX-1/siHOX-2) | GenePharma | Transfected construct (Human) | |
| Transfected construct (human) | siRNA to negative control (siNC) | Sangon Biotech | ||
| Biological sample (human) | Oral squamous cell carcinoma | Hospital of Stomatology, Wuhan University | The adjacent normal tissues were also acquired | |
| Antibody | Anti-human RUNX2 (mouse monoclonal) | Santa Cruz | Cat#SC-390351; RRID:AB_2892645 | WB (1:500) |
| Antibody | Anti-4-HNE (mouse monoclonal) | Abcam | Cat#ab48506; RRID:AB_867452 | IHC (1:600) |
| Antibody | Anti-TFRC (rabbit monoclonal) | Abcam | Cat#ab214039; RRID:AB_2904534 | WB (1:2000) IHC (1:500) |
| Antibody | Anti-human FLAG (rabbit polyclonal) | Proteintech | Cat#20543-1-AP; RRID:AB_11232216 | WB (1:2000) ChIP (2 μg) |
| Antibody | Anti-human/mouse PRDX2 (rabbit polyclonal) | Proteintech | Cat#10545-2-AP; RRID:AB_2168202 | WB (1:2000) IHC (1:1000) |
| Antibody | Anti-human actin (mouse monoclonal) | Proteintech | Cat#66009-1-lg; RRID:AB_2782959 | WB (1:5000) |
| Antibody | Anti-GPX4 (rabbit monoclonal) | ABclonal | Cat#A11243 RRID:AB_2861533 | WB (1:1000) |
| Recombinant DNA reagent | RUNX2 isoform II (plasmid) | This paper | FLAG-tagged isoform II | |
| Recombinant DNA reagent | RUNX2 isoform I (plasmid) | This paper | FLAG-tagged isoform I | |
| Recombinant DNA reagent | PRDX2 (plasmid) | This paper | FLAG-tagged PRDX2 | |
| Commercial assay or kit | Total RNA Miniprep Kit | Axygen | Cat#AP-MN-MS-RNA-250 | |
| Commercial assay or kit | Green Taq Mix | Vazyme | Cat#P131-AA | |
| Commercial assay or kit | Phanta Super-Fidelity DNA Polymerase | Vazyme | Cat#P505-d1 | |
| Commercial assay or kit | Maxima H Minus cDNA Synthesis Master Mix | Thermo Fisher Scientific | Cat#M1682 | |
| Commercial assay or kit | ChamQ Universal SYBR qPCR Master Mix | Vazyme | Cat#Q711-02 | |
| commercial assay or kit | Reactive Oxygen Species Assay Kit | Beyotime | Cat#S0033S | |
| Commercial assay or kit | BODIPY 581/591C11 | Thermo Fisher Scientific | Cat#D3861 | |
| Commercial assay or kit | Annexin V-FITC/PI apoptosis assay kit | KeyGEN BioTECH | Cat#KGA108 | |
| Commercial assay or kit | Sonication ChIP Kit | Abclonal | Cat#RK20258 | |
| Commercial assay or kit | Protein A/G beads | Abclonal | Cat#RM02915 | |
| Commercial assay or kit | Protease Inhibitor Cocktail | Abclonal | Cat#RM02916 | |
| Commercial assay or kit | EnVision FLEX TARGET RETRIEVAL SOLUTION HIGH pH | Dako | REF#K8023 | |
| Commercial assay or kit | EnVision FLEX PEROXIDASE-BLOCOING REAGENT | Dako | REF#GV800 | |
| Commercial assay or kit | EnVision FLEX/HRP | Dako | REF#K8023 | |
| Commercial assay or kit | Liquid DAB+ Substrate Chromogen System | Dako | REF#K3468 | |
| Commercial assay or kit | XF Cell Mito Stress Test Kit | Agilent | Cat#103015-100 | |
| Commercial assay or kit | Seahorse XF DMEM Assay Medium Pack | Agilent | Cat#103680-100 | |
| Commercial assay or kit | Seahorse XFe24 FluxPak | Agilent | Cat#102340wz-100 | |
| Chemical compound, drug | Ferrostatin-1 | MCE | CAS#347174-05-4 | Dissolved in DMSO |
| Chemical compound, drug | RSL3 | MCE | CAS#1219810-16-8 | Dissolved in DMSO |
| Chemical compound, drug | Z-VAD | Selleck | Cat#S7023 | Dissolved in DMSO |
| Chemical compound, drug | Necrostatin-1 | Selleck | Cat#S8037 | Dissolved in DMSO |
| Chemical compound, drug | Polybrene | Santa Cruz | Cat#sc-134120 | |
| Chemical compound, drug | Lipofectamine 2000 | Thermo Fisher Scientific | Cat#11668019 | |
| Chemical compound, drug | Lipofectamine 3000 | Thermo Fisher Scientific | Cat#L3000001 | |
| Software, algorithm | FlowJo | FlowJo | RRID:SCR_008520 | |
| Software, algorithm | GraphPad Prism | GraphPad Software | RRID:SCR_002798 | |
| Software, algorithm | CytExpert | Beckman Coulter | RRID:SCR_017217 | |
| Software, algorithm | ImageJ | National Institutes of Health | RRID:SCR_003070 |
Additional files
-
Supplementary file 1
The clinical characteristics of OSCC patients.
- https://cdn.elifesciences.org/articles/99122/elife-99122-supp1-v2.docx
-
Supplementary file 2
Primer sequences for RT-PCR.
- https://cdn.elifesciences.org/articles/99122/elife-99122-supp2-v2.docx
-
MDAR checklist
- https://cdn.elifesciences.org/articles/99122/elife-99122-mdarchecklist1-v2.pdf
Download links
A two-part list of links to download the article, or parts of the article, in various formats.
Downloads (link to download the article as PDF)
Open citations (links to open the citations from this article in various online reference manager services)
Cite this article (links to download the citations from this article in formats compatible with various reference manager tools)
RUNX2 isoform II protects cancer cells from ferroptosis and apoptosis by promoting PRDX2 expression in oral squamous cell carcinoma
eLife 13:RP99122.
https://doi.org/10.7554/eLife.99122.3


