JAK inhibition decreases the autoimmune burden in Down syndrome
- Linda Crnic Institute for Down Syndrome, University of Colorado Anschutz Medical Campus, United States
- Department of Pediatrics, Section of Developmental Pediatrics, University of Colorado Anschutz Medical Campus, United States
- Department of Dermatology, University of Colorado Anschutz Medical Campus, United States
- Department of Pharmacology, University of Colorado Anschutz Medical Campus, United States
- Department of Internal Medicine, University of Colorado Anschutz Medical Campus, United States
- Department of Pediatrics, Section of Developmental Biology, University of Colorado Anschutz Medical Campus, United States
- Department of Psychiatry, Child and Adolescent Division, University of Colorado Anschutz Medical Campus, United States
- Department of Human Development and Family Studies, Colorado State University, United States
Figures
Figure 1 with 1 supplement
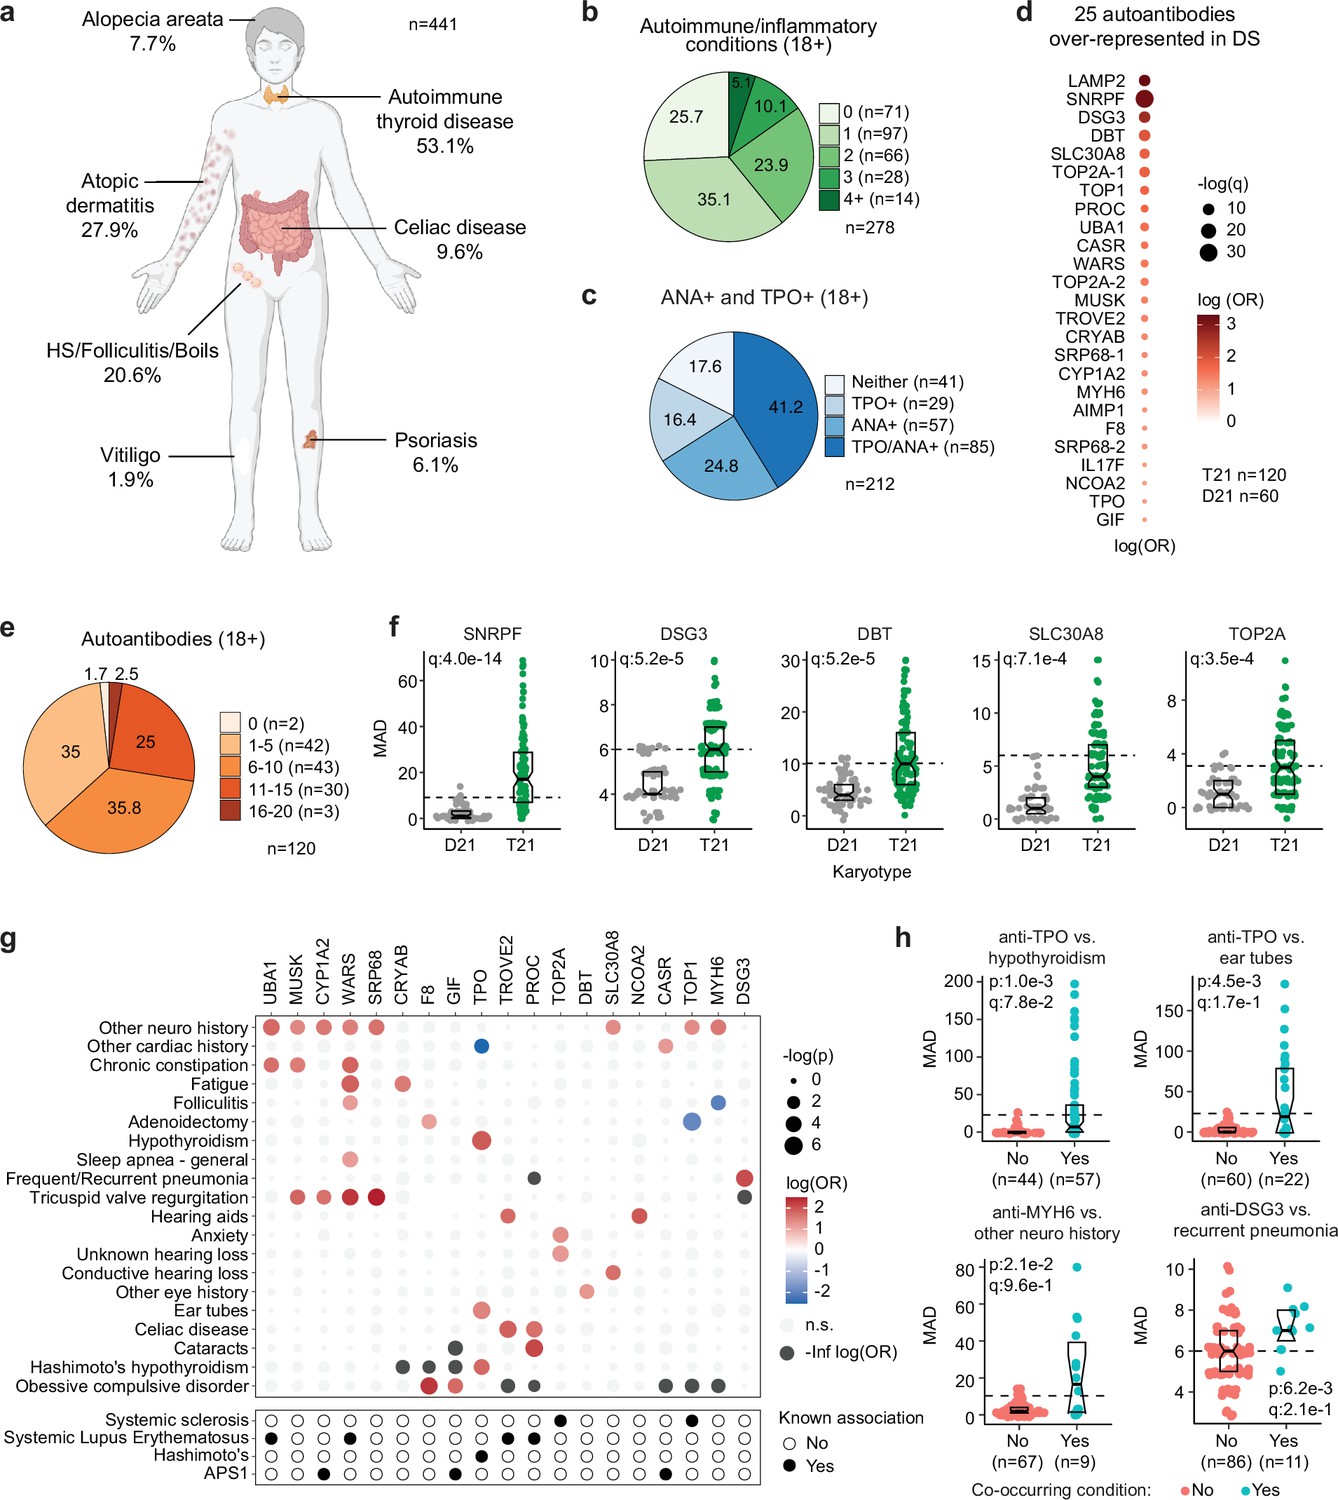
Multi-organ autoimmunity and widespread autoantibody production in Down syndrome.
(a) Overview of autoimmune and inflammatory conditions prevalent in persons with Down syndrome (DS) enrolled in the Human Trisome Project (HTP) cohort study. Percentages indicate the fraction of participants (n=441, all ages) with history of the indicated conditions. Graphic elements composed with BioRender.com. (b) Pie chart showing autoimmune/inflammatory condition burden in adults (n=278, 18+years old) with DS. (c) Pie chart showing rates of positivity for anti-TPO and/or anti-nuclear antibodies (ANA) in adults (n=212, 18+years old) with DS. (d) Bubble plot displaying odds-ratios and significance for 25 autoantibodies with elevated rates of positivity in individuals with DS (n=120) vs 60 euploid controls (D21). q values calculated by Benjamini-Hochberg adjustment of p-values from Fisher’s exact test. (e) Pie chart showing fractions of adults with DS (n=120, 18+years old) testing positive for various numbers of the autoantibodies identified in d. (f) Representative examples of autoantibodies more frequent in individuals with T21 (n=120) versus euploid controls (D21, n=60). MAD: median absolute deviation. Dashed lines indicate the positivity threshold of 90th percentile for D21. Data are presented as modified sina plots with boxes indicating quartiles. (g) Bubble plots showing the relationship between autoantibody positivity and history of various clinical diagnoses in DS (n=120). Size of bubbles is proportional to -log-transformed p values from Fisher’s exact test. (h) Sina plots displaying the levels of selected autoantibodies in individuals with DS with or without the indicated co-occurring conditions. MAD: median absolute deviation. Dashed lines indicate the positivity threshold of 90th percentile for D21. Sample sizes are indicated under each plot. q values calculated by Benjamini-Hochberg adjustment of p-values from Fisher’s exact tests.
-
Figure 1—source data 1
Clinical data for Human Trisome Project participants analyzed in this study, including demographics, karyotype status, and major co-occurring diagnoses relevant to this study.
- https://cdn.elifesciences.org/articles/99323/elife-99323-fig1-data1-v1.xlsx
-
Figure 1—source data 2
Autoantibody measurements of Human Trisome Project participants.
(A) anti-thyroid peroxidase (TPO) reactivity; (B) anti-nuclear antigen (ANA) reactivity; (C) SciLifeLabs autoantigen peptide array data.
- https://cdn.elifesciences.org/articles/99323/elife-99323-fig1-data2-v1.xlsx
Figure 1—figure supplement 1
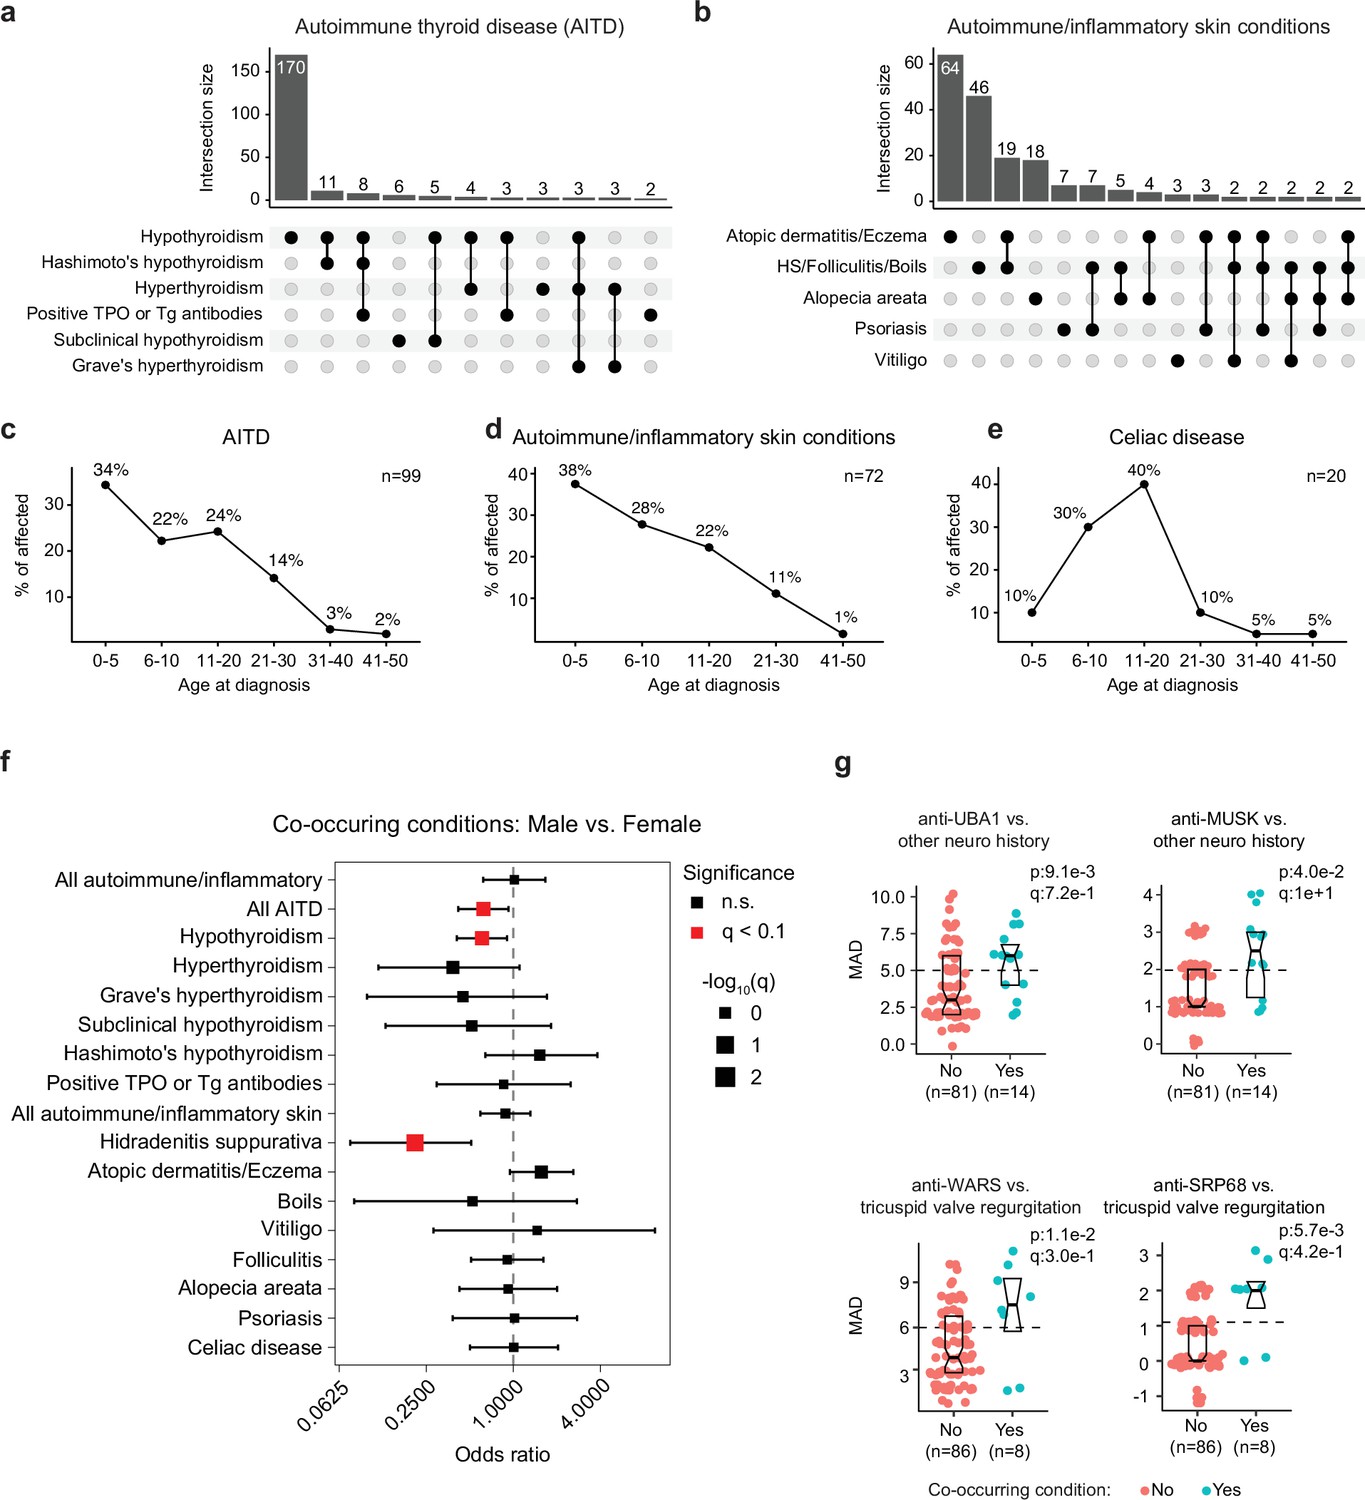
Early onset multi-organ autoimmunity and autoantibody production in Down syndrome.
(a–b) Upset plots showing overlap between various reported diagnoses indicative of autoimmune thyroid disease (a) or autoimmune/inflammatory skin conditions (b) in research participants with Down syndrome (DS, all ages, n=441) enrolled in the Human Trisome Project (HTP). (c–e) Plots showing the percentages of cases by age at diagnosis for AITD (c), autoimmune/inflammatory skin conditions (d), and celiac disease (e). Sample sizes indicated in each chart. (f) Odds ratio plot for Fisher’s exact test of proportions (cases vs. controls in males vs. females) for history of co-occurring conditions in individuals with DS (all ages, total n=441). Conditions with q<0.1 (10% FDR) are highlighted in red. The size of square points is inversely proportional to q value; error bars represent 95% confidence intervals. (g) Sina plots displaying the levels of select autoantibodies in individuals with DS, with or without history of the indicated co-occurring conditions. MAD: median absolute deviation. Horizontal dashed lines indicate 90th percentiles for the D21 group. Sample sizes are indicated under each plot. q values calculated by Benjamini-Hochberg adjustment of p-values from Fisher’s exact tests.
Figure 2 with 1 supplement
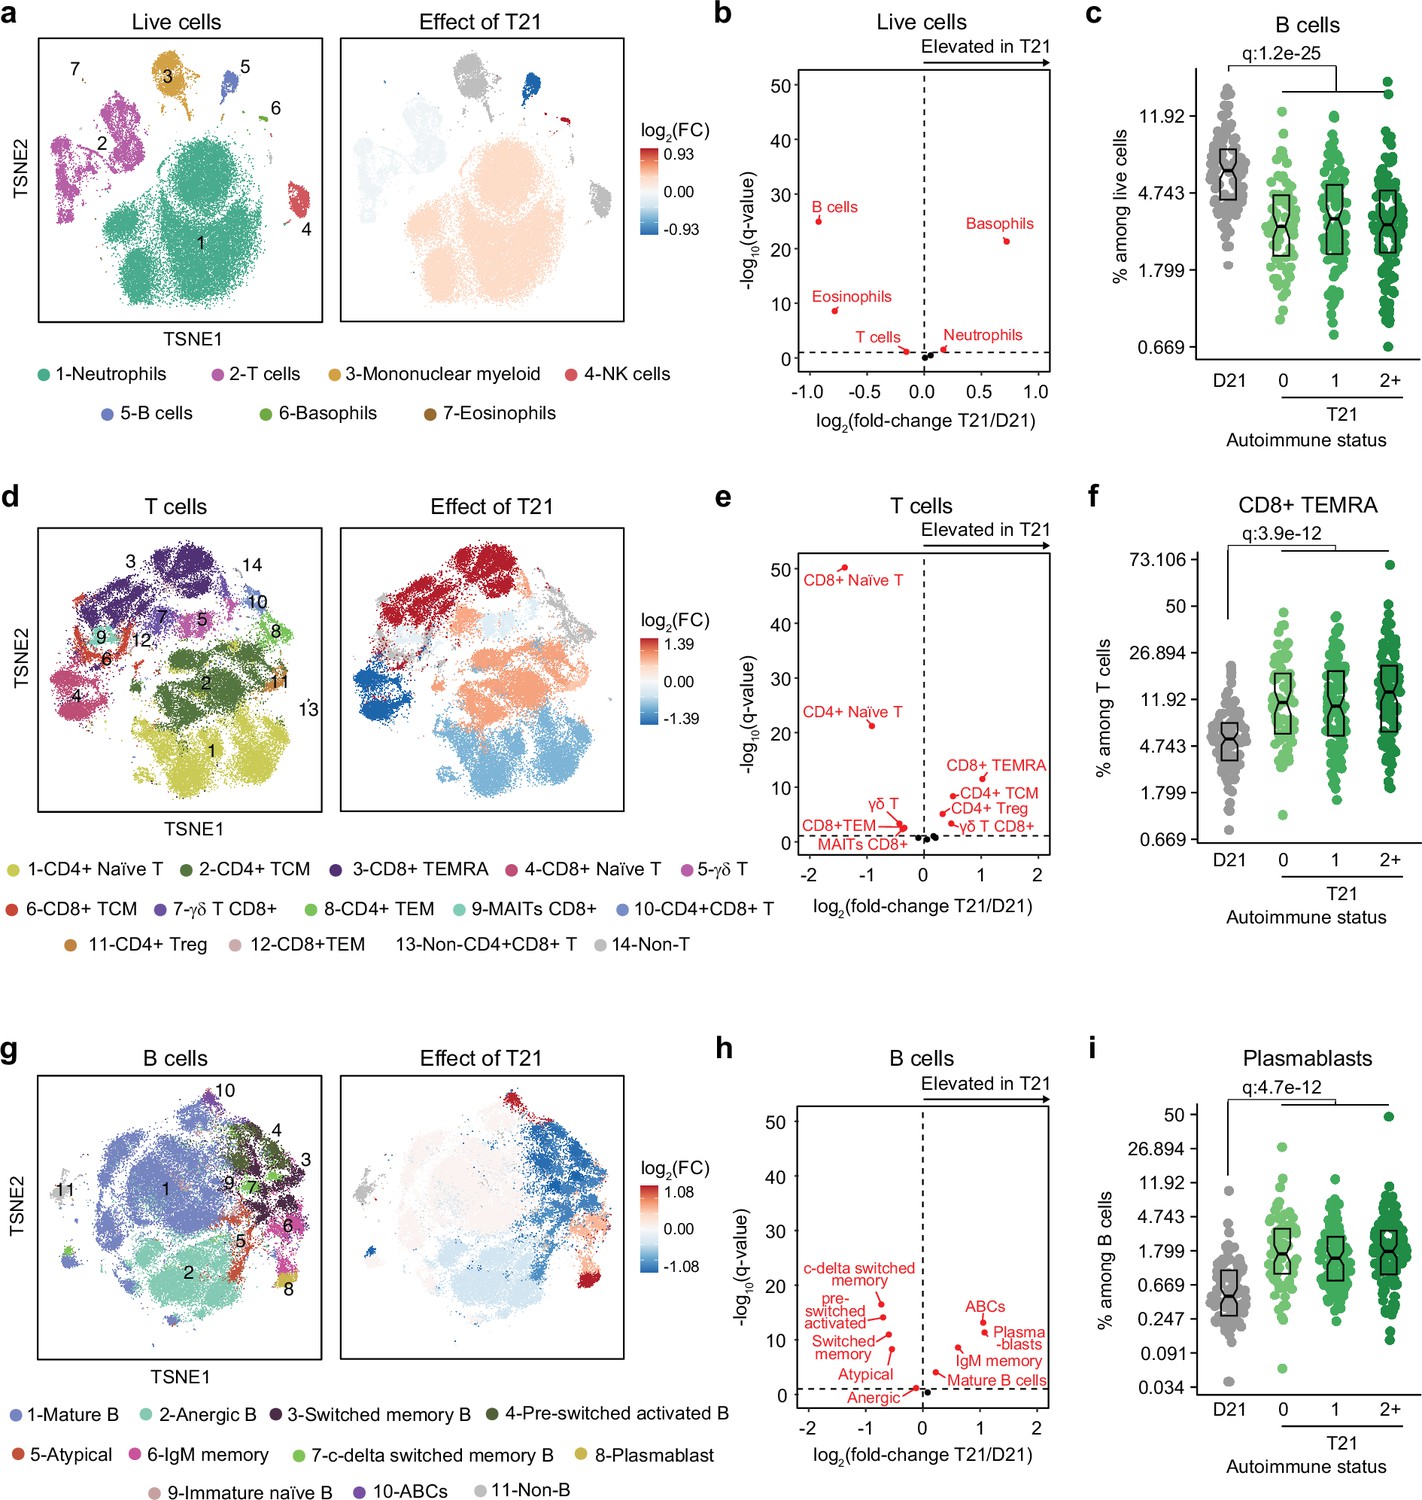
Trisomy 21 causes global immune remodeling regardless of clinically evident autoimmunity.
(a) t-distributed Stochastic Neighbor Embedding (t-SNE) plot displaying major immune populations identified by FlowSOM analysis of mass cytometry data for all live cells (left) and color coded by significant impact of T21 (beta regression q<0.1) on their relative frequency (right). Red indicates increased frequency and blue indicates decreased frequency among research participants with T21 (n=292) versus euploid controls (D21, n=96). (b) Volcano plot showing the results of beta regression analysis of major immune cell populations among all live cells in research participants with T21 (n=292) versus euploid controls (D21, n=96). The dashed horizontal line indicates a significance threshold of 10% FDR (q<0.1) after Benjamini-Hochberg correction for multiple testing. (c) Frequencies of B cells among all live cells in euploid controls (D21, n=96) versus individuals with T21 and history of 0 (n=69), 1 (n=102) or 2+ (n=121) autoimmune/inflammatory conditions. Data is displayed as modified sina plots with boxes indicating quartiles. (d-f) Description as in a-c, but for subsets of T cells. (g–i) Description as in a-c, but for subsets of B cells.
Figure 2—figure supplement 1
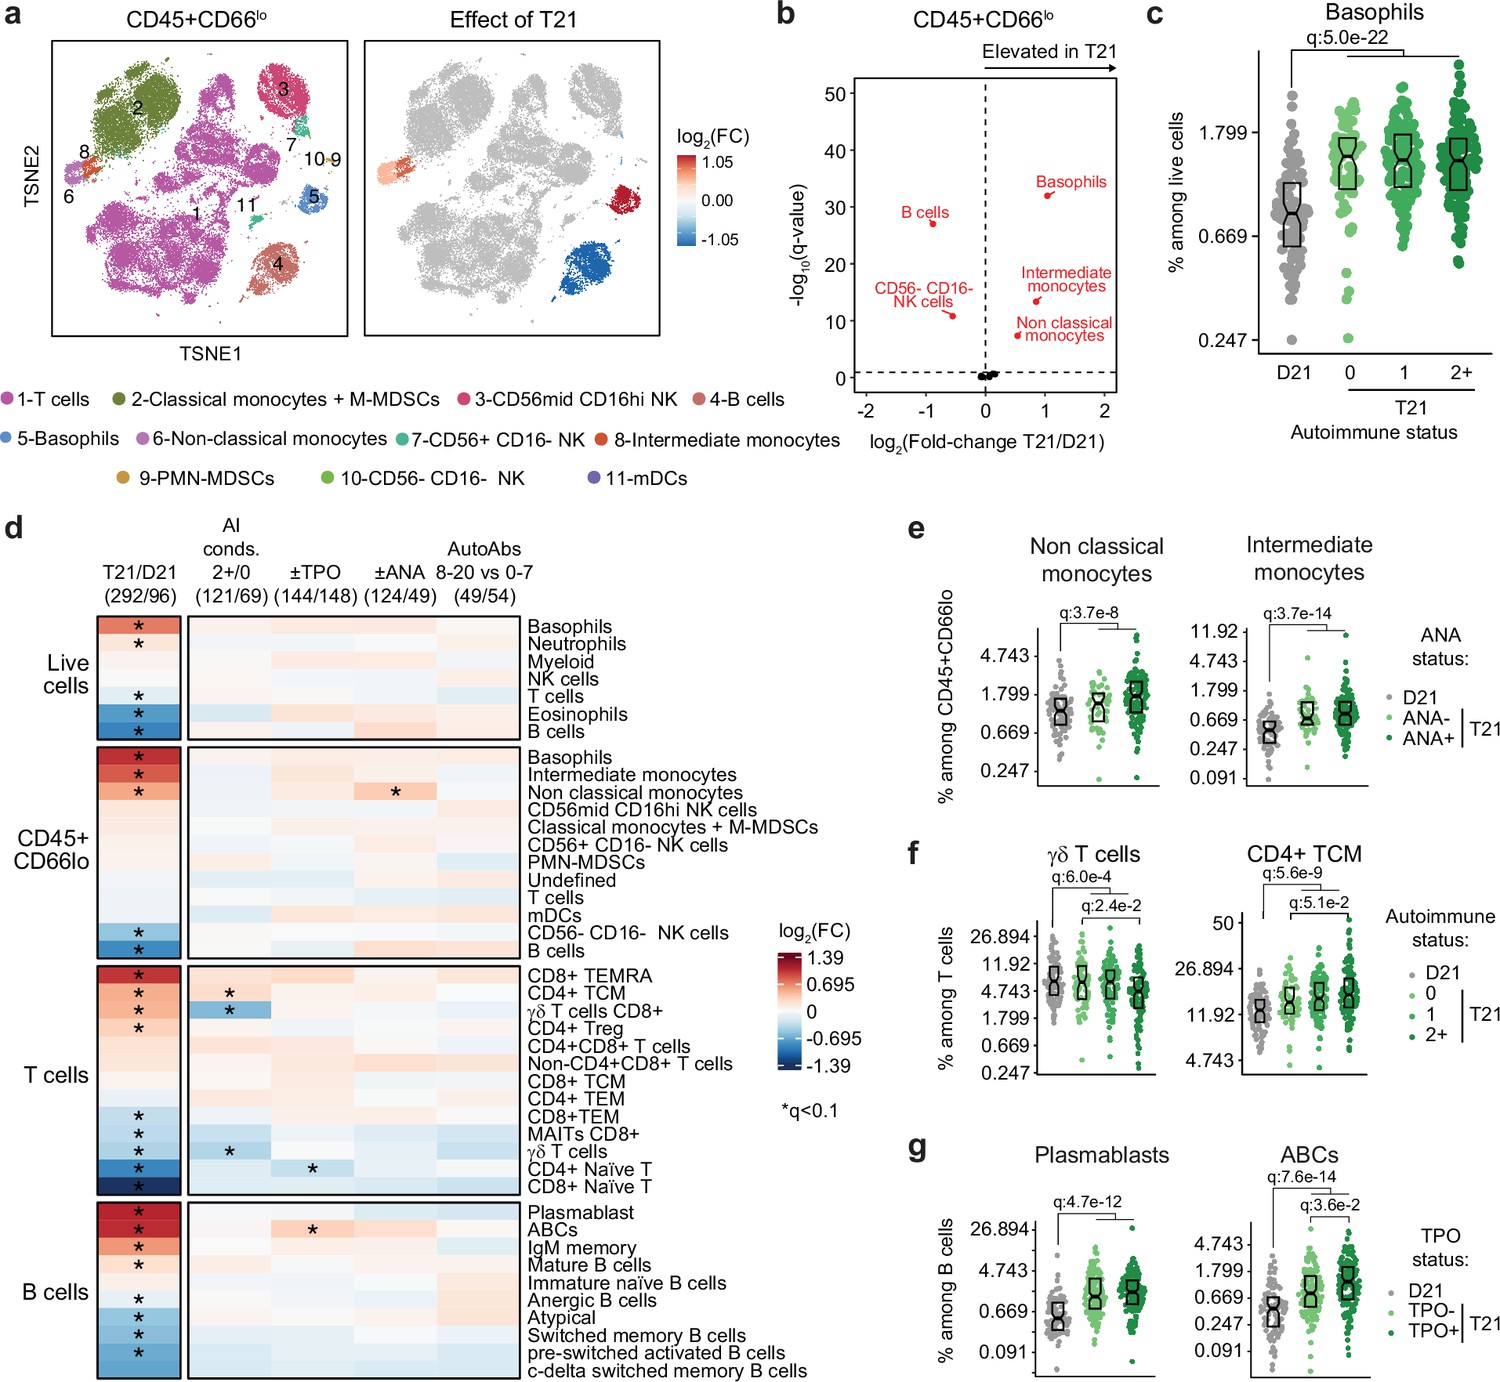
Consistent remodeling of the peripheral immune system in Down syndrome.
(a) t-distributed Stochastic Neighbor Embedding (t-SNE) plot displaying major immune populations identified by FlowSOM analysis of mass cytometry data for CD45+ CD66lo non-granulocytes (left) and color coded by the impact of trisomy 21 (T21) on their relative frequency (right). Red indicates increased frequency and blue indicates decreased frequency among research participants with T21 (n=292) versus euploid controls (D21, n=96). (b) Volcano plot showing the results of beta regression analysis of immune cell populations among CD45+ CD66lo non-granulocytes from research participants with T21 (n=292) versus euploid controls (D21, n=96). The dashed horizontal line indicates a significance threshold of 10% FDR (q<0.1) after Benjamini-Hochberg correction for multiple testing. (c) Frequencies of basophils among all live cells in euploid controls (D21, n=96) versus individuals with T21 and history of 0 (n=44), 1 (n=71) or 2+ (n=88) autoimmune/inflammatory conditions. Data is displayed as modified sina plots with boxes indicating quartiles. (d) Heatmap summarizing the results of beta regression testing for differences in frequencies of indicated immune cell populations among all live cells, CD45+ CD66lo non-granulocytes, T cells, and B cells by T21 (n=292) versus D21 (n=96) status, or by different subgroups within the T21 cohort: 2+ (n=88) vs 0 (n=44) autoimmune/inflammatory conditions; TPO+ (n=144) versus TPO- (n=148); ANA+ (n=124) versus ANA- (n=49); or positivity for 8–20 (n=49) versus 0–7 (n=54) autoantibodies elevated in DS. Asterisks indicate significance after Benjamini-Hochberg correction for multiple testing (q<0.1, 10% FDR). (e–g) Representative examples of immune cell populations from d, showing effects of ANA positivity (e), number of autoimmune conditions (f), and TPO status (g). Data are presented as modified sina plots with boxes indicating quartiles, with q-values indicating beta regression significance after Benjamini-Hochberg correction for multiple testing.
Figure 3 with 1 supplement
Trisomy 21 causes constitutive hypercytokinemia independent of autoimmunity status from an early age.
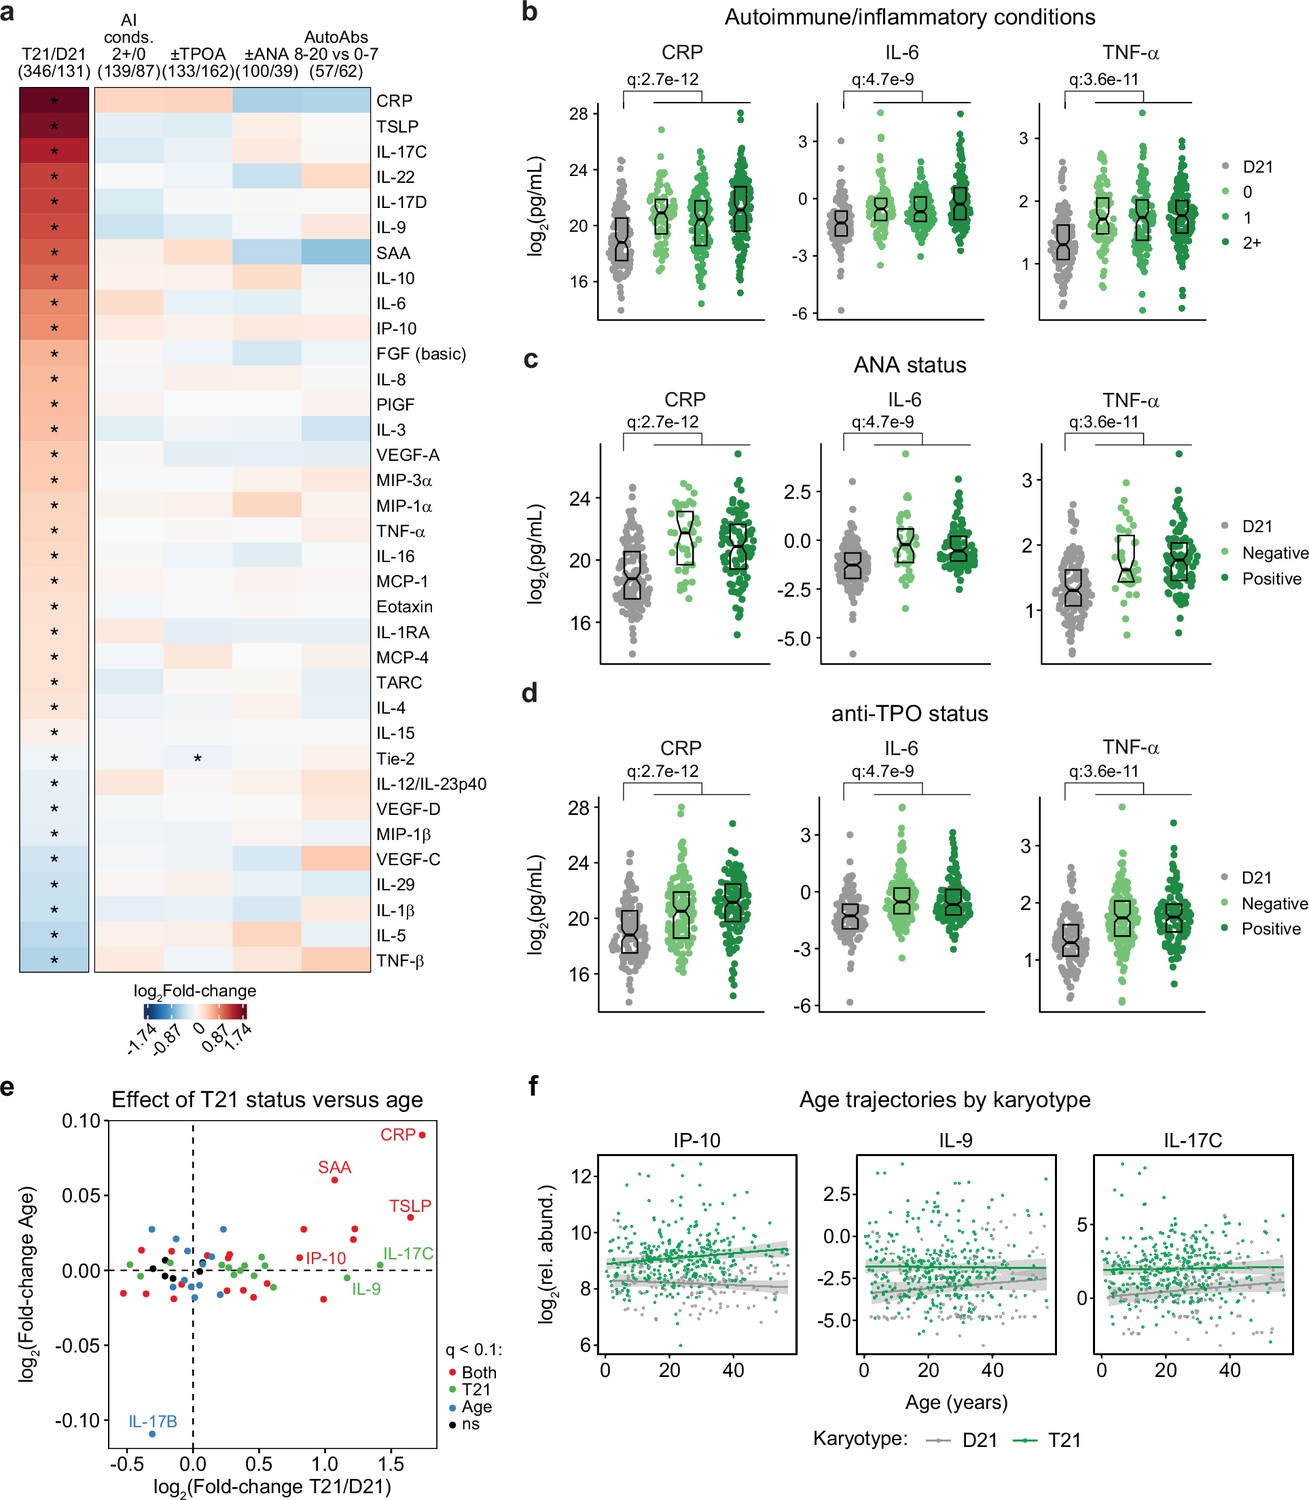
(a) Heatmap displaying log2-transformed fold-changes for plasma immune markers with significant differences in trisomy 21 (T21, n=346) versus euploid (D21, n=131), and between different subgroups within the T21 cohort: history of 2+ (n=139) vs 0 (n=87) autoimmune/inflammatory conditions (AI conds.); TPO+ (n=133) versus TPO- (n=162); ANA+ (n=100) versus ANA- (n=39); or positivity for 8–20 (n=57) versus 0–7 (n=62) autoantibodies (AutoAbs) elevated in DS. Asterisks indicate linear regression significance after Benjamini-Hochberg correction for multiple testing (q<0.1, 10% FDR). (b–d) Comparison of CRP, IL-6 and TNF-α levels in euploid controls (D21, n=131) versus subsets of individuals with T21 based on number of autoimmune/inflammatory conditions (b), ANA positivity (c) or TPO positivity (d). Data are presented as modified sina plots with boxes indicating quartiles. Samples sizes as in a. q-values indicate linear regression significance after Benjamini-Hochberg correction for multiple testing. (e) Scatter plot comparing the effect of T21 karyotype versus the effect of age in individuals with T21 (n=54 immune markers in 346 individuals with T21), highlighting immune markers that are significantly different by T21 status, age, or both. ns: not significantly different by T21 status or age. (f) Scatter plots for example immune markers that are significantly elevated in T21, but which are either not elevated with age in the euploid (D21) cohort (i.e. IP-10), or in either the T21 (n=346) or D21 (n=131) cohorts. Lines represent least-squares linear fits with 95% confidence intervals in grey.
Figure 3—figure supplement 1
Consistent hypercytokinemia from an early age in Down syndrome.
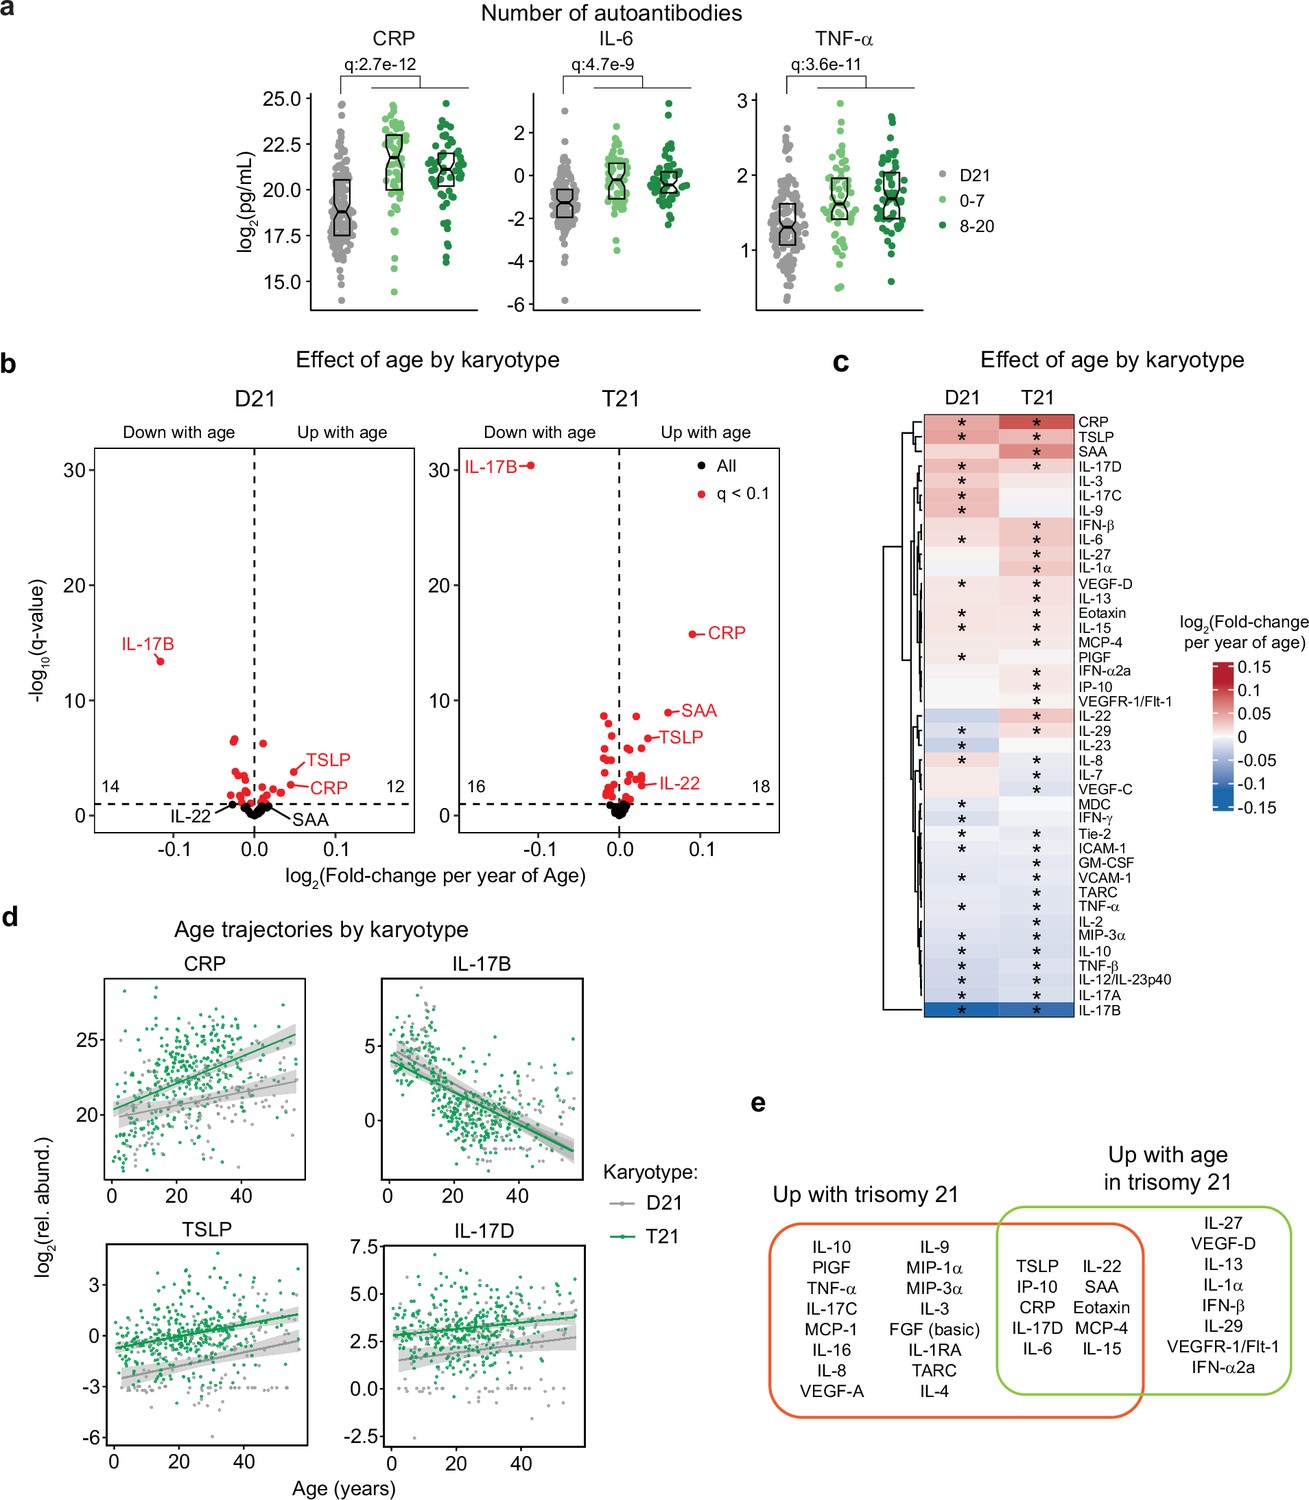
(a) Comparison of CRP, IL-6, and TNF-α levels in euploid controls (D21, n=131) versus subsets of individuals with T21 based on number of autoantibodies commonly elevated in Down syndrome: 0–7 autoantibodies (n=62) versus 8–20 autoantibodies (n=57). Data are presented as modified sina plots with boxes indicating quartiles. q-values indicate linear regression significance after Benjamini-Hochberg correction for multiple testing. (b) Volcano plots presenting the results of linear regression testing for association between age and the levels of 54 immune markers in the plasma of euploid controls (left, D21, n=131) and individuals with trisomy 21 (right, T21, n=346) enrolled in the Human Trisome Project (HTP) study. Horizontal dashed lines indicate a significance threshold of 10% FDR (q<0.1) after Benjamini-Hochberg correction for multiple testing. (c) Heatmap comparing the effect of age on levels of immune markers in D21 and T21. Heatmap color scale represents log2-transformed mean fold-change per year of age; asterisks indicate significance (q<0.1) for linear regression testing. (d) Scatter plots showing the age trajectories of select immune markers in D21 versus T21. Sample sizes as in c. Lines represent least squares linear fits with shaded areas indicating 95% confidence interval. (e) Diagram representing the overlap between immune markers elevated in T21 versus D21 and those elevated with age in T21.
Figure 4
Clinical trial for JAK inhibition in Down syndrome.
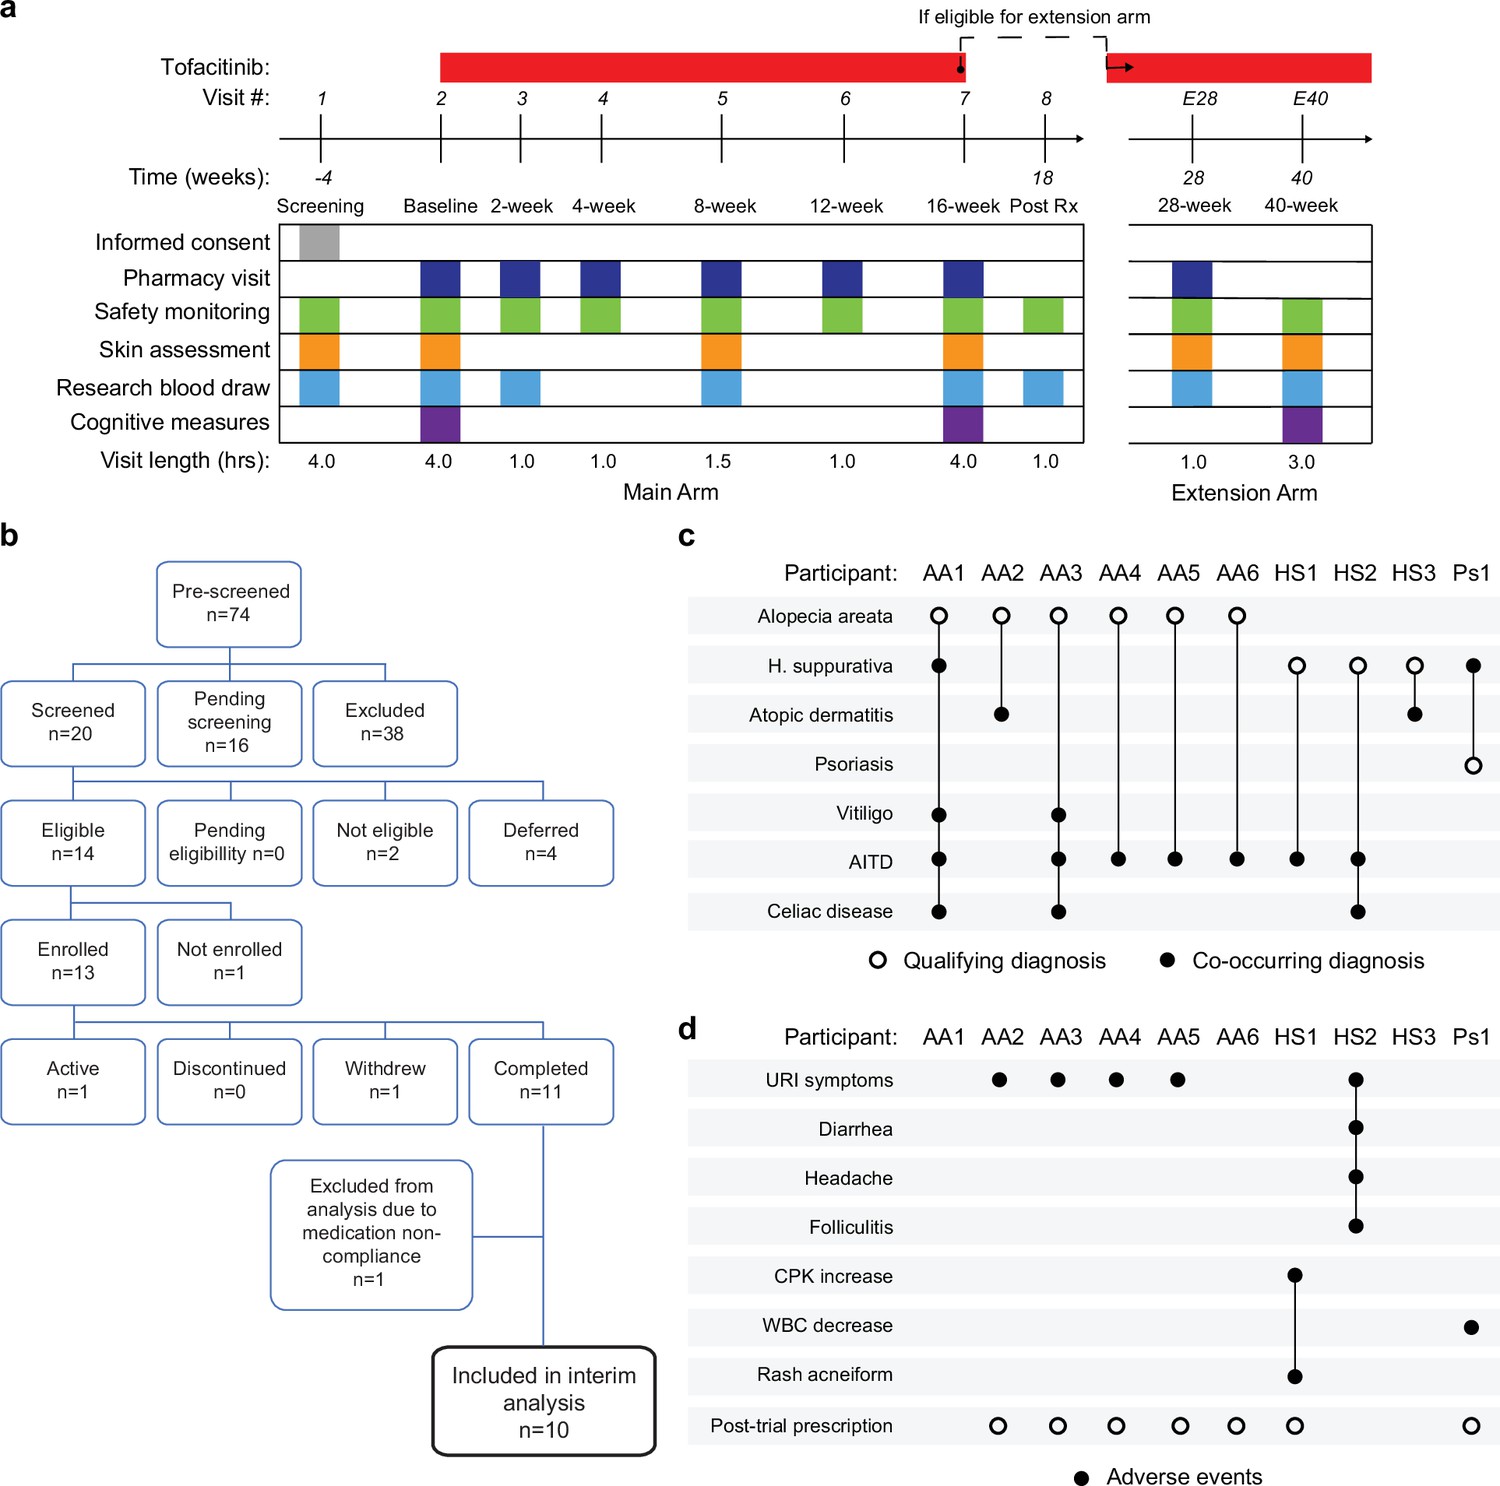
(a) Schedule of activities for clinical trial of JAK inhibition in Down syndrome (NCT04246372). (b) Consort chart for first 13 participants enrolled in the clinical trial. (c) Upset plot displaying the qualifying and co-occurring autoimmune/inflammatory conditions for the 10 participants included in the interim analysis. (d) Upset plots summarizing the adverse events annotated for the first 10 participants over a 16-week treatment period.
-
Figure 4—source data 1
Adverse events for clinical trial participants.
- https://cdn.elifesciences.org/articles/99323/elife-99323-fig4-data1-v1.xlsx
Figure 5 with 1 supplement
Tofacitinib improves diverse immune skin pathologies in Down syndrome.
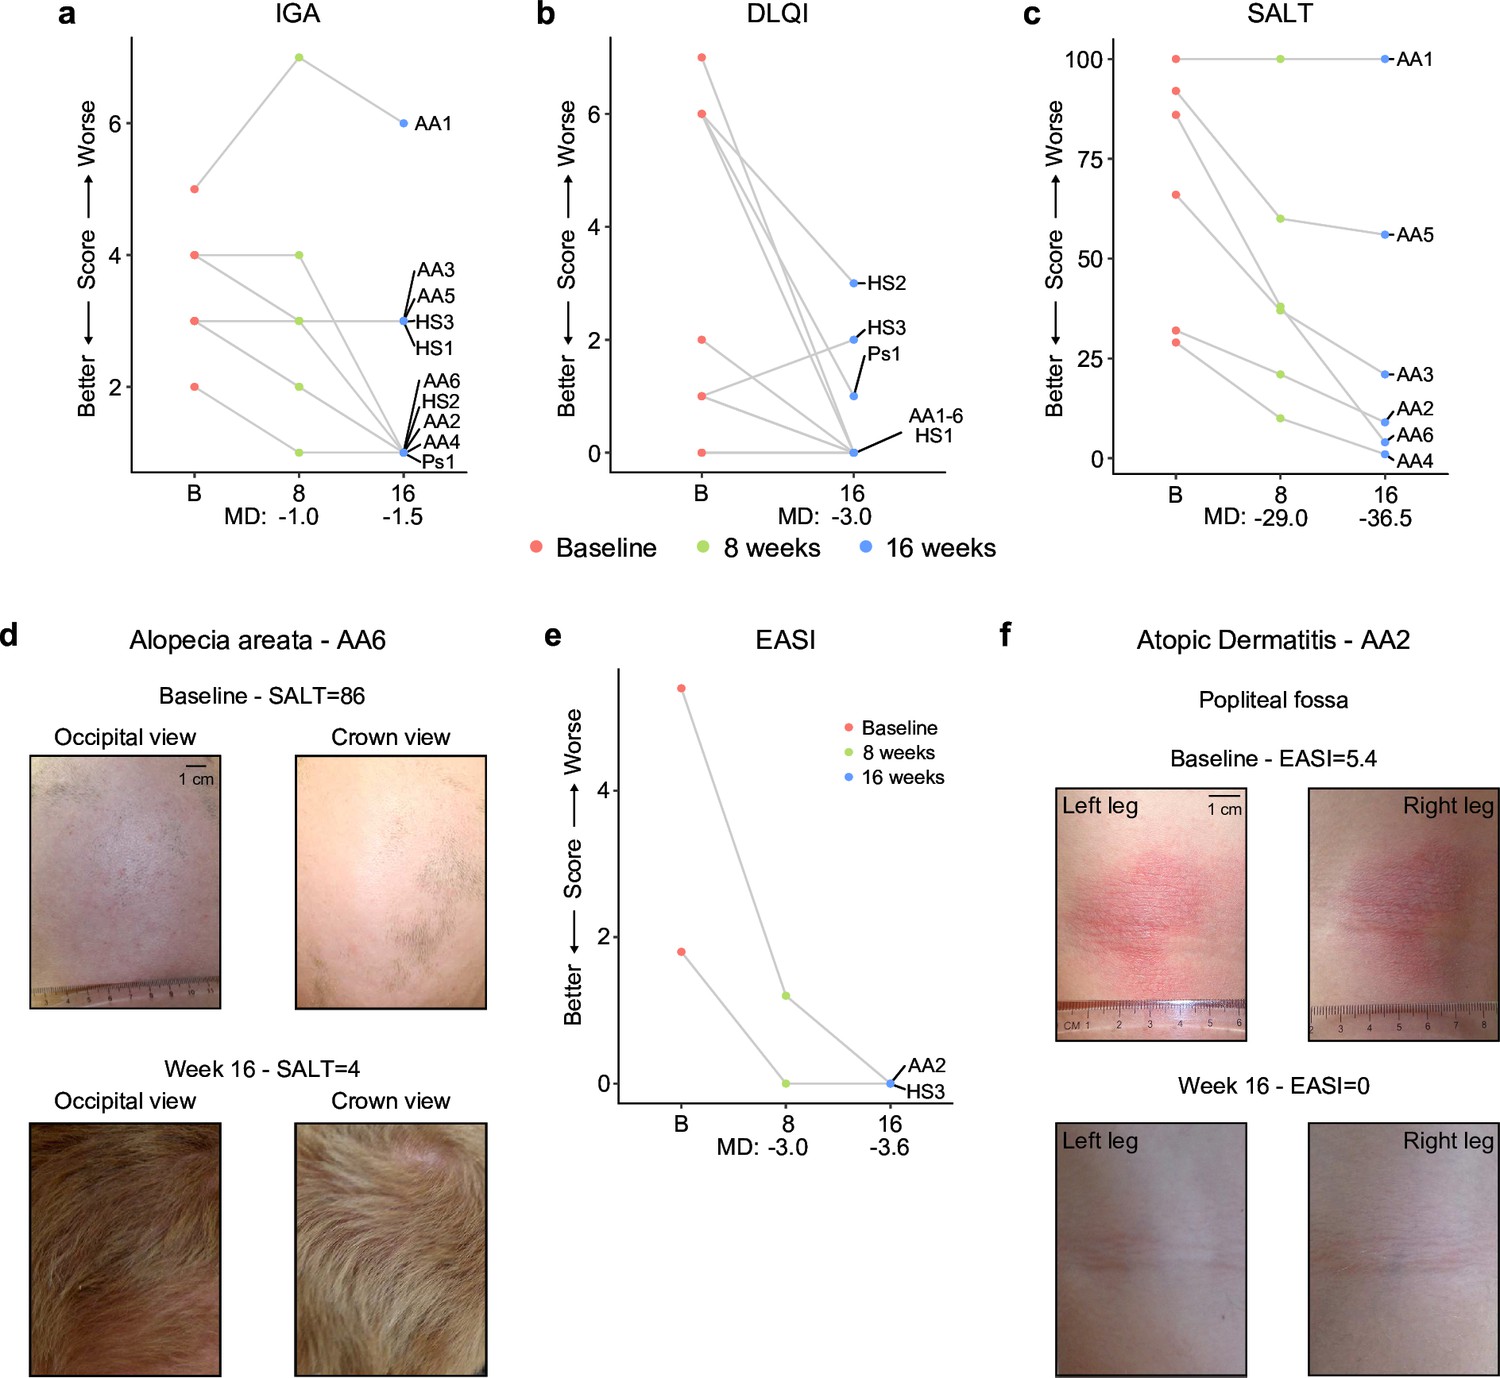
(a–b) Investigator global assessment (IGA) scores (a) and Dermatological Life Quality Index (DLQI) scores (b) for the first 10 participants at baseline visit (B), mid-point (8 weeks) and endpoint (16 weeks) visits. MD: median difference. (c) Severity of Alopecia Tool (SALT) scores for the first seven participants with alopecia areata in the trial. (d) Images of participant AA6 at baseline versus week 16. (e) Eczema Area and Severity Index (EASI) scores for two participants with mild atopic dermatitis. (f) Images of participant AA2 showing improvement in atopic dermatitis upon tofacitinib treatment. p values not shown as per interim analysis plan.
-
Figure 5—source data 1
Skin pathology metrics for clinical trial participants.
(A) Investigator’s Global Assessment (IGA); (B) Dermatology Life Quality Index (DLQI); (C) Severity of Alopecia Tool (SALT); (D) Psoriasis Area and Severity Index (PASI); and (E) Eczema Area and Severity Index (EASI).
- https://cdn.elifesciences.org/articles/99323/elife-99323-fig5-data1-v1.xlsx
Figure 5—figure supplement 1
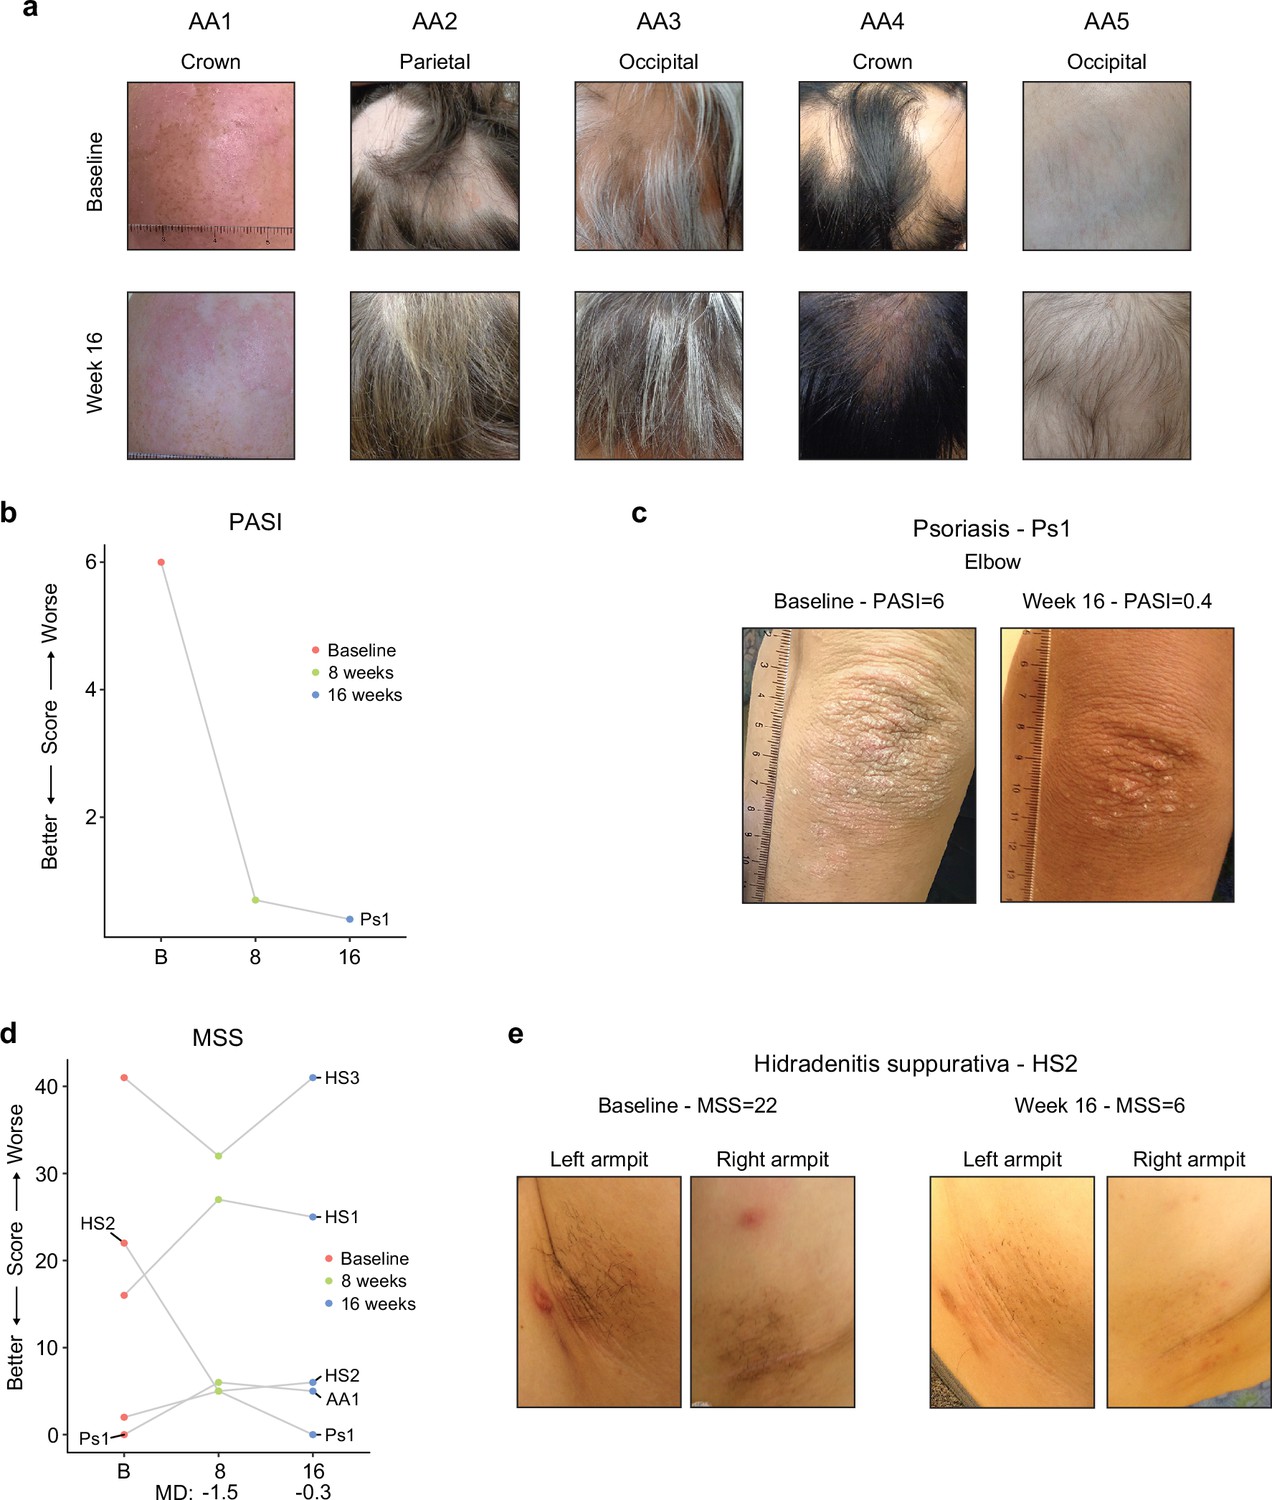
Tofacitinib improves diverse skin pathologies in Down syndrome.
(a) Images of five participants with alopecia areata at baseline and after 16 weeks of tofacitinib treatment. (b–c) Psoriasis Area and Severity Index score (b) and images (c) for participant with psoriatic arthritis. (d) Modified Sartorius Scale (MSS) scores for five participants with hidradenitis suppurativa (HS). MD: median difference. (e) Images for participant affected by HS at baseline and 16 week endpoint visit. p values not shown as per interim analysis plan.
Figure 6 with 1 supplement
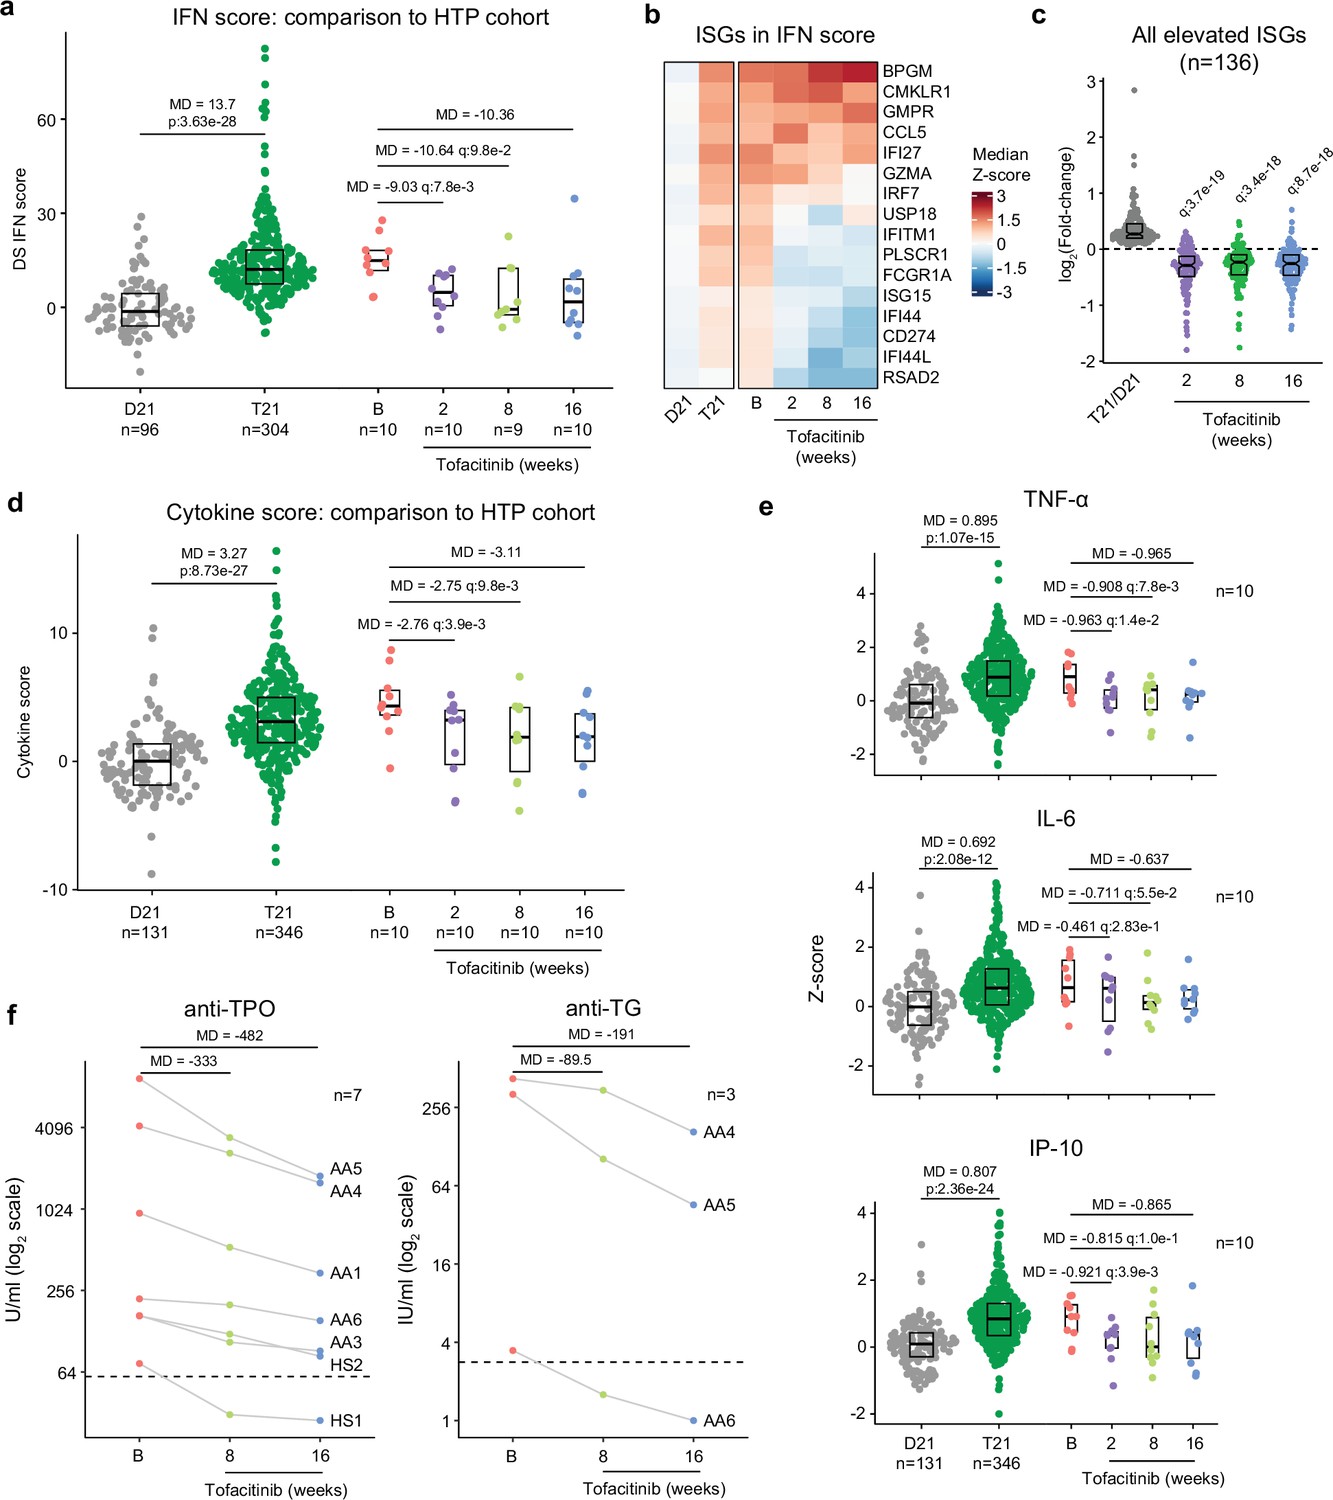
Tofacitinib reduces IFN scores, hypercytokinemia, and pathogenic autoantibodies in Down syndrome.
(a) Comparison of interferon (IFN) transcriptional scores derived from whole blood transcriptome data for research participants in the Human Trisome Project (HTP) cohort study by karyotype status (D21, grey; T21, green) and the clinical trial cohort at baseline (B), and weeks 2, 8, and 16 of tofacitinib treatment. Data are represented as modified sina plots with boxes indicating quartiles. Sample sizes are indicated below the x-axis. Horizontal bars indicate comparisons between groups with median differences (MD) with p-values from Mann-Whitney U-tests (HTP cohort) or q-values from paired Wilcox tests (clinical trial). q value for the 16-week endpoint is not shown as per interim analysis plan. (b) Heatmap displaying median z-scores for the indicated groups (as in a) for the 16 interferon-stimulated genes (ISGs) used to calculate IFN scores. (c) Analysis of fold changes for 136 ISGs not encoded on chr21 that are significantly elevated in Down syndrome (T21 versus D21) at 2, 8, and 16 weeks of tofacitinib treatment relative to baseline. Sample sizes as in a. q-values above each group indicate significance of Mann-Whitney U-tests against log2-transformed fold-change of 0 (no-chance), after Benjamini-Hochberg correction for multiple testing. (d) Comparison of cytokine score distributions for the HTP cohort by karyotype status (D21, T21) versus the clinical trial cohort at baseline (B) and 2, 8, and 16 weeks of tofacitinib treatment. Data are represented as modified sina plots with boxes indicating quartiles. Sample sizes are indicated below the x-axis. Horizontal bars indicate comparisons between groups with median differences (MD) with p-values from Mann-Whitney U-tests (HTP cohort) and q-values from paired Wilcox tests (clinical trial). q value for the 16-week endpoint is not shown as per interim analysis plan. (e) Comparison of plasma levels of cytokines in the HTP cohort by karyotype status (D21, T21) and the clinical trial cohort at baseline (B) versus 2, 8, and 16 weeks of tofacitinib treatment. Data are represented as modified sina plots with boxes indicating quartiles. Sample sizes are indicated below x-axis. Horizontal bars indicate comparisons between groups with median differences (MD) with p-values from Mann-Whitney U-tests (HTP cohort) and q values from paired Wilcox tests (clinical trial). q value for the 16-week endpoint is not shown as per interim analysis plan. (f) Plots showing levels of autoantibodies against thyroid peroxidase (TPO) and thyroglobulin (TG) at baseline versus 8 and 16 weeks of tofacitinib treatment. Sample sizes are indicated in each plot.
-
Figure 6—source data 1
Molecular markers of inflammation and autoimmunity in clinical trial participants.
(A) DS IFN scores; (B) Cytokine scores; (C) anti-thyroid peroxidase (TPO) titers; (D) anti-transglutaminase (TG) titers; and (E) anti-thyroid stimulating hormone receptor (TSHR) titers for clinical trial participants. See also Data Availability Statement for underlying raw data submitted to various data repositories.
- https://cdn.elifesciences.org/articles/99323/elife-99323-fig6-data1-v1.xlsx
Figure 6—figure supplement 1
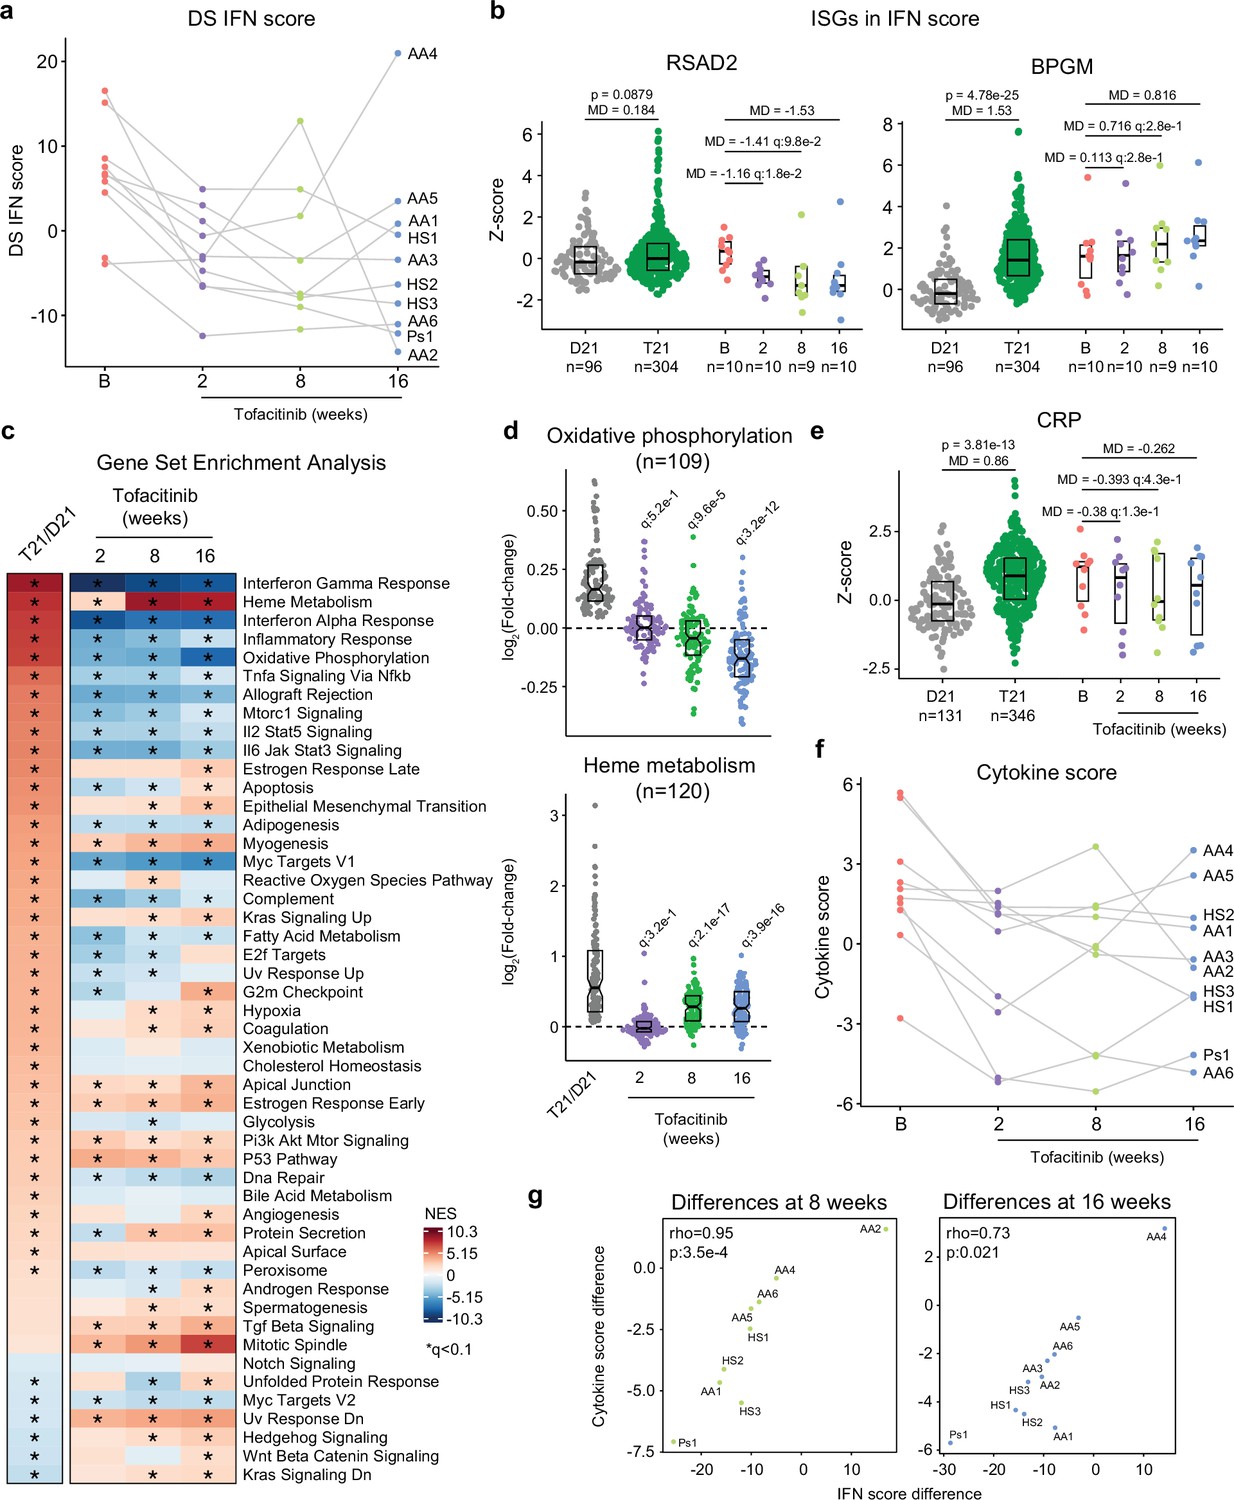
JAK inhibition reduces multiple markers of inflammation and autoimmunity in Down syndrome.
(a) Plot showing trajectory of IFN scores derived from whole blood transcriptome for 10 clinical trial participants at baseline (B), versus 2, 8, and 16 weeks of tofacitinib treatment. (b) Comparison of ISG expression in the whole blood transcriptome data from research participants in the Human Trisome Project (HTP) cohort study by karyotype status (D21, grey; T21, green) and the clinical trial cohort at baseline (B), and weeks 2, 8, and 16 of tofacitinib treatment. Data are represented as modified sina plots with boxes indicating quartiles. Sample sizes are indicated below x-axis. Horizontal bars indicate comparisons between groups with median differences (MD) with p-values from Mann-Whitney U-tests (HTP cohort) and q-values from paired Wilcox tests (clinical trial). (c) Heatmap displaying the results of Gene Set Enrichment Analysis (GSEA) of global transcriptome changes in the whole blood RNA of research participants in the HTP cohort (T21, n=304; D21, n=96) versus the clinical trial cohort at 2 (n=10), 8 (n=9), and 16 weeks (n=10) of tofacitinib treatment relative to baseline (n=10). Asterisks indicate significance after correction by Benjamini-Hochberg method for multiple testing (q<0.1, 10% FDR). NES: normalized enrichment score. (d) Analysis of fold changes for 109 genes involved in oxidative phosphorylation and 120 genes involved in heme metabolism significantly elevated in Down syndrome (T21 versus D21 in the HTP cohort) versus the clinical trial cohort at 2, 8, and 16 weeks of tofacitinib treatment relative to baseline. Sample numbers as in c. (e) Comparison of CRP levels in the HTP cohort by karyotype status (D21, grey; T21, green) versus the clinical trial cohort at baseline (B) and 2, 8, and 16 weeks of tofacitinib treatment. Data are represented as modified sina plots with boxes indicating quartiles. Sample sizes are indicated below x-axis. Horizontal bars indicate comparisons between groups with median differences (MD) with p-values from Mann-Whitney U-tests (HTP cohort) and q-values from paired Wilcox tests (clinical trial). (f) Plot showing trajectory of cytokine scores for 10 clinical trial participants at baseline (B), versus 2, 8, and 16 weeks of tofacitinib treatment. (g) Plots showing Spearman correlations between fold changes in IFN scores versus cytokine scores at 8 and 16 weeks of tofacitinib treatment versus baseline. Sample size is n=10.
Tables
Appendix 1—key resources table
| Reagent type (species) or resource | Designation | Source or reference | Identifiers | Additional information |
|---|---|---|---|---|
| Antibody | Mouse monoclonal anti-human CD11c (clone Bu15) | Fluidigm | Cat # 3147008; RRID:AB_2687850 | Lot 3431914, 1:100 |
| Antibody | Mouse monoclonal anti-human CD123 (clone 6 H6) | Fluidigm | Cat # 3143014B; RRID:AB_2811081 | Lot 3431917, 1:100 |
| Antibody | Mouse monoclonal anti-human CD127 (clone A019D5) | Fluidigm | Cat # 3149011; RRID:AB_2661792 | Lot 3321819, 1:100 |
| Antibody | Mouse monoclonal anti-human CD14 (clone M5E2) | Fluidigm | Cat # 3151009B; RRID:AB_2810244 | Lot 2191914, 1:100 |
| Antibody | Mouse monoclonal anti-human CD15 (Clone W6D3) | BioLegend | Cat # 323002; RRID:AB_756008 | Lot B254011, 1:67 |
| Antibody | Mouse monoclonal anti-human CD16 (clone B73.1) | BioLegend | Cat # 360702; RRID:AB_2562693 | Lot B243320, 1:33 |
| Antibody | Mouse monoclonal anti-human CD161 (clone DX12) | BD Biosciences | Cat # 556079; RRID:AB_396346 | Lot 9115548, 1:33 |
| Antibody | Mouse monoclonal anti-human CD19 (clone HIP19) | Fluidigm | Cat # 3142001; RRID:AB_2651155 | Lot 3031906, 1:100 |
| Antibody | Mouse monoclonal anti-human CD1c (clone L161) | BioLegend | Cat # 331501; RRID:AB_1088996 | Lot B265380, 1:100 |
| Antibody | Mouse monoclonal anti-human CD25 (clone 2 A3) | Fluidigm | Cat # 3169003; RRID:AB_2661806 | Lot 0342004, 1:100 |
| Antibody | Mouse monoclonal anti-human CD27 (clone L128) | Fluidigm | Cat # 3167006B; RRID:AB_2811093 | Lot 2851804, 1:400 |
| Antibody | Mouse monoclonal anti-human CD279/PD1 (clone EH12.2H7) | Fluidigm | Cat # 3155009B; RRID:AB_2811087 | Lot 2971910, 1:133 |
| Antibody | Mouse monoclonal anti-human CD3 (clone UCHT1) | DVS Sciences | Cat # 3154003B; RRID:AB_2811086 | Lot 0071917, 1:100 |
| Antibody | Mouse monoclonal anti-human CD33 (clone WM53) | BioLegend | Cat # 303402; RRID:AB_314346 | Lot B277151, 1:33 |
| Antibody | Mouse monoclonal anti-human CD34 (clone 581) | Fluidigm | Cat # 3163014B; RRID:AB_2811091 | Lot 2651705, 1:33 |
| Antibody | Mouse monoclonal anti-human CD38 (clone HIT2) | Fluidigm | Cat # 3172007B; RRID:AB_2756288 | Lot 0861906, 1:100 |
| Antibody | Mouse monoclonal anti-human CD4 (clone RPA-T4) | Fluidigm | Cat # 3145001; RRID:AB_2661789 | Lot 2681902, 1:100 |
| Antibody | Mouse monoclonal Anti-Human CD45 (Clone HI30) | Fluidigm | Cat # 3089003B; RRID:AB_2661851 | Lot 2801911, 1:100 |
| Antibody | Mouse monoclonal anti-human CD45RA (clone HI100) | BioLegend | Cat # 304102; RRID:AB_314406 | Lots B295482, B255475, 1:33 |
| Antibody | Mouse monoclonal anti-human CD45RO (clone UCHL1) | Fluidigm | Cat # 3164007B; RRID:AB_2811092 | Lot 2431806, 1:100 |
| Antibody | Mouse monoclonal anti-human CD56 (clone N901) | Fluidigm | Cat # 3176009B; RRID:AB_2811096 | Lot 3171701, 1:50 |
| Antibody | Mouse monoclonal anti-human CD7 (clone CD7-6B7) | DVS Sciences | Cat # 3153014B; RRID:AB_2811084 | Lot 0282010, 1:100 |
| Antibody | Mouse monoclonal anti-human CD8a (clone RPA-T8) | Fluidigm | Cat # 3162015; RRID:AB_2661802 | Lot 0171813, 1:100 |
| Antibody | Mouse monoclonal anti-human CD95 (clone DX2) | BioLegend | Cat # 305602; RRID:AB_314540 | Lot B241963, 1:67 |
| Antibody | Mouse monoclonal anti-human HLA-DR (clone L243) | Fluidigm | Cat # 3174001B; RRID:AB_2665397 | Lot 0991901, 1:100 |
| Antibody | Mouse monoclonal anti-human IgD (clone IA6-2) | Fluidigm | Cat # 3146005B; RRID:AB_2811082 | Lot 2561908, 1:100 |
| Antibody | Mouse monoclonal anti-human IgM (clone MHM-88) | BioLegend | Cat # 314502; RRID:AB_493003 | Lot B264164, 1:33 |
| Antibody | Mouse monoclonal anti-human PD-L1 (clone 29E.2A3) | Fluidigm | Cat # 3156026; RRID:AB_2687855 | Lot 2761903, 1:100 |
| Antibody | Mouse monoclonal anti-human PICP (Clone PCIDG10) | Millipore | Cat # MAB1913; RRID:AB_94406 | Lots 3328869, 3389939, 1:133 |
| Antibody | Mouse monoclonal anti-human EMR1 (Clone BM8) | BioLegend | Cat # 123102; RRID:AB_893506 | Lot B264265, 1:33 |
| Antibody | Mouse monoclonal anti-human TCR Va7.2 (Clone 3 C10) | BioLegend | Cat # 351702; RRID:AB_10900258 | Lots B282453, 1:33 |
| Antibody | Mouse monoclonal anti-human FOXP3 (clone 259D/C7) | Fluidigm | Cat # 3159028 A; RRID:AB_2811088 | Lots 1812006, 2631804, 1:50 |
| Antibody | Rabbit monoclonal anti-human phospho-4E-BP1 (Thr37/Thr46) (clone 236B4) | Cell Signaling Technology | Cat # 2855; RRID:AB_560835 | Lots 29, 31, 1:20 |
| Antibody | Rabbit monoclonal anti-human phospho-STAT1 (Tyr701) (clone 58D6) | Cell Signaling Technology | Cat # 9167; RRID:AB_561284 | Lot 22, 1:400 |
| Antibody | Mouse monoclonal anti-human GZMB (clone GB11) | Fluidigm | Cat # 3173006B; RRID:AB_2811095 | Lot 1611909, 1:100 |
| Antibody | Mouse monoclonal anti-human CD11b (Clone ICRF44) | BioLegend | Cat # 301302; RRID:AB_314154 | Lot B286270, 1:33 |
| Antibody | Mouse monoclonal anti-human TCRgd (Clone 11 F2) | BioLegend | Cat # 331202; RRID:AB_1089222 | Lot B271574, 1:33 |
| Antibody | Mouse monoclonal anti-human Cleaved PARP (Clone F21-852) | BD Pharmingen Customs | Cat # 624084; RRID:NA | Lot 9326323, 1:33 |
| Antibody | Mouse monoclonal anti-human RORgt (Clone 4F3-3C8-2B7) | BioLegend | Cat # 644902; RRID:AB_1595502 | NA, 1:33 |
| Antibody | Mouse monoclonal anti-human T-bet (Clone 4B10) | BioLegend | Cat # 644802; RRID:AB_2810251 | Lot B335065, 1:33 |
| Antibody | Mouse monocloncal anti-human CD66b (Clone G10f5) | BioLegend | Cat # 305102; RRID:AB_314494 | Lot B298277, 1:308 |
| Commercial assay or kit | PAXgene Blood RNA tubes | Qiagen | Cat # 762165 | |
| Commercial assay or kit | PAXgene Blood RNA Kit | Qiagen | Cat # 762164 | |
| Commercial assay or kit | Allprep DNA/RNA/miRNA Universal Kit | Qiagen | Cat # 80224 | |
| Commercial assay or kit | GlobinClear kit | ThermoFisher Scientific | Cat # AM1980 | |
| Commercial assay or kit | NEBNext Poly(A) mRNA Magnetic Isolation Module | New England Biolabs | Cat # E7490 | |
| Commercial assay or kit | NEBNext Ultra II Directional RNA Library Prep Kit for Illumina | New England Biolabs | Cat # E7760; | |
| Commercial assay or kit | V-PLEX Human Biomarker 54-Plex | MesoScale Discovery | Cat # K15248D | |
| Commercial assay or kit | Transcription Factor Phospho Buffer Set | BD Pharmingen | Cat # 563239 | |
| Commercial assay or kit | Cell Staining Buffer | Fluidigm | Cat # 201068 | |
| Commercial assay or kit | Cell-IDTM 20- Plex Pd Barcoding Kit | Fluidigm | Cat # PRD023 | |
| Commercial assay or kit | Cell-ID Intercalator-Ir | Fluidigm | Cat # 201192 A | |
| Commercial assay or kit | Maxpar Antibody Labeling Kit | Fluidigm | Cat # 201160B | |
| Software, algorithm | R | R Foundation for Statistical Computing | v4.3.1; RRID:SCR_001905 | |
| Software, algorithm | R Studio | R Studio, Inc | v2023.09.1+494; RRID:SCR_000432 | |
| Software, algorithm | Bioconductor | Bioconductor | v3.17; RRID:SCR_006442 | |
| Software, algorithm | Tidyverse collection of packages for R | CRAN | RRID:SCR_019186 | |
| Software, algorithm | limma package for R | Bioconductor | v3.56.2; RRID:SCR_010943 | |
| Software, algorithm | FASTQC | Babraham Institute | v0.11.5; RRID:SCR_014583 | |
| Software, algorithm | FastQ Screen | Babraham Institute | v0.11.0; RRID:SCR_000141 | |
| Software, algorithm | bbduk/BBTools | Bushnell et al., 2017 | v37.99; RRID:SCR_016968 | |
| Software, algorithm | fastq-mcf/ea-utils | N/A | v1.05; RRID:SCR_005553 | |
| Software, algorithm | HISAT2 | Kim et al., 2019 | v2.1.0; RRID:SCR_015530 | |
| Software, algorithm | Human genome sequence primary assembly fasta | Gencode | GRCh38; RRID:SCR_014966 | |
| Software, algorithm | Human genome basic annotation GTF file | Gencode | v33; RRID:SCR_014966 | |
| Software, algorithm | Samtools | N/A | v1.5; RRID:SCR_002105 | |
| Software, algorithm | HTSeq-count | N/A | v0.6.1; RRID:SCR_005514 | |
| Software, algorithm | DESeq2 package for R | Bioconductor | v1.28.1; RRID:SCR_015687 | |
| Software, algorithm | fgsea package for R | Bioconductor | v1.26.0; RRID:SCR_020938 | |
| Software, algorithm | Hmisc package for R | CRAN | V5.1.1; RRID:SCR_022497 | |
| Software, algorithm | ggplot2 package for R | CRAN | v3.4.4; RRID:SCR_014601 | |
| Software, algorithm | rstatix package for R | CRAN | v0.7.2; RRID:SCR_021240 | |
| Software, algorithm | ComplexHeatmap package for R | CRAN | v2.4.2; RRID:SCR_017270 | |
| Software, algorithm | tidyheatmap package for R | CRAN | V1.8.1 | |
| Software, algorithm | ggforce package for R | CRAN | v0.4.1 | |
| Software, algorithm | CellEngine | CellCarta, Montreal, Canada | RRID:SCR_022484 | |
| Software, algorithm | flowCore package for R | Hahne et al., 2009; Bioconductor | v2.0.1; RRID:SCR_002205 | |
| Software, algorithm | CATALYST package for R | Chevrier et al., 2018; Bioconductor | v1.12.2; RRID:SCR_017127 | |
| Software, algorithm | FlowSOM package for R | Van Gassen et al., 2015 | v1.20.0; RRID:SCR_016899 | |
| Software, algorithm | ConsensusClusterPlus package for R | Bioconductor; Wilkerson and Waltman, 2010 | v1.52.0; RRID:SCR_016954 | |
| Software, algorithm | tidySingleCellExperiment package for R | Bioconductor | v1.3.3; RRID:SCR_022493 | |
| Software, algorithm | MEM package for R | Diggins et al., 2017 | v3; RRID:SCR_022495 | |
| Software, algorithm | Betareg package for R | CRAN; Cribari-Neto et al., 2021 | v3.1–4; RRID:SCR_022494 | |
| Software, algorithm | Ggeffects package for R | CRAN; Lüdecke et al., 2021 | v1.1.0; RRID:SCR_022496 | |
| Software, algorithm | cluster package for R | CRAN | v2.1.0 | |
| Software, algorithm | janitor package for R | CRAN | v2.0.1 |
Additional files
-
Supplementary file 1
Cohort characteristics for participants in the Human Trisome Project involved in this study and for subsets of this cohort that were included in specific analyses.
- https://cdn.elifesciences.org/articles/99323/elife-99323-supp1-v1.xlsx
-
Supplementary file 2
Characteristics of clinical trial cohort.
(A) Minimum qualifying scores for skin conditions. (B) Cohort characteristics for clinical trial participants.
- https://cdn.elifesciences.org/articles/99323/elife-99323-supp2-v1.xlsx
-
MDAR checklist
- https://cdn.elifesciences.org/articles/99323/elife-99323-mdarchecklist1-v1.docx
-
Reporting standard 1
Clinical trial.
- https://cdn.elifesciences.org/articles/99323/elife-99323-repstand1-v1.pdf
Download links
A two-part list of links to download the article, or parts of the article, in various formats.
Downloads (link to download the article as PDF)
Open citations (links to open the citations from this article in various online reference manager services)
Cite this article (links to download the citations from this article in formats compatible with various reference manager tools)
JAK inhibition decreases the autoimmune burden in Down syndrome
eLife 13:RP99323.
https://doi.org/10.7554/eLife.99323.3


