Dynamic basis of lipopolysaccharide export by LptB2FGC
- Department of Physics, Freie Universität Berlin, Germany
- Institute of Physical and Theoretical Chemistry, Goethe Universität Frankfurt, Germany
Figures
Figure 1 with 1 supplement
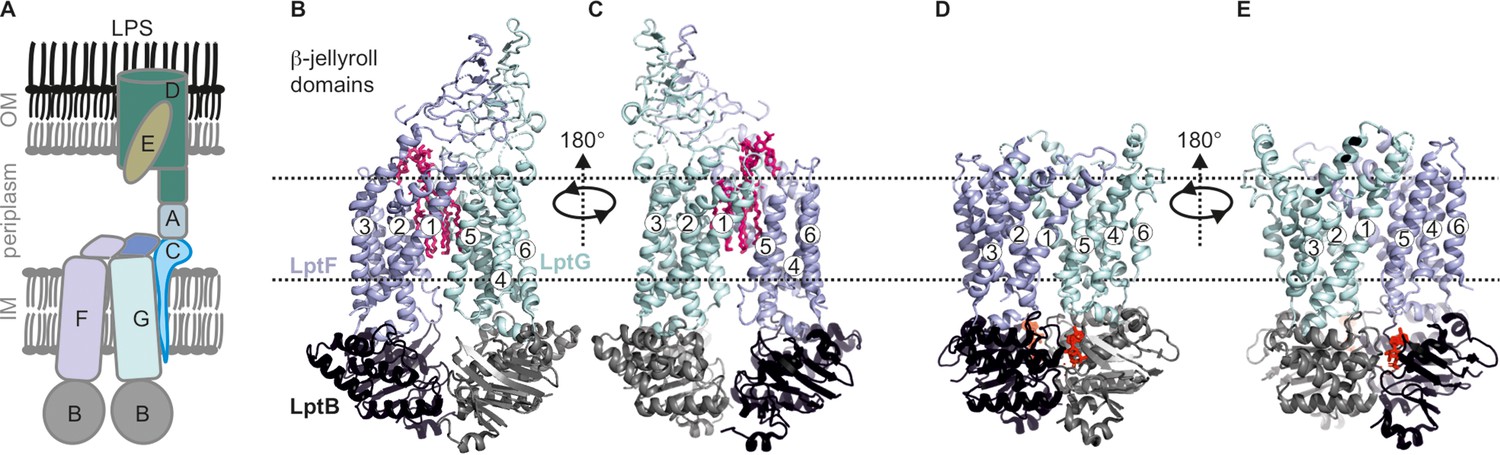
Lipopolysaccharide transport (Lpt) system.
(A) the Lpt system consists of the LptB2FG-C complex located in the inner membrane (IM). Periplasmic LptA connects this complex with LptDE, which is located in the outer membrane (OM). (B, C) Structures of LptB2FG in the LPS-bound state (PDB ID: 6MHU) or (D, E) in the vanadate-trapped state (PDB ID: 6MHZ) are shown. In the vanadate-trapped structure, the cavity is collapsed with no space for LPS and the β-jellyroll domains are not resolved. The LPS molecule (magenta) and nucleotides (red) are highlighted.
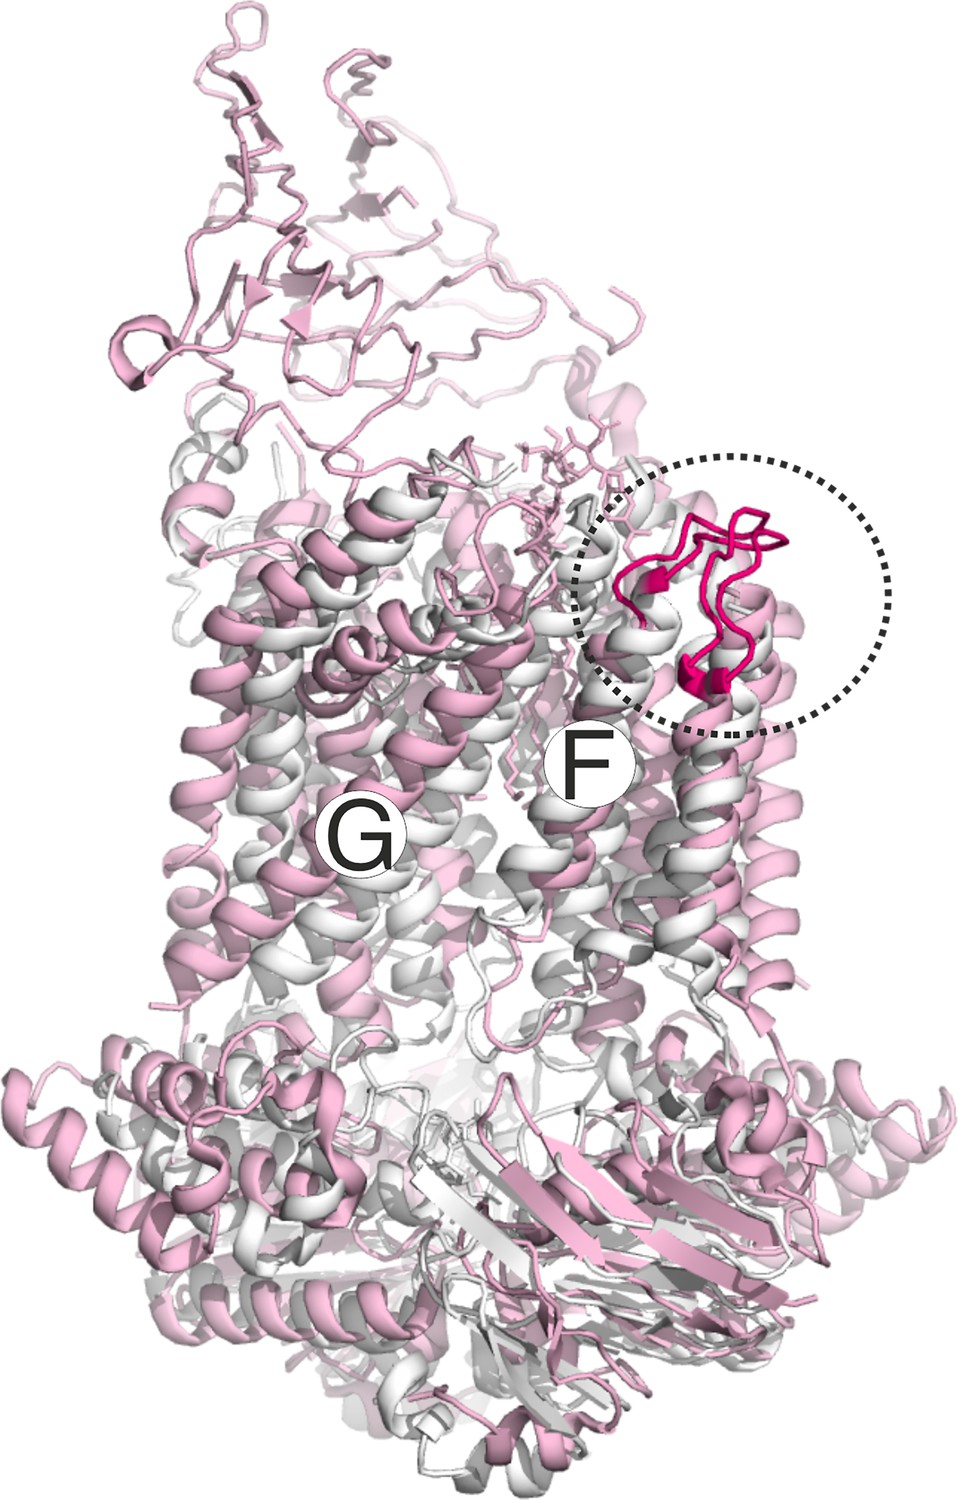
Figure 1—figure supplement 1
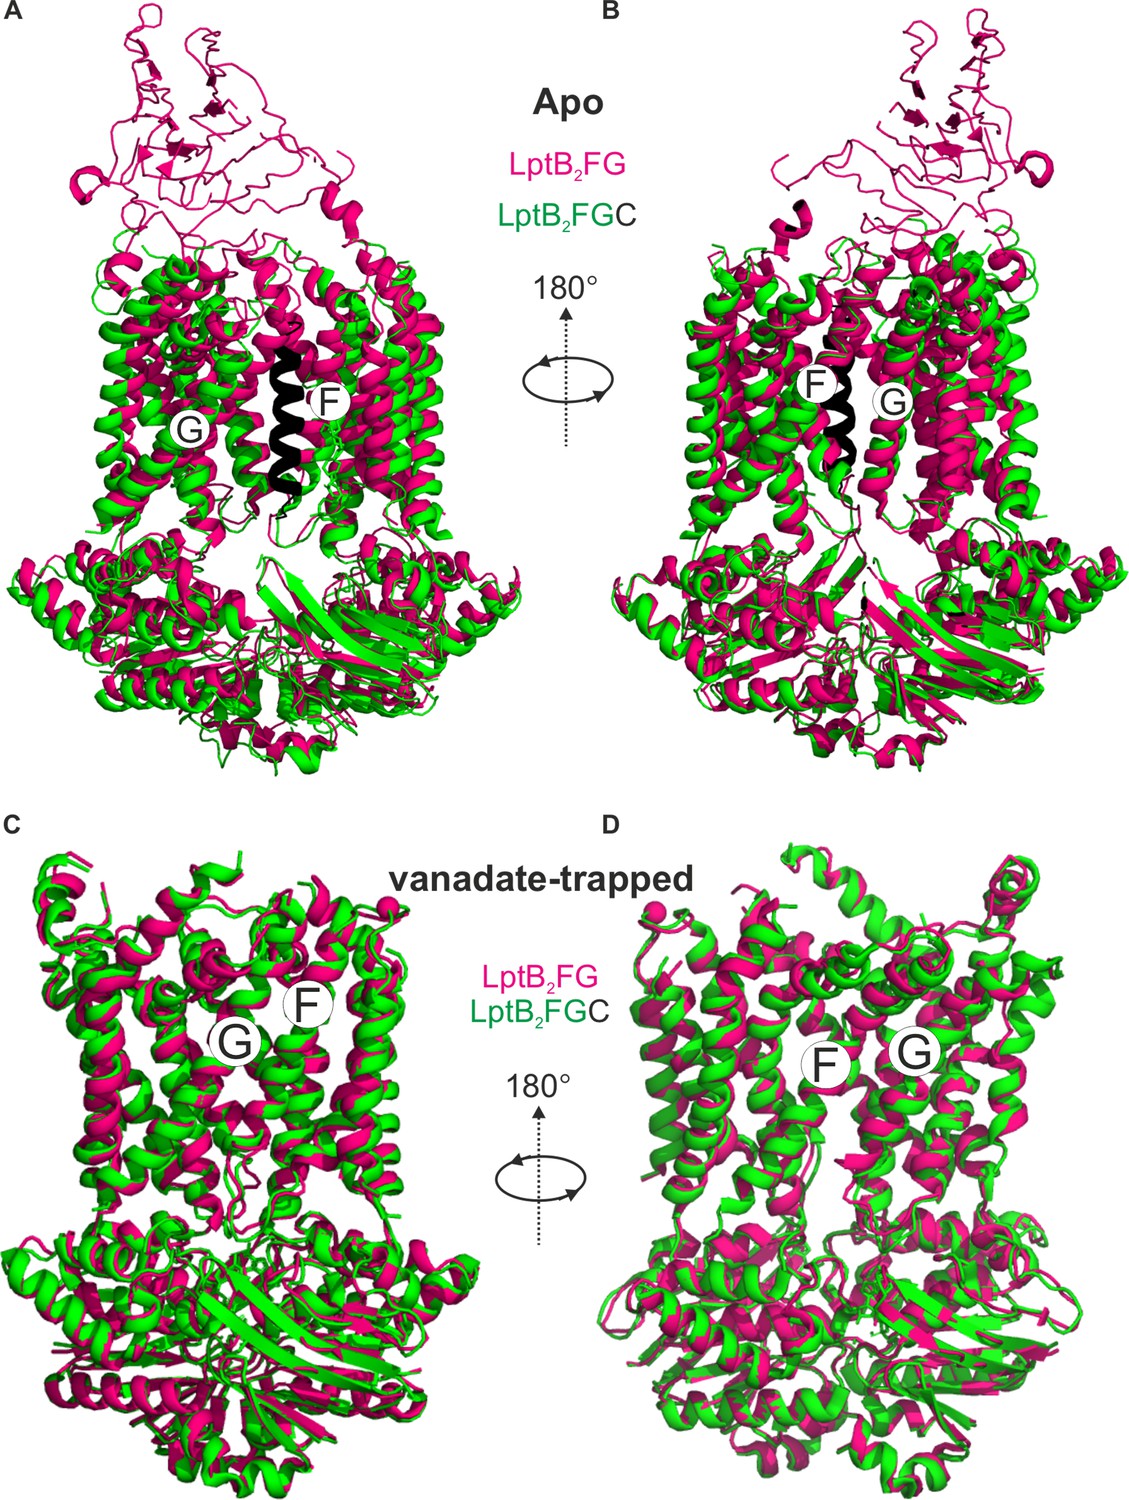
LptB2FG and LptB2FGC structures in the apo and vanadate-trapped states.
(A) E. coli LptB2FG (magenta, PDB ID: 6MHU) and LptB2FGC (LptB2FG subunits in green and LptC in black, PDB ID: 6MI7) structures in the apo state are overlaid. The gating helices named as G and F moves apart upon binding LptC. A view from the other lateral gate is shown in (B). (C, D) E. coli LptB2FG (magenta, PDB ID: 6MHZ) and LptB2FGC (PDB ID: 6MI8) structures in the vanadate-trapped states are overlaid. The TM-LptC as well as the β-jellyroll domains are not resolved in the vanadate-trapped state and the structures are nearly identical with an overall RMDS of 0.99 Å.
Figure 2 with 4 supplements

DEER/PELDOR data for the NBDs of LptB2FG in micelles and PLS.
(A–D, F–G) Primary data overlaid with the fits obtained using the DeerLab (Fábregas Ibáñez et al., 2020) program (A-D in micelles) or ComparitiveDeerAnalyzer (Fábregas Ibáñez et al., 2020; Worswick et al., 2018 F-G in PLS) are shown in the left panels. The obtained distance distributions with a 95% confidence interval are shown on the right. Simulations for the open (PDB ID: 6MHU) or closed (PDB ID: 6MHZ) structures are overlaid with the apo or vanadate-trapped distances, respectively (in dotted orange line). (E) The spin labeled positions (as sphere) and the loops carrying them are highlighted (in red) on the open and closed structures. The PLS samples were analysed using ComparitiveDeerAnalyzer to account for the entire uncertainty including the partial dimensionality for spin distribution over the membrane surface. The color code for the distance distribution (F–G) relates the reliability for different features of the probability distribution with respect to the length of the observed dipolar evolution time. In the green zone, shape, width, and the mean distance are accurate. In the yellow zone, width and the mean, and in the orange zone, the mean distance are reliable. The arrow indicates the conformational change from the apo-state upon nucleotide binding.
-
Figure 2—source data 1
Spin labeling efficiency for cysteine variants of LptB2FG.
- https://cdn.elifesciences.org/articles/99338/elife-99338-fig2-data1-v1.docx
Figure 2—figure supplement 1
Spin labeled positions in LptB2FG.
Figure 2—figure supplement 2
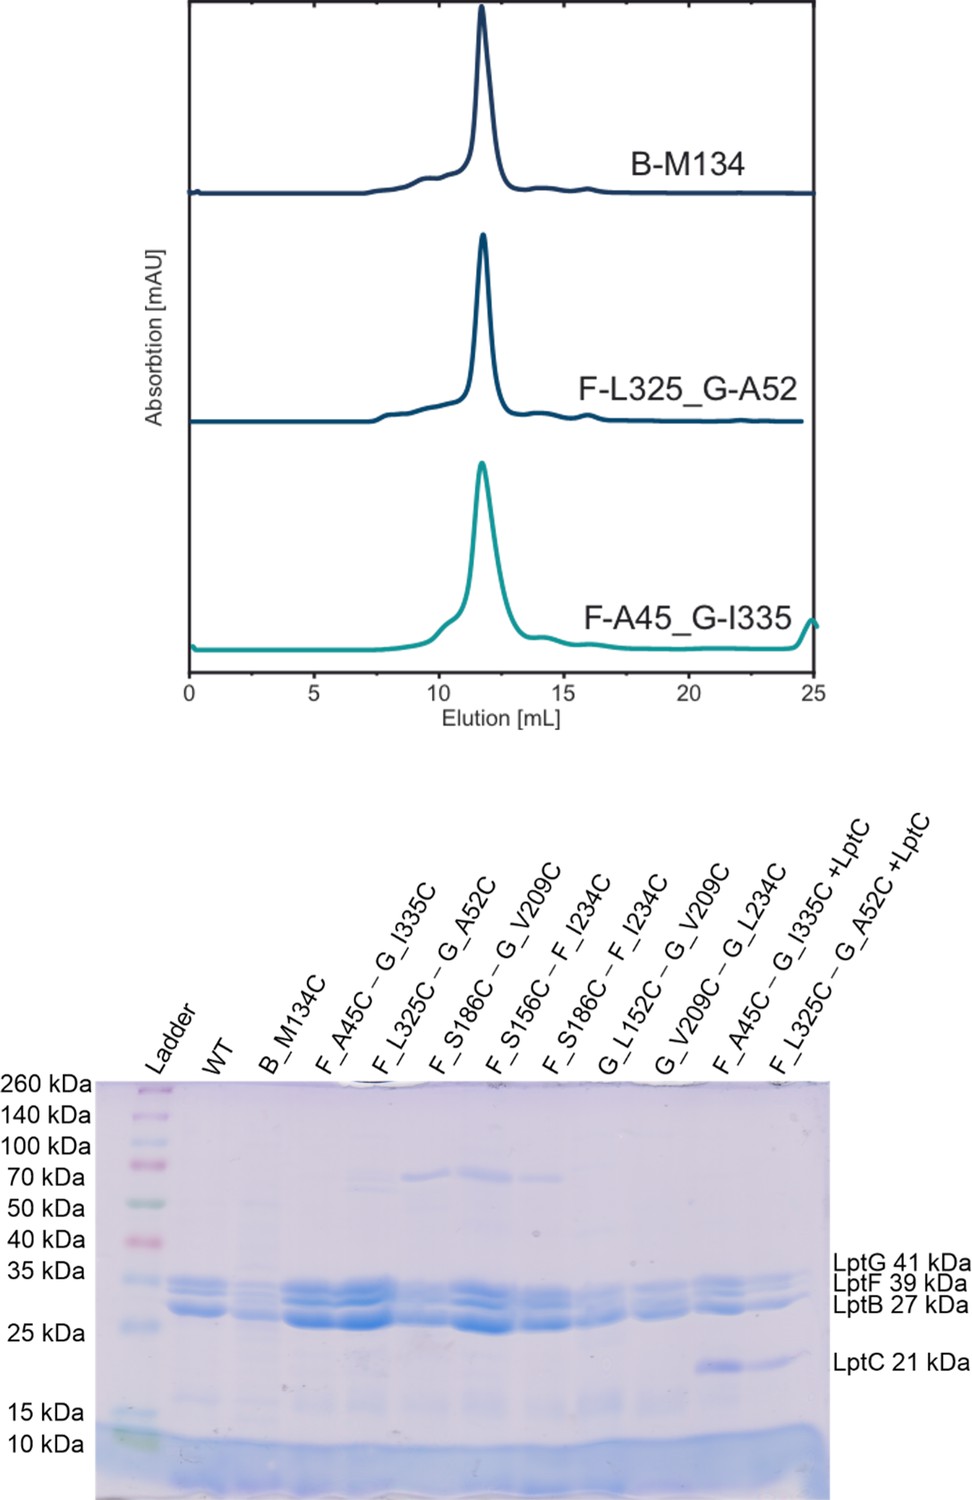
Size-exclusion chromatography (SEC) and SDS-PAGE for WT and spin labeled cysteine variants of LptB2FG and LptB2FGC.
(Top panel) Typical SEC profiles for selected spin labeled variants as indicated are shown. (Bottom panel) SDS-PAGE gel. Proteins were collected from SEC column and the molecular weight of the subunits are indicated (LptG 41 kDa, LptF 39 kDa, LptB 27 kDa, and LptC 21 kDa). The data also relates to Figures 3—6.
-
Figure 2—figure supplement 2—source data 1
Raw, unedited gel shown in Figure 2—figure supplement 2.
- https://cdn.elifesciences.org/articles/99338/elife-99338-fig2-figsupp2-data1-v1.tiff
-
Figure 2—figure supplement 2—source data 2
Uncropped, labelled gel shown in Figure 2—figure supplement 2.
- https://cdn.elifesciences.org/articles/99338/elife-99338-fig2-figsupp2-data2-v1.pdf
Figure 2—figure supplement 3
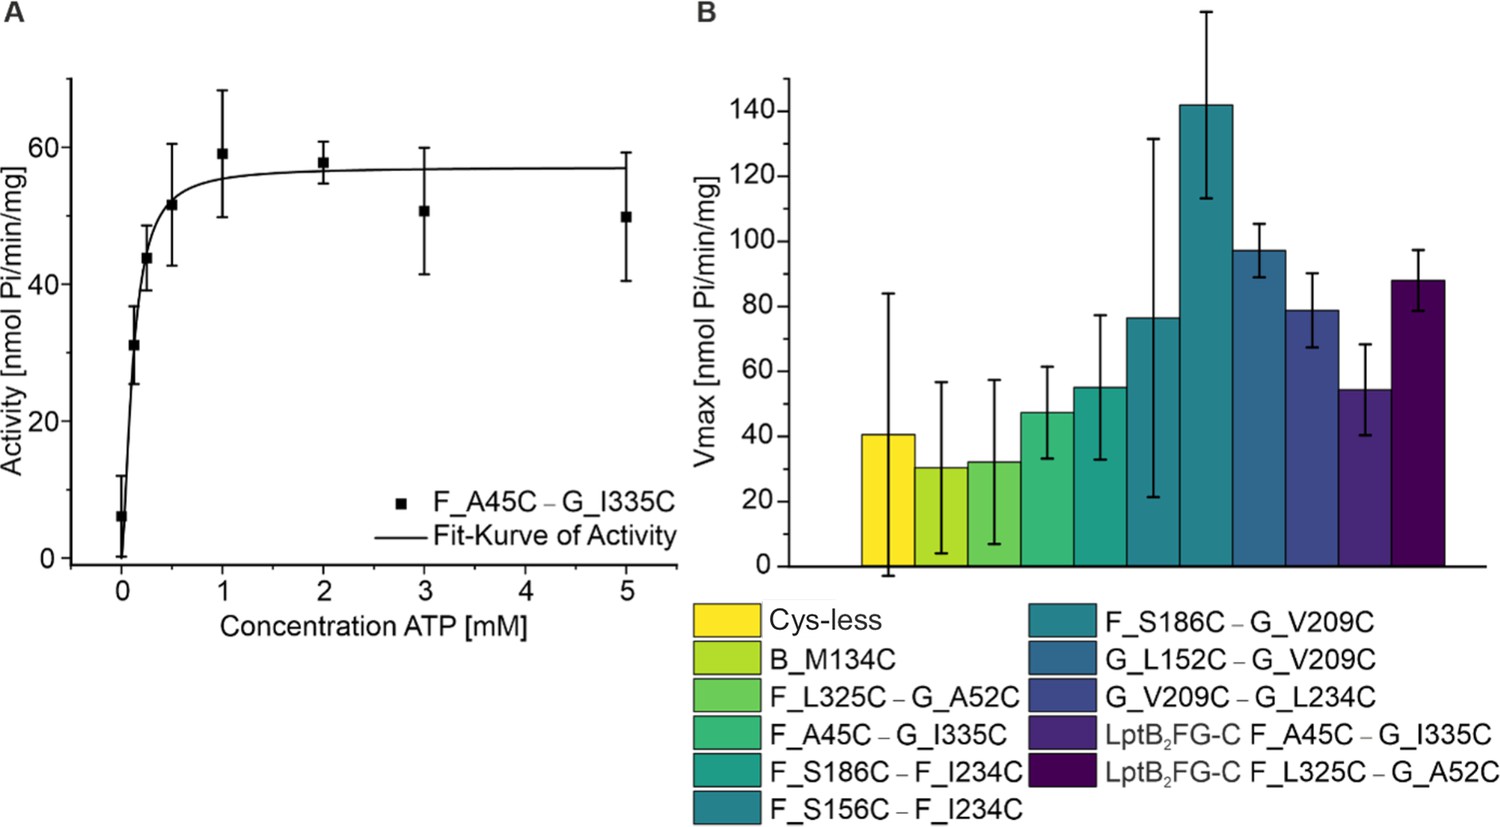
ATPase assay for spin labeled variants of LptB2FG and LptB2FGC.
The functionality of the spin labeled proteins were characterized using ATPase assay and typical reaction curve is shown (left). The corresponding Vmax values are shown (right, n = 3). All the variants actively hydrolysed ATP, in line with the conformational changes observed from PELDOR/DEER experiments following vanadate-trapping (Figures 2—6). As the variants are spin labeled at different positions, a quantitative comparison between the values is omitted. The data also relates to Figures 3—6.
Figure 2—figure supplement 4
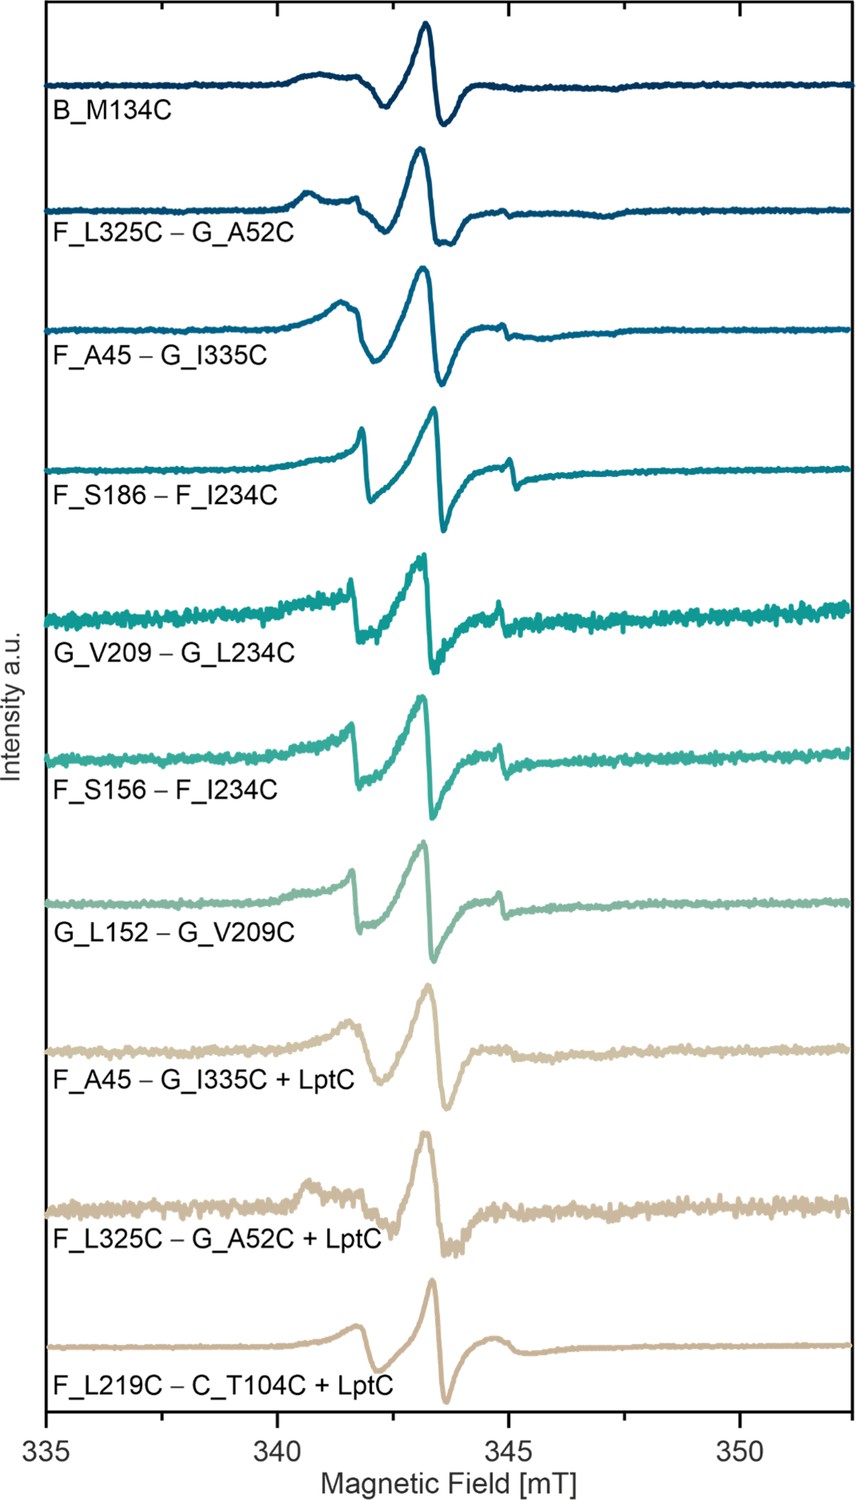
Room temperature continuous wave ESR spectroscopy of MTSL labeled variants in micelles.
Figure 3
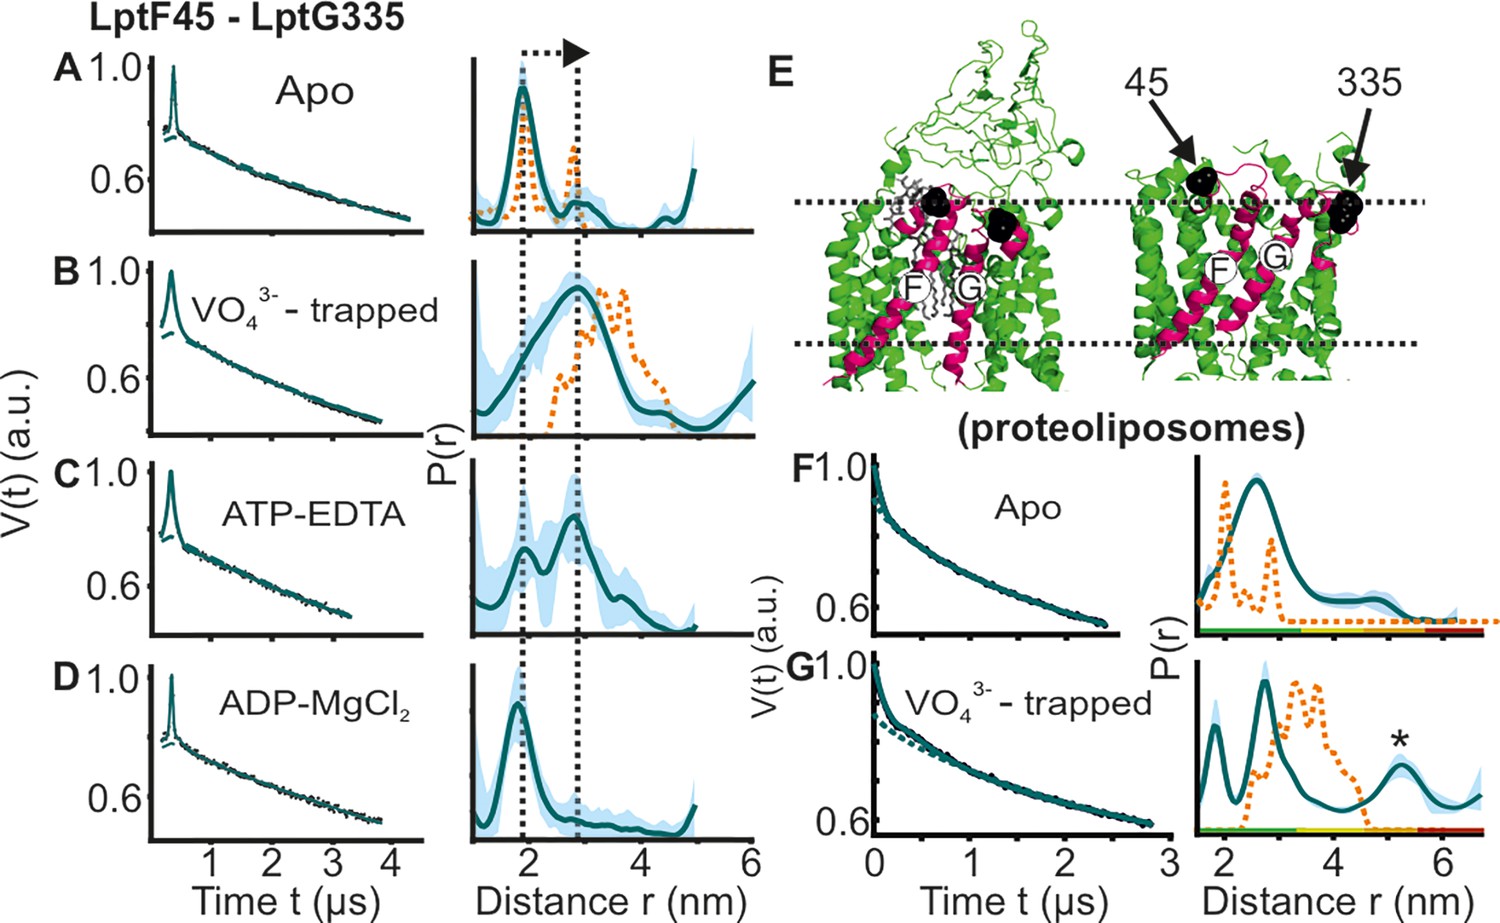
DEER/PELDOR data for the lateral gate-1 between LptF-TM1 – LptG-TM5 of LptB2FG in micelles and PLS.
Primary data overlaid with the fits obtained using the DeerLab program (A-D in micelles) or ComparitiveDeerAnalyzer (F-G in PLS) are shown in the left panels. The obtained distance distributions with a 95% confidence interval are shown on the right. (E) The spin labeled positions are highlighted on the open (PDB ID: 6MHU) and closed (PDB ID: 6MHZ) structures and the corresponding simulations are overlaid with the apo or vanadate-trapped distances, respectively (in dotted orange line). The distance peak indicated with an asterisk in G is not interpreted for the reason of a larger uncertainty. The color code for the distance distribution (F–G) corresponds to the description as given in Figure 2. The arrow indicates the conformational change from the apo-state upon nucleotide binding.
Figure 4 with 2 supplements
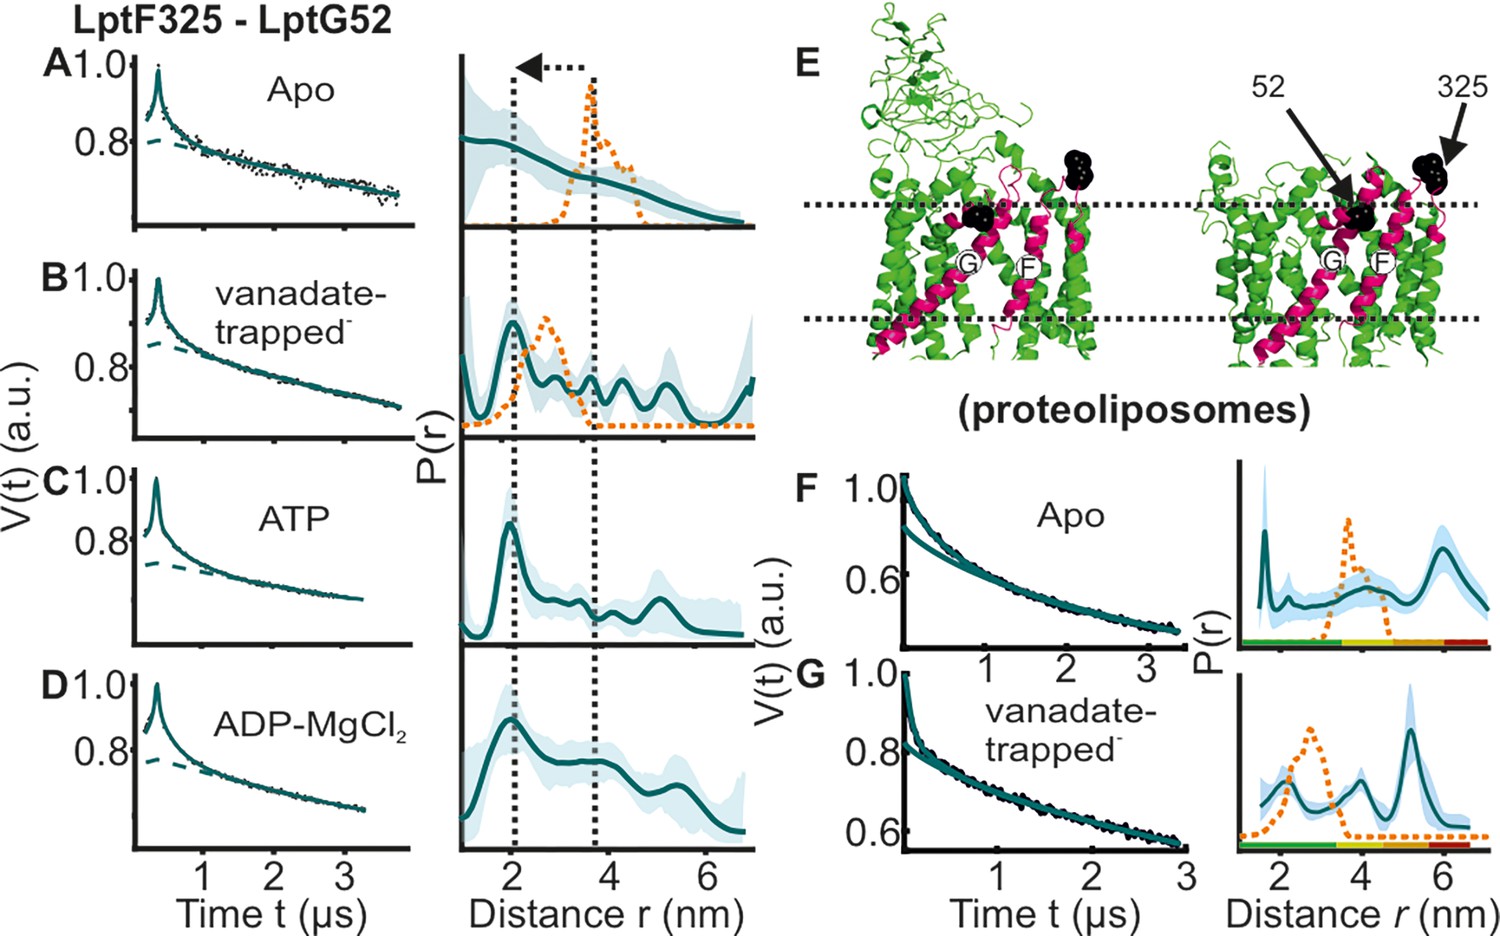
DEER/PELDOR data for the lateral gate-2 between LptF-TM5 – LptG-TM1 of LptB2FG in micelles and PLS.
Primary data overlaid with the fits obtained using the DeerLab program (A-D in micelles) and DeerNet (F) or ComparitiveDeerAnalyzer (G) in PLS are shown in the left panels. The obtained distance distributions with a 95% confidence interval are shown on the right. Due to a larger uncertainty arising from the broad distribution and the limited time-window, output from DeerNet is shown in F. (E) The spin labeled positions are highlighted on the open (PDB ID: 6MHU) and closed (PDB ID: 6MHZ) structures and the corresponding simulations are overlaid with the apo or vanadate-trapped distances, respectively (in dotted orange line). The color code for the distance distribution (F–G) corresponds to the description as given in Figure 2. The arrow indicates the conformational change from the apo-state upon nucleotide binding.
Figure 4—figure supplement 1
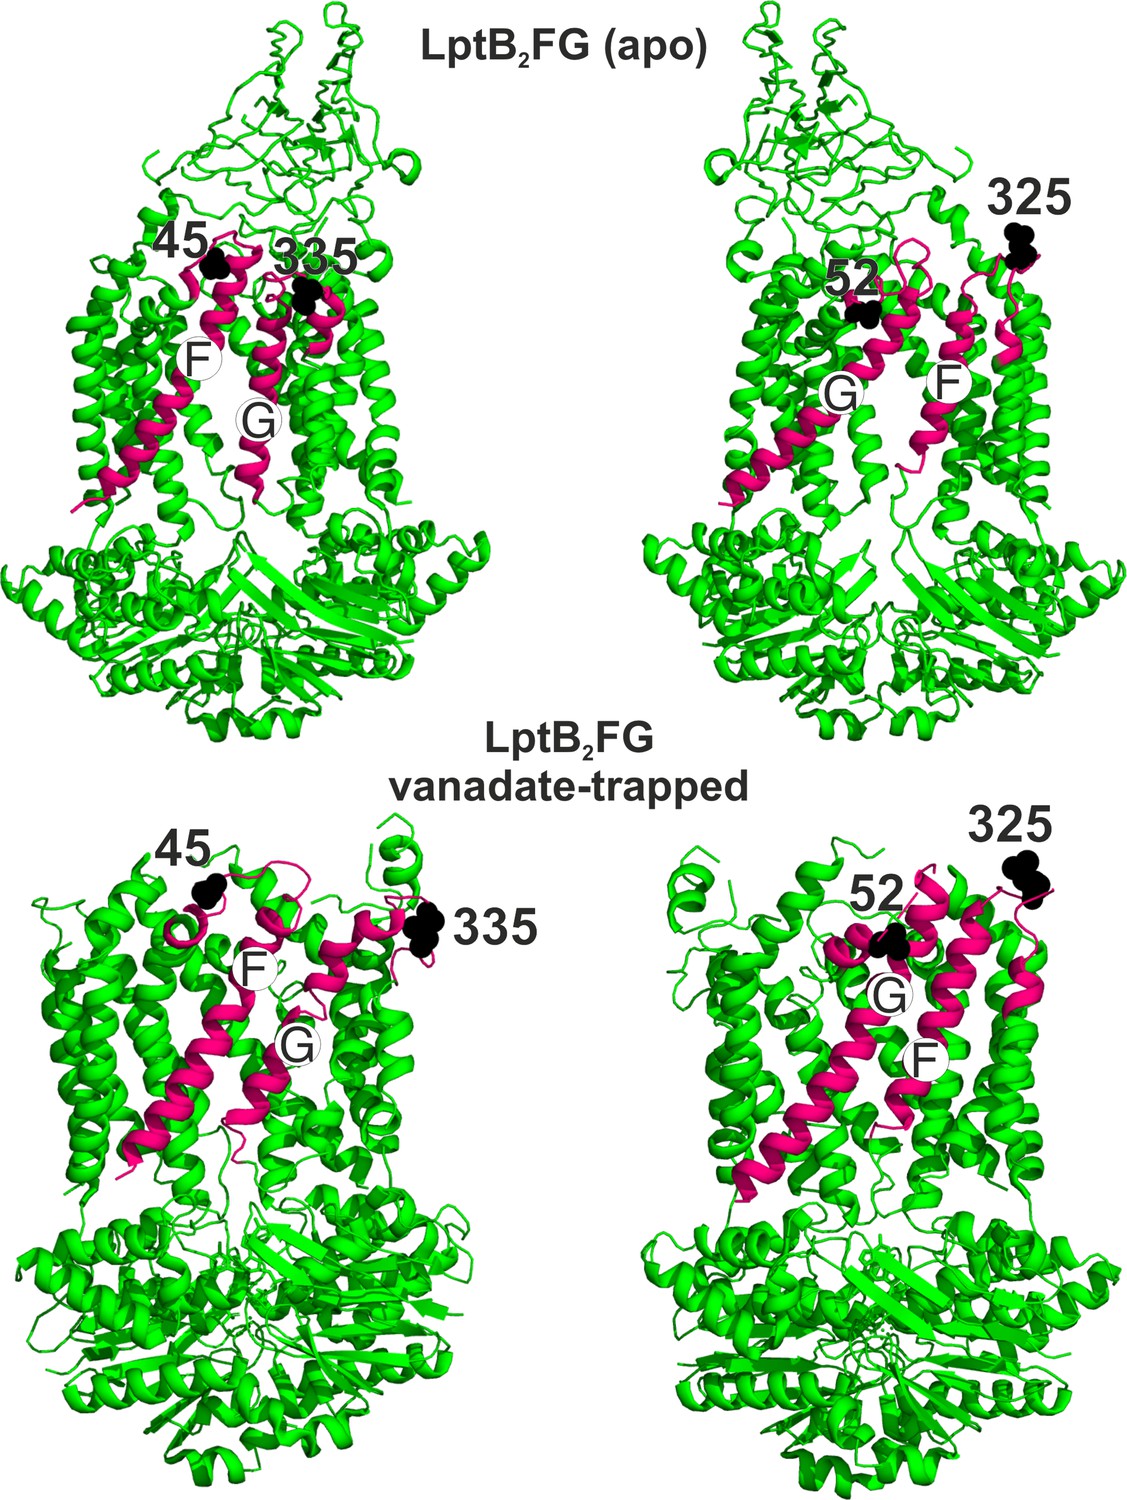
Conformation of the loop carrying the spin labeled position 325 in LptF at the second lateral gate.
LptB2FG apo (pink, PDB ID: 6MHU) and vanadate-trapped (grey, PDB ID: 6MHZ) structures are overlaid. The loop carrying the spin labeled position L325 is highlighted (magenta), which has a rather similar conformation in the two structures.
Figure 4—figure supplement 2
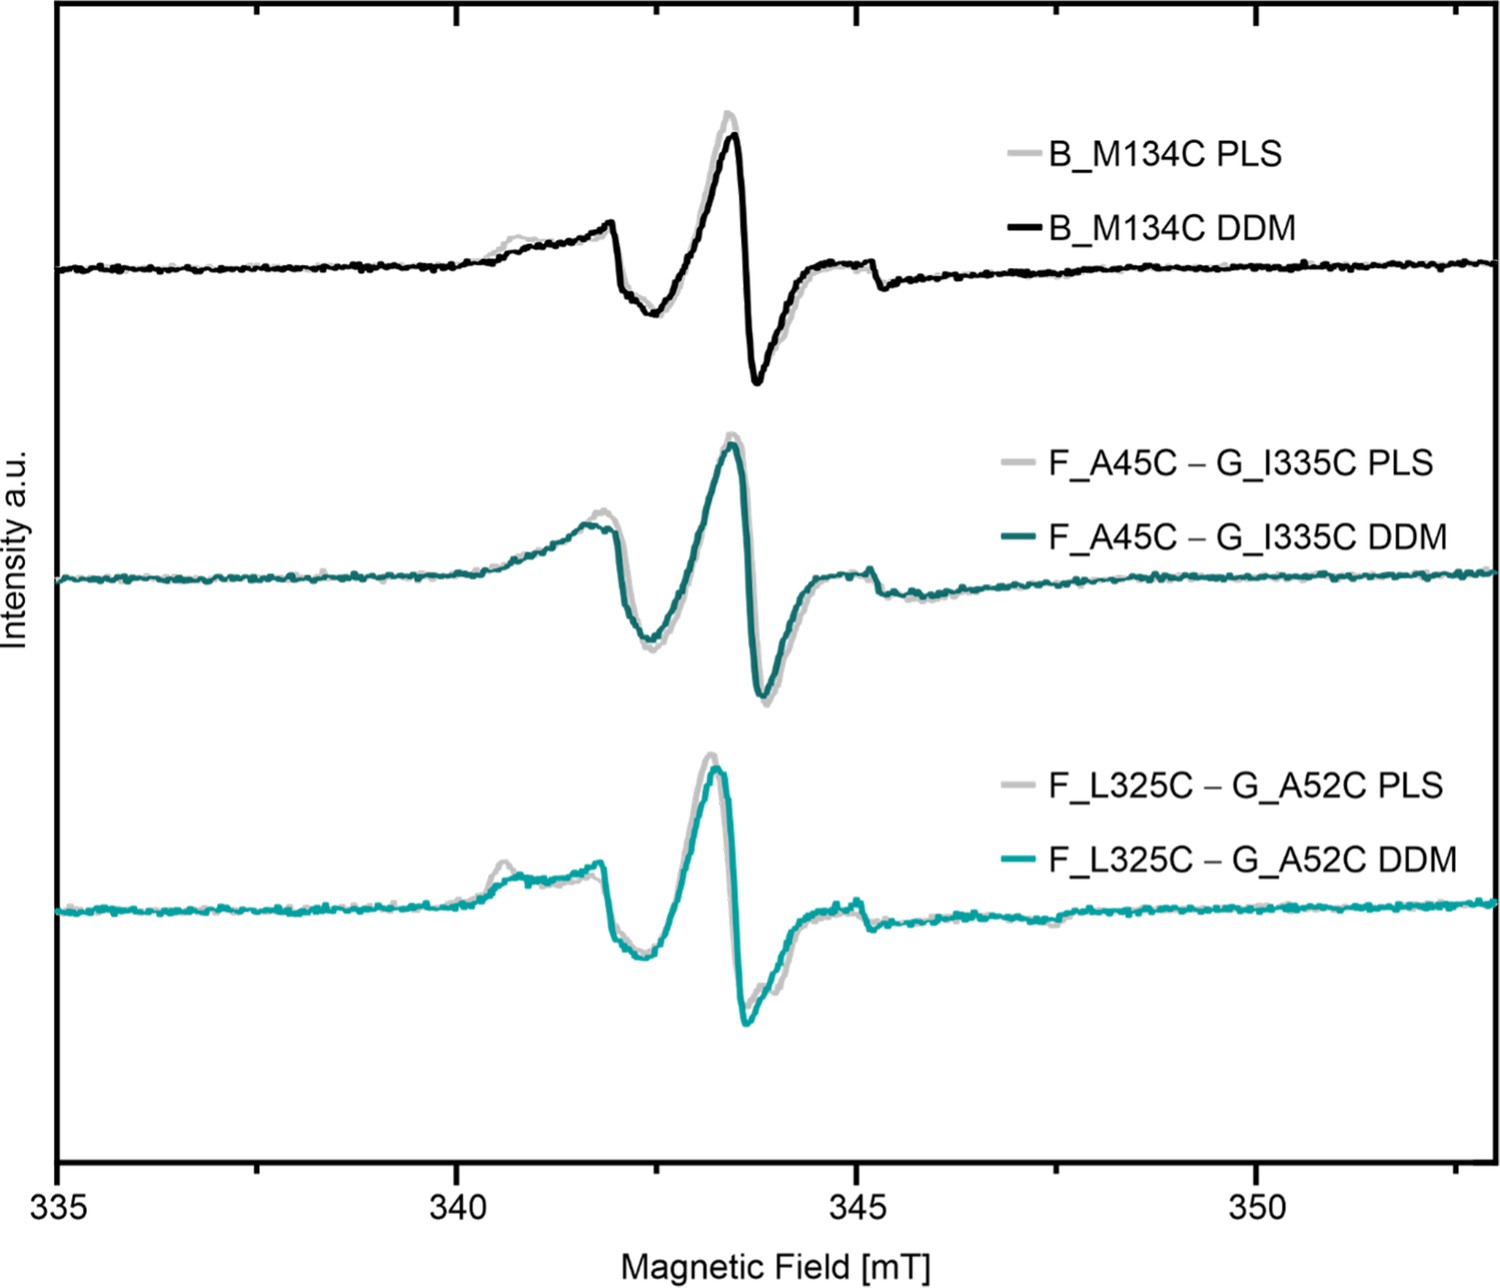
Comparison of room temperature continuous wave ESR spectroscopy of MTSL labeled variants between DDM micelles and proteoliposomes (PLS).
Corresponding spectra for spin labeled LptB2FG variants in liposomes and DDM micelles are shown.
Figure 5
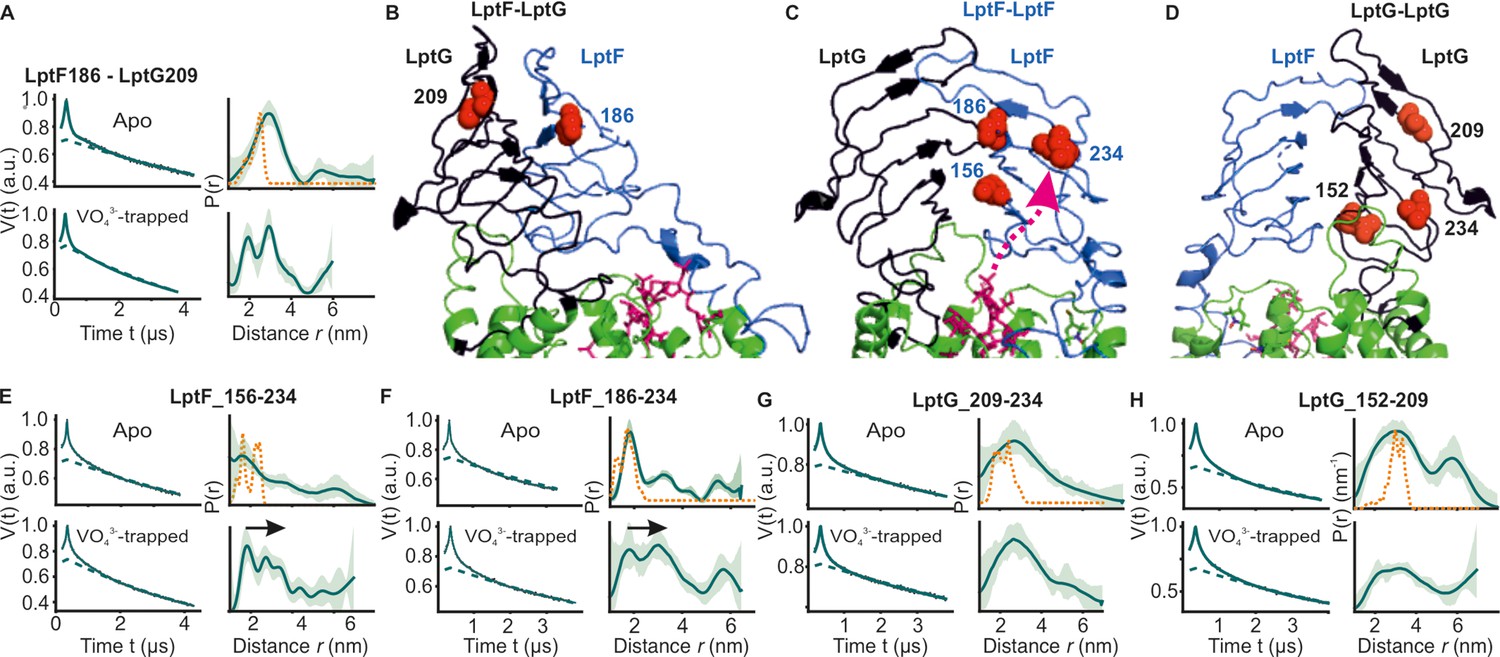
DEER/PELDOR data for β-jellyroll domains of LptB2FG.
(A) Primary data for LptF-LptG β-jellyrolls overlaid with the fits obtained using the DeerLab (Fábregas Ibáñez et al., 2020) program are shown in the left panels. The obtained distance distributions with a 95% confidence interval are shown on the right. (B–D) The spin labeled positions are highlighted on the LptB2FG apo structure and the bound LPS is shown in stick representation (PDB ID: 6MHU). (E, F) Primary data overlaid with the fits and the corresponding distance distributions (right) from PELDOR experiments within the β-jellyroll domain of LptF or LptG (G, H). Corresponding simulations (where structures are available having the positions resolved) are overlaid (in orange).
Figure 6
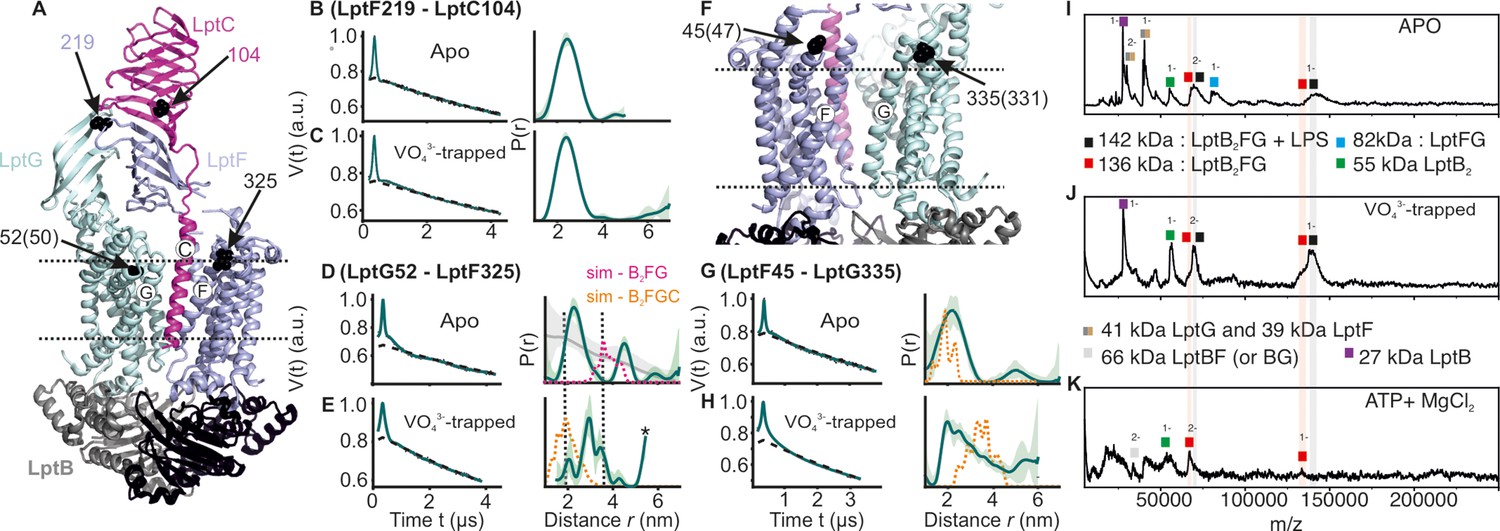
DEER/PELDOR data for the lateral gates of LptB2FGC and LILBID-MS.
(A) The LptB2FGC structure (PDB ID: 6MJP) from Vibrio cholerae. The helices from LptF and LptG forming the lateral gate-2 is shown and the positions analogous to those we investigated in the E. coli structure are highlighted (in sphere representation and indicated with an arrow, when the amino acid number is different, it is indicated inside the bracket). Similarly, the lateral gate-1 is highlighted in panel F. (B–E, G–H) Primary PELDOR data overlaid with the fits obtained using the DeerLab (Fábregas Ibáñez et al., 2020) are shown in the left panels. The obtained distance distributions with a 95% confidence interval are shown on the right. The corresponding distances for LptB2G is overlaid for a comparison (in grey for the apo state) in panel D and asterisk in panel E indicate unreliable distances. Simulation on the LptB2FGC apo structure (in orange) is overlaid. In panel D, corresponding distances for LptB2FG is overlaid (in grey) and the simulation for LptB2FG structure is shown (in magenta) as position L325 is not resolved in the E. coli LptB2FGC structure. (I–K) LILBID-MS data for detergent solubilized LptB2FG in different states as indicated.
Figure 7
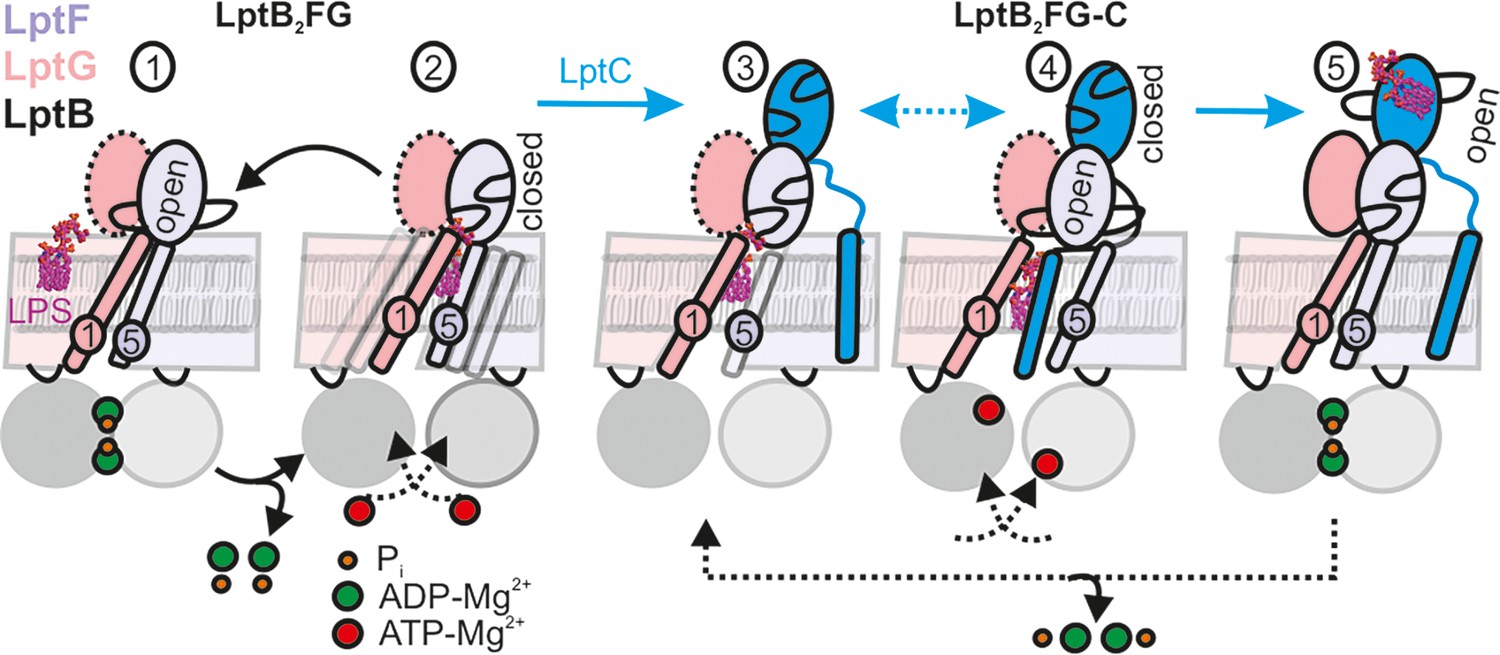
LPS translocation mechanism.
(1-2) The lateral gate-2 formed by LptG-TM1 and LptF-TM5 in LptB2FG, which is dynamic in the apo state (2) is shown (see Figure 4). ATP binding, which leads to hydrolysis (1) collapses the cavity and releases LPS. (3,4) Interaction with LptC limits heterogeneity, creating an equilibrium between TM-LptC inserted and released conformations (Figure 6D). ATP binding opens the periplasmic gate in LptF β-jellyroll (4) and subsequent closure of the NBDs leads to the collapse of the cavity and LPS transfer. As LPS moves to LptC, LptF β-jellyroll might close accompanied with an opening of LptC β-jellyroll (Tang et al., 2019) (5). Dissociation of ADP-Mg2+ will initiate the next cycle according to the Pez mechanism. Dotted line for LptG β-jellyroll indicates enhanced inter-domain dynamics (see Figure 5G–H).
Additional files
Download links
A two-part list of links to download the article, or parts of the article, in various formats.
Downloads (link to download the article as PDF)
Open citations (links to open the citations from this article in various online reference manager services)
Cite this article (links to download the citations from this article in formats compatible with various reference manager tools)
Dynamic basis of lipopolysaccharide export by LptB2FGC
eLife 13:RP99338.
https://doi.org/10.7554/eLife.99338.3


