The theory of massively repeated evolution and full identifications of cancer-driving nucleotides (CDNs)
- State Key Laboratory of Biocontrol, School of Life Sciences, Sun Yat-sen University, China
- State Key Laboratory of Genetic Resources and Evolution/Yunnan Key Laboratory of Biodiversity Information, Kunming Institute of Zoology, The Chinese Academy of Sciences, China
- GMU-GIBH Joint School of Life Sciences, Guangzhou Medical University, China
- CAS Key Laboratory of Quantitative Engineering Biology, Shenzhen Institute of Synthetic Biology, Institute of Advanced Technology, Chinese Academy of Sciences, China
- Innovation Center for Evolutionary Synthetic Biology, Sun Yat-sen University, China
- Department of Ecology and Evolution, University of Chicago, United States
Figures
Figure 1
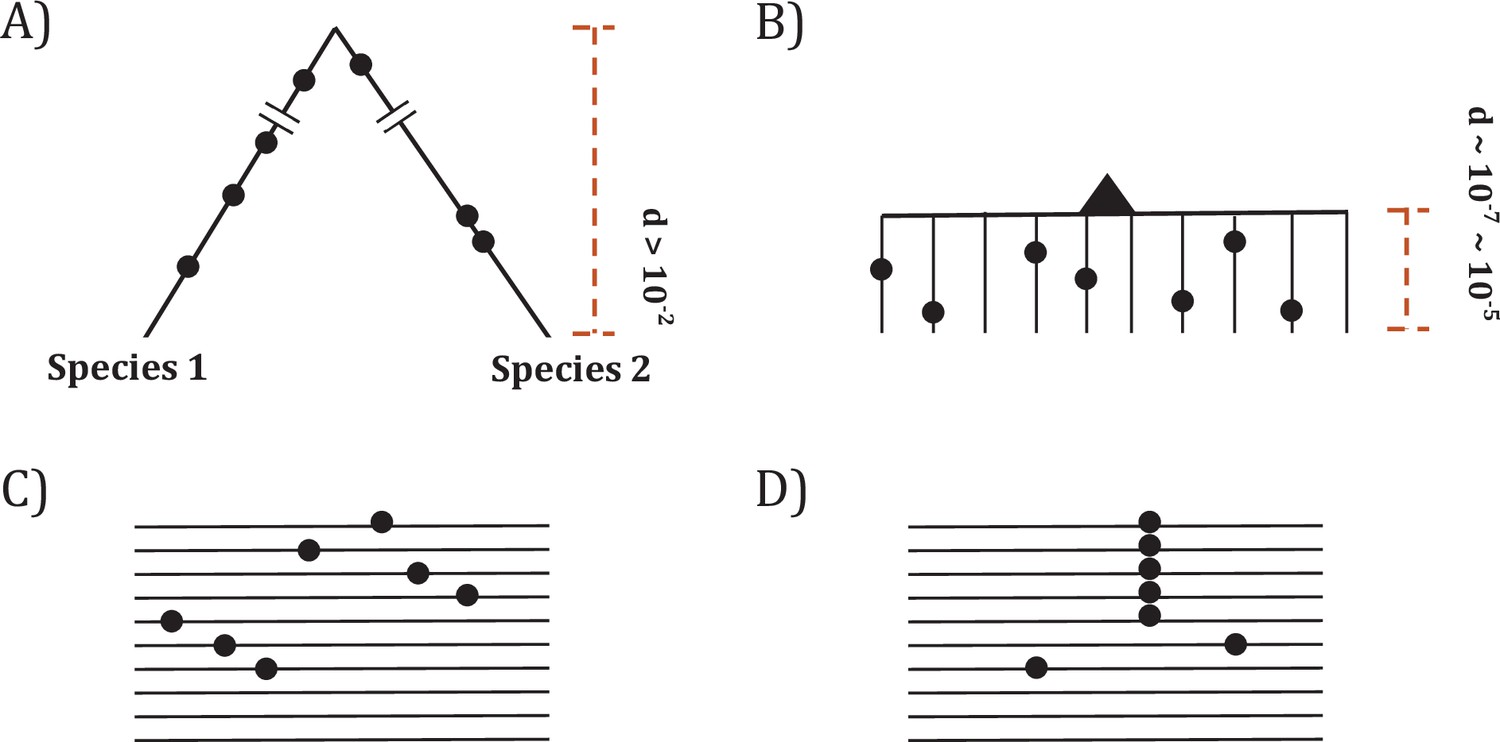
Two modes of DNA sequence evolution.
(A) A hypothetical example of DNA sequences in organismal evolution. (B) Cancer evolution that experiences the same number of mutations as in (A) but with many short branches. (C) A common pattern of sequence variation in cancer evolution. (D) In cancer evolution, the same mutation at the same site may occasionally be seen in multiple sequences. The recurrent sites could be either mutational or functional hotspots, their distinction being the main objective of this study.
Figure 2 with 1 supplement
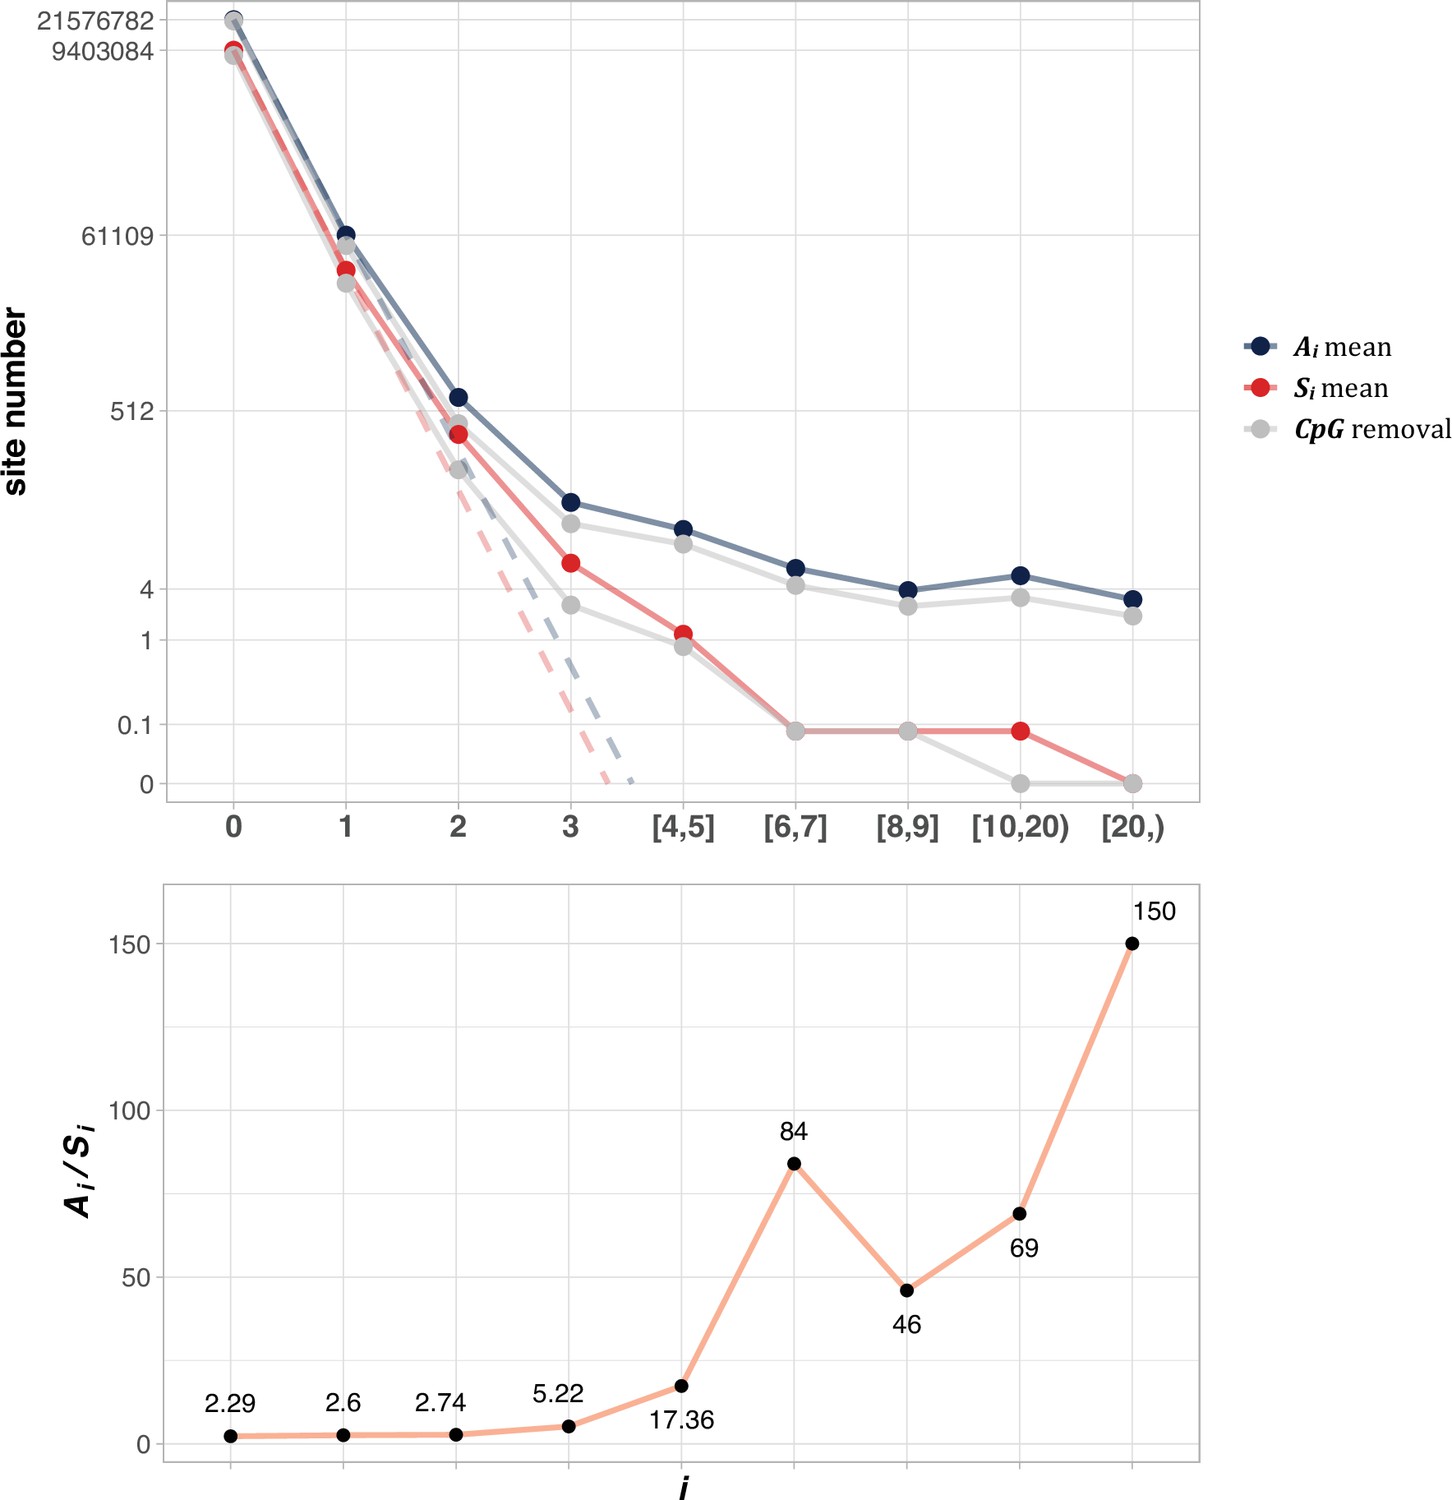
The average Ai and Si values across different i ranges (X-axis).
(Top): The average of Ai and Si in the log scale. Color lines - full data; gray lines - CpG sites removed. The dash lines are linear extrapolations. Bottom: The Ai / Si ratio as a function of i. The drop of Ai / Si ratio at i [8, 9] is due to the potential synonymous CDNs, see Supplementary file 1.
Figure 2—figure supplement 1
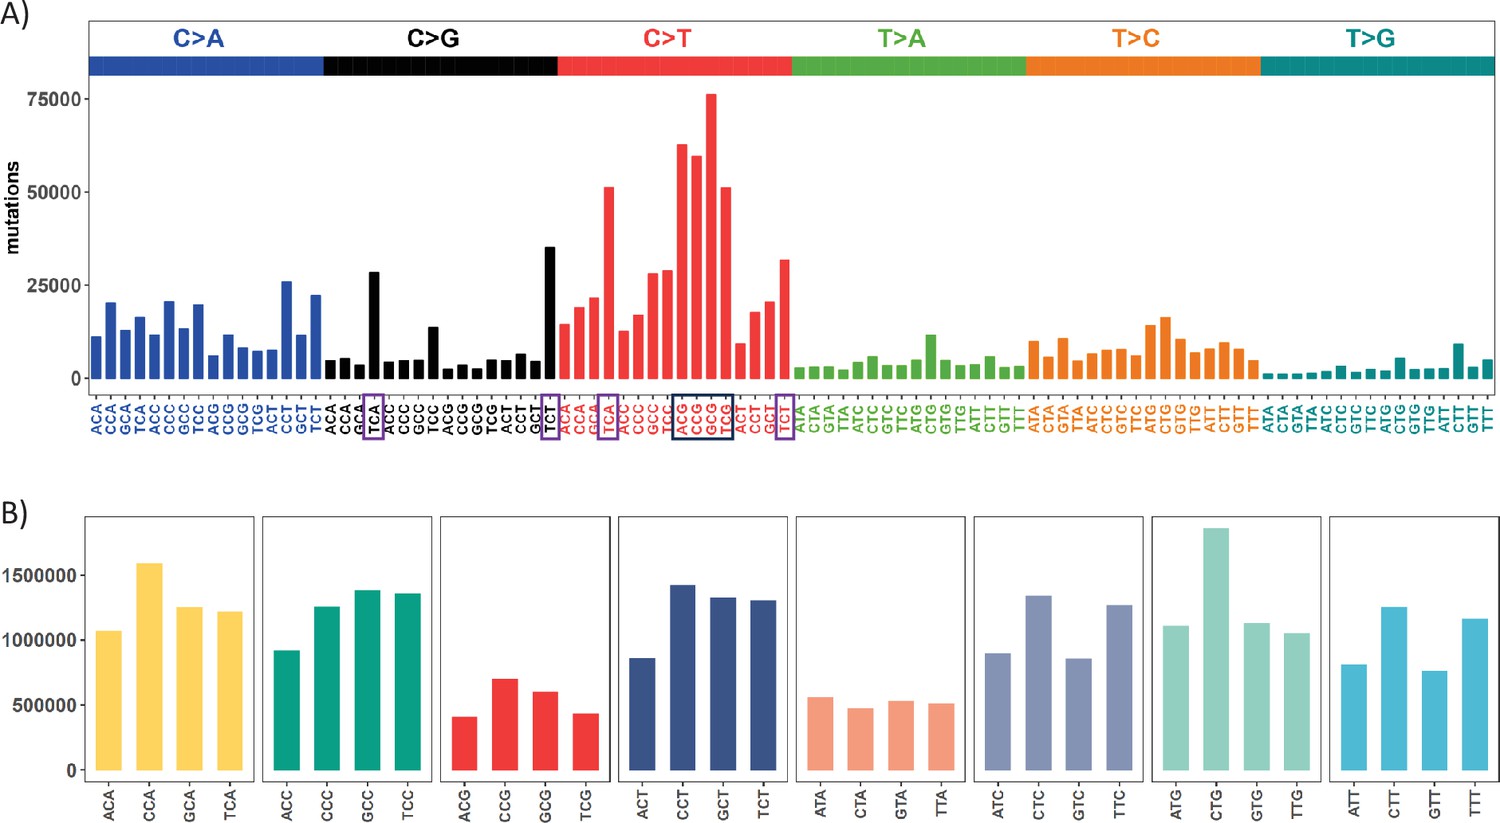
Mutation and context landscape across 12 cancer types.
(A) Single nucleotide changes within a local context of 3 bp across 12 cancer types. Mutations are grouped into 6 nucleotide change directions based on base complementarity, with colors representing each type. The Y-axis indicates the total number of each change type across the 12 cancers. The black box highlights the most abundant C>T (complementary G>A) changes occurring at CpG sites, while purple boxes designate the second-most prevalent nucleotide change at TCW (W = A or T) context which is potentially associated with APOBEC family of cytidine deaminases. (B) Context abundance within the human reference genome. For each coding region site, we extract the local context by extending 1 bp to either side. Contexts are then collapsed into 32 categories with centered base being C or T based on base complementarity. The Y-axis shows the site count for each context along the X axis. The four red bars (ACG, CCG, GCG, TCG) highlight the abundance of CpG sites in the human genome.
Figure 3
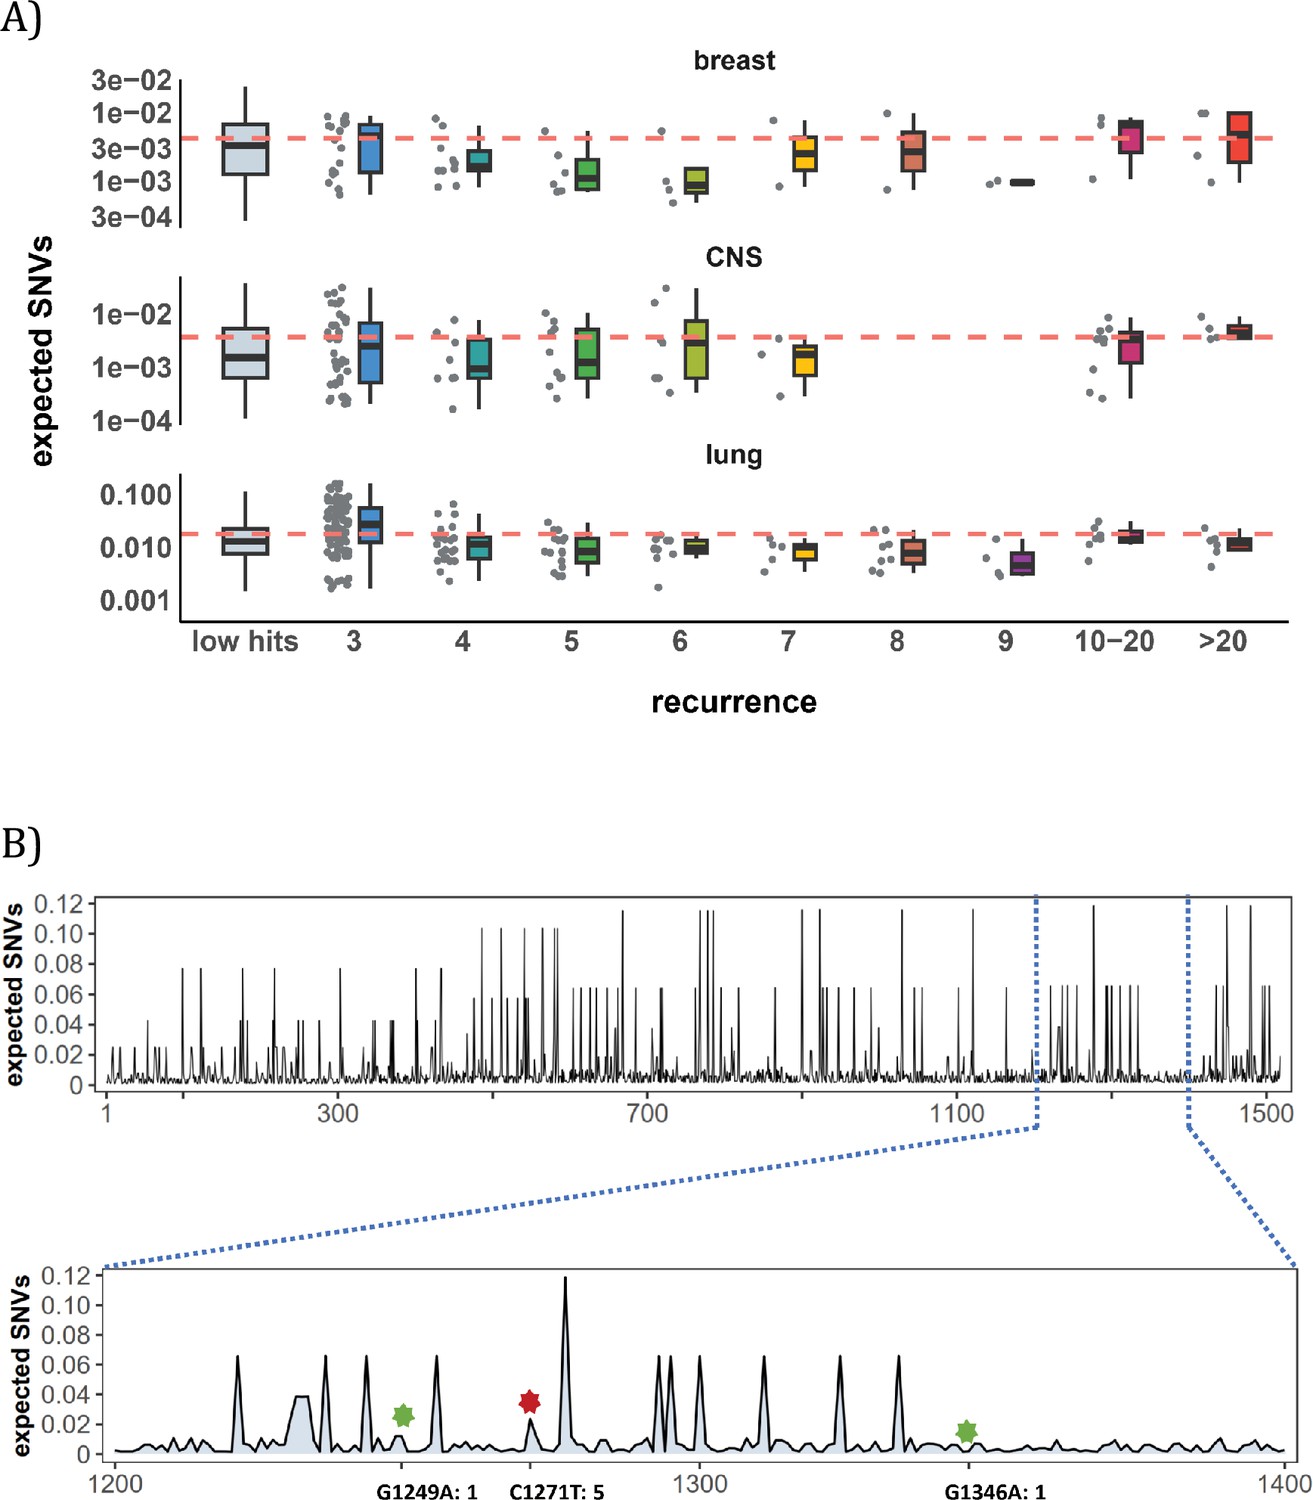
Site-level mutation rate variation obtained from Dig Sherman et al., 2022, a published AI tool.
(A) Each dot represents the expected SNVs (Y-axis) at a site where missense mutations occurred i times in the corresponding cancer population. The boxplot shows the overall distribution of mutability at i, with the red dashed line denoting the average. There is no observable trend that sites of higher i are more mutable (The blank areas are due to the absence of CDNs with mutation recurrence counts of 8 or 9 in CNS cancer mutation data, see Supplementary file 1). (B) A detailed look at the coding region of PAX3 gene in colon cancer. The expected mutability of sites in the 200 bp window is plotted. The three mutated sites in this window, marked by green and red (a CDN site) stars, are not particularly mutable. Overall, the mutation rate varies by about tenfold as is generally known for CpG sites.
Figure 4 with 1 supplement
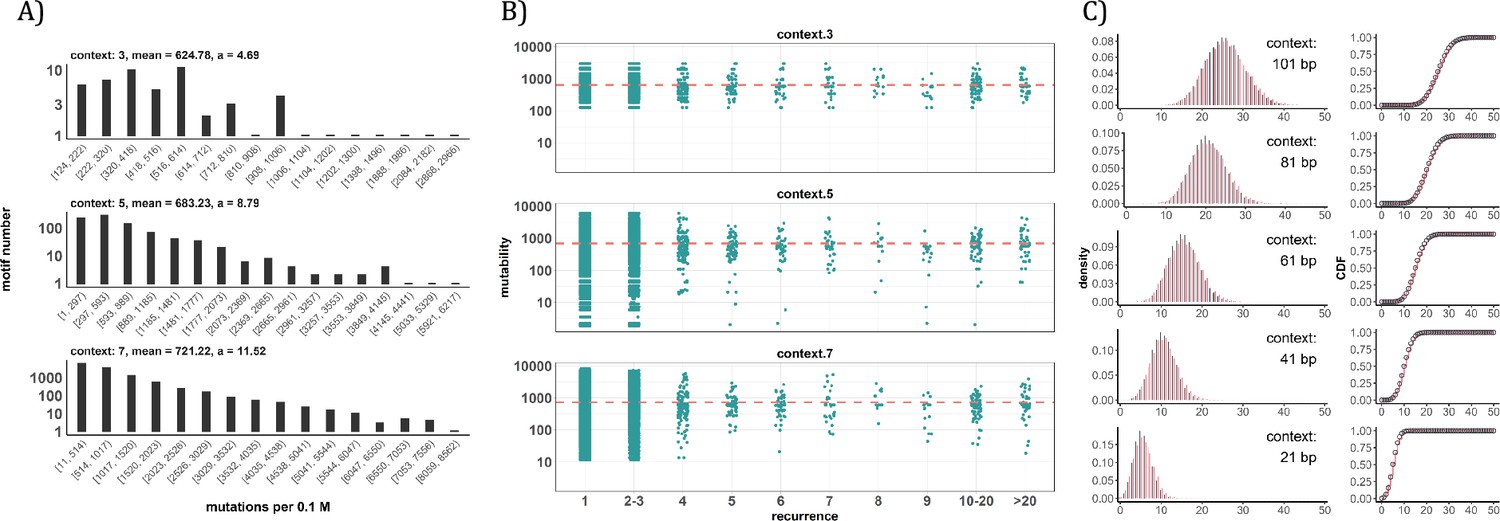
Conventional analyses of local contexts at recurrence sites.
(A) From top panel down - For the 64 (43) 3-mer motifs, their mutational rates are shown on the X-axis. The most mutable motif over the average mutability (α) is 4.69. For the 1024 (=45) 5-mer and 16,384 (47) 7-mer motifs, the α values are, respectively, 8.79 and 11.52. The most mutable motifs, as expected, are dominated by CpG’s. (B) Each dot represents the motif surrounding a high-recurrence site. The recurrence number is shown on the X-axis and the mutability of the associated motif’s mutability (mutations per 0.1 M) is shown on the Y-axis. The average mutation rate across all motifs of given length category is indicated by a red horizontal dashed line. The absence of a trend indicates that the high recurrence sites are not associated with the mutability of the motif. (C) The analysis is extended to longer motifs surrounding each CDN (21, 41, 61, 81, and 101 bp). For each length group, all pairwise comparisons are enumerated. The observed distributions (black bars and points) are compared to the expected Poisson distributions (red bars and curves) and no difference is observed. Thus, local sequences of CDNs do not show higher-than-expected similarity.
Figure 4—figure supplement 1
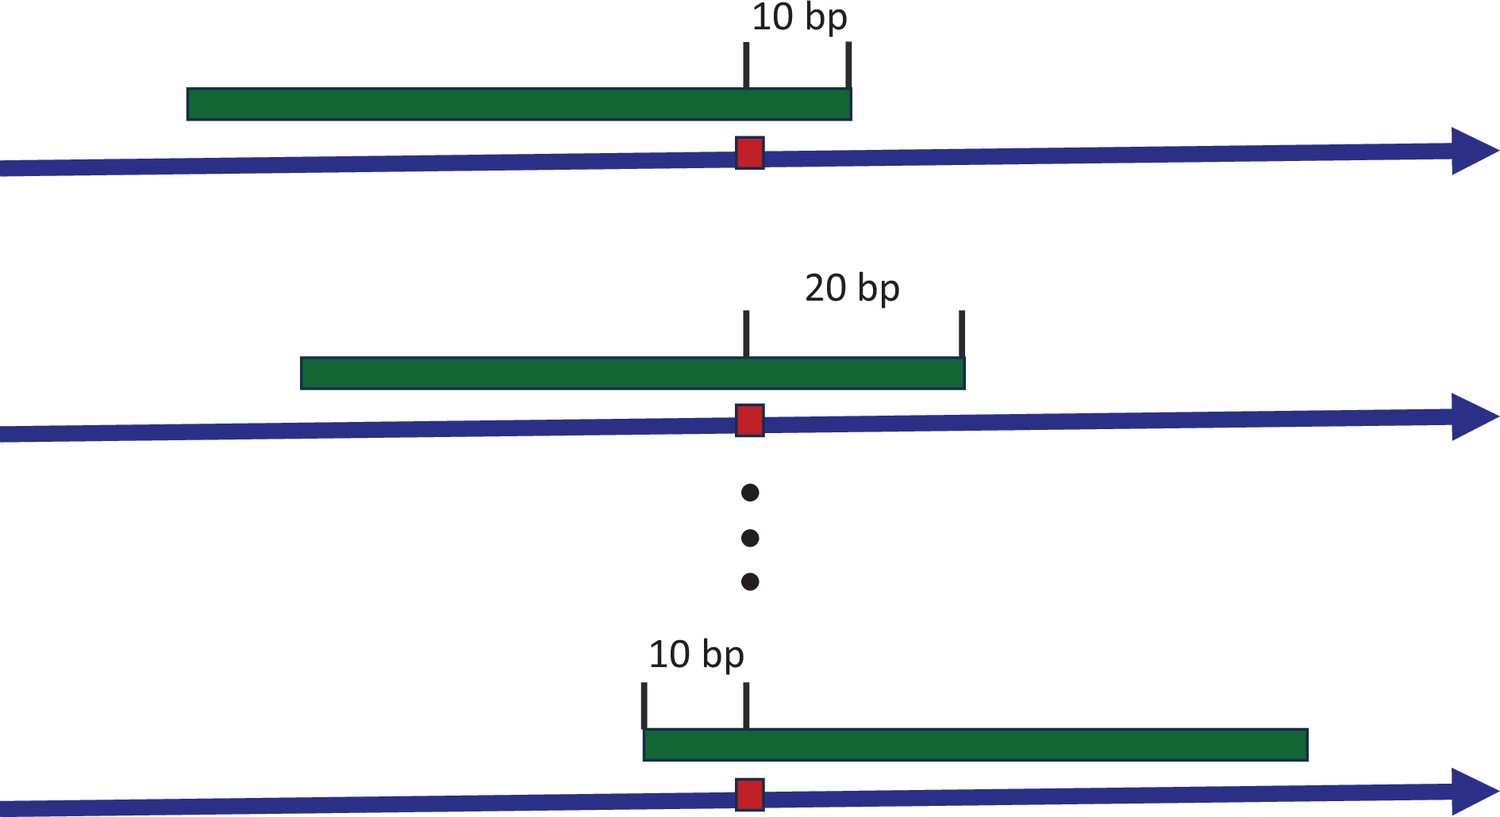
Sliding window to explore the consensus sequences between recurrence sites.
The blue arrow indicates the positive strand of reference genome, with a mutated site highlighted by the red box. The green strip represents a sliding window covering the mutated site. With each stride of 10 bp, we extract the sequence context and conduct a pairwise comparison between all recurrence sites. The presence of consensus motifs would skew the Hamming distance distribution away from the expected Poisson model, reflecting non-randomness.
Figure 5
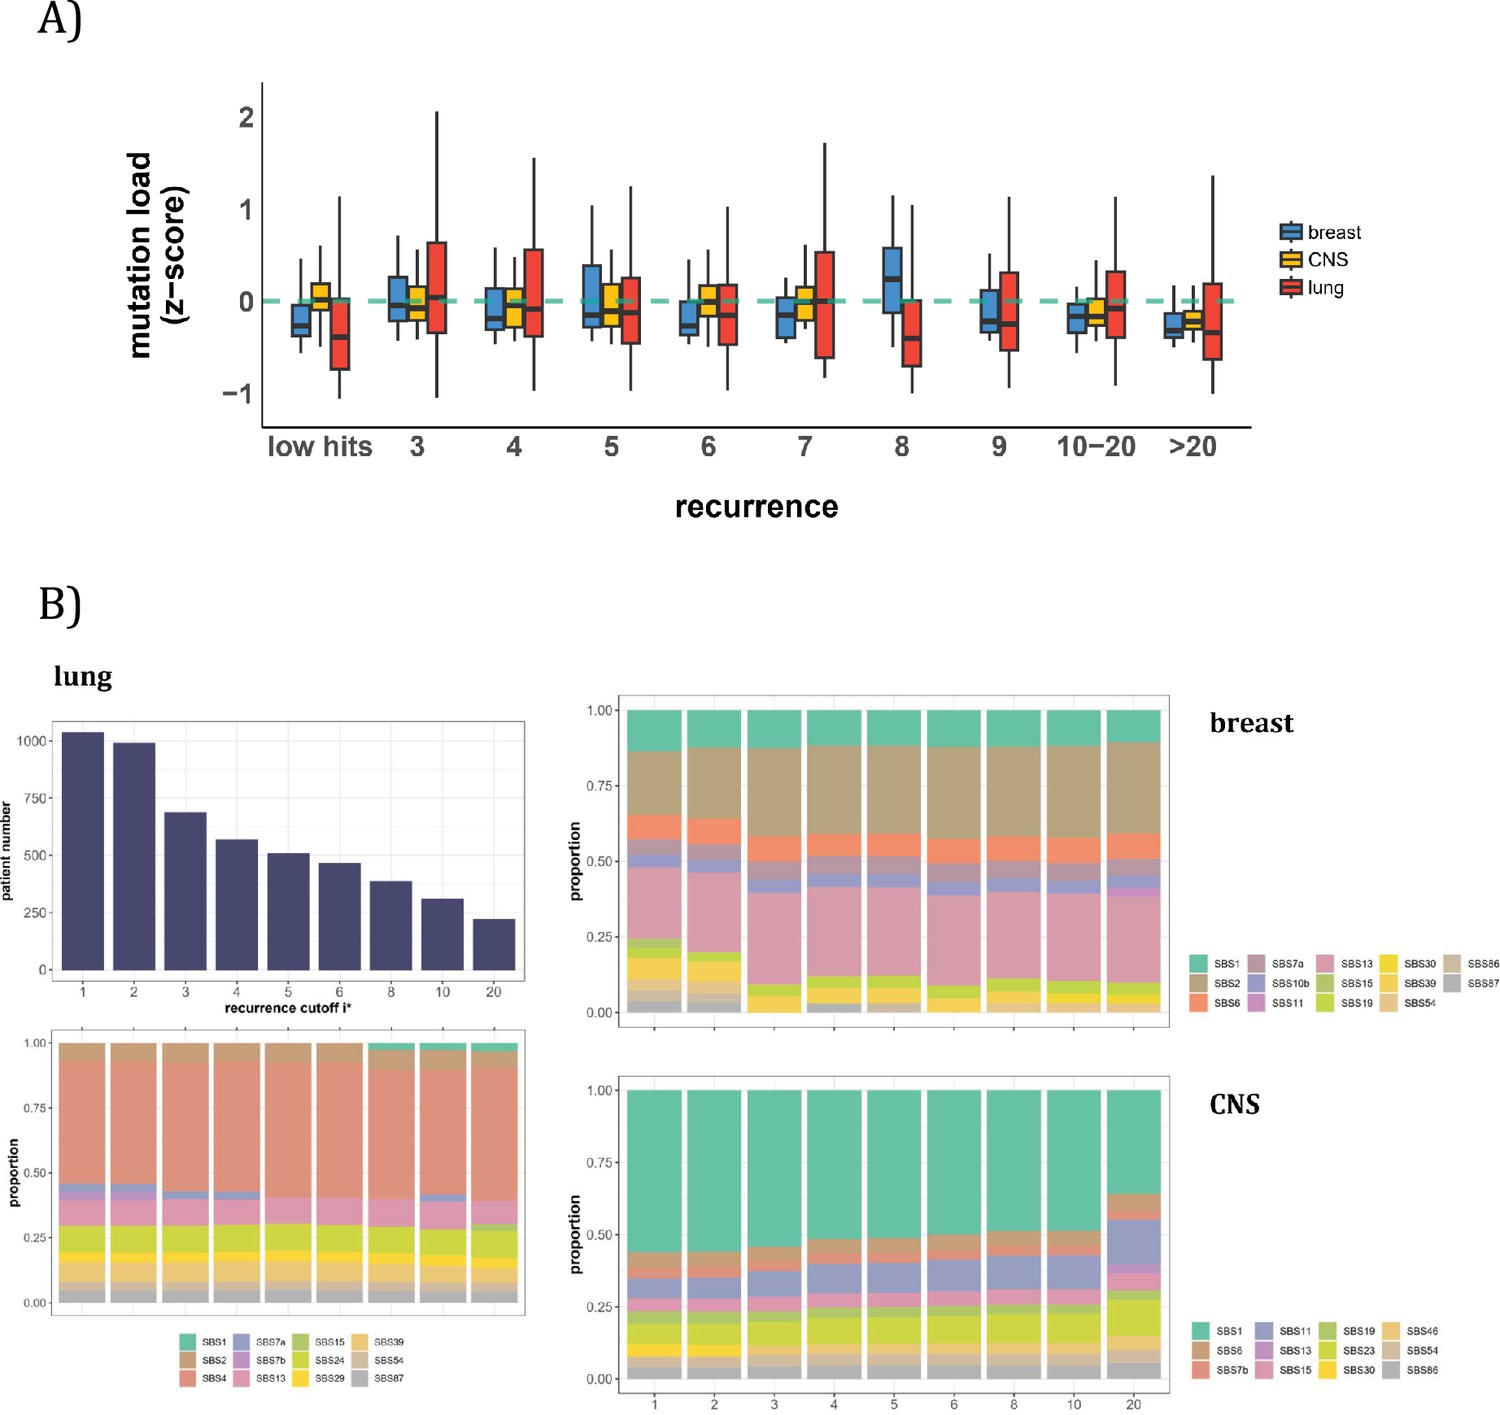
Patient level analysis for mutation load and mutational signatures.
(A) Boxplot depicting the distribution of mutation load among patients with recurrent mutations. The X-axis denotes the count of recurrent mutations, while the Y-axis depicts the normalized z-score of mutation load (see Methods). The green dashed line indicates the mean mutation load. In short, the mutation load does not influence the mutation recurrence among patients. (B) Signature analysis in patients with mutations of recurrences ≥i* (X-axis). For lung cancer (left), the upper panel presents the number of patients for each group, while the lower panel depicts the relative contribution of mutational signatures. For breast cancer, APOBEC-related signatures (SBS2 and SBS13) are notably elevated in all groups of patients with i*≥3, while patients with mutations of recurrence ≥ 20 in CNS cancer exhibit an increased exposure to SBS11 (Blough et al., 2011; Lin et al., 2021; Noeuveglise et al., 2023). Again, patients with higher mutation recurrences do not differ in their mutation signatures.
Figure 6
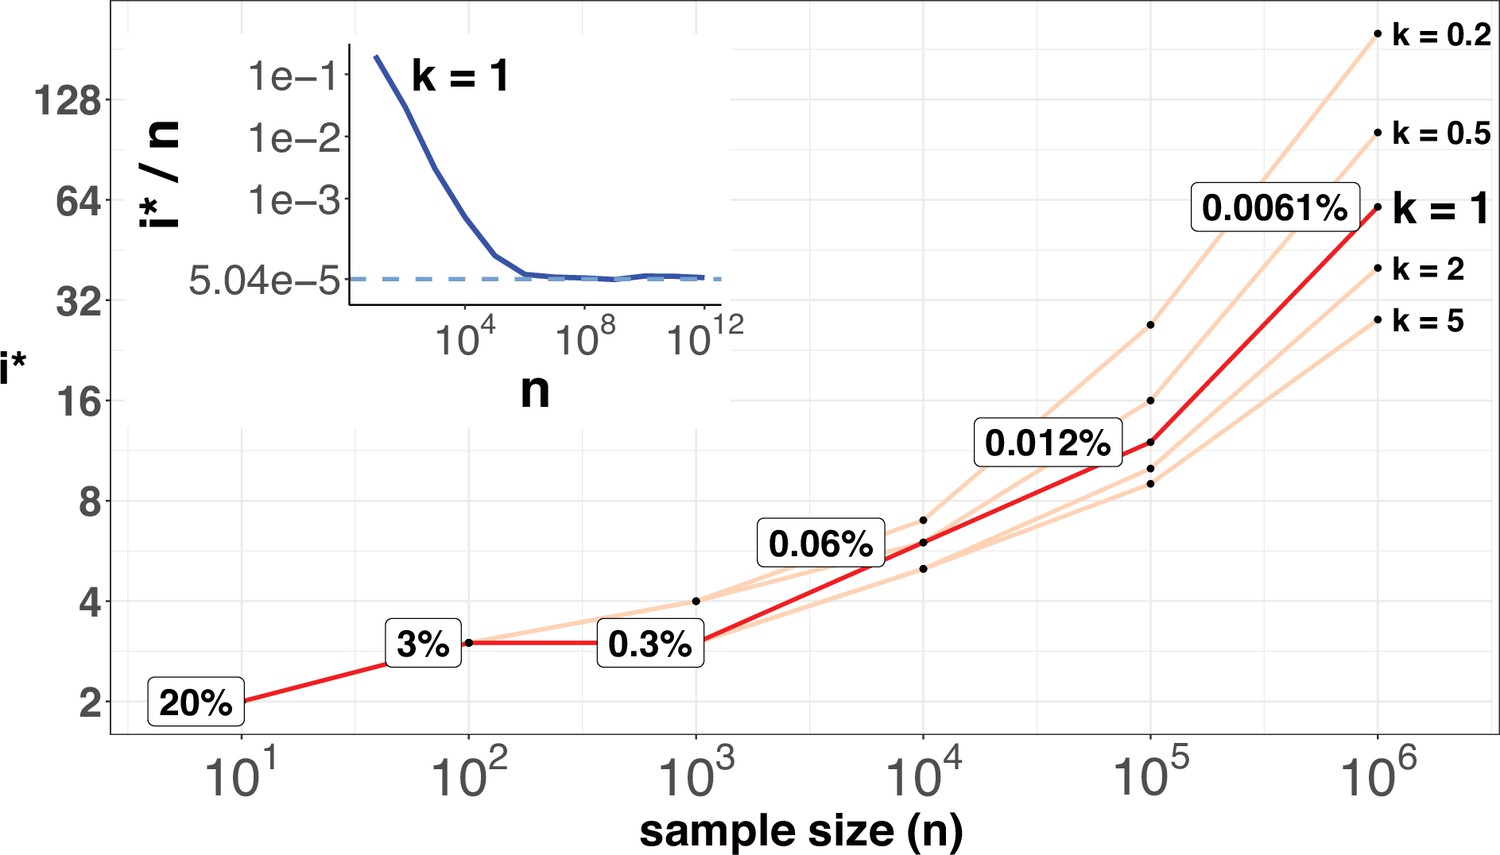
i* values (Y-axis, log scale) against sample sizes (n), X-axis across different shape parameter k’s.
The Y axis presents the i* values under different sample sizes (n) of the X-axis in log scale. Five shape parameters (k) of the gamma-Poisson model are used. In the literatures on the evolution of mutation rate, k is usually greater than 1. The inset figure illustrates how i*/ n (prevalence) would decrease with increasing sample sizes. The prevalence would approach the asymptotic line of [] when n reaches 106. In short, more CDNs (those with lower prevalence) will be discovered as n increases. Beyond n=106, there will be no gain.
Figure 7
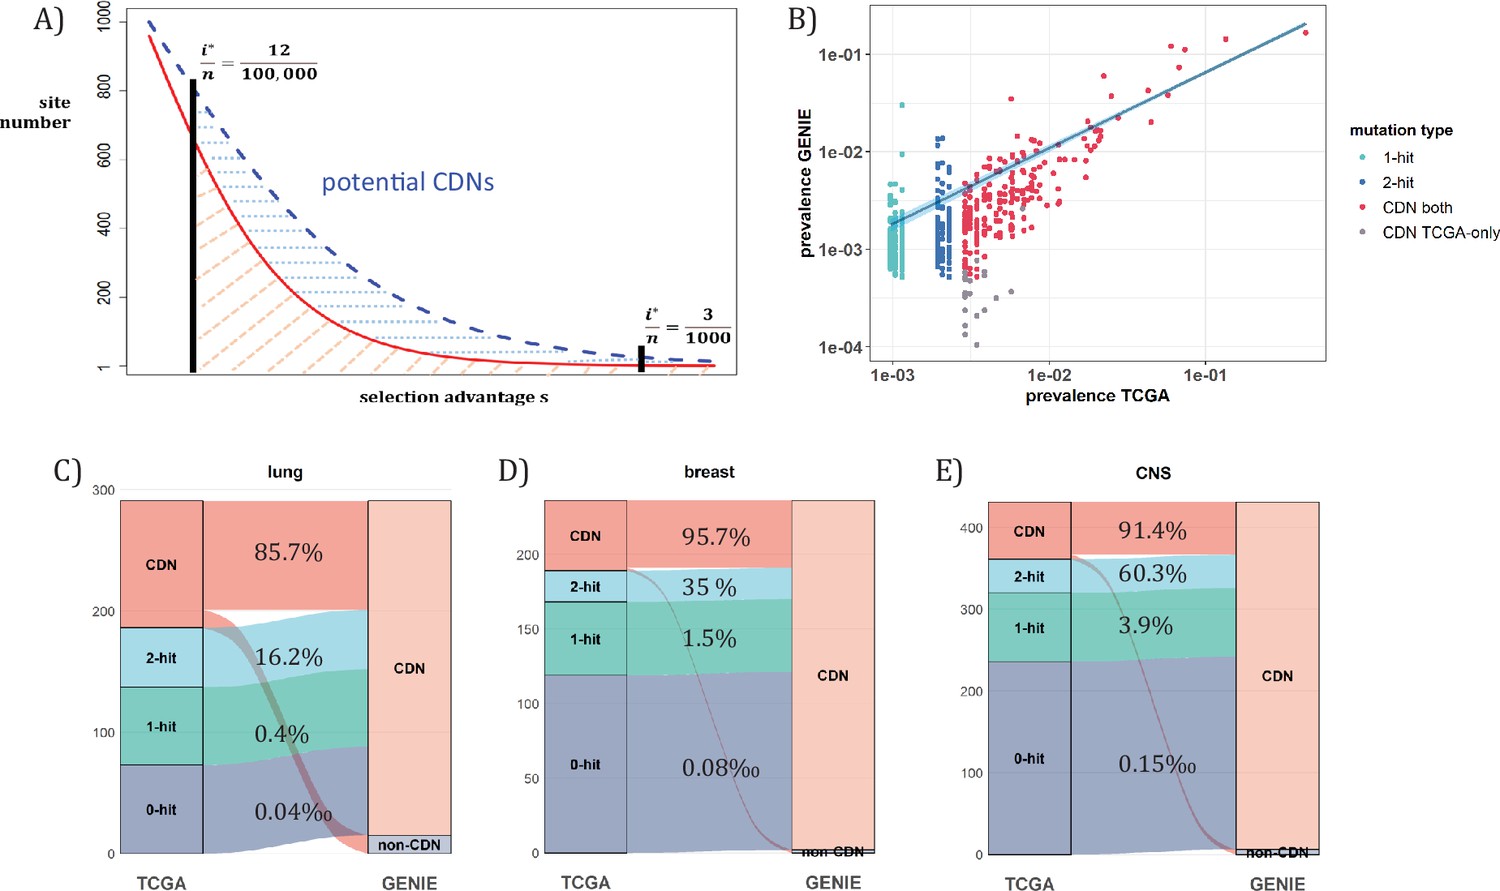
Analysis of CDNs with expanded sample set in GENIE.
(A) Schematic illustrating the impact of sample size expansion on the number of discovered CDNs. The two vertical lines show the cutoffs of i*/n at (3/1000) vs. (12/100,000). The Y axis shows that the potential number of sites would decrease with i*/n, which is a function of selective advantage. The area between the two cutoffs below the line represents the new CDNs to be discovered when n reaches 100,000. The power of n=100,000 is even larger if the distribution follows the blue dashed line. (B) The prevalence (i/n) of sites is well correlated between datasets of different n (TCGA with n<1000 and GENIE with generally tenfold higher), as it should be. Sites are displayed by color. ‘1-hit’: CDNs identified in GENIE but remain in singleton in TCGA, ‘2-hit’: CDNs identified in GENIE but present in doubleton in TCGA. ‘CDN both’: CDNs identified in both databases. (C–E) CDNs discovered in GENIE (n>9000) but absent in TCGA (n<1000). The newly discovered CDNs may fall in TCGA as 0–2 hit sites. The numbers in the middle column show the percentage of lower recurrence (non-CDN) sites in TCGA that are detected as CDNs in the GENIE database, which has much larger n’s.
Appendix 1—figure 1
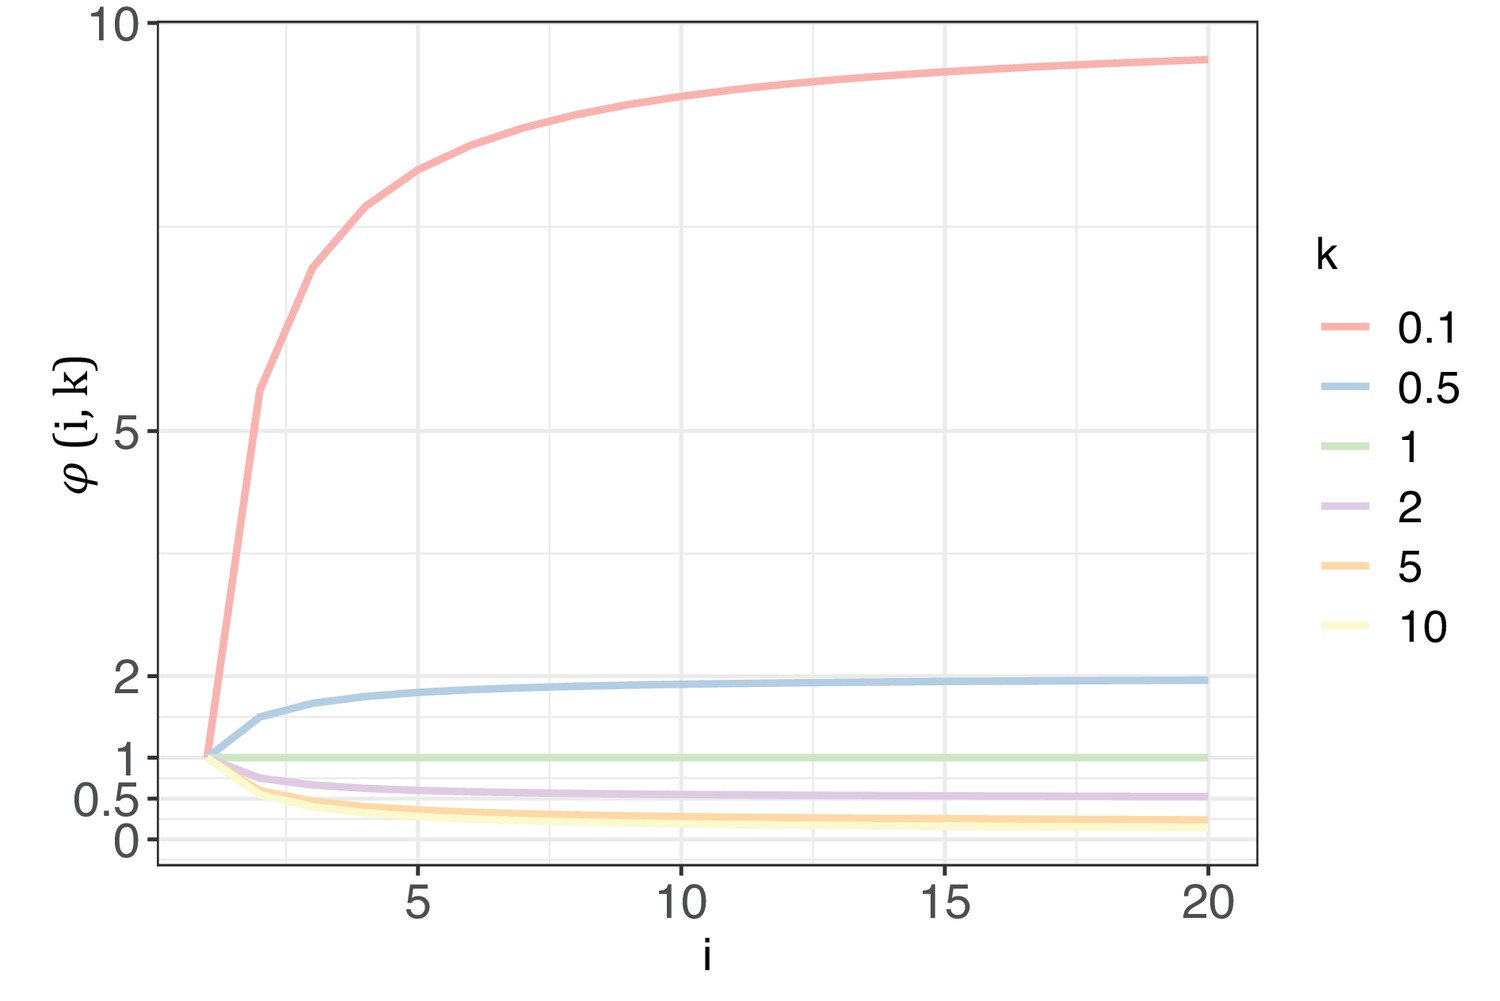
The trend of with each increase of recurrence (i, the x-axis) under different shape parameters of the gamma distribution (k, designated by different colors).
Appendix 1—figure 2
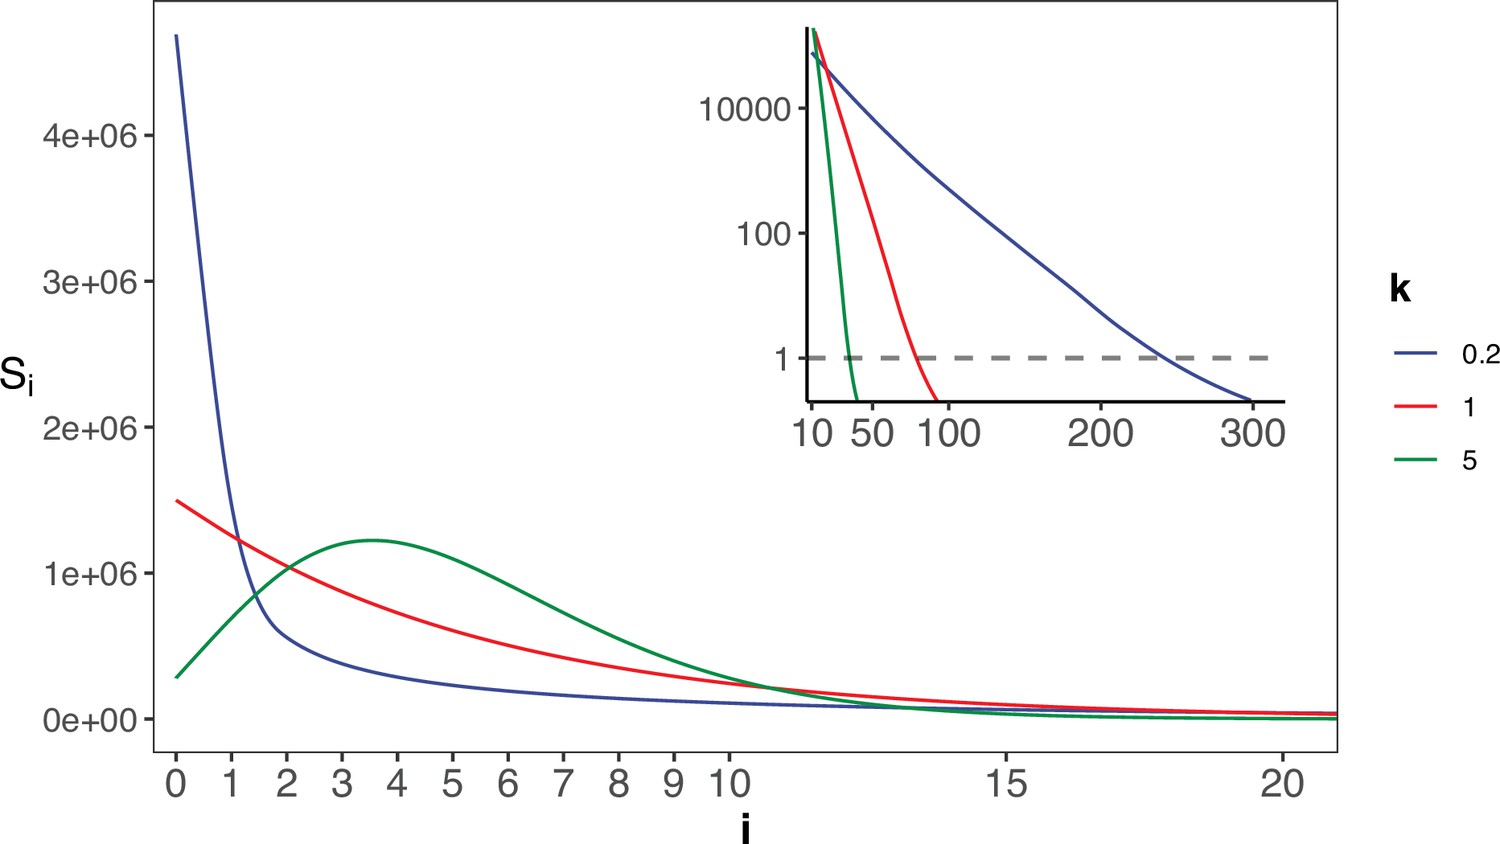
The gamma distribution of recurrences (i) under different shapes.
With E(u)=5 × 10⁻⁶, we set the shape parameter k to 0.2, 1 and 5, represented by three distinct colors. The site number of synonymous recurrence i (Si) is indicated on Y-axis. In the context of a large sample size (n=106), the Si distribution clearly distinguishes between different k values, mitigating the overdispersion issue encountered in smaller sample sizes. The inset depicts the distribution on a log10 scale for i≥10, with a horizontal dashed line indicating Si=1, where i* is the CDN cutoff.
Author response image 1

5-prime.
Author response image 2

3-prime.
Author response image 3

5-prime shuffled.
Author response image 4
3-prime shuffled.
Author response image 5
random sequences from coding regions.
Tables
Table 1
An example of Ai and Si (from lung cancer, n=1035).
| All sites | CpG sites removed | |||||
|---|---|---|---|---|---|---|
| i | Ai | Si | Ai / Si | Ai | Si | Ai / Si |
| 0 | 22540623 | 7804281 | 2.89 | 21375384 | 7014012 | 3.04 |
| 1 | 195958 | 69393 | 2.82 | 168371 | 56821 | 2.96 |
| 2 | 2946 | 969 | 3.04 | 2188 | 643 | 3.4 |
| 3 | 99 | 21 | 4.71 | 68 | 16 | 4.25 |
| 4 | 23 | 1 | 23 | 17 | 1 | 17 |
| 5 | 16 | 0 | 16 : 0 | 9 | 0 | 9 : 0 |
| 6 | 10 | 0 | 10 : 0 | 6 | 0 | 6 : 0 |
| 7 | 5 | 0 | 5 : 0 | 5 | 0 | 5 : 0 |
| 8 | 8 | 0 | 8 : 0 | 6 | 0 | 6 : 0 |
| 9 | 4 | 0 | 4 : 0 | 3 | 0 | 3 : 0 |
| ≥3 | 178 | 22 | 8.09 | 122 | 17 | 7.18 |
| ≥4 | 79 | 1 | 79 | 54 | 1 | 54 |
| [10-20] | 7 | 1 | 7 | 4 | 0 | 4 : 0 |
| ≥20 | 6 | 0 | 6 : 0 | 4 | 0 | 4 : 0 |
-
Note –The ratio of Ai/ Si is provided as a measure of selection strength.
Table 2
Summary for modeling outlier sites in six cancer types.
| Cancer Type | S3 | p | α | S4 | S5 |
|---|---|---|---|---|---|
| Lung* | -- | 0.0 | -- | -- | -- |
| Breast | 0.12 | 8.75E-04 (8.21E-04) | 88.6 (32.0) | 0.102 (0.068) | 0.004 (0.004) |
| CNS | 0.02 | 2.73E-04 (1.09E-04) | 295.1 (57.0) | 0.448 (0.173) | 0.026 (0.015) |
| Kidney | 0.03 | 3.03E-05 (2.98E-05) | 304.1 (108.0) | 0.067 (0.056) | 0.005 (0.006) |
| Upper-AD tract | 0.47 | 0.002 (0.001) | 48.9 (10.7) | 0.174 (0.078) | 0.005 (0.003) |
| Large intestine | 1.03 | 0.009 (0.001) | 51.6 (1.4) | 0.998 (0.087) | 0.026 (0.003) |
-
Note – For each cancer type, p stands for the proportion of highly mutable sites, with mutation rate being α-fold of the average. S3 gives the expected number without mutable outliers (P=0). S4 and S5 denote the expected number with the best (p, α) pairs with the standard deviation in parentheses. For lung cancer, S2 and S3 do not fit the outlier model (Table 2—source data 1); therefore, we set P=0.
-
Table 2—source data 1
The outlier model parameters and expected Si values for 6 cancer types analyzed.
‘pMinor’ and ‘alpha’ correspond to (‘p, a’) as described in the main text. ‘Eu’ represents the average mutation rate per site per patient for the given cancer type (‘ccType’). ‘s2Expt’ ‘s3Expt’ ‘4’ ‘s5’ and ‘s6’ are the expected Si values for i = 2, 3, 4, 5, 6, respectively. ‘s2Obsv’ and ‘s3Obsv’ represent the observed Si values for S2 and S3.
- https://cdn.elifesciences.org/articles/99340/elife-99340-table2-data1-v1.zip
Appendix 1—table 1
literature support for CDN genes in breast cancer.
| Gene Id | Gene Name | Support |
|---|---|---|
| AKT1 | v-akt murine thymoma viral oncogene homolog 1 | ① ② ③ |
| CDC42BPA | CDC42 binding protein kinase alpha (DMPK-like) | Unbekandt and Olson, 2014; Collins et al., 2018; Kwa et al., 2021; Jiang et al., 2023 |
| CDH1 | cadherin 1, type 1, E-cadherin (epithelial) | ① ② ③ |
| ERBB2 | v-erb-b2 avian erythroblastic leukemia viral oncogene homolog 2 | ① ② ③ |
| ERBB3 | v-erb-b2 avian erythroblastic leukemia viral oncogene homolog 3 | Holbro et al., 2003; Xue et al., 2006; Hamburger, 2008; Sithanandam and Anderson, 2008; Stern, 2008; Huang et al., 2010 |
| FGFR2 | fibroblast growth factor receptor 2 | ① ② ③ |
| FOXA1 | forkhead box A1 | ① ② ③ |
| GATA3 | GATA binding protein 3 | ① ② ③ |
| HIST1H3B | histone cluster 1, H3b | ① ② ③ Xie et al., 2019; Wang et al., 2023* |
| KIF1B | kinesin family member 1B | Munirajan et al., 2008; Yu and Feng, 2010; Liu et al., 2022 |
| KRAS | Kirsten rat sarcoma viral oncogene homolog | ① ② ③ |
| NUP93 | nucleoporin 93 kDa | Bersini et al., 2020; Nataraj et al., 2022 |
| PIK3CA | phosphatidylinositol-4,5-bisphosphate 3-kinase, catalytic subunit alpha | ① ② ③ |
| PTEN | phosphatase and tensin homolog | ① ② ③ |
| RARS2 | arginyl-tRNA synthetase 2, mitochondrial | Wang et al., 2020* |
| SF3B1 | splicing factor 3b, subunit 1, 155 kDa | ① ② ③ |
| TP53 | tumor protein p53 | ① ② ③ |
-
The serial number corresponds to the inclusion of target gene in the following driver gene list: ① CGC Tier-1 list, ② IntOGen, ③ Bailey’s list.
-
The inclusion necessitates that the target gene is annotated as a cancer driver in breast cancer.
-
*
ambiguous, meaning the literature indicates an association between the candidate gene and breast cancer, but lacks explicit experimental evidence.
Appendix 1—table 2
k estimated from 12 cancer types.
| Cancer type | k |
|---|---|
| Breast | 5.05 |
| CNS | 2.59 |
| Endometrium | 5.49 |
| Kidney | 7.70 |
| Large intestine | 4.76 |
| Liver | 5.23 |
| Lung | 2.62 |
| Ovary | 4.30 |
| Prostate | 3.60 |
| Stomach | 4.17 |
| Upper-AD tract | 4.14 |
| Urinary tract | 6.14 |
| merged set* | 3.27 |
-
Note:- Estimation of k is derived from negative binomial regression, based on synonymous changes aggregated by the 3 bp local context at mutated sites across all coding genes. The estimation method is implemented in package dndscv.
-
*
The merged set contains mutation information from all 12 cancer types.
Author response table 1
| TRAIN accuracy | TEST accuracy | |||||||||
|---|---|---|---|---|---|---|---|---|---|---|
| Random | random | |||||||||
| Model | # layers | # parameters | ALL | donner | acceptor | CDS | ALL | donner | acceptor | CDS |
| resNet1 | 46 | 3,721 | 0.77 | 0.77 | 0.76 | 0.79 | 0.71 | 0.72 | 0.69 | 0.72 |
| resNet2 | 165 | 64,445 | 0.96 | 0.96 | 0.95 | 0.95 | 0.76 | 0.77 | 0.77 | 0.73 |
| deepGRU | 23 | 144,925 | 0.86 | 0.85 | 0.84 | 0.89 | 0.79 | 0.79 | 0.76 | 0.8 |
| deepLSTM | 6 | 24,445 | 0.85 | 0.82 | 0.87 | 0.86 | 0.79 | 0.76 | 0.82 | 0.78 |
Additional files
-
Supplementary file 1
All CDN sites with population allele frequency annotation.
‘CDN_sites.i ≥ 20’ presents CDN sites with total hits ≥20 in each cancer type. ‘CDN.Missense.thres_3’ provides all CDN sites analyzed in this study, ranked in decreasing order based on the highest recurrence across 12 cancer types. ‘CDN.Missense.gnomAD’ presents the gnomAD population allele frequency of all missense CDNs. ‘Synonymous_high_hits’ lists the synonymous mutations potentially under selection, while ‘Synonymous_high_hits.gnomAD’ provides their corresponding allele frequency annotations from gnomAD.
- https://cdn.elifesciences.org/articles/99340/elife-99340-supp1-v1.xlsx
-
MDAR checklist
- https://cdn.elifesciences.org/articles/99340/elife-99340-mdarchecklist1-v1.pdf
Download links
A two-part list of links to download the article, or parts of the article, in various formats.
Downloads (link to download the article as PDF)
Open citations (links to open the citations from this article in various online reference manager services)
Cite this article (links to download the citations from this article in formats compatible with various reference manager tools)
The theory of massively repeated evolution and full identifications of cancer-driving nucleotides (CDNs)
eLife 13:RP99340.
https://doi.org/10.7554/eLife.99340.3


